Embed Size (px)
Citation preview

Wastewater recycle and reuse: an economical and sustainable option
Joseph Ravikumar, Rajiv Raman, and Shubhra Jain
Water and Sanitation Program
March 2014

Tracking Fecal Waste Flows
100%88%
WC to
sewer
On-site
facility
Open
defecation
Unsafely
emptied
Leakage
Effectively
treated
13%
49%
26%
12%
TreatmentReuse/
disposalTransportCollectionAccess
Source: Census 2011

Wastewater generation
WASTEWATER GENERATION AND TREATMENT IN CLASS I AND II TOWNS
Sl. No. City Classification
Sewage
generation
(MLD)
Sewage treated
(MLD)
Untreated Sewage
(MLD)
Class I towns
1- More than 1
million
2 - 0.50 to 10 million
3 - 0.20 to 0.5 million
4 - 0.10 to 0.20 million
Class II towns
5 - 0.05 to 0.10 million
Total 38,254 11,787 26,467
Proportion of Total 31% 69%Source: Central Pollution Control Board, GoI, 2009; and WSP 2008

Water Utilities: Cities in search for water
Chennai: Veeranam - 235 kmand now desalination plants (200 MLD in operation).
Bangalore: Cauvery - 95 kmpumping 1000 m elevation.
Hyderabad: Krishna - 130 kmmulti stage pumping
Swap – treated wastewater use by industries and agriculture frees up water which could be used to meet city’s water demand
Chennai
Veeranam lake
Map of Tamil Nadu

Recycle and Reuse for Industries: A Balancing Act
Irrigation
Secondary Treatment
Restricted Urban Reuse
Tertiary Filtration
Industrial Non-Potable Reuse
Indirect Potable Reuse
Direct Potable or High Quality Process
Tertiary membrane Filtration
N&P Control
RO & Disinfection
Additional / assured source of water
Meet 80% of the industries water requirements
Stable cost v/s rising cost of fresh water

Recycle and Reuse for Agriculture: A valuable resource
Treated urban wastewater (~38,000 MLD), if channeled to meet irrigation requirements, would provide ~14 BCM of irrigation water
Potentially irrigate an area ranging between 1-3 million hectares.
Tenth Five Year Plan
Major and Medium
Surface water fed Minor irrigation
Potential created (Mha)
4.59 0.71
WWI potential (Percent)
44% ~300%
Nutrient Potential
• Nutrient potential in WW ranges from 0.63 – 0.73 tonnes/MLD
• Upto 40% reduction in nutrient load possible
• Reduced fertilizer requirement may reduce the Government fertilizer subsidy burden by ~ 100 crores annually
Energy savings
• Reduction in groundwater pumping, associated energy requirements
• Saving potential of ~ 600 Crores annually

Trends in Water Cost for Industries
0
5
10
15
20
25
30
35
40
45
1995 2000 2005 2010 2015
Co
st o
f w
ate
r(R
s/k
L)
Chennai
Delhi
Hyderabad
Bangalore
0
5
10
15
20
25
30
35
40
45
1995 2000 2005 2010 2015
Year
MBR + RO (Potable)
Tertiary treatment(All Non-potable scenario)
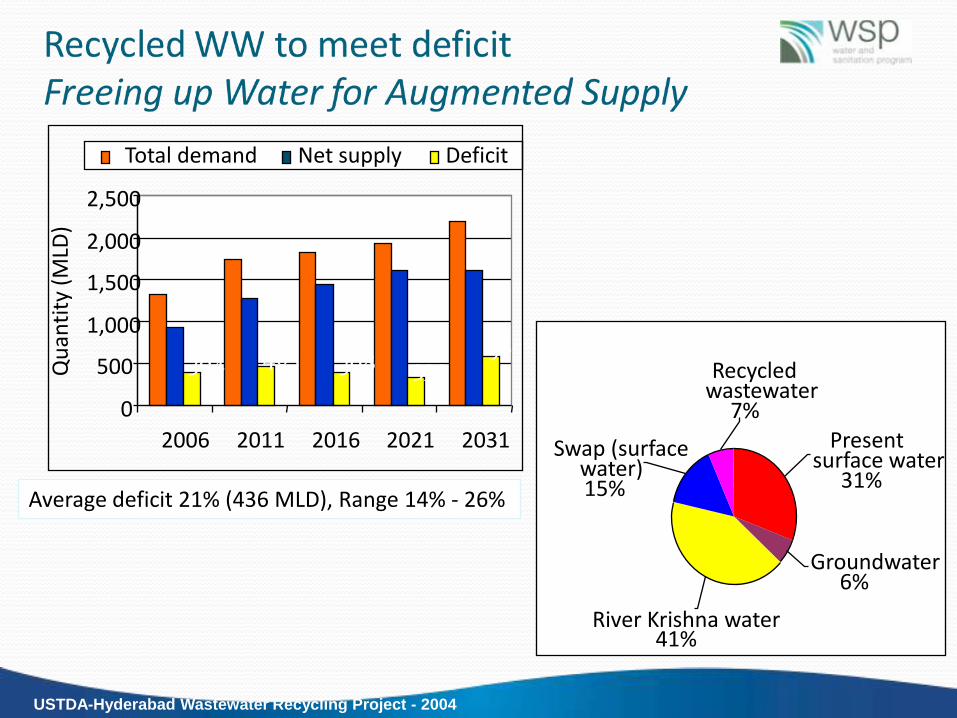
Average deficit 21% (436 MLD), Range 14% - 26%
394 465 398 330585
0
500
1,000
1,500
2,000
2,500
2006 2011 2016 2021 2031
Qu
anti
ty(M
LD)
Total demand Net supply Deficit
USTDA-Hyderabad Wastewater Recycling Project - 2004
Swap (surface water)15%
Recycled wastewater
7%Present
surface water31%
Groundwater6%
River Krishna water41%
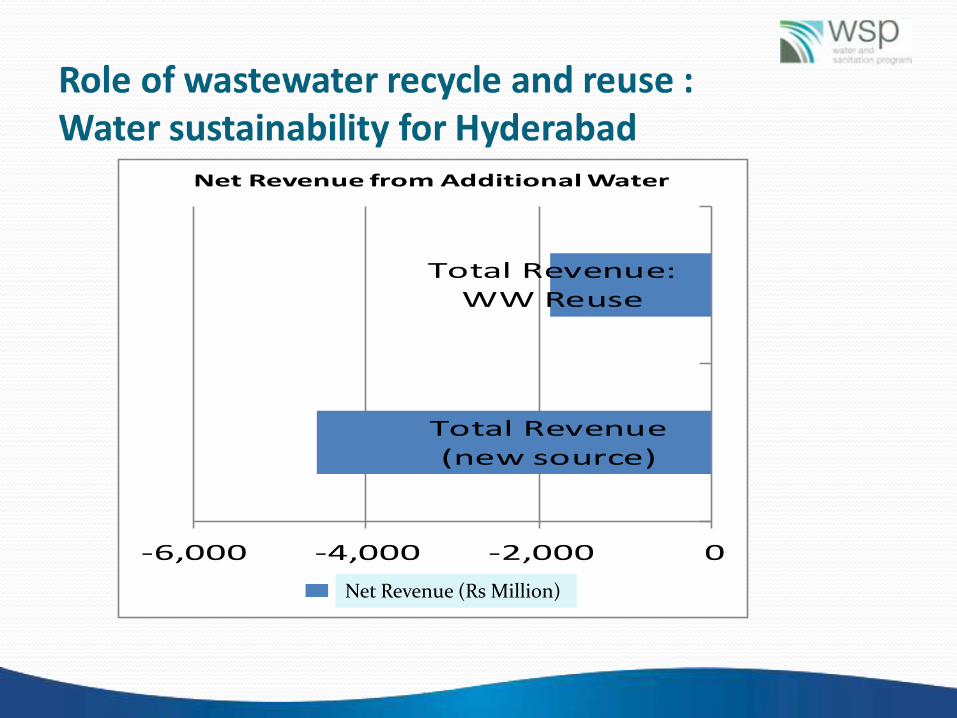
-6,000 -4,000 -2,000 0
Total Revenue(new source)
Total Revenue:WW Reuse
Net Revenue from Additional Water
Net RevenueNet Revenue (Rs Million)

Sustainability of STPs: Chennai Metropolitan Water Supply and Sewerage Board
•Sale of 36 MLD of treated sewage @ Rs 8.75/KL
•Annual Revenue - Rs. 100 Million
•Revenue from sale of treated wastewater - 120% of O&M needs

Treated wastewater price of Rs. 45/KL vs Rs. 60/KL for fresh water
Wastewater Recycle & Reuse in Industries

Recycle and Reuse ProjectsIndia
City Capacity (MLD) Status
Kohlapur 76 Operational
Delhi Jal Board 35 Operational
Chandigarh 45 Operational
Surat 40 Under implementation
Nagpur 110 Under implementation
Tuticorin 24 Under implementation
Vishakapatnam 63 Under implementation
Ahmedabad 60 Planned
International
Worldwide installed capacity – 40,000 MLD (Global water intelligence, 2010)
Brightwater, USA 250 Operational
Marrakech, Morocco 110 Operational
Singapore 92 Operational
Israel (80% of wastewater generated) 1000 Operational
Windhoek, Namibia 19 Operational

Limitations to Industrial Reuse While economically viable, industrial reuse is limited
by the availability of industrial clusters in the vicinity of the treatment plant
CPCB has identified 88 industrial cluster in 20 States in India. Industrial reuse in these areas may be viable.
Other areas need to explore alternate use of treated wastewater – Agricultural reuse for irrigation.

Wastewater Reuse Agriculture
Source: Silva and Scot 2002Minhas 2002
Naty Barak, World Bank, 2009
Potential to irrigate 1-3 Million Ha
40% reduction in fertilizer use
Nutrient potential of 0.63 – 0.73 tonnes/MLD
Reduction in GW required for irrigation, resulting in energy savings ~30% in WW irrigatedareas
Nutrients in wastewater
Nutrient mg/l
Nitrogen 32 - 36
Phosphorus 6.3 – 9.5
Potassium 10 - 13
ISRAEL’S EXPERIENCE
0%
20%
40%
60%
80%
100%
1995 2006 2020
% wastewater of the total water used for agriculture
Treated wastewater Fresh water
By 2020 60% of agricultural need met by treated wastewater, freeing water for other uses

Benefits of wastewater reuse for irrigation in select cities in India
City Crop cultivated Increase in
yield (%)
Decrease in
fertilizer
use
Increase in
pesticide
use
Avg. Annual
Incremental
benefit
(Rs./ha)
Indore Wheat (Rabi) /
Vegetables (Summer)
30-40% 50% Almost
double
36,752
Nagpur Wheat (Rabi) /
Vegetables (Summer)
30-40% 33% Almost
double
26,951
Jaipur Wheat (Rabi) /
Vegetables (Summer)
30-40% 50% Almost
double
37,790
Bangalore Rice (Rabi), Sapota,
Flowers (Summer)
30-40% 100% Almost
double
33,849
Ahmedabad Rice and wheat
(Rabi)
- - - -14,640
Delhi Okra 67% 60% Increased by
50%
8,500
Kanpur Paddy and wheat Decrease in
yield
- - 6,166 (paddy)
954 (wheat)

Benefits of wastewater recycle and reuse in agriculture Use of treated wastewater for agriculture can help
farmers increase their earnings
Case studies reveal an average by Rs. 17,000 / Ha per annum on account of water availability and reduced fertilizer use
Potential to increase of about 30% in the farmer’s income when the farmer uses of freshwater alone
Channeling the entire quantum of treated wastewater towards agriculture has the potential to support 2 million farmers

Challenges for Agricultural Reuse Irrigation water charges in India recommended by 13th FC are Rs. 1,175
in Major irrigation command areas and Rs. 588 in minor irrigation command areas for one hectare of irrigated land, or about 10-25 paise per kilo liter.
The O&M cost of treating wastewater is significantly higher compared to this.
Treated wastewater when used for agricultural irrigation presents potential economic and environmental benefits to consumers, city governments and states - an assured and reliable water supply, the nutrients present in wastewater, and avoided costs of groundwater pumping and fertilizer subsidies
Utilities and city governments will need to explore sustainable business models aimed at different user categories, working in partnership with various State Government Departments and Agencies

Govt. of India - Initiatives
Guidelines of wastewater recycle and reuse – Manual on sewerage and sewage treatment
SLB – 20% recycle of wastewater

Conclusions
Availability of a continuous and reliable source of water;
An economical option to meet a city’s water demand;
Improves viability of STPs when used to meet industrial water requirements;
Sustainable option for industries;
As a potential nutrient source for agriculture, with potential to reduce
fertilizer requirements (up to 50-100% reduction as compared to freshwater)
and an associated beneficial impact on crop yields (upto 30-60% increase
reported by various researchers);
Results in overall economic benefits for the farmer due to higher yields and
lower costs (on average, an incremental benefit of about Rs.
17,000/hectare/year has been reported across the studies included in this
review).

Discussion


![INDEX [mohua.gov.in]](https://img.dokumen.tips/doc/110x75/61bd0ceb61276e740b0ed87d/index-mohuagovin.jpg)