Embed Size (px)
Citation preview

Waste Characterization Study
for KSU Recycling
5/2/2011
Natural Resources and Environmental Sciences Capstone Course
Melinda Kahmeyer
Callie Miller
Kelsey Neppel
Craig Ronnebaum
John Webber
Brain Zinke
2
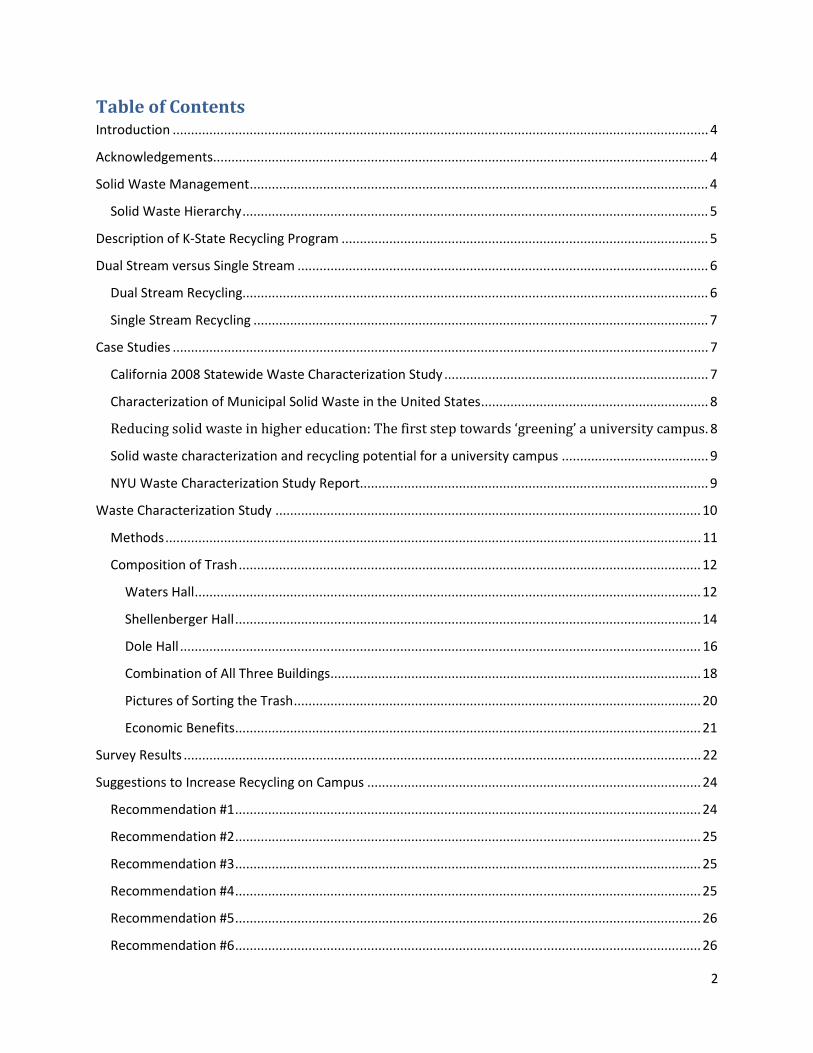
Table of Contents Introduction .................................................................................................................................................. 4
Acknowledgements ....................................................................................................................................... 4
Solid Waste Management ............................................................................................................................. 4
Solid Waste Hierarchy ............................................................................................................................... 5
Description of K-State Recycling Program .................................................................................................... 5
Dual Stream versus Single Stream ................................................................................................................ 6
Dual Stream Recycling............................................................................................................................... 6
Single Stream Recycling ............................................................................................................................ 7
Case Studies .................................................................................................................................................. 7
California 2008 Statewide Waste Characterization Study ........................................................................ 7
Characterization of Municipal Solid Waste in the United States .............................................................. 8
Reducing solid waste in higher education: The first step towards ‘greening’ a university campus. 8
Solid waste characterization and recycling potential for a university campus ........................................ 9
NYU Waste Characterization Study Report............................................................................................... 9
Waste Characterization Study .................................................................................................................... 10
Methods .................................................................................................................................................. 11
Composition of Trash .............................................................................................................................. 12
Waters Hall .......................................................................................................................................... 12
Shellenberger Hall ............................................................................................................................... 14
Dole Hall .............................................................................................................................................. 16
Combination of All Three Buildings..................................................................................................... 18
Pictures of Sorting the Trash ............................................................................................................... 20
Economic Benefits ............................................................................................................................... 21
Survey Results ............................................................................................................................................. 22
Suggestions to Increase Recycling on Campus ........................................................................................... 24
Recommendation #1 ............................................................................................................................... 24
Recommendation #2 ............................................................................................................................... 25
Recommendation #3 ............................................................................................................................... 25
Recommendation #4 ............................................................................................................................... 25
Recommendation #5 ............................................................................................................................... 26
Recommendation #6 ............................................................................................................................... 26

3
Recommendation #7 ............................................................................................................................... 26
Recommendation #8 ............................................................................................................................... 26
References .................................................................................................................................................. 27
Illustrations
Figure 1: Proposed Collection Method by Research and Extension Office for Statistical Research. ......... 12
Figure 2: Table showing weight and percent composition of trash for Waters Hall. ................................ 12
Figure 3: Pie Graph showing composition of trash for Waters Hall........................................................... 13
Figure 4: Table showing weight and percent composition of current recycling in Waters Hall. ............... 13
Figure 5: Pie Graph showing composition of currently recycling percentages in Waters Hall. ................. 14
Figure 6: Table showing weight and percent composition of trash for Shellenberger Hall. ..................... 14
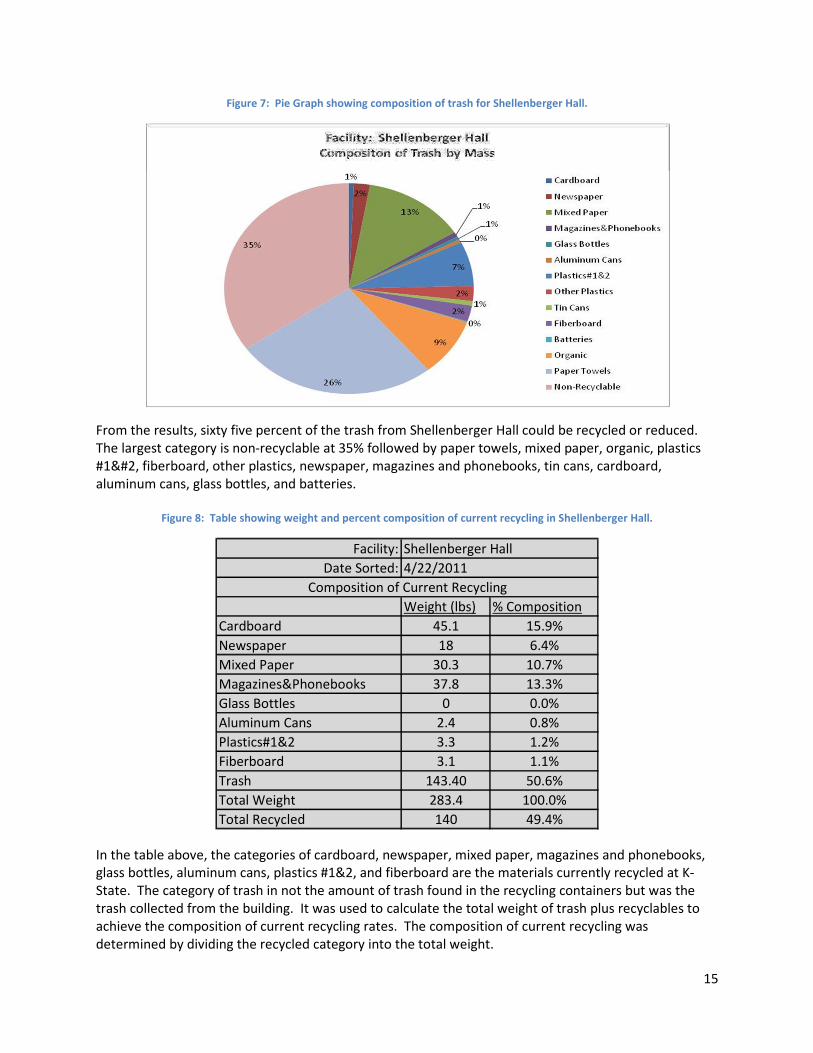
Figure 7: Pie Graph showing composition of trash for Shellenberger Hall. ............................................... 15
Figure 8: Table showing weight and percent composition of current recycling in Shellenberger Hall. .... 15
Figure 9: Pie Graph showing composition of currently recycling percentages in Shellenberger Hall. ...... 16
Figure 10: Table showing weight and percent composition of trash for Dole Hall. .................................. 16
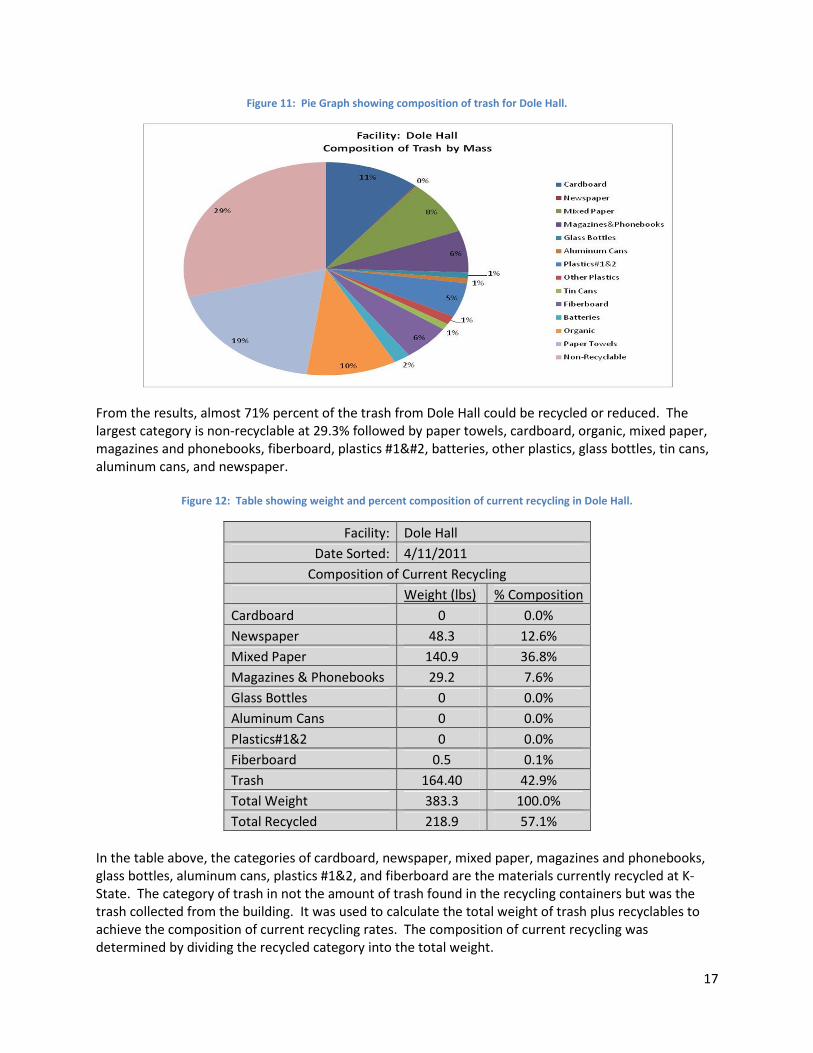
Figure 11: Pie Graph showing composition of trash for Dole Hall. ............................................................ 17
Figure 12: Table showing weight and percent composition of current recycling in Dole Hall. ................. 17
Figure 13: Pie Graph showing composition of currently recycling percentages in Dole Hall. ................... 18
Figure 14: Table showing weight and percent composition of trash for all three buildings combined. ... 18
Figure 15: Pie Graph showing composition of trash for all three buildings combined. ............................ 19
Figure 16: Table showing weight and percent composition of current recycling in all three buildings
combined. ................................................................................................................................................... 19
Figure 17: Pie Graph showing composition of currently recycling percentages in all three buildings
combined. ................................................................................................................................................... 20
Figure 18: Table showing price quotes between Howie’s and Deffenbaugh. ........................................... 21
Figure 19: Results from first question of survey. ....................................................................................... 22
Figure 20: Results from second question of survey. .................................................................................. 22
Figure 21: Results from third question of survey. ...................................................................................... 23
Figure 22: Picture of Waste Characterization Group at Earth Day. ........................................................... 24
4
Introduction
The main goal of this project is to help focus the recycling committee’s efforts to improve the recycling
rate at Kansas State University. This report will include how recycling got started at K-State and how it
has grown over the years and plans for the future. It will also compare the benefits and disadvantages
of using dual stream recycling versus single stream recycling. The report will also contain information
from other universities or institutions that have increased their recycling rates through single stream
recycling or other methods. One important aspect of this report is the waste characterization study that
helps to identify the composition of trash on campus. The waste characterization study will show what
could be recycled that is currently being thrown away. Knowing the composition of trash will help the
recycling committee focus their efforts on increasing the recycling rates on campus. Increases in
recycling will reduce the amount of trash sent to the landfill which will lead to savings as it costs money
to send trash to the landfill.
Recycling at K-State is important because as a land grant university, our motto is to rule by obeying
nature’s laws. Recycling is crucial in helping K-State become a more sustainable campus which is part of
K-State’s 2025 vision of becoming a top 50 public research university. Recycling on campus also has the
potential to save money. Over the past couple of years, recycling on campus hasn’t increased much
despite the desk side containers and numerous recycling containers distributed throughout campus to
make it easier for faculty and students to recycle. This report should contain valuable information for
the recycling committee to better focus their efforts to increase recycling on campus. Hopefully it too
will show administration the importance and benefits of recycling on campus and help with the
realization that it is part of our mission statement.
Acknowledgements
There are several individuals who have contributed to the success of this project. We would like to
thank our advisor Dr. Bonnie Lynn-Sherow for overseeing our project. We would also like to thank the
recycling committee for their input and support while we were completing our project. The Research
and Extension Office for Statistical Research also contributed with helping to determine a representative
sample to collect trash from. We also want to thank John Woods and his staff for assisting us with the
collection and sorting of the trash. Without their support, we would not have a waste characterization
study to present.
Solid Waste Management
The goal of a sustainable solid waste program is to “promote waste prevention, recycling and effective
management and disposal of solid wastes” (EPA 2011). The Environmental Protection Agency (EPA)
provides a wealth of solid waste resources. The agency sets standards for proper disposal of waste and
provides guidance and information to the general public. The Resource Conservation and Recovery Act
(RCRA), subtitle D, addresses primarily nonhazardous wastes including Municipal Solid Waste (MSW),
industrial waste and certain hazardous wastes such as from households, which are exempted from
hazardous waste regulations. The RCRA defines the solid waste as the following:
● Garbage, known as municipal solid waste (milk cartons, coffee grounds, most packaging)

5
● Refuse (metal scrap, wall board...)
● Sludges from waste treatment plants, water treatment plants or pollution control facilities
● Nonhazardous industrial wastes
● Crude oil and natural gas waste
● Construction and demolition debris
● Medical waste
● Agricultural waste
● Household hazardous waste
● Conditionally exempt small quantity generator waste
Solid Waste Hierarchy
The EPA ranked MSW strategies in order of the most sound and sustainable. “Source reduction
(including reuse) is the most preferred method, followed by recycling and composting and disposal in
combustion facilities and landfills” for the least sustainable option.
(http://www.epa.gov/Region7/waste/solidwaste/, EPA 2011). Many of these MSW management
practices prevent or divert materials from the waste stream.
Source Reduction, also known as waste prevention involves making changes to the design, manufacture,
or use of products and materials to reduce the amount and toxicity of landfilled waste. Example
practices include mulch mowing, composting, two-sided printing and packaging material reduction.
Recycling, including composting diverts items from the waste stream. Materials, such as plastic, paper
and metals are sorted, collected and processed and then manufactured, sold and then bought by
consumers. Composting decomposes organic wastes like food scraps and yard waste, with
microorganisms to produce a nutrient rich soil amendment.
Description of K-State Recycling Program
The recycling program at Kansas State University started in 1989 and is coordinated by facilities and
custodial departments. The K-State Recycling Advisory Committee oversees and advises the recycling
program. The committee is composed of nine faculty, staff, and students. John Woods, director of
Facilities Services, manages the recycling effort assisted by two employees and student volunteers. The
committee is responsible for the main campus, the Veterinary Medicine campus and the K-State Salina
campus. The link below gives information on the recycling program at K-State. There are currently
thirty buildings on campus that partake in some form of recycling.

6
http://www.k-state.edu/recycling/
K-State first joined the Recycle Mania national program in Spring of 2009. The program is a
benchmarking and competition recycling program between higher education institutions over a 10-week
period. School recycling programs are ranked based on recycling and trash data. The program motivates
schools to reduce and reuse waste in a competition for who collects the largest amount of recyclables
per capita, the largest amount of total recyclables, the least amount of trash per capita, or the highest
recycling rate. Students for Environmental Action and the K-State Students for Environmental Education
campaign are currently the active groups participating in this effort. The accepted recycled materials
include mixed paper (white and colored, letterhead, index cards, white forms, computer paper),
cardboard, newspaper, plastic bottles and aluminum cans, although K-State also accepts magazines,
wooden pallets, phone books, rubber bands, aluminum and other metals, electronics and other
magnetic media, transparencies, film and shredded paper as well. Staff members can properly dispose
of computer systems including monitors, keyboards and other accessories (a disposition of property
form must be filled out, DA110). Recycling bins can be found in many K-State buildings in areas
approved by the Fire Marshal.
Dual Stream versus Single Stream
Dual Stream Recycling
Since 1989, Kansas State University has participated in what is called Dual Stream Recycling. Dual
Stream recycling involves sorting recyclable materials into various containers designated for that
material. All around campus are individual containers for aluminum cans, plastic, glass, newspaper and
cardboard. At prearranged times these containers are emptied into the Recycling trucks around
campus. These trucks carry the materials to the recycling center where they remain separated until,
reaching their final destination at Howie’s. Dual Stream recycling has been the predominant method of
recycling on campus and around the world for several reasons. First, separating materials helps to keep
them from being contaminated and further devaluing the potential economic recovery of that material.
For example, paper recycling and the regulations that dictate which types of paper can be collected is
contingent on the separation of mixed paper from glossy paper. The prevention of the mixing allows
paper to be reused more efficiently and keeps cost of processing lower leading to an economically
profitable situation for secondhand manufactures. Secondly, Dual Stream prevents the obvious
hardship of sorting the materials. Technology and/or labor of physically sorting materials into the
designated receptacle take time which ultimately is an economic value. On the other hand, Dual stream
recycling has some disadvantages. Although there has been an increase in recycling efforts over the
past decade, two of the predominant reasons that cause lower participation in recycling efforts are the
ignorance of how to recycle and apathy in locating the appropriate location for each recyclable.
Unfortunately, on campus, as in many participating communities, high disparity between recycling
containers and trash receptacles leads to the effortless choice by many community members to get rid
of recyclable material in the most convenient way. Extending from the same root cause of more trash
cans, less recycling containers and very similar to the previous problem, is the lack of knowledge of
where to find a recycling container. Another problem with dual stream recycling, especially for those
programs in the preliminary stages, is the cost of buying individual containers for each material.
Additionally, lack of space for recycling bins is always an issue. Although sorted materials are much
easier, and less expensive to compress and ship to the manufacture, the opportunity to collect material
not commonly collected, such as plastics #5 and #4, although very common in coffee cups and yogurt
containers, as evidenced by our study, is significantly diminished.
7
Single Stream Recycling
Single Stream recycling is a newer innovative recycling program that began in the early 90’s in California.
The main difference between the dual stream and single stream is the deletion of different, separate
bins for each material collected. In other words, one centrally located bin collects all type of recyclables.
Like the dual stream recycling, single stream recycling systems come with their own positives and
shortcomings. Addressing the apathy and ignorance issue of the dual system, consumers do not have to
worry about following a strict classification system for the various materials used on campus daily.
Research has shown that participation in recycling efforts increased drastically when the switch was
made from traditional sorting methods to the single stream method. Additionally, in theory, single
stream recycling bins can be more numerous in building because the need for several different
containers is not necessary and thus precious space is saved. Similarly because of the one container
collection, more types of recyclables could be collected, especially different types of plastics. Another
added plus to the single stream method is the decreased need for trucks used for pick-up with different
bins for each material. This leads to a reduction in the cost of collection. In essence, trucks similar to
trash trucks could be used for transfer to the recycling center where separation takes place either by
hand or by machine. A little less obvious reason that has been supported by continued research is the
comparison of collection times for collection trucks. As such, the amount of time spent collecting each
individual receptacle is greater than the time it takes to dump one single stream receptacle.
Unfortunately, any gains made in the reduction of labor for collection is offset by the increases in
processing costs. Plainly stated, sorting occurs either by hand or by technology. As with the dual system,
we meet another psychological problem with single stream. The idea of single stream recycling, and
recycling in general, places too much emphasis on diverting recyclables from the waste system and
doesn’t place enough on the quality of recyclables entering in the recycling bins. People tend to think
that throwing a dirty soda bottle into the recycling bin is a good activity, however, as the problem
expands, contamination becomes a real concern. The contamination of certain recyclables can cause
manufactures and processors receiving them to place them on the track for the landfill, not to mention
the labor and time it takes to pick out contaminated materials.
Case Studies
Throughout the duration of our project, we referred to many case studies to help guide us in the right
direction. Having information from many different sources helped to complete our study. Listed below
are the most notable ones and how we used them to our benefit.
California 2008 Statewide Waste Characterization Study
This eight page report describes California’s commitment to a zero waste goal to help reduce
greenhouse gases, conservation resources, and to maintain their natural environment. This study
identifies the amounts of materials disposed at solid waste facilities throughout the entire state. Their
study methodology is much like ours in the fact that they randomly sampled from subgroups. They first
divided the state into five divisions by their similarities: demographic, climate, geography, and economic
characteristics. We divided the campus into three different categories; small, medium, and large
buildings by their percentage of square feet.
8
When comparing the percentages of waste categories, their study was different than ours because they
could account for leaves, grass, branches, asphalt, soil, carpet, and many other items we do not have in
our trash. We did however use their main categories of paper, glass, organic, electronics, and plastics.
When comparing these main categories, our numbers were remarkably similar; 30 percent not being
recyclable, 26 percent paper, and 10 percent being some sort of plastic.
Characterization of Municipal Solid Waste in the United States
This report describes the national municipal solid waste for the years of 1960 through 2000. This report
helped put into perspective how much solid waste could actually be recycled. In 2000, the United States,
as a whole, generated around 231.9 million tons of waste. We recycled 69.9 million tons of those
original 231.9 million tons. This is around 4.5 pounds of waste thrown out per person per day. The
recycling rates have increased from 10 percent in 1980 to 30 percent in 2000.
This study separated the municipal solid waste into two categories. The first being “Materials”, this
included paper, yard trimmings, food scraps, plastics, metals, glass, wood, rubber, leather, and others.
The second being “Products”, which included appliances, non-durable and durable items, and others.
They discovered that the following percentages could have been recycled from the landfills: Paper -
37.4%, Yard Trimmings - 12%, Food Scraps - 11.2%, Plastics - 10.7%, and Glass - 5.5%.
Reducing solid waste in higher education: The first step towards ‘greening’ a
university campus
Recently, the Prince George campus of the University of Northern British Columbia (UNBC) conducted a
waste characterization project that is very similar to the current task taken on by Kansas State University
and the assisting Natural Resources and Environmental Science (NRES) group. Through the UNBC study,
much insight was shed on the specific processes that needed to take place to obtain the much needed
data, which is the backbone of these two studies. As the article states, “Direct waste analyses or waste
characterization studies. . . offer the most effective process for examining the various wastes generated
and identifying opportunities for waste reduction, reuse, recycling, and composting” (Booth, 1007).
UNBC’s study took place initially during one semester of an academic year and then expanded to a full
year as to increase the accuracy of the collected data. With a university located in the heart of an
environmentally conscious community, the smaller campus of roughly 5,000 students has been able to
work towards the ‘greening’ of the campus with the hopes of establishing the trademark, “Canada’s
Green University” (Booth, 1008). Initially, they identified busy areas on the campus as well as mapped
the current recycling facilities available for the students and faculty. Using this information UNBC chose
15 activity areas on campus excluding the on-campus housing as well as the sports center. They
collected trash for two separate 5 day periods and picked a sample population to hand sort and not just
weigh.
The findings were astonishing. “Approximately 52,081 kg (~52 metric tons) of waste from the core
campus buildings was sent to landfill during the 2007-2008 academic year.” Both hand sorted samplings
also revealed amazingly large numbers. “In total, 1,359 kg of waste was sorted, of which, 640 kg was
recyclable, 338 kg was compostable, and 370 kg was non-recyclable material. Electronics and hazardous
by-products constituted the remaining 14 kg of waste” (Booth, 1011). That means that more than 70%
of the waste collected at UNBC for those two audits could have avoided reaching the landfill. Paper

9
products topped the list. Of the collected waste, 29.1% was paper, paperboard, printer paper, mixed
paper, newspaper, cardboard, or paper towels.
Solid waste characterization and recycling potential for a university campus
Although this study took place in Mexico, a region that is known to be different to that of the United
States, it still brought relevant information to light. This waste characterization study was for the
improvement of recycling and reuse on the Autonomous University of Baja California (AUBC) campus.
The first important statement to take note of is one that discusses how each program needs to have
background research to fit the current conditions, that a current program established elsewhere could
very well not be effective at all due to differing circumstances. This is why the waste characterization
study at the Manhattan campus of KSU is so important and why we cannot just implement another plan
without seeing if it will be effective for the needs of this campus.
The article makes comparisons between the conditions of the study done at AUBC in Mexico with
current efforts and studies within the US. It can be seen that although they are slightly behind, efforts
are increasing in this less developed country to someday soon be enforcing similar policies which are
thought to be beneficial to the universities there as well. Several results college studies done by
universities in the US were discussed and were found to be useful for this study too. Such as, “one
characterization study carried out at Brown University revealed that 45% of the wastes generated at the
institution were recyclables” and they found that “other examples are those at Colorado State
University and at the University of Florida which recycle 53% and 30% respectively” (Barreto et. al, 522).
AUBC’s study itself was structured very similarly to that of our other more developed countries case
studies. However, it differed from our study in that they took samples from three specific areas, the
academic and administrative buildings, gardens, and community centers which included the cafeteria.
The gardens and community centers on KSU’s campus were purposely excluded from our study to try to
make it more manageable. They also compiled their data over a longer time frame, 14 consecutive days,
and found that in the buildings 43.6% of the waste was paper and cardboard which could be recycled. In
the garden, it was found that 80% was organic material that could be composted. And in the community
center, 23.3% was recyclable paper and cardboard, and 54.1% compostable organics. Like our study, a
large percentage of waste that could be recycled was being taken to landfills.
NYU Waste Characterization Study Report
In spring 2008, the New York University Recycling Shop performed the first waste characterization study
of the Washington Square Campus. NYU followed sampling procedures primarily from the Standard Test
Method for Determination of the Composition of Unprocessed Municipal Solid Waste (ASTM D 5231-
92). Samples were sorted into 12 waster categories shown below. The results collected were analyzed
and differentiated the landfilled waste stream into three waste recoverable categories: compostable,
recyclable and landfill material source reduction. The following waste material results were obtained
from the study:

10
http://www.nyu.edu/fcm/waste_study_report.pdf
http://www.nyu.edu/fcm/waste_study_report.pdf
The NYU study results address the material class (compostable, recyclable, landfill) generated per waste
generator group (academic, academic/administration, general use, residence hall, residence hall/dining
facility). The analysis further describes the composition of the landfill waste stream by recyclable
materials that are potentially recoverable under the existing recycling programs. The obtained results
posted an impressive 29% potential waste diversion from landfills just for recyclable materials. An even
more recoverable was compostable materials with over 59% that can be diverted through an organic
collection program.
Waste Characterization Study
The importance of conducting a waste characterization study is to identify the composition of the waste
so actions can be taken to reduce the amount trash thrown away. K-State facilities currently knows the
total amount of waste that is being sent to the landfill and that is being recycled on campus but doesn’t
know the composition or weight output for every building. Our goal is to collect trash from a few
buildings on campus that will represent the whole campuses waste stream. Knowing K-State’s typical
trash consumption and weight, better efforts can be made to increase recycling and to help decide if
single stream recycling is beneficial for K-State.

11
Methods
An important of part of the waste characterization study is to identify representative sample buildings
that will give a good indication of the whole campuses waste stream. To be 100% accurate, all buildings
on campus would need to be incorporated but this was not feasible for out project. For our
classification, we excluded the dormitories, dining centers, athletic buildings, facilities, and farms on
campus. We contacted the Research and Extension Office for Statistical Research for assistance in
determining a representative sample. They recommended randomly selecting fifteen buildings on
campus divided into three categories: small, medium, and large determined by the square footage of
the buildings. They also recommended collecting trash from each building for more than one week to
reduce variability. At a minimum, they recommended sampling six buildings, collecting trash from each
building for two weeks. Their proposed schedule is shown below in figure one. After conferring with
facilities, it was decided that the proposed schedule by the Research and Extension Office was too much
to collect and sort in a three week period. We as a group felt that collecting trash from six or more
buildings on campus was too much to analyze based on our time constraints and the personal required
to make that happen. We felt that it would be a difficult task to do a waste characterization study that
represented the entire K-State campus as there are over 60 buildings on campus and over 23,000
students for a semester project. After discussing with facilities, it was determined that we would collect
trash from three buildings, one each week. These three buildings were randomly selected based on the
size distributions. The large building selected was Waters Hall, medium building was Shellenberger Hall,
small building was Dole Hall. Each of these buildings chosen has multiple uses to try to incorporate
waste streams from offices, labs, classrooms, etc. Our final results will not be accurate to represent the
whole campuses waste stream but should still give a good indication of what is being thrown away that
could be recycled. To represent the whole campus, the proposed schedule in figure one would need to
be followed.
After the buildings were selected, we coordinated with facilities to collect the trash and recycling from
the buildings. The trash and recyclables were stored at the recycling center at the end of the week. On
Friday, we sorted and weighed the trash into the following categories; cardboard, newspaper, mixed
paper, magazines and phonebooks, glass bottles, aluminum cans, plastics #1, other plastics, tin cans,
fiberboard, batteries, organic, paper towels, and non-recyclable. Other plastics included #3-#7 and
plastic sacks. After the sorting was finished, the weights were entered into an excel spreadsheet to
graph the composition of the waste for each building. The results are shown and described below under
the section composition of trash.
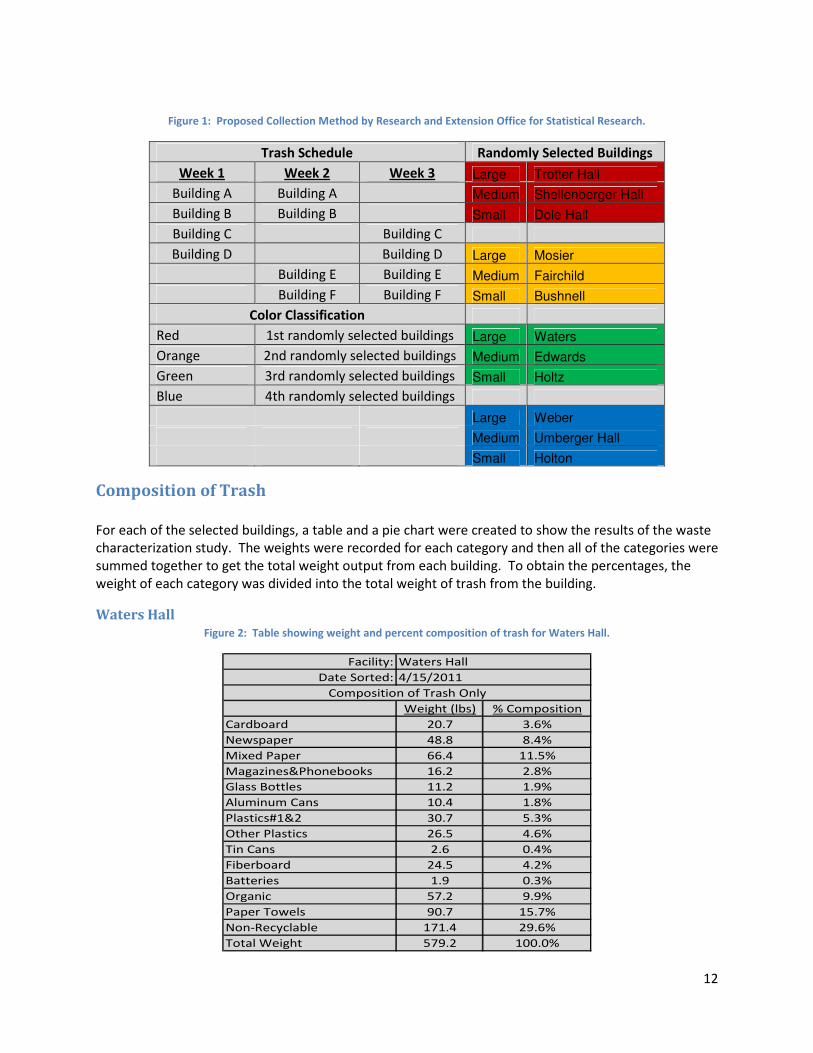
12
Figure 1: Proposed Collection Method by Research and Extension Office for Statistical Research.
Trash Schedule Randomly Selected Buildings
Week 1 Week 2 Week 3 Large Trotter Hall
Building A Building A Medium Shellenberger Hall
Building B Building B Small Dole Hall
Building C Building C
Building D Building D Large Mosier
Building E Building E Medium Fairchild
Building F Building F Small Bushnell
Color Classification
Red 1st randomly selected buildings Large Waters
Orange 2nd randomly selected buildings Medium Edwards
Green 3rd randomly selected buildings Small Holtz
Blue 4th randomly selected buildings
Large Weber
Medium Umberger Hall
Small Holton
Composition of Trash
For each of the selected buildings, a table and a pie chart were created to show the results of the waste
characterization study. The weights were recorded for each category and then all of the categories were
summed together to get the total weight output from each building. To obtain the percentages, the
weight of each category was divided into the total weight of trash from the building.
Waters Hall
Figure 2: Table showing weight and percent composition of trash for Waters Hall.
Facility:
Date Sorted:
Weight (lbs) % Composition
Cardboard 20.7 3.6%
Newspaper 48.8 8.4%
Mixed Paper 66.4 11.5%
Magazines&Phonebooks 16.2 2.8%
Glass Bottles 11.2 1.9%
Aluminum Cans 10.4 1.8%
Plastics#1&2 30.7 5.3%
Other Plastics 26.5 4.6%
Tin Cans 2.6 0.4%
Fiberboard 24.5 4.2%
Batteries 1.9 0.3%
Organic 57.2 9.9%
Paper Towels 90.7 15.7%
Non-Recyclable 171.4 29.6%
Total Weight 579.2 100.0%
Composition of Trash Only
Waters Hall
4/15/2011

13
Figure 3: Pie Graph showing composition of trash for Waters Hall.
From the results, seventy percent of the trash from Waters Hall could be recycled or reduced. The
greatest category of the trash was non-recyclable at 30%. The next biggest categories were paper
towels followed by mixed paper, organic waste, newspaper, plastics #1, other plastics, fiberboard,
cardboard, magazines and phonebooks, glass bottles, aluminum cans, tin cans, and batteries.
Figure 4: Table showing weight and percent composition of current recycling in Waters Hall.
Facility:
Date Sorted:
Weight (lbs) % Composition
Cardboard 48.5 6.0%
Newspaper 28.8 3.6%
Mixed Paper 45.9 5.7%
Magazines&Phonebooks 36.7 4.6%
Glass Bottles 1.1 0.1%
Aluminum Cans 12.8 1.6%
Plastics#1&2 44.2 5.5%
Fiberboard 8.5 1.1%
Trash 579.2 71.9%
Total Weight 805.7 100.0%
Total Recycled 226.5 28.1%
Composition of Current Recycling
Waters Hall
4/15/2011
In the table above, the categories of cardboard, newspaper, mixed paper, magazines and phonebooks,
glass bottles, aluminum cans, plastics #1&2, and fiberboard are the materials currently recycled at K-
State. The category of trash in not the amount of trash found in the recycling containers but was the
trash collected from the building. It was used to calculate the total weight of trash plus recyclables to
achieve the composition of current recycling rates. The composition of current recycling was
determined by dividing the recycled category into the total weight.

14
Figure 5: Pie Graph showing composition of currently recycling percentages in Waters Hall.
Shellenberger Hall
Figure 6: Table showing weight and percent composition of trash for Shellenberger Hall.
Facility:
Date Sorted:
Weight (lbs) % Composition
Cardboard 0.9 0.6%
Newspaper 3 2.1%
Mixed Paper 19.1 13.3%
Magazines&Phonebooks 1.1 0.8%
Glass Bottles 0.7 0.5%
Aluminum Cans 0.7 0.5%
Plastics#1&2 9.8 6.8%
Other Plastics 3.3 2.3%
Tin Cans 1 0.7%
Fiberboard 3.5 2.4%
Batteries 0.2 0.1%
Organic 12.7 8.9%
Paper Towels 37.7 26.3%
Non-Recyclable 49.7 34.7%
Total Weight 143.4 100.0%
Composition of Trash Only
Shellenberger Hall
4/22/2011
15
Figure 7: Pie Graph showing composition of trash for Shellenberger Hall.
From the results, sixty five percent of the trash from Shellenberger Hall could be recycled or reduced.
The largest category is non-recyclable at 35% followed by paper towels, mixed paper, organic, plastics
#1, fiberboard, other plastics, newspaper, magazines and phonebooks, tin cans, cardboard,
aluminum cans, glass bottles, and batteries.
Figure 8: Table showing weight and percent composition of current recycling in Shellenberger Hall.
Facility:
Date Sorted:
Weight (lbs) % Composition
Cardboard 45.1 15.9%
Newspaper 18 6.4%
Mixed Paper 30.3 10.7%
Magazines&Phonebooks 37.8 13.3%
Glass Bottles 0 0.0%
Aluminum Cans 2.4 0.8%
Plastics#1&2 3.3 1.2%
Fiberboard 3.1 1.1%
Trash 143.40 50.6%
Total Weight 283.4 100.0%
Total Recycled 140 49.4%
Composition of Current Recycling
Shellenberger Hall
4/22/2011
In the table above, the categories of cardboard, newspaper, mixed paper, magazines and phonebooks,
glass bottles, aluminum cans, plastics #1&2, and fiberboard are the materials currently recycled at K-
State. The category of trash in not the amount of trash found in the recycling containers but was the
trash collected from the building. It was used to calculate the total weight of trash plus recyclables to
achieve the composition of current recycling rates. The composition of current recycling was
determined by dividing the recycled category into the total weight.

16
Figure 9: Pie Graph showing composition of currently recycling percentages in Shellenberger Hall.
16%
6%
11%
13%
0%1%
1%1%
51%
Current Recycling Percentages
Cardboard
Newspaper
Mixed Paper
Magazines&Phonebooks
Glass Bottles
Aluminum Cans
Plastics#1&2
Fiberboard
Trash
Dole Hall
Figure 10: Table showing weight and percent composition of trash for Dole Hall.
Facility: Dole Hall
Date Sorted: 4/29/2011
Composition of Trash Only
Weight (lbs) % Composition
Cardboard 17.7 10.8%
Newspaper 0.2 0.1%
Mixed Paper 13.7 8.3%
Magazines & Phonebooks 10.4 6.3%
Glass Bottles 1.5 0.9%
Aluminum Cans 1.2 0.7%
Plastics#1&2 8.6 5.2%
Other Plastics 2.1 1.3%
Tin Cans 1.5 0.9%
Fiberboard 9 5.5%
Batteries 3.1 1.9%
Organic 16.8 10.2%
Paper Towels 30.5 18.6%
Non-Recyclable 48.1 29.3%
Total Weight 164.4 100.0%
17
Figure 11: Pie Graph showing composition of trash for Dole Hall.
From the results, almost 71% percent of the trash from Dole Hall could be recycled or reduced. The
largest category is non-recyclable at 29.3% followed by paper towels, cardboard, organic, mixed paper,
magazines and phonebooks, fiberboard, plastics #1, batteries, other plastics, glass bottles, tin cans,
aluminum cans, and newspaper.
Figure 12: Table showing weight and percent composition of current recycling in Dole Hall.
Facility: Dole Hall
Date Sorted: 4/11/2011
Composition of Current Recycling
Weight (lbs) % Composition
Cardboard 0 0.0%
Newspaper 48.3 12.6%
Mixed Paper 140.9 36.8%
Magazines & Phonebooks 29.2 7.6%
Glass Bottles 0 0.0%
Aluminum Cans 0 0.0%
Plastics#1&2 0 0.0%
Fiberboard 0.5 0.1%
Trash 164.40 42.9%
Total Weight 383.3 100.0%
Total Recycled 218.9 57.1%
In the table above, the categories of cardboard, newspaper, mixed paper, magazines and phonebooks,
glass bottles, aluminum cans, plastics #1&2, and fiberboard are the materials currently recycled at K-
State. The category of trash in not the amount of trash found in the recycling containers but was the
trash collected from the building. It was used to calculate the total weight of trash plus recyclables to
achieve the composition of current recycling rates. The composition of current recycling was
determined by dividing the recycled category into the total weight.

18
Figure 13: Pie Graph showing composition of currently recycling percentages in Dole Hall.
Combination of All Three Buildings
Figure 14: Table showing weight and percent composition of trash for all three buildings combined.
Facility: All Three Combined
Date Sorted:
Composition of Trash Only
Weight (lbs) % Composition
Cardboard 39.3 4.4%
Newspaper 52 5.9%
Mixed Paper 99.2 11.2%
Magazines & Phonebooks 27.7 3.1%
Glass Bottles 13.4 1.5%
Aluminum Cans 12.3 1.4%
Plastics#1&2 49.1 5.5%
Other Plastics 31.9 3.6%
Tin Cans 5.1 0.6%
Fiberboard 37 4.2%
Batteries 5.2 0.6%
Organic 86.7 9.8%
Paper Towels 158.9 17.9%
Non-Recyclable 269.2 30.3%
Total Weight 887 100.0%

19
Figure 15: Pie Graph showing composition of trash for all three buildings combined.
From the results, almost 70% percent of the trash from all three buildings combined could be recycled
or reduced. The largest category is non-recyclable at 30.3% followed by paper towels, mixed paper,
organic, newspaper, plastics #1, cardboard, fiberboard, other plastics, magazines and phonebooks,
glass bottles, aluminum cans, tin cans, and batteries .
Figure 16: Table showing weight and percent composition of current recycling in all three buildings combined.
Facility: All Three Combined
Date Sorted:
Composition of Current Recycling
Weight (lbs) % Composition
Cardboard 93.6 6.4%
Newspaper 95.1 6.5%
Mixed Paper 217.1 14.7%
Magazines & Phonebooks 103.7 7.0%
Glass Bottles 1.1 0.1%
Aluminum Cans 15.2 1.0%
Plastics#1&2 47.5 3.2%
Fiberboard 12.1 0.8%
Trash 887.00 60.2%
Total Weight 1472.4 100.0%
Total Recycled 585.4 39.8%
In the table above, the categories of cardboard, newspaper, mixed paper, magazines and phonebooks,
glass bottles, aluminum cans, plastics #1&2, and fiberboard are the materials currently recycled at K-
State. The category of trash in not the amount of trash found in the recycling containers but was the
trash collected from the building. It was used to calculate the total weight of trash plus recyclables to
achieve the composition of current recycling rates. The composition of current recycling was
determined by dividing the recycled category into the total weight.

20
Figure 17: Pie Graph showing composition of currently recycling percentages in all three buildings combined.
Pictures of Sorting the Trash

21
Economic Benefits
Increasing the recycling rates on campus would lead to more money being saved as it would decrease
the amount of trash sent to the landfill as it currently costs $42.00/ton to dispose of the trash at the
landfill. There would also be an increase in revenue from the recycled materials as a greater amount of
the waste would be recycled. The table below shows the amount of money that could be saved from
disposing trash in the landfill if 100% recycling was achieved in all of the three buildings we collected
from; it also compares prices between Howie’s recycling and Deffenbaugh, the single stream recycling
center in Kansas City. Price quotes are included in the table. We did the cost analysis over 32 weeks
which is equivalent to two full semesters. As you can see, more than double the money could be earned
from Howie’s but this cost analysis does not include increased labor to sort the materials, transportation
costs to haul recyclables to Deffenbaugh, and is assuming 100% recycling in the buildings. The weight of
the recycled material in the table is the combined weight of all the three buildings. It is hard to infer
from this cost analysis which option is more viable since so many factors are not included but it does
compare the price quotes between dual stream and single stream.
Figure 18: Table showing price quotes between Howie’s and Deffenbaugh.
Money that could be saved and earned from 100% recycling
Weight
(lbs)
$ saved from disposing in
landfill
$ Earned
from Howies
$ Earned from Single
Stream
Cardboard 39.3 $26.40 $37.72 $25.15
Newspaper 52 $34.94 $49.92 $33.28
Mixed Paper 99.2 $66.66 $126.97 $63.48
Magazines &
Phonebooks 27.7 $18.61 $17.72 $17.72
Glass Bottles 13.4 $9.00 $0 $8.57
Aluminum Cans 12.3 $8.26 $196.80 $7.87
Plastics#1&2 49.1 $32.99 $78.56 $31.42
Fiberboard 37 $24.864 $35.52 $23.68
Total 330 $221.76 $543.23 $211.20
Total Money $764.99 $432.96
Price Quotes from
Howie’s $/lb
Price Quote from
Deffenbaugh $40/ton
Aluminum .50/lb
Plastics#1&2 .05/lb
Cardboard .03/lb
Mixed Paper .04/lb
Newspaper .03/lb
Magazines &
Phonebooks .02/lb
Glass Bottles .00/lb

22
Survey Results
As part of our project, we wanted to raise awareness of the importance of increasing recycling on
campus. We reserved a booth during Earth Day to try to show people how much trash K-State is
throwing away on campus that could be recycled or reduced. For our booth, we had a poster describing
the goals and objectives of the project as well as our results from one week’s worth of collecting and
sorting trash. As people visited our booth, we had them fill out a short survey to get their feedback
concerning their motivation with recycling on campus. The results of the survey are shown below. A
total of sixty nine students filled out the survey. Prior to Earth Day, we had written an article that was
published in the student newspaper to raise awareness for recycling on campus, the importance of our
project, and to try to get more people to visit our booth for Earth Day. Initially, we had planned to bring
containers to Earth Day that contained sorted recyclable materials from the trash to show students how
much we throw away that could be recycled but due to the rainy weather, Earth Day was moved inside
which prevented us from bringing the sorted trash. Hopefully the student’s responses to the survey
questions will spark new ideas to increase recycling on campus.
Figure 19: Results from first question of survey.
Figure 20: Results from second question of survey.

23
Figure 21: Results from third question of survey.
Fourth question of survey.
In your opinion, what could make recycling better on campus?
• More locations
• More accessible recycling bins
• More locations and accessibility
• More accessible to res. halls
• More recycling bins for things like glass, cardboard, chipboard, etc.
• More bins! And make them more convenient and easy to find. Have one recycling bin for every
trash can instead of 1:50.
• More bins! Educate people
• More recycling bins around campus
• Paper, plastic, glass in all major traffic areas
• Recycling bins next to all trash cans
• Put “Land Fill” on trash cans. Reality check! :) More recycling bins in buildings.
• More attractive bins and signs that stand out more
• More participation
• More awareness and recycling bins. Especially in dorms.
• More emphasis on it. I see lots of people throw stuff away without looking for a recycling bin.
• Make sure people know about it.
• More advertising!
• I think educating people to reduce their consumption more than just relying on recycling is the
best.
• More options for recycling at each building
• More recyclable containers in food court
• There needs to be a division/faculty

24
Figure 22: Picture of Waste Characterization Group at Earth Day.
Suggestions to Increase Recycling on Campus
After conducting the waste characterization study and analyzing our research, we have come up with
some ideas and suggestions to help increase recycling on campus. There are two approaches to dealing
with solid waste which are waste management and waste prevention. Waste management reduces
environmental harm but can encourage consumption of resources. Waste prevention is considered a
low waste approach because it reduces or eliminates the source of waste and it also discourages
consumption. It is always better to incorporate waste prevention strategies whenever possible. The
EPA prefers source reduction and reuse first, then recycling/composting, and then landfilling or
incineration. Increasing recycling is a much better alternative than disposing of it in a landfill but
preventing or reducing the waste stream is even better.
Recommendation #1
Prepare long term zero-waste goals utilizing the 5-year recycling plan as a starting point. Waste is not a
required element for campus operations or any municipality, but it is a result of utilizing products
lacking end-of-life design (no longer useful). Invest in facilities that take the place of landfills. Zero-
waste systems hold manufacturers responsible for waste and environmental impacts of their product
and packaging rather than leaving the problem to consumers. Trashing materials wastes business
opportunities that can be created from those resources. California has adopted a Fantastic Three
program to meet their zero-waste goal by 2020 using individual bins for recycling, composting and
landfill dumping.
As our data indicates, less than 20% of the materials on campus are being recycled while over 50% of
those materials could be recycled. The first step in reducing waste is to reduce usage, as mentioned
above. The second step is to recycle as much as possible. The following are some ways we believe can
help increase the amount being recycled on campus.
25
Recommendation #2
We would recommend continuing the waste characterization study to include more buildings and to
collect trash from the same building for at least two weeks to reduce variability. We would recommend
following the schedule that the Research and Extension Office for Statistical Research had proposed.
This would be the minimum amount of buildings that would give some accurate representation for the
whole campuses waste stream. We thought it would also be interesting to count the number of trash
cans and recycling containers in each building to determine a ratio of trash to recycling containers. We
would also recommend storing the trash in a dry place instead of outside in the open trailer where it is
susceptible to the outdoor elements. Part of our trash was wet as it rained the first two weeks of
collecting trash. When we sorting through the trash, we had noticed that some of the newspapers were
wet, this would have skewed our composition some. Our surveys might also be a little biased since they
were filled out during Earth Day. Majority of the people at Earth Day already knew the importance of
recycling and recycled. There was also some confusion with the last question concerning single stream.
Recommendation #3
One of the most obvious things to notice on campus is the high ratio of trash cans to recycling bins. One
would have to purposely seek out a recycling bin in order to recycle a lot of the time. The solution to
this is simple – add more recycling bins around campus. It is important to make it easier for people to
recycle because the average person will not go out of their way to recycle a pop bottle or aluminum can.
By adding a recycling bin next to the current locations of trash cans you make it that much easier for
people and provide them an opportunity to make a smart choice.
Another interesting find we discovered is the location of recycling bins in some buildings. Many offices
have recycling bins alongside the trash cans, but in others there are only large recycling bins in the
hallway. In the latter case, a person would have to leave their office and walk down the hallway in order
to recycle an item, whereas they could simply throw it away in the trash can next to them. This seems
backwards for a university trying to promote sustainability. We propose that there only be recycling
bins in offices, with large trash cans out in the hallways. In this situation, a person would have to walk
down the hallway to throw something away. People naturally look for the easiest route or method to
do something, it is human nature. Faced with walking all the way down the hall and leaving the comfort
of an office chair, we believe that many people will be more likely to think about what they are throwing
away is recyclable.
Recommendation #4
An interesting find from the waste characterization study was that a significant weight of the trash was
paper towels. Paper towels are used in the restrooms and in labs. Paper towels are not recyclable at
Howie’s or at Deffenbaugh. However, there are two approaches to reduce the amount of paper towels
sent to the landfill. The first option would be to remove paper towels dispensers from the restrooms
and replace them with new efficient hand dryers. This alternative would actually eliminate the waste
stream altogether although there would probably be a high capital cost but may pay off in the long run
by eliminating the need to buy paper towels for restrooms and to pay to dispose of them in the landfill.
A cost analysis would need to be done to determine the feasibility of this. The other alternative would

26
be to compost the paper towels in a separate special bin to collect paper towel waste in restrooms. A
group called “Partners for a Green Hill” has deployed this waste management strategy in Canadian
government building restrooms to reduce paper waste in landfills and provide mulch and compost
material for land use. K-State currently has a composting facility at the North Farm. It may be possible
to compost the paper towels at the farm instead of disposing them at the landfill.
Recommendation #5
Participate in local electronic recycling programs that can reuse end of life electronics. The following
electronic wastes can be recycled locally: computers, monitors, cell phones, various type batteries, light
bulbs, office [http://search.earth911.com/?what=Electronics]
Recommendation #6
Replace non-recyclable products with sustainable materials. The following materials have recyclable or
more sustainable replacements:
● Sytrofoam lunch containers with biodegradable clamshells
● Dioxin produced napkins with recycled unbleached napkins
● Plastic beverage bottles with aluminum cans
Recommendation #7
Further invest and encourage support for on-campus environmental biotechnologies such as the green
roof garden on Seaton Hall and the bioretention pond at the International Student Center rain garden.
Toxic wastes can be mitigated from waterways by incorporating these ‘clean’ technologies with future
construction and landscaping projects. Professor Lea Skabelund (Landscape Architecture) is a
recommended “steward of the campus” for consulting sustainable landscape design based on his work
on the previously mentioned projects and his life’s career in environmental stewardship. Dr. Alok
Bhandarhi (Civil Engineering) is a recommended contact for his research on bioremediation and other
biotechnologies.
Recommendation #8
Education and awareness is probably the most important factor to increasing recycling rates on campus.
If people don’t realize the importance of recycling, then they aren’t going to take the time to recycle.
The biggest challenge is going to get people to change their habit. Once the habit of throwing trash
away is broken, then recycling becomes easy and rates will increase dramatically. The million dollar
question is how to get people to break the bad habit of throwing everything away. Once administration
realizes the importance of recycling and breaks the habit, then they can set an example for the rest of
campus by providing more resources and awareness. Students have always been a crucial part to
recycling at K-State. If enough students promote the cause of recycling, we think it will have a positive
effect on the rest of campus since students are the majority on campus.

27
References
CalRecycle. (2002). Case Study: San Francisco Fantastic Three Program. Retrieved Apr. 22, 2011, from
http://www.calrecycle.ca.gov/LGCentral/Library/innovations/curbside/CaseStudy.htm
Cascadia Consulting Group. (2009). California 2008 statewide waste characterization study. California
Environmental Protection Agency: CalRecycle Publications
United States Environmental Protection Agency. (2002). Municipal solid waste in the united states
(EPA530-R-02-001)
Environmental Protection Agency (EPA). (2008). SW-846 online: Testing methods for evaluating solid
waste, Physical/Chemical methods.Office of Solid Waste.
Environmental Protection Agency (EPA). (2010). Municipal solid waste in the united states: 2009 facts
and figures. No. EPA530-R-10-012).Office of Solid Waste. Retrieved from
http://www.epa.gov/osw/nonhaz/municipal/pubs/msw2009rpt.pdf
Goodman, Tim,. Minnesota Pollution Control Agency. (2006). Single-stream and Dual-stream recycling:
comparative impacts of commingled recycables processing. St Louis Park, Minnesota. Retrived
from http://www.pca.state.mn.us/index.php/view-document.html?gid=11247
Greening the Hill- Paper Towel Composting Program. Partners for a Green Hill. http://greenhill-
collineverte.parl.gc.ca/communications/PaperTowel-e.asp?Language=E%3fLanguage
Michigan Department of Environmental Quality. (2006). Waste management guidance: Waste
characterization. Lansing, MI: Waste and HAzardous. Retrieved from
http://www.deq.state.mi.us/documents/deq-ess-p2tas-wastecharacterization.pdf
Scozzafava, Lori,. Solid Waste Association, Envrionmental Protection Agency . (2008). To single stream or
not to single stream? Philadelphia, PA: Government Printing Office . Retrieved from

28
http://www.epa.gov/reg3wcmd/urban2007/SingleStreamRecyclingPresentationSWANA_Jul07.pd
f \
Smyth, Danielle P., Arthur L. Fredeen, and Annie L. Booth. "Reducing Solid Waste in Higher Education:
The First Step Towards a~greening' a University Campus." Resources, Conservation and Recycling
54.11 (2010): 1007-16. Print.
Vega, C., S. Ojeda Benitez, and MaE Ramirez Barreto. "Solid Waste Characterization and Recycling
Potential for a University Campus." Waste Management (2008): Vol. 28, p. Print.