Embed Size (px)
Citation preview
ZAZ 0802
Waste and Environmental Management for Nypro, Inc
A Major Qualifying Project
Submitted to the Faculty
Of the
WORCESTER POLYTECHNIC INSTITUTE
In Partial Fulfillment of the requirements for the
Degree of Bachelor of Science
By
__________________________
Benjamin Cote
Date: September 5, 2008
Approved:
__________________________
Professor Amy Zeng, Primary Advisor

2
Table of Contents
Table of Contents........................................................................................................................2 Table of Figures ..........................................................................................................................3 Abstract ......................................................................................................................................5 Acknowledgements.....................................................................................................................6 1. Introduction...........................................................................................................................7 2. Company Profile ...................................................................................................................9 3. Literature Review................................................................................................................11
3.1. Six Sigma: DMAIC ......................................................................................................11 3.2. Benchmarking ..............................................................................................................13 3.3. Interviewing .................................................................................................................13
4. Methodology.......................................................................................................................14 5. Resin Analysis.....................................................................................................................15
5.1. Define ..........................................................................................................................15 5.2. Measure........................................................................................................................16 5.3. Analyze........................................................................................................................26 5.4. Improve........................................................................................................................29
6. Water Use Analysis .............................................................................................................32 6.1..Industrial Water............................................................................................................32 6.2. Domestic Water............................................................................................................40
7. Electrical Use Analysis........................................................................................................43 7.1. Lighting Systems..........................................................................................................44 7.2. Air Conditioning ..........................................................................................................59 7.3. Barrel Blanket Case Study............................................................................................60
8. Recommendations ...............................................................................................................62 9. Implementation ...................................................................................................................64
9.1. Immediate Implementations..........................................................................................64 9.2. Short-term Implementations .........................................................................................64 9.3. Long-term Implementations..........................................................................................64
10. Future Work........................................................................................................................66 Bibliography .............................................................................................................................68

3
Table of Figures
Figure 1: Methodology..............................................................................................................14
Figure 2: Current resin waste stream in Nypro Tianjin...............................................................18
Figure 3: Current resin waste stream in Nypro Shenzhen...........................................................19
Figure 4: Current resin waste stream in Nypro Guangzhou........................................................20
Figure 5: Total amount (kg) of resin waste produced (2008)......................................................21
Figure 6: Information about regrind machines in Nypro Shenzhen ............................................21
Figure 7: Nypro Guangzhou painting fixture resin usage (kg)....................................................23
Figure 8: Nypro Guangzhou painting fixture resin usage (kg)....................................................24
Figure 9: Resin Differences of 3 facilities..................................................................................26
Figure 10: Resin Similarities of 3 facilities................................................................................26
Figure 11: Responses of market survey .....................................................................................28
Figure 12: Comparison of three ways to obtain painting fixture.................................................31
Figure 13: Cost to Deal With Water Waste................................................................................33
Figure 14: Cooling Tower Water Usage ....................................................................................38
Figure 15: Nypro Shenzhen Cooling Tower ..............................................................................39
Figure 16: Nypro Guangzhou Cooling Tower............................................................................40
Figure 17: Normal and Conservational Tap Usage.....................................................................40
Figure 18: Rooftop Rainwater Recapture system in Kansas City...............................................42
Figure 19: Average Rainfall per Year........................................................................................42
Figure 20: Electrical Use & Cost of Nypro China......................................................................43
Figure 21: Nypro Electricity Waste ..........................................................................................44
Figure 22: Different Types of Lamps Used in Facilites..............................................................45
Figure 23: Comparison Between TLD and T5 ...........................................................................46
Figure 24: Use of Men’s Room .................................................................................................49
Figure 25: Usage Ratio Statistic for Men's Room ......................................................................50
Figure 26: Use of Women’s Room ............................................................................................51
Figure 27: Usage Ratio Statistic for Women’s Room.................................................................52
Figure 28: Utilization Rate of Bathroom....................................................................................53
Figure 29: Frequency of People Passing The Hallway ...............................................................54
Figure 30: A Typical Seating Layout.........................................................................................56
Figure 31: Assembly Line in Nypro Guangzhou Molding I .......................................................57

4
Figure 32: Layout 1 Before .......................................................................................................58
Figure 33: Layout 1 After..........................................................................................................58
Figure 34: Layout 2 Before .......................................................................................................58
Figure 35: Layout 2 After..........................................................................................................58
Figure 36: Green L49/B ............................................................................................................59
Figure 37: Exposed Molding Press Barrel .................................................................................61
Figure 38: Barrel Blanket ..........................................................................................................61

5
Abstract
In this project it was our goal to identify ways in which Nypro China could reduce its
impact on the environment while producing a cost savings. While observing the company’s
green initiative we took a number of steps to identify waste streams within Nypro China. Each
of these waste streams: Resin, Water, and Electricity all yielded a cost savings through short-
term and long-term goals with the company. These goals were realized with the use of the Six
Sigma: DMAIC process to help Nypro China reduce its impact on the environment and produce
a considerable cost savings.
6
Acknowledgements
We would like to express our thanks to our advisor, Dr. Amy Zeng, for her help and
advice throughout this project. We would also like to thank Professor Rong for all of his
guidance while we worked in China. Also we are very grateful for the help from our liaison to
Nypro China, Ronald Alciati, we could not have come to the conclusions we did without his
expertise. Finally we would like to express our gratitude to all of Nypro China for their
hospitality and guidance throughout our entire project.

7
1. Introduction
In this age there are a number of companies that have found the value in having an
environmentally friendly company. There is more to being conscious of the environment than
just saving a few trees. There can be considerable cost savings and other benefits of an analysis
of a company’s waste streams. In our project we focused on the improvement three different
waste streams that Nypro China produces throughout the three different plants that we observed.
The first of these three waste streams is the resin waste stream. In this stream there are
a number of resin byproducts that are produced. There are runners and defects that must be
disposed or sold. It is in this process that there are a number of potential improvements that have
been identified.
The second of the three waste streams is that of water use in Nypro China. This
includes both industrial water use and domestic water use. Industrial Water is defined as water
that is used in the manufacturing process, e.g. cooling the molding machines and in the painting
baths. Domestic water is defined as water that is used for sanitary purposes in people’s daily
lives, e.g. bathrooms. Both types of water give us significant areas to identify for improvement.
The final waste stream is electrical use. Nypro China uses a multitude of electricity in a
number of areas. The first is the lighting systems that are employed throughout each of the
facilities. The next area that could see significant improvement is the air conditioning use
throughout each of the facilities. The final area in the electrical waste stream is the use of barrel
blankets on the plastic injection molding machines.
In this project it is important that we identified different types of waste in Nypro China.
We also must understand the current practice and define our problem. This will require us to
determine the scale of each type of waste. Overall our first goal is to determine ways and

8
methods to improve Nypro China’s impact on the environment. We would also like to generate a
cost savings of at least $150,000 through improvements made.

9
2 Company Profile: Nypro
Nypro operates 52 companies in 17 countries providing precision plastics injection
molding, design and engineering services, and related manufacturing solutions. As a leading
global precision molder, Nypro provides its world-class service to a variety of successful markets
that need precision plastics molding, including Electronics/Telecommunications and
Consumer/Industrial in the Consumer & Electronics Segment, Packaging, Healthcare,
Automotive and Contract Manufacturers.
� Electronics and telecommunications: Nypro offers product design, mold building, precision
injection molding including decorating and contract manufacturing services for electronic
components, business equipment & peripherals, telecommunications and consumer
electronics manufacturers.
� Packaging: Nypro offers a wide range of packaging contract manufacturing services,
including household, food and beverage, medical device/pharmaceuticals and personal care
packaging products. Because it can be non-economical to ship packaging long distances,
Nypro packaging facilities are located all around the world.
� Automotive: Nypro precision molds a wide variety of automotive interior and under-the-
hood components, including decorative interiors, safety restraints and precision functional
applications such as electronic controls. Nypro coordinates its global automotive operations
out of a new, automotive Operations Center in Michigan.
� Healthcare: Nypro develops and manufactures precision plastics products for diagnostic,
drug delivery and general medical applications. Nypro has been a major plastics healthcare
molder for virtually all of the company's 50 years, and was the first molding company in
10
history to make plastics healthcare parts in clean rooms.
Nypro China is made up of four different facilities. These are Nypro Tianjin, Nypro
Shenzhen, Nypro Guangzhou, and Nypro Suzhou. Nypro Shenzhen and Nypro Tianjin are the
largest of the four facilites which focus on telecommunication. Nypro Suzhou and Nypro
Guangzhou are both smaller with focus on more than just the telecommunication industry.
Nypro is one of the largest employee-owned companies. Nypro has great relations with
its customers in order to provide a superior part. Nypro is commited to success with their
customers and this is seen throughout ever facility and in their motto of “we’ll be there with
you.”

11
3 Literature Review
In this section of the report we review lean thinking methods along with other methods for
collecting data. These methods are used within the workplace to help identify problems and
work on solutions.
3.1 Six Sigma: DMAIC
Six Sigma is a management strategy that is employed by companies across the world.
One of the main methodologies that six sigma employs is the use of DMAIC. DMAIC is defined
loosely in five different steps.
“In the Define phase, the Six Sigma project team identifies a project for
improvement based on business objectives and the needs and requirements of the
customers. Six Sigma is about “solving a problem with an unknown solution.” To
unearth the solution, the problem needs to first be defined in concrete measurable
terms. The team identifies critical-to-quality (CTQ) characteristics that have the
most impact on quality–separating the “vital few” from the “trivial many.” With
the CTQs identified the team can create a map of the process to be improved with
defined and measurable, deliverables, and goals.
In the Measure phase, the team begins with the proper metrics. Critical
measures that are necessary to evaluate the success of the project are identified
and determined. The initial capability and stability of the project is determined in
order to establish a measurement baseline. Valid and reliable metrics to monitor
the progress of the project are established during the Measure phase; input,
process, and output indicators are identified. Once the project has a clear
definition with a clear measurable set of indicators, the process is studied to
determine the Key Process Steps and an operational plan defined to measure the
indicators. Potential impacts on CTQs from each input are considered with respect
to the defects currently generated in the process. Key Inputs are prioritized to
establish a short list to study in more detail and to determine the potential ways

12
the process could go wrong. Once the reasons for input failure are determined,
preventative action plans are put into place.
Through the Analyze phase, the team can determine the causes of the
problem that needs improvement and how to eliminate the gap between existing
performance and the desired level of performance. This involves discovering why
defects are generated by identifying the key variables that are most likely to create
process variation. As the Six Sigma team moves through the Analyze stage and
subsequent Improve stage of the process they will discover various process
improvement scenarios and determine which has the best net benefit impact to the
company. A common error people make when they discuss Six Sigma is thinking
that the DMAIC process takes too long to achieve improvements. This is far from
the truth. Quick improvements are often achieved early in the project and
frequently already implemented by the time the team reaches the Analyze phase.
If the team has not already identified major improvements, then the breakthrough
often results from careful process analysis with data. Six Sigma analysis
techniques are valuable tools to uncover more difficult solutions.
The Improve phase is where the process transitions into solutions. Critical
inputs have been verified and optimized toward nailing down the problem causes.
Once problem causes are determined in the Analyze phase, the team finds,
evaluates through testing, and selects creative new improvement solutions. The
team identifies and quantifies what will happen if needed improvements are not
made and what will happen if the improvements take too long. This develops a
cost/benefit analysis. More often than not simple process experimentation and
simulation bring the team big gains in this step. Also at the Improve stage, the
team develops an implementation plan with a change management approach that
will assist the organization in implementing and adapting to the solutions and the
changes that will result from them.
Success in the Control phase depends upon how well the team did in the
previous four phases. The keys are a solid monitoring plan with proper change
management methods that identify key stakeholders. Lessons learned are now
13
implemented and tools are put in place to ensure that the key variables remain
within the acceptable ranges over time so that process improvement gains are
maintained. The team develops a project hand off process, reaction plans, and
training materials to guarantee performance and long-term project savings.
Documenting the project is very important so that the new procedures and lessons
learned are maintained and provide concrete examples for the organization. At the
close of the Control phase, ownership and knowledge is transferred to the process
owner and process team tasked with the responsibilities. Finally, the team
identifies what the next steps are for future Six Sigma process improvement
opportunities by identifying replication and standardizations opportunities and
plans.” (Peterka)
These steps need to be shared with the team as a whole with the lessons learned being
spread throughout the organization. The process of DMAIC should not be isolated and be such
that it is not the end but just the beginning.
3.2 Benchmarking
There are many different ways to compare two companies. Benchmarking is a tool by
which you can compare one company to another. There can be a multitude of things with which
the company is compared; whether it is cost, time, quality, or even layouts.
3.3 Interviewing
Interviewing is the process by which an interviewer obtains information from an
interviewee. Questions must be formatted in such a process that all the information that is
required is obtained without going off topic.

14
4 Methodology
Figure 1: Methodology
Meet with Nypro China
team and define the
waste streams
Define the goals of the
resin waste stream
Define the goals of the
water waste stream
including industrial and
domestic water
Define the electrical
waste streams which
include lighting systems,
AC use, and barrel
blankets
Measure industrial
water use through
interviews done.
Analyze information
about domestic waste
water systems
Measure the data that
is collected from
interviews within the
resin waste Stream
Analyze the information
gathered using market
research and
benchmarking
Measure the use of
electrical systems
through interviews and
observations
Analyze industrial water
systems using outside
sources and
benchmarking
procedures
Analyze information
from electrical waste
stream using
benchmarking and
outside sources
Propose improvements
in the electrical wate
stream to Nypro China
Propose improvements
of the water stream to
Nypro China
Propose improvemtnes
to Nypro China about
the resin waste stream

15
5 Resin Analysis
Nypro China is a company that major in producing plastic-injection molding with resin
material. However, during the injection process, runners are created as bi-product. And defects
are unavoidable through the whole production line. Therefore, how to deal with resin waste
reflects the level of management system in Nypro. And we found out that Nypro left us a big
room for improvement. According to the requirement of Nypro, we have to accomplish our work
following DMAIC (Define, Measure, Analyze, Improve, and Control) steps, in which Control
should be executed by Nypro itself.
First, we want to introduce several terms in this stream.
Resin waste is resin bi-product from production line, including runners and defects. Resin
regrind is resin waste that has been ground, the same as runner regrind and defect regrind. The
regrind machines are machines used to regrind resin material.
5.1 Define:
During our tour of Nypro facilities, we find that the 3 facilities in Tianjin, Shenzhen, and
Guangzhou all deal with resin waste differently. For instance, some facilities regrind part of the
resin material, some regrind all; some facilities use a third party company to make painting
fixtures, some create by themselves, and the last one buys new ones from the outside. Due to
different ways that Nypro treats the resin waste stream, the amount of money spent on these
streams differs as well. Therefore we have identified the resin stream, compared and evaluated
the 3 facilities, and then proposed solutions.

16
5.2 Measure:
In this step, we collected information interrelated to resin waste stream. Considering the
time and energy limitation, data we placed here and sited in the analyze step may not be
convincible enough, but shows a progress, which Nypro China can follow to gather complete
data, do specifically calculation, and propose precise solutions.
After touring 3 facilities in Nypro China, we identified the resin waste progress and drew
figures 2, 3 and 4, which show the current resin waste stream in Nypro Tianjin, Nypro Shenzhen
and Nypro Guangzhou.
We can see that in each facility, the resource of resin waste can be defects and runners,
and the end of each stream can be selling the product, outsourcing painting fixture, selling resin
waste, or in-house painting fixture. Comparing the 3 flow charts, it is easy to realize that Nypro
Tianjin owns a very complex resin waste stream, which may cause disorganized management.
In Nypro Tianjin, the facility uses a third party company to remanufacture painting
fixture, and they regrind part of resin waste material in order to match the output of outsourcing
under the scheduling of purchasing department. On the other hand, warehouse in Nypro Tianjin
is not big enough to store large amount of non-regrind resin waste, thereby, they also regrind
some resin to resolve space limitation. However, employees we interviewed cannot tell the exact
guidelines to regrind, and cannot explain why they outsource and sell both regrind resin and non-
regrind..
In Nypro Shenzhen, the facility cannot find a third party company to recreate painting
fixture; therefore they purchase new ones from outside vendors. Dealing with resin waste, they

17
just regrind all and sell, which is very simple. Employees told us the reason for regrinding all the
resin material was easy shipping.
In Nypro Guangzhou, they regrind all resin waste like Nypro Shenzhen, but they
remanufacture painting fixtures by themselves using certain kinds of resin waste material
(PC/ABS) and machines that produce regular production. If size up resin is finished up, they
would purchase extra painting fixture from outside.

18
PURCHASE
VIRGIN
METERIAL
MASK
FIXTURE
FINISHED PRODUCT
COLLECTION
INSPECTION
SELL
20%
MASK
FIXTURE
3rd PARTY
PROCESS
SELLING
PRICE
PURCHASING
PRICE
PROCESSING
PRICE
PAINTING
PC/ABS YES
SEMI-
PRODUCTYESREGRIND
PURCH
ASING
SPACE ALLOWDED
REGRIND
YES
WAIT
START
END
END
Figure 2: Current resin waste stream in Nypro Tianjin

19
PRODUCT
DEFECT
RUNNER
Figure 3: Current resin waste stream in Nypro Shenzhen

20
START
PURCHASE
VIRGIN
METERIAL
FINISHED
PRODUCT
COLLECTION
INSPECTION
PURCHASING
PRICE
END
GRIND
PC/ABS of
RUNNERYes
FIXTURE USING
SCHEDULING
PAINTING
FIXTURE
IF MATERIAL NOT
ENOUGH
SUPPLIER
SELL
SELLING
PRICE
WAIT
END
Figure 4: Current resin waste stream in Nypro Guangzhou
To help better understand the resin waste stream, we also collected relative data to aid in
analysis and calculation. This helped our team figure out better ways for the three facilities to
better deal with resin waste.
Tianjin Shenzhen Guangzhou
Jan 30,464 34,421
Feb 33,259 21,049

21
Mar 37,036 33,045
Apr 32,697 35,388
May 50,556 26,255 32,996
Jun 30,535 38,575
Average 36,802 28,395 32,579
Figure 5: Total amount (kg) of resin waste produced (2008)
We collected the resin waste output amount from the three facilities. After grouping and
calculation, we created figure 5. Due to limited time, we were not able to get all the data. Based
on the available data, we can see that the average amount is around 35,000kg per month and the
largest data presented is around 50,000kg.
In addition, we are informed that the workload of each machine can be 100 to 200 kg per
hour, which means 2 machines works 10 hours per day can handle at least 2*10*100*30=6000kg
in one month. This output is bigger than the largest data available, and 10 hours is not the full
workload of each machine, therefore, we can confidentially conclude that 2 machines in each
facility can regrind all resin waste.
Asset No. Brand Location Model Power
MO-MA-003
�� 2� 4���� PDMA002 7.5KW
MO-MA-004
�� 2� 4���� PC-5 N/A
MO-MA-005
�� 2� 4���� PDMA004 4KW
MO-MA-007
�� 2� 4���� PDMA006 N/A
22
MO-MA-023
�� 2� 4���� CAZ 15KW
MO-MA-027
�� 2� 4���� HG-15HP 11KW
MO-MA-030
�� 2� 4���� 15P 7.5KW
MO-MA-034
��������
��,72344-����������
����
2� 4���� TTD-150 11KW
MO-MA-002
�� 7� 1���� PDMA001 7.5KW
MO-MA-025
�� 7� 1���� CAS-42M 15KW
MO-MA-026
�� 7� 1���� HG-15HP 11KW
MO-MA-028
�� 7� 1���� HG-15HP 11KW
MO-MA-035
��������
��,72589-����������
�
�������� PC-500 11KW
MO-MA-024
�� �������� CAS-42M 15KW
MO-MA-031
�� �������� 8P 4KW
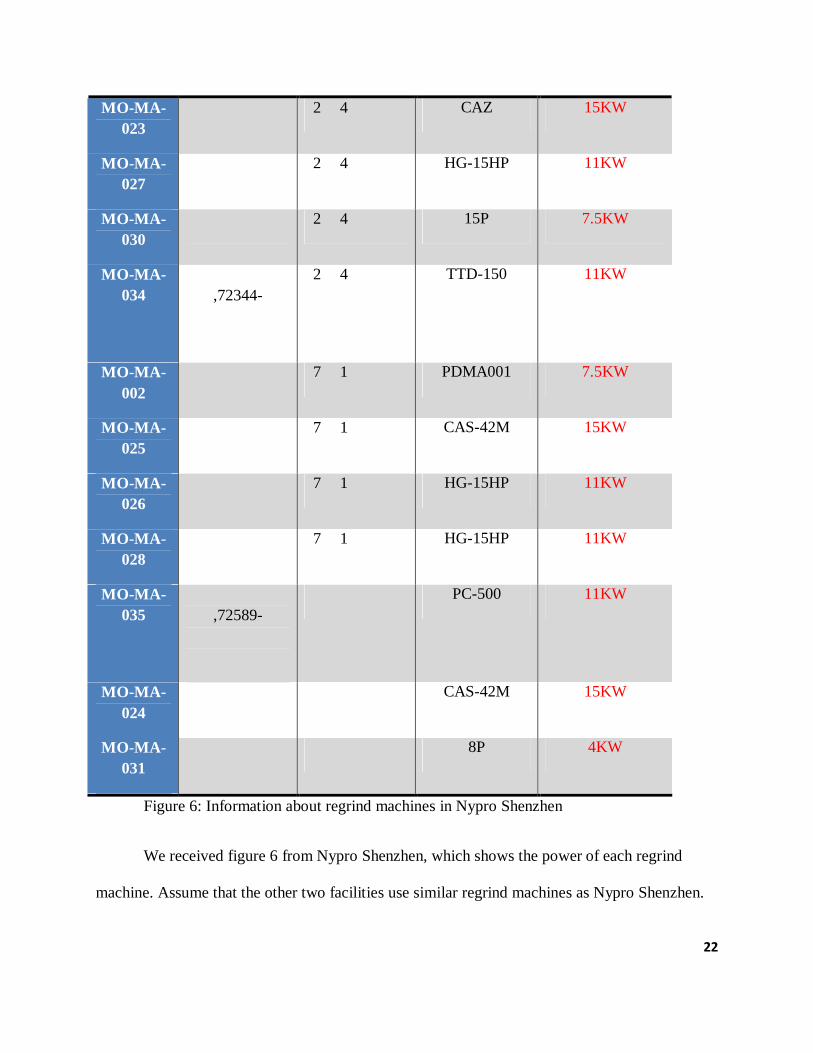
Figure 6: Information about regrind machines in Nypro Shenzhen
We received figure 6 from Nypro Shenzhen, which shows the power of each regrind
machine. Assume that the other two facilities use similar regrind machines as Nypro Shenzhen.

23
Combining the largest power 15kw and the workload of each regrind machine that is 100-
200kg/hr, we can infer that at most 15/100=0.15kw*h electricity consumption is required to
regrind one kilogram resin material. Using the average amount of resin output, we can calculate
that 0.15*35,000=5250kw*h is required in one month.
Nypro Guangzhou uses resin waste to create its own painting fixtures in house. From
Figure 7 and 8, we can see that generally 20% to 30% of total resin waste is used to
remanufacture painting fixtures in Nypro Guangzhou, which is a large amount of consumption.
We need to know how much money is spent on painting fixtures in Nypro Tianjin and Nypro
Shenzhen.
Total amount of resin waste Resin that used for painting fixture
Jan 34,421 9,300
Feb 21,049 5,625
Mar 33,045 7,550
Apr 35,388 9,550
May 32,996 6,975
June 38,575 7,605
Average 32,579 7,767.5
Figure 7: Nypro Guangzhou painting fixture resin usage (kg)

24
Figure 8: Nypro Guangzhou painting fixture resin usage (kg)
In Nypro Tianjin, the third party company collects used painting fixtures in Nypro, cleans
them carefully, regrinds them, and then mixes certain percentage resin regrind to create new.
Nypro Guangzhou uses one type of resin regrind (like PC/ABS) to create painting fixtures.
Basically in house manufacturing can satisfy the requirement of painting fixtures. However, is
this cost effective for Nypro to use their machines to create painting fixtures.
We also have come up with more observations associated with the resin waste stream
First, we observed 3 facilities, and found out that there always is 1 supervisor and 2
workers in one regrinding room, which means no matter how much is needed to regrind the labor
force is always capable.
Second, we were told that the majority cost of maintenance for regrind machine is
replacing cutting tools. The reality is that even in Nypro Shenzhen, where they regrind all resin
27% 27% 27% 23% 21% 20%

25
waste, cutting tools are required to be replaced only once a year. There can be seldom accidents
that can break cutting tools. In conclusion, maintenance of regrind machine can be omitted.
Third, when we asked one supervisor in Nypro Shenzhen about the depreciation of
regrind machines. He told us that depreciation of regrind machine is too little to be count,
because he has been in Nypro Shenzhen for more than 5 years, and has never seen those
machines replaced. He also doesn’t believe that they should be substituted soon.
Fourth, the ways regrind machines are separated in each facility are different as well.
Nypro Tianjin separates them by the department where resin outputs, like molding and painting.
In NSZ and NGZ, they separate them at a more detailed level that is by the type of resin material
like PC/ABS, PMMA, POM etc.
Fifth, because of the distinct scale of regrind resin waste, shipping frequency of resin
waste differs also. NTJ ships once a week, NSZ once a month, and NGZ every one and a half
months.
Sixth, as we mentioned before, space problem exist in Nypro Tianjin. We have informed
that there can be 20 plates in the warehouse, and 150kg non-regrind resin or 1,000kg regrind
resin can be hold by one plate, which means, at most 3,000kg non-regrind resin and 20,000kg
regrind resin can be stored in the warehouse. Referring to the total amount of resin waste, space
problem would no longer exist if Nypro Tianjin reground all resin waste.
Finally, people use paper bags to hold regrind resin waste, which can be used time by
time. Nevertheless, Nypro Tianjin deal with non-regrind resin waste using plastic package that is

26
one time use only. At the same time, we have seen some tracks on the road, shipping non-regrind
resin waste without plastic package, using ropes only.
5.3 Analyze:
After the visit to Nypro China, we compared the 3 facilities, and created a comparison
table. (See figure 9 and 10)
Differences Tianjin Shenzhen Guangzhou
Painting fixtures use a third party purchase from
outside remanufacture by
themselves
Scale of regrind part all all
Frequency to ship resins
1/4 month one month 1.5 months
Separation of regrinding machine
department where resin outputs
type of the resin material
type of the resin material
Figure 9: Differences of 3 facilities
Similarities All Facilities
Regrind Requirement all the defects
different materials sell for different prices Selling price of resin
waste no relationship with whether or not it is reground
Figure 10: Similarities of 3 facilities
There are similarities that exist in the resin waste stream. As the figure 10 shows, in each
facility, defects are already ground to protect the right of customers. The selling price of the resin

27
depends on the type of materials (Referring to figure 10) for example, transparent material can be
sold at a higher price, POM deserves slightly more than PC. We want to emphasize that we are
told that the selling price is independent of whether or not resin is reground, especially in NTJ,
they sell and outsource resin regrind and non-regrind for the same price.
The aspects of regrind scale, selling price of resin waste and separation of regrind
machines, how the 3 facilities deal with resin waste is different; however, which way is the most
cost effective? Is there any difference between regrind and non-regrind resin material? What
kind of resin material is need by the market? These questions created the need for a market
survery.
We randomly chose several companies that collect resin waste from the internet. The
responses of market survey are shown in figure 11. Using PC/ABS as an example, some
companies (Type A) said ground and pure resin is more valuable, and the price can be $0.04 to
$0.14 higher per kg, and they all emphasized that we should keep resin pure enough. What’s
more, they pointed that mixed resin material is worthless. Some companies (Type B) told us that
they would pay either type of resin at the same price, because they do not trust temporary
customers and want to separate resin by themselves to guarantee the purity of resin material. And
there is one buyer (Type C) that said he doesn't care the purity or regrind or not, because the
company is not major in resin collection, how they deal with resin is mixing, regrinding, and
then selling resin to others.
Number of
Regrind material Sells
Increased value after
Note

28
companies for More? regrind
A 5 Yes $0.04~$0.14 Pure regrind has a greater selling
price than mixed
B 3 No -- Requires purity and customer
relations
C 1 No -- Not a major resin purchaser,
condition doesn’t matter
Figure 11: Responses of market survey
From the market survey, we can see that the majority of collector (Type A) prefer pure
material and then consider regrind or not to increase price. Although some of them (Type B)
would pay either type of resin material at no price discrimination, they actually want to keep the
purity by themselves, even if losing some benefit from regrind. In addition, as we mentioned
before, Nypro Tianjin sells resin waste at the same price no matter whether it is ground or not,
which matches the C type response very much. Thus, we infer that Nypro Tianjin may use a non-
professional company to deal with resin waste. We can conclude that resin collection companies
focus on pure material first and then prefer regrind. Therefore if Nypro can find a right company,
provide the pure resin regrind and establish stable relationship with the company, then Nypro can
obtain a higher selling price. How can Nypro keep the purity of resin waste? Nypro facilities use
different ways to separate regrind machines, which lead to different level of resin purity. We do
not know if the detailed level separation like Nypro Shenzhen and Guangzhou do can satisfy the
demand of market.
Combing the result of the market survey we did and the reality of Nypro China the core
demand of market is purity. Nypro is providing some regrind and some non-regrind material. We

29
don’t know if Nypro can fulfill the purity requirement from customers. However, the problem is
Nypro is only considering how to handle resin waste from “inside”, for instance, space limitation,
purchasing department scheduling, easy shipping, and so on. They should consider how to sell
resin waste from the aspect of customer. Nypro should reconsider how to deal with resin waste.
5.4 Improve:
Based on the measure and analyze steps, we can summarize 3 implications. First: Each
facility has the capacity to regrind all waste resin material. (2 machines works 10 hours per day
can handle 60,000kg resin material which is larger than the largest number available, and there
are more than 2 regrind machines in each facility) Second: separating resin at detailed level can
sell for a good price. The Third one we considered as a future study about painting fixture. There
are 3 options for getting painting fixtures: in-house manufacture, using a third party and
purchasing from outside. The question is which one is the best?
Based on the first implication, we propose Nypro China, especially Nypro Tianjin to
regrind all resin waste for a higher selling price. Doing so may bring more electricity
consumption; using Tianjin’s price ($0.1 per unit) and what we calculated before (0.15kw*h per
kg), 0.1*0.15=$0.015 are required to regrind one kilogram resin material. Although cost little
referring to the second and third observations, maintenance and depreciation should be
considered as well. Advantages of executing such recommendation can be firstly gain revenue
for Nypro China. Taking off electronic consumption, using the price increase in the market
survey, and average resin output (35,000kg per month), we can calculate that: Nypro can obtain a
profit of approximately (0.04~0.14-0.015)*35,000*12=$10,500~$52,500 per year in one facility.
30
Secondly, based on our first observation, no additional labor force is need. The third advantage is
to simplify the management system. As we mentioned before, the guidelines of regrinding resin
waste are not clear, which lead to the complex and confused management. Doing so, no
purchasing department scheduling and space limitation exist. With these changes we can
improve the environmental condition as well. Referring to the fifth observation, shipping
frequency can be decreased by regrinding all resin material, along with reducing pollution of
vehicles, like waste gas and petroleum consumption. A final observation, Nypro can use reusable
paper bags to hold resin regrind. All of these either produce cost savings or a positive impact on
the environment.
What we have emphasized is that pure material is the core demand of market, therefore,
purity will bring extra benefit to Nypro. They should separate resin material at detailed level.
More regrind machines are required to separate different kinds of resin waste to keep it pure.
Simultaneously, more space may be needed to place those extra regrind machines.
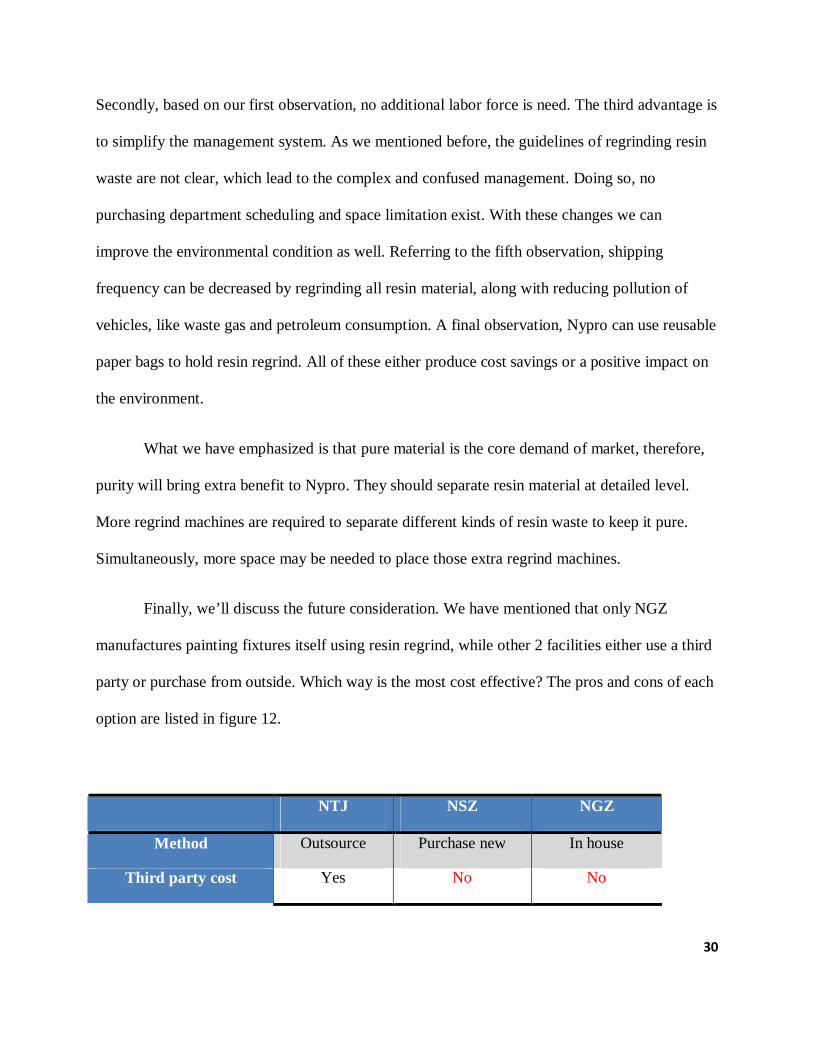
Finally, we’ll discuss the future consideration. We have mentioned that only NGZ
manufactures painting fixtures itself using resin regrind, while other 2 facilities either use a third
party or purchase from outside. Which way is the most cost effective? The pros and cons of each
option are listed in figure 12.
NTJ NSZ NGZ
Method Outsource Purchase new In house
Third party cost Yes No No

31
Purchasing cost No Yes No
Production cost No No Yes
Loss of opportunity cost No No Yes
Packaging usage High High Low
Shipping High High No
Figure 12: Comparison of three ways to obtain painting fixture
In order to continue this issue, we should collect interrelated data including cost of
purchasing new fixtures and third party fixtures, price of selling resin which are used to
remanufacture fixtures, price of selling used fixtures, cost of remanufacturing fixtures in house,
and other costs and expenses. After gathering data we need, we should identify the exact pros
and cons of each option and offer weight to each column to figure out the best way of getting
painting fixtures. We should be able to identify the benefit, feasibility and pay back time for
Nypro China to expand the best method to other facilities.

32
6. Water Analysis
Water is used in many places throughout the different Nypro China facilities. The water
waste stream can be divided into two different streams, industrial and domestic water. Industrial
water is defined as water that is used in the manufacturing process, e.g. cooling the molding
machines and in the painting baths. Domestic water is defined as water that is used for sanitary
purposes in people’s daily lives, e.g. bathrooms.
6.1 Industrial water use
6.1.1Water recycle system
The industrial waste is composed of both solid and liquid. The solid waste is also called
dangerous material which includes all kinds of solid waste with dangerous chemicals. The solid
waste usually comes from the painting process. During painting process, there are some solid
waste paint blocks floating in the painting bath water tanks because of reusing of the water.
Workers in the painting room need to scoop out them and put them into dangerous waste
containers. When the water is too dirty to use again, workers empty and clean the tanks. The
dirty water and water for cleaning that goes through pipes to other container is one kind of the
so-called liquid waste.
There are different ways to handle water waste in the 3 facilities we have visited. In
Nypro Tianjin, there is no equipment to dispose industrial waste water, so they sell the solid and
liquid waste to a 3rd party. In Nypro Guangzhou, they are doing in the same way but the quantity
is much smaller. In Nypro Shenzhen, there is a water recycle system with which industrial waste
water can be handled and reused and only solid waste need to be delivered to 3rd party company.
This section of the report presents a detailed explanation of the steps we followed using
the six sigma problem-solving strategy—define, measure, analyze, improve, and control—to find

33
out why each facility uses different ways to dispose industrial waste and determine the effect of
each way.
Define
As mentioned before, during our visit of the 3 facilities, we find that every facility
decides how to deal with the industrial waste individually. As a result, the spending on disposing
industrial waste is very different. Our group is asked to determine the potential waste in every
approach.
We defined that there are different ways which facilities of Nypro are disposing industrial
waste in and cause different effects and spending. One of the different ways would be a potential
to save money if applied to other facilities.
Measure
We collected information and data from different facilities about the quantity and price of
solid and liquid waste. Surprisingly, the cost of each facility for disposing industrial waste is
much different.
Nypro Tianjin Nypro Shenzhen Nypro Guangzhou
Cost to deal with industrial waste
$0.43 per kg $0.16 per kg
Quantity 420,000 kg per year
10,000 kg per year
Total cost Approx $171,430 per year
$860 per year total
$1,600 per year
Water recycle
$52,570

34
system cost
Figure 13: Cost to Deal With Water Waste
From table 1.1, we can see that, Nypro Tianjin spends approx $170,000 per year to
dispose the two kinds of waste, which means $0.43 spent on every kilogram for around 400,000
kilograms. Nypro Shenzhen spends only $860 per year to dispose solid waste, but spends
$52,570 on installation cost of the system. Nypro Guangzhou spends approx $1,600 per year,
because the water output is smaller.
The water recycle system only exists in Nypro Shenzhen who spent $52,570 for building
and installation costs. But after that, only around $160 is needed for chemical additions and
electricity power.
According to requirement of Nypro, $150,000 should be saved through in the whole
project. Since water use is a significant large part of daily spending, a large amount of money
could be saved if special attention is paid to monitoring and advancing to fit the requirement.
Analysis
From a cost perspective, Nypro Tianjin needs to dispose of 420,000 kg solid and liquid
industrial waste. Depending on data from other facilities and techniques, most of the industrial
waste is liquid waste. At the same time, the liquid and solid waste are sold to a 3rd party at the
same price ($0.43 per kg is needed to pay for disposing). If the liquid waste can be reused, not
only can more water can be supplied for other systems, such as the cooling towers and injection
molding machines, but also a large amount of money can be saved.
In Nypro Guangzhou, $1,600 is spent for disposing the industrial waste. We were told
that the output of waste water there is much smaller than what is in Nypro Shenzhen, so they

35
don’t use any equipment to recycle industrial waste water. But there was a kind of water cleaning
system to fit the National Standard 2 for letting out. This water cleaning system is a potential to
be changed into another system because it’s near the plant and pipelines for delivering liquid
waste have existed.
Actually, this kind of system that can deal with liquid industrial waste has already been
using in Nypro Shenzhen. It’s called water recycle system which can clean and recycle industrial
waste water from painting process and others with chemicals. This system cost $52,570 for
building and installation. But after using this system, most of the water can be reused and only a
few tons of solid waste come with liquid waste should be disposed. Also, it doesn’t request a
special area. From what we know in Nypro Shenzhen, only around 50m2 is needed for the water
recycle system currently used. The water out from the water recycle system is even clean enough
to raise fish, which means it is also clean enough to fill the cooling towers, cool injection
molding machines, or even flush toilets.
Based on our study, if we want to analyze the savings for installing the water recycle
system in Nypro Tianjin and Guangzhou, first of all, we make two assumptions.
The first assumption is that the scale of the output is the same for each facility. With this
assumption, we could calculate the cost in the main by using the output of Nypro Shenzhen and
the paying for dealing with the solid waste as a standard. For example, we can suppose that if
Nypro Tianjin uses the water recycle system, the spending to handle the solid waste will be
related to the spending in Nypro Shenzhen (around $900 per year).
The other assumption is disposal costs are the same for Nypro Shenzhen and Nypro
Guangzhou. With this assumption, it’s easier to calculate the savings for Nypro Tianjin because
we don’t know the exact price for disposing the solid waste in Nypro Shenzhen. If we want to

36
analyze the potential savings for the 2 facilities, we also need to know the spending for disposing
when using the water recycle system. For example, the cost in Nypro Tianjin should be different
with in Nypro Guangzhou because the price for each kilogram in Tianjin is around 3 times as the
price in Guangzhou. So the spending for Nypro Tianjin should also be around 3 times as $860
per year.
From assumptions above, we can give our analysis. The saving should be calculated with
the function below.
Used spending without water recycle system – coefficient*spending with the water
recycle system in Nypro Shenzhen = saving per year (1.1)
The coefficient for Nypro Shenzhen is 1, and for Nypro Tianjin is 3.
The pay back period should be calculated with the function below.
Pay back period = spending for water recycle system/ savings per year (1.2)
If Nypro Tianjin and Nypro Guangzhou install the system currently used in Nypro
Shenzhen, we can use the (1.1) to get the saving for Nypro Tianjin (1.3)
Savings = $171,430 – ($860*0.43/0.16) = $169,085 per year (1.3)
We can use the (1.2) to get the pay back period for Nypro Tianjin (1.4)
Pay back period = $52,570/$170,000=0.31 years (1.4)
The savings for Nypro Tianjin will be approx $170,000 and the pay back period will be
around 4 months.
But for Nypro Shenzhen, the savings would be only $740 per year (1.5) and the pay back
period would be 70 years (1.6).
Savings = $1,600 – $860 = $740 per year (1.5)
Pay back period = $52,570/$740 = approx 70 years (1.6)

37
Based on the data we have now, there is an opportunity to save money for Nypro Tianjin
if the water recycle system is installed. But for Nypro Guangzhou, further research should be
done. For example, the research about the output of each process and how the 3rd party deal with
the two kinds of waste. Of course, the local policy and standard should be taken into account.
Improve
For the improve phase, we will give our suggestions and considerations. Based on the
analysis before, it is possible to save money by using the water recycle system for Nypro Tianjin.
We think that the HVS team should do more about the water recycle system and decide whether
it is effective to save as much as we had analyzed. If it is possible and effective, Nypro Tianjin
should install the water recycle system immediately.
Beside the water recycle system itself, there are still other factors should be considered.
For example, if the water recycle system is going to be installed in Nypro Tianjin, should the
pipeline layout be changed or not. Meanwhile, the HVS team should also make sure that the
water recycle system can meet the local standard in Tianjin.
6.1.2 Cooling Tower Water Usage
There are cooling towers that exist in all three facilities in Nypro China to cool the plastic
injection molding machines and other equiptment. It came to our attention during the project
that some facilities were using a lot more water than others. Figure 14 shows our findings.

38
Tianjin Shenzhen Guangzhou
Number of Water
Towers 18 26 16
Max Flow (M³/ Hour) 2600 5095 2050
Average Water Added
(M³/Hour) 0.12 1.00 0.50
Approx Water Use in
Towers (M³/Year) 18,720 252,000 69,120
Cost of Water per M³ $0.80 $0.35 $0.28
Approx Water Yearly
Cost in Cooling Towers $15,000 $88,000 $19,000
Figure 14: Cooling Tower Water Usage
Cooling Tower Suggestions
There are a number of factors that may impact this table. Nypro should identify a
number of areas that could effect the water consumption. The first of these is the real flow of
each of the cooling towers. The second is the water temperature on the input and output of the
tower and the environmental temperature around the tower to identify differences between
facilities. Climate also may be a factor in the evaporation rate of towers. Finally the required

39
temperature of the machines being cooled should be identified, like the plastic injection molding
machines for instance.
There are a number of improvements that need to be made to help minimize the water
wasted in the cooling tower process. The first of these is to add meters to measure the water that
needs to be added to every tower. The second is to use thermometers to measure the exact
temperature into and out of the cooling towers. The third is to identify overflow and leaks, these
will cause more water to be added than is needed. Overall there are a number of changes that
need to be made before we can identify the reasons for the drastic differences in water usage
between the facilities in their cooling towers.
Figure 15: Nypro Shenzhen Cooling Tower

40
Figure 16: Nypro Guangzhou Cooling Tower
6.2 Domestic Water
Domestic water is defined as water that is used for sanitary purposes in people’s daily lives,
e.g. bathrooms. Inefficient plumbing fixtures increase the amount of water consumed on a daily
basis, which is not environmentally friendly. We found differences in each of the facilities in the
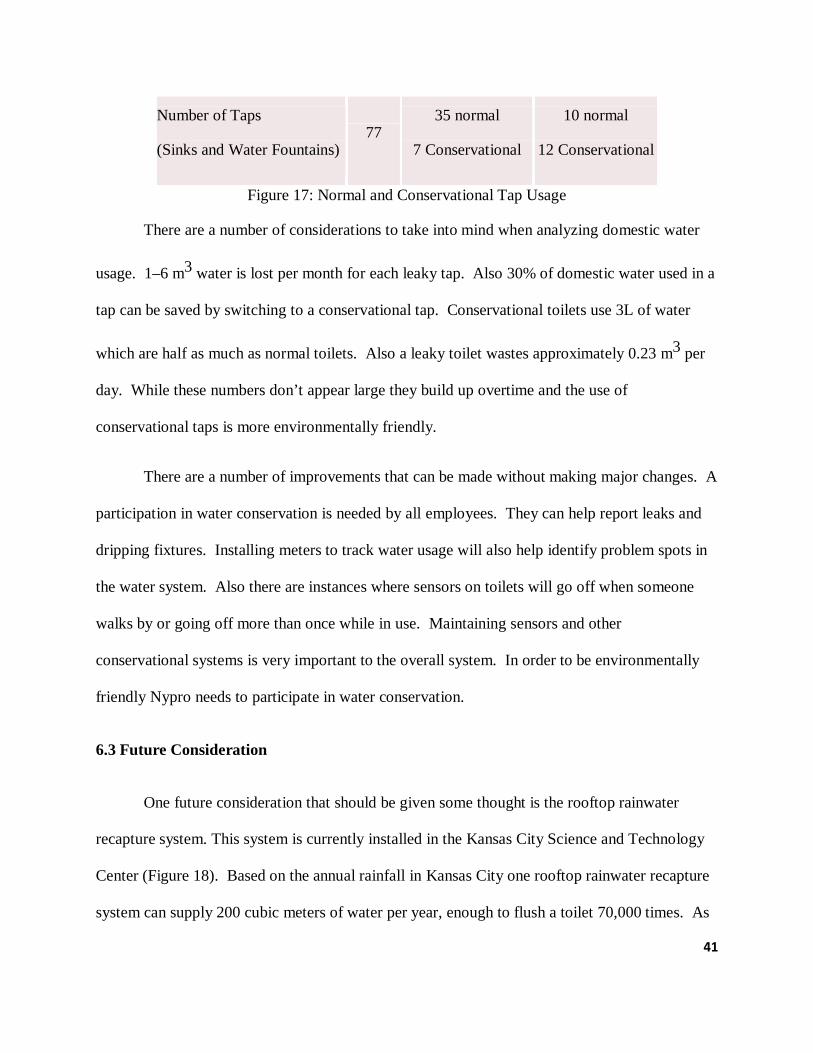
types of toilets and taps that they use. Figure 17 shows which facilities use conservational and
normal plumbing fixtures.
Tianjin Shenzhen Guangzhou
Number of Stalls
(Toilets and Urinals) 143
47 normal
139 Conservational
29 normal
12 Conservational
41
Number of Taps
(Sinks and Water Fountains) 77
35 normal
7 Conservational
10 normal
12 Conservational
Figure 17: Normal and Conservational Tap Usage
There are a number of considerations to take into mind when analyzing domestic water
usage. 1–6 m3 water is lost per month for each leaky tap. Also 30% of domestic water used in a
tap can be saved by switching to a conservational tap. Conservational toilets use 3L of water
which are half as much as normal toilets. Also a leaky toilet wastes approximately 0.23 m3 per
day. While these numbers don’t appear large they build up overtime and the use of
conservational taps is more environmentally friendly.
There are a number of improvements that can be made without making major changes. A
participation in water conservation is needed by all employees. They can help report leaks and
dripping fixtures. Installing meters to track water usage will also help identify problem spots in
the water system. Also there are instances where sensors on toilets will go off when someone
walks by or going off more than once while in use. Maintaining sensors and other
conservational systems is very important to the overall system. In order to be environmentally
friendly Nypro needs to participate in water conservation.
6.3 Future Consideration
One future consideration that should be given some thought is the rooftop rainwater
recapture system. This system is currently installed in the Kansas City Science and Technology
Center (Figure 18). Based on the annual rainfall in Kansas City one rooftop rainwater recapture
system can supply 200 cubic meters of water per year, enough to flush a toilet 70,000 times. As

42
you can see by figure 19 both Nypro Shenzhen and Nypro Guangzhou have at least double the
rainfall of Kansas City. The water that is captured in this system can help supply water to both
toilets and cooling towers, where ever the water is needed. This would be a considerable
environmental improvement but will take planning and consideration.
Figure 18: Rooftop Rainwater Recapture system in Kansas City
Figure 19: Average Rainfall per Year

43
7 Electric Waste Stream
Every year industries spend a lot in electrical use, which, at the same time, includes a number
of wastes. Table-4 shows the electrical use and cost of the 3 Nypro China facilities.
Nypro Tianjin Nypro Shenzhen Nypro Guangzhou
Consumption (kWh) 30,000,000 19,500,000 13,850,000
Price ($/kWh) 0.10 0.15 0.13
Cost ($) 3,000,000 2,925,000 1,800,500
Figure 20: Electrical Use & Cost of Nypro China
During our tour of the 3 facilities, we found that except the uncontrollable use there was a
large room for improvement in the efficiency of the controllable facility amenities. According to
the fishbone diagram (see Figure 21) we made, it is apparent that most of the electricity wastes
fasten on 2 aspects: lighting system and air conditioning (AC). Meanwhile, the heat loss of the
barrels in molding department is another part of the waste which we can reduce.

44
Electricity waste
Commercial Building
Warehouse Workshop
Equipment
Air Conditioning
Lighting SystemLighting System
Lighting System
Air Conditioning
Figure 21: Nypro Electricity Waste
7.1 Lighting System
7.1.1 Define
Here the lighting system includes:
a. Lighting in the bathrooms, offices, hallways, conference rooms, etc. of the commercial
buildings;
b. Lighting on the production line for workers and lighting in the bathrooms of the
workshops;
c. Lighting in warehouses.
In this part, we mainly focus on how to improve the lighting efficiency, how to reduce the
number of the lamps and how to shorten the lighting period. They together affect the electricity
consumption of the lighting system.

45
7.1.2 Measure
The type and the pattern of the lamps depend on the site. Except the high pressure mercury
lamps installed on the ceiling of the workshops, Nypro Tianjin and Nypro Guangzhou mainly
use Philips TLD in workshops and commercial buildings whereas Nypro Shenzhen has started
to use T5 in part of the facility.
Table-5 shows the purchasing prices of the different types of lamps. We can see from the table
that TLD is much cheaper than CFL. It’s the main reason why facilities prefer using TLD rather
than CFL.
.
Pattern Price Note
Philips TLD (30W) $0.90 Purchasing Price in Tianjin
Philips TLD (36W) $0.83 Ditto
Philips TLD (20W) $0.83 Ditto
Philips CFL (18W/3U) $3.00 Ditto
JINSANYUAN T5 CFL (28W) $1.70 Purchasing Price in Shenzhen
Figure 22: Different Types of Lamps Used in Facilites
Nevertheless, compared with TLD, T5 is much brighter and its average life is longer.
Meanwhile, T5 consumes less electricity than TLD. It’s also more reliable and durable.

46
Philips TLD (30W) JINSANYUAN T5
CFL (28W)
Lumen 1280lm 2600lm
Average Life 15000h 18000h
Electricity
Consumption 0.030kWh 0.028kWh
Failure Rate 0.06 0.04
Figure 23: Comparison Between TLD and T5
All spaces, including the commercial buildings, warehouses and workshops in Nypro China
facilities, contain manual controls for the lighting system. But the lights in both public areas and
private offices are always on in the day or even in the night. Especially in the bathrooms and
hallways, no matter the space is occupied or not, or whether the nature light is strong enough,
lights are always kept on. The same to the workshops, we find in many production lines that
employees leave the lights on when they’re not working there. According to a spot check in
Nypro Guangzhou Molding II, about 33.75% of lamps are on unnecessarily.
7.1.3 Analyze
a. Energy-saving Lamps
Considering the electricity cost and maintenance cost, if energy-saving lamps, like T5, can
save cost for company even though its purchasing price is higher? (Here we didn’t consider the
labor cost)
47
We did a case study in Nypro Tianjin Molding I to determine how much electricity can be
saved and whether we can reduce cost by applying energy-saving lamps. Nypro Tianjin Molding
I is a workshop with 31 injection molding machines, and there’re about 150 lamps for the
production line.
� Case I-Current Use: Choosing TLD (30W):
Fixed cost: $0.9*150=$135
Monthly cost: 0.030kWh*150*24hr*30d*$0.1=$324
Maintenance cost: $0.9*0.06*150*12=$97.2
� Case II: Choosing T5 CFL (28W):
Because T5 is twice brighter than TLD (30W), we can reduce the number of lamps from 150
to 80, which, will not impact the illumination effect.
Fixed cost: $1.7*80=$136
Monthly cost: 0.0218kWh*80*24hr*30d*$0.1=$126
Maintenance cost: $0.9*0.04*80*12=$34.6
So every year, we can save ($324-$126)*12+($97.2-$34.6)*12=$3127, and the pay back
period is 0.52 month.
b. Sensor

48
Sensor controls for lighting systems have promised significant energy and dollar savings
potential in a variety of commercial lighting applications. By automatically controlling lighting
to turn lights off when spaces are unoccupied, sensors controls compliment connected load
reductions accomplished by lamp retrofits, giving building owners and operators opportunities to
improve energy savings without compromising lighting service to building occupants. According
to previous research, the saving potential in several areas in a commercial building is shown
below:
% Private Offices: 13% - 70%
% Open offices: 5% - 35%
% Bathrooms: 30% - 90%
% Conference Room: 20% - 65%
% Warehouse: 50% - 90%
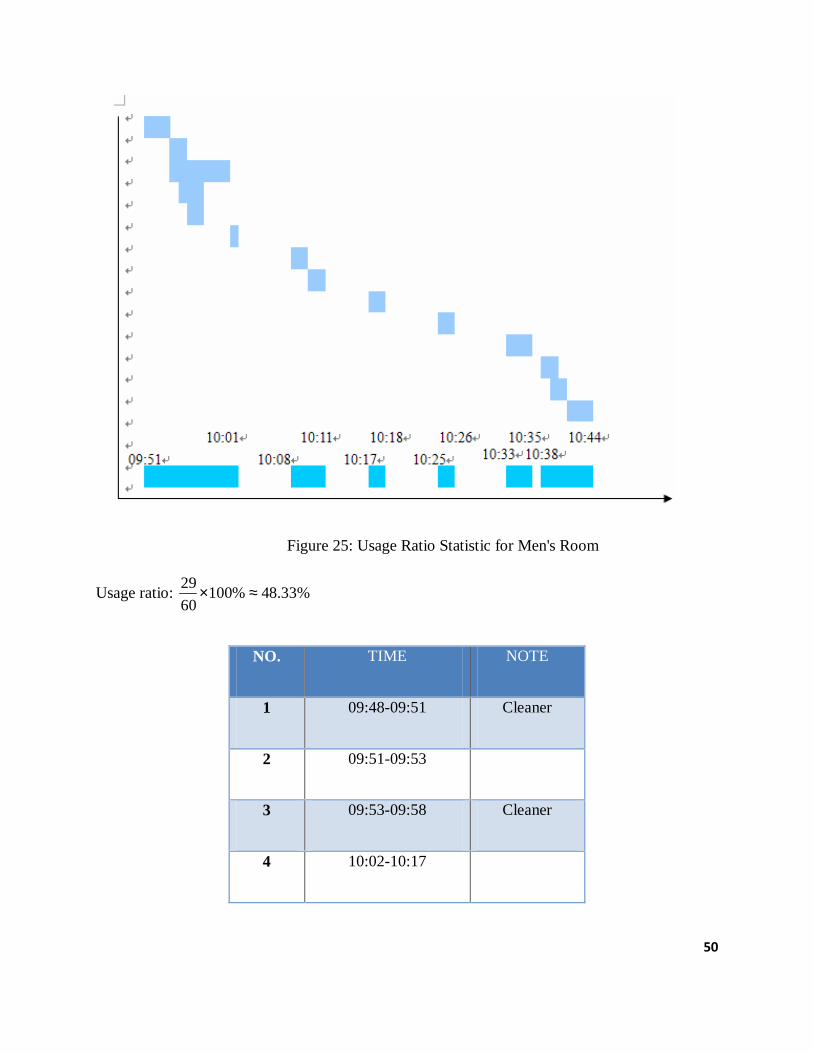
We conducted some surveys and statistical to indentify the usage ratio of the lighting system
in bathroom and hallway to show how much electricity is waste and what’s the saving potential
by installing the sensors in Nypro China.
Here lighting energy use was calculated by multiplying the total lighting load by the time that
the lights were on and the room was occupied. Lighting energy waste was calculated by
multiplying the total load by the time that the lights were on and the room was unoccupied.
� Bathroom
Time: 09:48-10:48 July 7th , 2008

49
Site: 2# 3rd floor, Baimenqian, Nypro Shenzhen
NO. TIME NOTE
1 09:51-09:53 Cleaner
2 09:54-09:55
3 09:54-10:00
4 09:55-09:57 Cleaner
5 09:56-09:57 Cleaner
6 10:01-10:01
7 10:08-10:09
8 10:10-10:11
9 10:17-10:18
10 10:25-10:26
11 10:33-10:35
12 10:38-10:40
13 10:40-10:41 Cleaner
14 10:42-10:44
Figure 24: Use of Men’s Room
50
Figure 25: Usage Ratio Statistic for Men's Room
Usage ratio: 29
100% 48.33%60
× ≈
NO. TIME NOTE
1 09:48-09:51 Cleaner
2 09:51-09:53
3 09:53-09:58 Cleaner
4 10:02-10:17

51
5 10:07-10:25
6 10:13-10:15
7 10:13-10:17
8 10:14-10:!4
9 10:23-10:24 Cleaner
10 10:26-10:28
11 10:26-10:33
12 10:31-10:33
13 10:31-10:35 Cleaner
14 10:34-10:36
15 10:35-10:37
16 10:35-10:42
17 10:36-10:42
18 10:39-10:40 Cleaner
19 10:40-10:44
20 10:41-10:45

52
21 10:43-10:45
Figure 26: Use of Women’s Room
Figure 27: Usage Ratio Statistic for Women's Room
Usage ratio:
So the average usage ratio of the bathrooms is (48.33%+96.67%)/2=72.5%
58100% 96.67%
60× ≈

53
72.5%
27.5%
Occupied Time Free Time
Figure-2. Utilization Rate of bathroom
Figure 28: Utilization Rate of Bathroom
Through this case study, the average usage ratio of the bathroom is about 1/4. What’s more,
we found that the lamps stay on during the night when there’re much less people. For some of
the bathrooms, the natural light is strong enough in the daytime so there’s no need to keep the
lights on. In conclusion, more than 1/4 of electricity can be saved by using sensor in the
bathroom.
Currently, the monthly electricity cost of a 2-lamp bathroom is:
0.03kWh*2*24hr*30d*$0.15/kWh=$6.48
By installing sensor in that bathroom, the monthly electricity cost would be reduced to:
0.03kWh*2*24hr*30d*$0.15/kWh*3/4=$4.86
So every year, we can save ($6.48-$4.86)*12=$19.44 in a 2-lamp bathroom. Considering the
installation cost of a sensor, which is $2.64, the payback period is 1.53 months.
� Bathroom
Time: 09:30-09:50 July 18th , 2008
Site: Outside the Tulip Room, Nypro Guangzhou

54
Assume that the detection limit of the sensor is 4 meters, the timeout setting is 15 seconds and
the average walking speed of people is 1 meter per sec. So if the time interval of 2 persons is
longer that 4m*2/1m/s+15s=23s, the lights can be turned of by the sensor.
According to Table-9, 250/1207=21% electricity can be saved by installing sensors in
hallway.
NO. Time Time
Interval
Extra
Time
1 00:06.1
2 00:51.0 45 22
3 01:16.6 25 3
4 01:25.6 9
5 01:35.2 10
6 01:45.5 10
7 02:07.4 22
8 02:12.3 5
9 02:38.8 26 3
10 03:13.2 35 12
11 04:44.6 31 8
12 05:07.7 23
13 05:19.9 8
14 05:48.9 29 6
15 06:02.6 46 23
16 06:31.9 29 6
17 06:47.6 16
18 07:11.2 14
19 07:17.3 6
20 07:30.9 3
21 07:59.2 29 3
22 08:00.0 1
23 08:34.4 34 11
24 08:37.0 3
25 08:39.0 2
26 09:16.3 37 14
27 10:28.1 72 49
28 10:47.8 19

55
29 10:56.5 9
30 11:38.6 42 19
31 12:01.0 23
32 12:29.5 28 5
33 13:06.7 37 14
34 13:10.0 4
35 13:28.4 18
36 14:46.5 18
37 15:27.5 41 28
38 15:39.0 12
39 15:56.3 17
40 16:05.9 9
41 16:43.6 38 15
42 16:45.2 2
43 16:50.0 5
44 17:04.5 14
45 17:22.1 18
46 17:33.2 11
47 17:37.3 4
48 17:48.4 11
49 18:07.5 19
50 18:16,37 9
51 18:23.9 7
52 18:29.2 6
53 18:33.2 4
54 19:03.9 30 7
55 19:26.4 23
56 19:28.1 2
57 19:28.8 0
58 19:53.8 25 2
59 20:07.2 14
Total 1207 250
Figure 29: Frequency of People Passing The Hallway
c. Lighting efficiency
The low utilization of the lights may due to:

56
� Seating and lighting layout is inappropriate
Some of the tables are arranged like what is shown in figure 30. We found that all the
workers sit on one side of the tables, which requires turning on all the lights.
Figure 30: A Typical Seating Layout
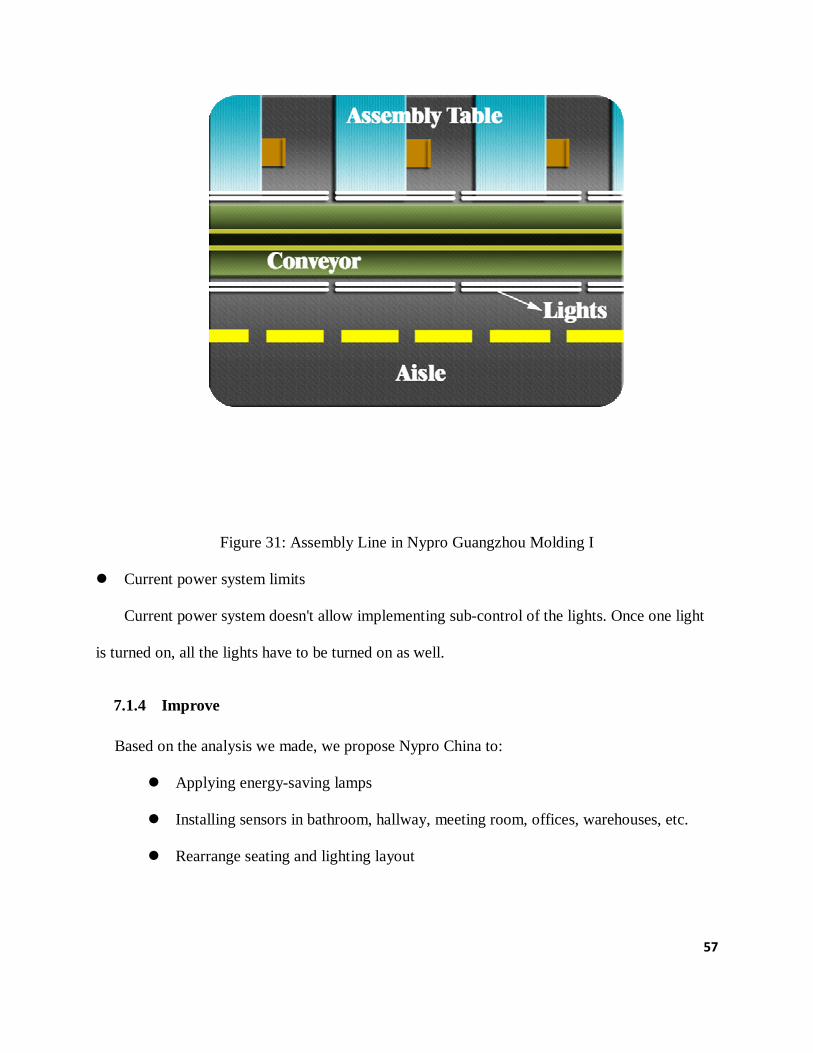
Figure 31 shows another typical situation where lights are not made full use of: there are
lamps located on both side of the assembly line, but out side of the conveyor does not have
workers sitting at it.
57
Figure 31: Assembly Line in Nypro Guangzhou Molding I
� Current power system limits
Current power system doesn't allow implementing sub-control of the lights. Once one light
is turned on, all the lights have to be turned on as well.
7.1.4 Improve
Based on the analysis we made, we propose Nypro China to:
� Applying energy-saving lamps
� Installing sensors in bathroom, hallway, meeting room, offices, warehouses, etc.
� Rearrange seating and lighting layout

58
Arrange workers on both sides of the tables to utilize light use as show in figure
32 and figure 33.
Figure 32: Layout 1 Before Figure 33: Layout 1 After
Place two tables together and install the same number of lights between them as
shown in figure 34 and figure 35
Figure 34: Layout 2 Before Figure 35: Layout 2 After

59
� Reconstruct the power line and install more switches to implement sub-control.
� Improve field management
7.2 Air Conditioning
7.2.1 Define
Besides lighting, air conditioning (AC) is another kind of amenity which consumes a huge
mount of electricity in facilities. Especially the large scale ACs in workshop, they may cause a
lot of waste if we don’t use them properly.
In this part, we’ll take Nypro Guangzhou as an example.
7.2.2 Measure
In Nypro Guangzhou, there are 11 TECO L35TC ACs in Molding I, and 18 Green L49/B ACs
in Molding II. Take Green L49/B as an example (the technical data is shown in Table-10), its
hourly electricity consumption is 11.5kWh, and the daily electricity cost is $35.50.
Rated current/A Rated power /kW
Green L49/B 21.6/20.5 12.1/11.5
Figure 36: Green L49/B
During our visit, we found:
� Some units are on but not cooling

60
� Different units are set on different temperatures. The setting temperature ranges from 24�C
to 27�C
� AC filters need to be replaced or cleaned
� Workshop doors are left open to the outside
7.2.3 Analyze
The compressor of AC consumes the most of the electricity. If ACs are continuously cooling
or heating, a large amount of electricity would be wasted. The key point to reduce the electricity
consumption of a AC is to make it work in an environment with invariable temperature.
7.2.4 Improve
� Best to keep the work load above 70%. One full load AC is more economical than two
non full load ACs.
� Set the same temperature to prevent interference between ACs
� Reduce the heat exchange by keeping doors and windows closed to
� Replace or clean filters regularly
� Control the quality of the cooling water to prevent buildup
7.3 Barrel Blankets
The injection molding press barrels are exposed to the room environment (figure 37).
There is a risk of injury due to the heat of the barrel. The surface temperature is 80°C which can
cause burns and increases the temperature of the air around the machines. Also energy
consumption is high reheating the barrel.
Nypro Shenzhen has created a barrel blanket to reduce the temperature impact on the
workshop (figure 38). It has eliminated the risk of burns and decreased the overall temperature

61
around the molding machines. It has also produced an energy savings of 5 kw*h per day per
machine. This amounts to a 108,000 kw*h savings per year and a yearly savings of $12,000 at
Nypro Shenzhen’s cost of electricity. The cost of producing these barrel blankets was $5,700
amounting to a payback period of 6 months.
Applying these barrel blankets to Nypro Tianjin with their 128 injection molding
machines will amount to a $13,800 yearly savings. Applying the barrel blankets to the 40 Nypro
Guangzhou molding machines will result in a $5,616 yearly savings. The payback period for
both plants will be 6 months.
Figure 37: Exposed Molding Press Barrel
Figure 38: Barrel Blanket

62
8. Recommendations
In this section we will give an outline of our overall recommendations.
• Resin Waste Stream
o Regrind all Resin and Separate Resin
� A savings of between $10,500 and $52,500 a year
• Water Waste Stream (Industrial and Domestic Water)
o Monitor and improve cooling tower usage
o Implement Shenzhen’s water recycling system
� a savings of $169,000 a year
o Domestic water conservation methods
• Electricity
o Lighting
� Install energy saving lamps in Nypro Tianjin and Nypro Guangzhou: this
equals a savings of $3,127 a year in just one molding department
� Install sensors in applicable areas: this would have saved $19 a year in just
one bathroom under conditions observed
� Monitor layouts and improve lighting efficiency
o Monitor and improve air conditioning effectiveness
o Install barrel blankets on injection molding machines in Nypro Tianjin and Nypro
Guangzhou
� This is a savings of $13,800 a year in Nypro Tianjin
These are the overall recommendations. It is important to note however that there are potential
savings and also important environmental concerns in data that did not have a quantifiable result.

63
Each result is important to the project and can be seen and should still be implemented even if
recommendation is not quantifiable. Each recommendation should be implemented or analyzed
further as it will bring a cost savings and a better environmental condition.

64
9 Implementation
This section of the report will go over the various time tables for implementation. These
are taken into consideration by how long it may take to approve and physically implement the
changes that have been proposed.
9.1 Immediate Implementation
There are a number of changes that can be implemented immediately. The first of
these is to regrind all the resin at each of the Nypro facilities. It has been shown that each
facility has the capability to do so and this is an easy change to make. Another change that can
be implemented immediately is to install meters for water and electricity to better identify
problem areas that can be improved. The third thing that can be immediately implemented is to
apply energy – saving lamps throughout the facilities. The final thing that can be implemented
immediately is to improve the AC usage throughout each facility. These are all immediate
changes that can be implemented in under 6 months.
9.2 Short-term Implementation
There are a few goals that can be implemented in the short- term (6 months to one year).
The first of these is to separate the resin into more detailed classifications to be sure that each
type of resin is pure. The next short-term goal would be to implement sensor use throughout the
facilities. The final short-term goal is to install barrel blankets onto the injection molding
machines in Nypro Tianjin, Guangzhou, and Shouzhou. These short-term goals represent a cost
savings that is reachable in 6 months to a year.
9.3 Long-term implementation
The long-term implementation is the realization of goals that will take over a year. The
first of these goals is to construct a water recycling system in Nypro Tianjin which represents

65
one of the largest cost savings. Another long-term goal is to improve the seating layouts to use
lighting systems more efficiently and save electricity. The final long-term goal is to educate
workers on being environmentally conscious. The education of supervisors and workers at all
levels will help the company become more environmentally friendly and also produce cost
savings by eliminating unneeded waste. These are the long-term implementation goals.
66
10 Future Work
There were a couple areas that we identified in this report for future work. The first was
to identify the cost effectiveness of producing in house painting fixtures. We should collect
interrelated data including cost of purchasing new fixtures and third party fixtures, price of
selling resin which are used to remanufacture fixtures, price of selling used fixtures, cost of
remanufacturing fixtures in house, and other costs and expenses. After gathering data we need,
we should identify the exact pros and cons of each option and offer weight to each column to
figure out the best way of getting painting fixtures. We should be able to identify the benefit,
feasibility and pay back time for Nypro China to expand the best method to other facilities.
The second was to expand Nypro Tianjin’s usage of cooling towers to other facilities.
Nypro should identify a number of areas that could effect the water consumption. The first of
these is the real flow of each of the cooling towers. The second is the water temperature on the
input and output of the tower and the environmental temperature around the tower to identify
differences between facilities. Climate also may be a factor in the evaporation rate of towers.
Finally the required temperature of the machines being cooled should be identified, like the
plastic injection molding machines for instance.
There are a number of improvements that need to be made to help minimize the water
wasted in the cooling tower process. The first of these is to add meters to measure the water that
needs to be added to every tower. The second is to use thermometers to measure the exact
temperature into and out of the cooling towers. The third is to identify overflow and leaks, these
will cause more water to be added than is needed. Overall there are a number of changes that
need to be made before we can identify the reasons for the drastic differences in water usage
between the facilities in their cooling towers.

67
The final area of future work was to examine the feasibility of constructing a rooftop
rainwater recapture system. This system is currently installed in the Kansas City Science and
Technology Center (Figure 18). Based on the annual rainfall in Kansas City one rooftop
rainwater recapture system can supply 200 cubic meters of water per year, enough to flush a
toilet 70,000 times. As you can see by figure 19 both Nypro Shenzhen and Nypro Guangzhou
have at least double the rainfall of Kansas City. The water that is captured in this system can
help supply water to both toilets and cooling towers, where ever the water is needed. This would
be a considerable environmental improvement but will take planning and consideration. Each of
these areas could produce environmentally friendly results.

68
Bibliography
Building Guide: http://www.wbdg.org/resources/water_conservation.php
Electronic sensor: http://www.lrc.rpi.edu/resources/pdf/dorene1.pdf
HVS/RIE Project Presentation, Barrel Blankets Update. Tao, Wong. 2008
Peter Peterka. The DMAIC method in Six Sigma. Retrieved from http://www.6sigma.us/six-
sigma-article-DMAIC.php
Stanford Water Conservation: http://facilities.stanford.edu/conservation/waterconservation.htm
US EPA http://www.epa.gov/oaintrnt/water/more_info.htm
http://www.epa.gov/greeningepa/water/techniques.htm
Water Conservation and Reuse in DuPont:
http://www.businessroundtable.org/pdf/ClimateRESOLVE/Event/17_Mongan_Presentati
on%2010.04.pdf