Embed Size (px)
Citation preview

Washington Department of Ecology
2008 - 2009 Enforcement Report
December 2010 Publication no. 10-01-008

Publication and Contact Information This report is available on the Department of Ecology’s website at www.ecy.wa.gov/biblio/1001008.html For more information contact: Publications Coordinator Executive Offices P.O. Box 47600 Olympia, WA 98504-7600 Phone: (360) 407-7000
Washington State Department of Ecology-www.ecy.wa.gov/
Headquarters, Olympia (360) 407-6000
Northwest Regional Office, Bellevue (425) 649-7000
Southwest Regional Office, Olympia (360) 407-6300
Central Regional Office, Yakima (509) 575-2490
Eastern Regional Office, Spokane (509) 329-3400 Any use of product or firm names in this publication is for descriptive purposes only and does not imply endorsement by the author or the Department of Ecology. If you need this publication in an alternate format, call Ecology’s Executive Office at (360) 407-7000. Persons with hearing loss can call 711 for Washington Relay Service. Persons with a speech disability can call 877-833-6341.
Cover photo: Spills Program inspector, Andrea Unger, investigating an old ship.
Original printed on recycled paper

Department of Ecology 2008-09 Enforcement Report – December 2010 i
Washington State Department of Ecology 2008-09 Enforcement Report
Table of Contents Executive Summary ...................................................................................................................................... 1 Introduction ................................................................................................................................................... 2 Compliance with Environmental Laws & Rules ........................................................................................... 2 Ecology’s Enforcement Principles ................................................................................................................ 2 State and Federal Roles in Enforcement ....................................................................................................... 4 Enforcement Actions .................................................................................................................................... 4
Actions by County ........................................................................................................................... 7 Trends in Notices, Orders, and Penalties ......................................................................................... 9 Notices ........................................................................................................................................... 12 Administrative Orders .................................................................................................................... 13 Civil Penalties ................................................................................................................................ 14 Penalty Assessment ........................................................................................................................ 15
Innovative Settlements and Supplemental Environmental Projects ............................................................ 18 Envrionmental Programs Air Quality .................................................................................................................................................. 19 Hazardous Waste ........................................................................................................................................ 25 Industrial Section ........................................................................................................................................ 32 Nuclear Waste ............................................................................................................................................. 37 Shorelands and Environmental Assistance ................................................................................................. 42 Spill Prevention, Preparedness and Response ............................................................................................. 48 Toxics Cleanup ........................................................................................................................................... 56 Waste 2 Resources ...................................................................................................................................... 62 Water Quality .............................................................................................................................................. 68 Water Resources ......................................................................................................................................... 76 Contributions and Acknowledgments ......................................................................................................... 82
Department of Ecology 2008-09 Enforcement Report – December 2010 ii
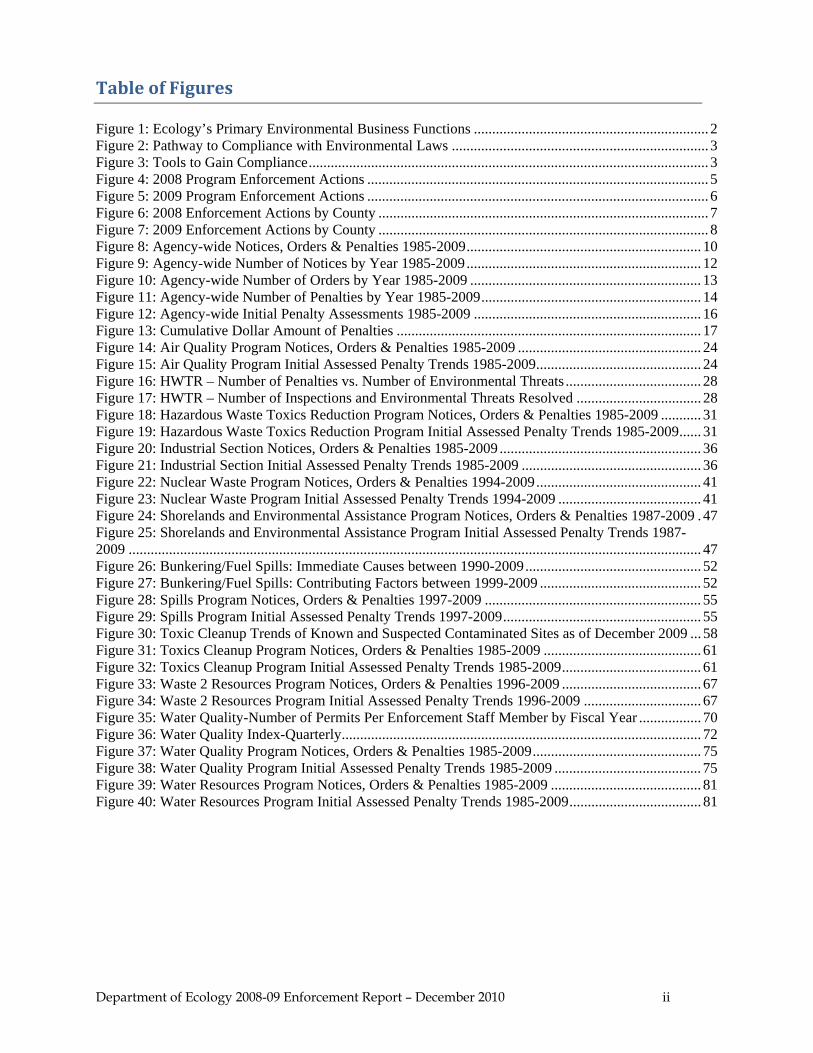
Table of Figures Figure 1: Ecology’s Primary Environmental Business Functions ................................................................ 2 Figure 2: Pathway to Compliance with Environmental Laws ...................................................................... 3 Figure 3: Tools to Gain Compliance ............................................................................................................. 3 Figure 4: 2008 Program Enforcement Actions ............................................................................................. 5 Figure 5: 2009 Program Enforcement Actions ............................................................................................. 6 Figure 6: 2008 Enforcement Actions by County .......................................................................................... 7 Figure 7: 2009 Enforcement Actions by County .......................................................................................... 8 Figure 8: Agency-wide Notices, Orders & Penalties 1985-2009 ................................................................ 10 Figure 9: Agency-wide Number of Notices by Year 1985-2009 ................................................................ 12 Figure 10: Agency-wide Number of Orders by Year 1985-2009 ............................................................... 13 Figure 11: Agency-wide Number of Penalties by Year 1985-2009 ............................................................ 14 Figure 12: Agency-wide Initial Penalty Assessments 1985-2009 .............................................................. 16 Figure 13: Cumulative Dollar Amount of Penalties ................................................................................... 17 Figure 14: Air Quality Program Notices, Orders & Penalties 1985-2009 .................................................. 24 Figure 15: Air Quality Program Initial Assessed Penalty Trends 1985-2009 ............................................. 24 Figure 16: HWTR – Number of Penalties vs. Number of Environmental Threats ..................................... 28 Figure 17: HWTR – Number of Inspections and Environmental Threats Resolved .................................. 28 Figure 18: Hazardous Waste Toxics Reduction Program Notices, Orders & Penalties 1985-2009 ........... 31 Figure 19: Hazardous Waste Toxics Reduction Program Initial Assessed Penalty Trends 1985-2009 ...... 31 Figure 20: Industrial Section Notices, Orders & Penalties 1985-2009 ....................................................... 36 Figure 21: Industrial Section Initial Assessed Penalty Trends 1985-2009 ................................................. 36 Figure 22: Nuclear Waste Program Notices, Orders & Penalties 1994-2009 ............................................. 41 Figure 23: Nuclear Waste Program Initial Assessed Penalty Trends 1994-2009 ....................................... 41 Figure 24: Shorelands and Environmental Assistance Program Notices, Orders & Penalties 1987-2009 . 47 Figure 25: Shorelands and Environmental Assistance Program Initial Assessed Penalty Trends 1987-2009 ............................................................................................................................................................ 47 Figure 26: Bunkering/Fuel Spills: Immediate Causes between 1990-2009 ................................................ 52 Figure 27: Bunkering/Fuel Spills: Contributing Factors between 1999-2009 ............................................ 52 Figure 28: Spills Program Notices, Orders & Penalties 1997-2009 ........................................................... 55 Figure 29: Spills Program Initial Assessed Penalty Trends 1997-2009 ...................................................... 55 Figure 30: Toxic Cleanup Trends of Known and Suspected Contaminated Sites as of December 2009 ... 58 Figure 31: Toxics Cleanup Program Notices, Orders & Penalties 1985-2009 ........................................... 61 Figure 32: Toxics Cleanup Program Initial Assessed Penalty Trends 1985-2009 ...................................... 61 Figure 33: Waste 2 Resources Program Notices, Orders & Penalties 1996-2009 ...................................... 67 Figure 34: Waste 2 Resources Program Initial Assessed Penalty Trends 1996-2009 ................................ 67 Figure 35: Water Quality-Number of Permits Per Enforcement Staff Member by Fiscal Year ................. 70 Figure 36: Water Quality Index-Quarterly .................................................................................................. 72 Figure 37: Water Quality Program Notices, Orders & Penalties 1985-2009 .............................................. 75 Figure 38: Water Quality Program Initial Assessed Penalty Trends 1985-2009 ........................................ 75 Figure 39: Water Resources Program Notices, Orders & Penalties 1985-2009 ......................................... 81 Figure 40: Water Resources Program Initial Assessed Penalty Trends 1985-2009 .................................... 81

Department of Ecology 2008-09 Enforcement Report – December 2010 iii
Table of Tables Table 1: Agency Total Enforcement Actions and Penalty Amounts .......................................................... 11 Table 2: Air Quality Program Enforcement Actions and Penalties Amounts ............................................. 23 Table 3: Hazardous Waste Management Enforcement Actions and Penalty Amounts .............................. 30 Table 4: Industrial Section Permit Types .................................................................................................... 33 Table 5: Industrial Sections Enforcement Actions and Penalty Amounts .................................................. 35 Table 6: Nuclear Waste Permit Types ........................................................................................................ 38 Table 7: Nuclear Waste Program Enforcement Actions and Penalty Amounts .......................................... 40 Table 8: Shoreline Management and 401 Water Quality Certification Enforcement Actions Penalty Amounts ...................................................................................................................................................... 46 Table 9: Spills Program Enforcement Actions Penalty Amounts ............................................................... 54 Table 10: Toxics Cleanup Program Enforcement Actions and Penalty Amounts ...................................... 60 Table 11: Waste 2 Resources Program Enforcement Actions and Penalty Amounts ................................. 66 Table 12: Water Quality Permits as of December 31, 2008 ....................................................................... 69 Table 13: Water Quality Program Enforcement Actions and Penalty Amounts ......................................... 74 Table 14: Water Resource Program Enforcement Actions and Penalty Amounts ...................................... 80

Department of Ecology 2008-09 Enforcement Report – December 2010 i
Department of Ecology 2008-09 Enforcement Report – December 2010 1
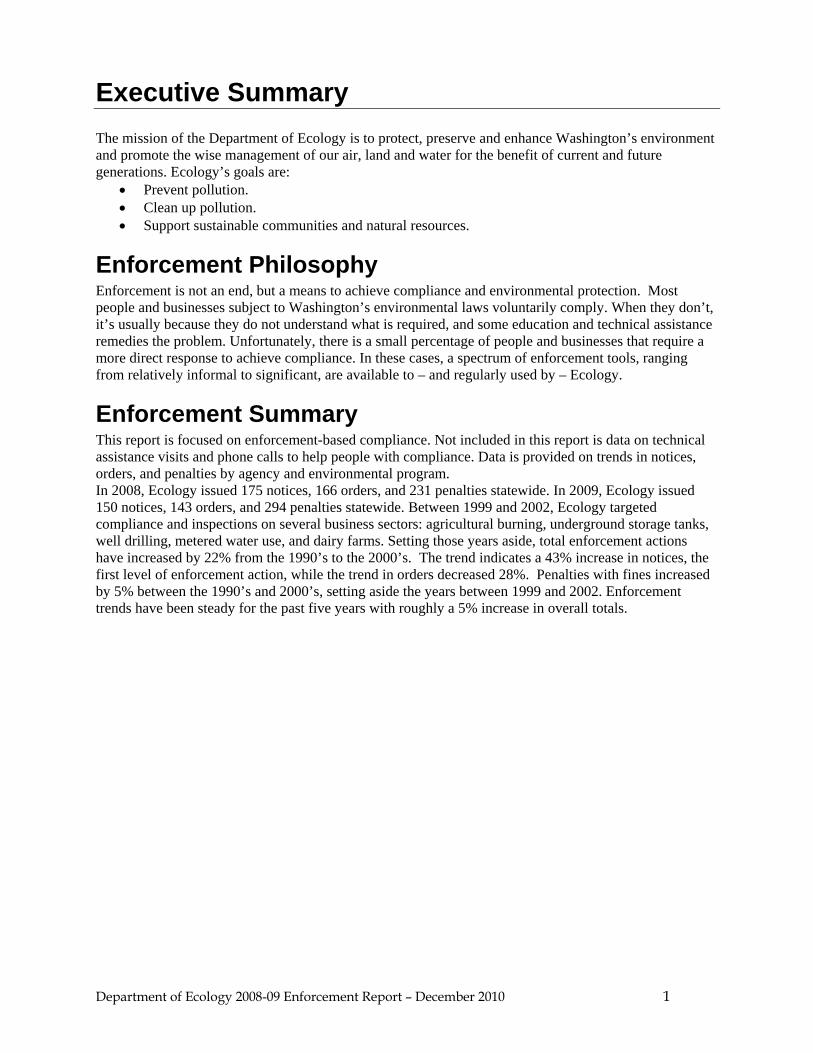
Executive Summary The mission of the Department of Ecology is to protect, preserve and enhance Washington’s environment and promote the wise management of our air, land and water for the benefit of current and future generations. Ecology’s goals are:
• Prevent pollution. • Clean up pollution. • Support sustainable communities and natural resources.
Enforcement Philosophy Enforcement is not an end, but a means to achieve compliance and environmental protection. Most people and businesses subject to Washington’s environmental laws voluntarily comply. When they don’t, it’s usually because they do not understand what is required, and some education and technical assistance remedies the problem. Unfortunately, there is a small percentage of people and businesses that require a more direct response to achieve compliance. In these cases, a spectrum of enforcement tools, ranging from relatively informal to significant, are available to – and regularly used by – Ecology.
Enforcement Summary This report is focused on enforcement-based compliance. Not included in this report is data on technical assistance visits and phone calls to help people with compliance. Data is provided on trends in notices, orders, and penalties by agency and environmental program. In 2008, Ecology issued 175 notices, 166 orders, and 231 penalties statewide. In 2009, Ecology issued 150 notices, 143 orders, and 294 penalties statewide. Between 1999 and 2002, Ecology targeted compliance and inspections on several business sectors: agricultural burning, underground storage tanks, well drilling, metered water use, and dairy farms. Setting those years aside, total enforcement actions have increased by 22% from the 1990’s to the 2000’s. The trend indicates a 43% increase in notices, the first level of enforcement action, while the trend in orders decreased 28%. Penalties with fines increased by 5% between the 1990’s and 2000’s, setting aside the years between 1999 and 2002. Enforcement trends have been steady for the past five years with roughly a 5% increase in overall totals.
Department of Ecology 2008-09 Enforcement Report – December 2010 2
Introduction The Department of Ecology is Washington’s principal environmental protection agency. Our mission is to protect, preserve, and enhance Washington’s environment, and to promote the wise management of our air, land, and water for the benefit of current and future generations. Ecology’s goals are:
• Prevent pollution. • Clean up pollution. • Support sustainable communities and natural resources.
Figure 1: Ecology’s Primary Environmental Business Functions
Compliance with Environmental Laws & Rules Ecology is responsible for managing Washington’s environmental laws and rules that protect the air, land and water. We require, expect, and help those we regulate to know how to voluntarily comply with these laws and rules. This includes the Revised Code of Washington (state law), the Washington Administrative Code (state rules) and, in the case of federal rules, the Code of Federal Regulations.
Ecology’s Enforcement Principles Ecology uses enforcement, along with education, technical assistance and cooperation-based programs to make sure businesses comply with state laws and rules. In cases of non-compliance we carefully match the significance of the violation to the type of enforcement actions we take. In most cases, we use cooperation-based solutions to solve environmental problems. However, we also have a strong deterrent-based enforcement policy to address significant threats to human health, the environment, and intentional violations.
Compliance Permitting
Pollution Prevention

Department of Ecology 2008-09 Enforcement Report – December 2010 3
Figure 2: Pathway to Compliance with Environmental Laws
Some of our tools to gain compliance fall between cooperation-based and deterrent-based enforcement such as compliance inspections. Our enforcement actions are based in fact and law, well documented, appropriate to the violation, and issued in a professional, equitable, and effective manner. This report primarily focuses on deterrent-based enforcement trends. A large part of Ecology’s work is on education and cooperation-based programs. To learn more about our education and cooperation-based programs, visit: http://www.ecy.wa.gov/services.html Figure 3: Tools to Gain Compliance
Education
Compliance Inspection Technical
Assistance
Warning
Notice
Penalty
Note: Voluntary compliance is our primary goal. Not all steps are used in all situations. Several factors are considered in determining the appropriate response to a violation of environmental laws.
Order
Voluntary
Enforced
Education Programs
Cooperation-based Programs and Enforcement
Deterrent-based Enforcement
• Workshops • Newsletters • Guidance • News Releases
• Assistance Resources & Staff • On-Site Technical & Regulatory
Assistance • Phone, Walk-In, Email Assistance • Awards & Recognition • Industry Specific Guidance • Agreements with Business Sectors • Letters
• Fines & Penalties • Administrative Orders • Criminal Investigations • News Releases
• Compliance Inspections • Monitoring • Warning Letters • Notice of Non-Compliance • Notices of Violations
Department of Ecology 2008-09 Enforcement Report – December 2010 4
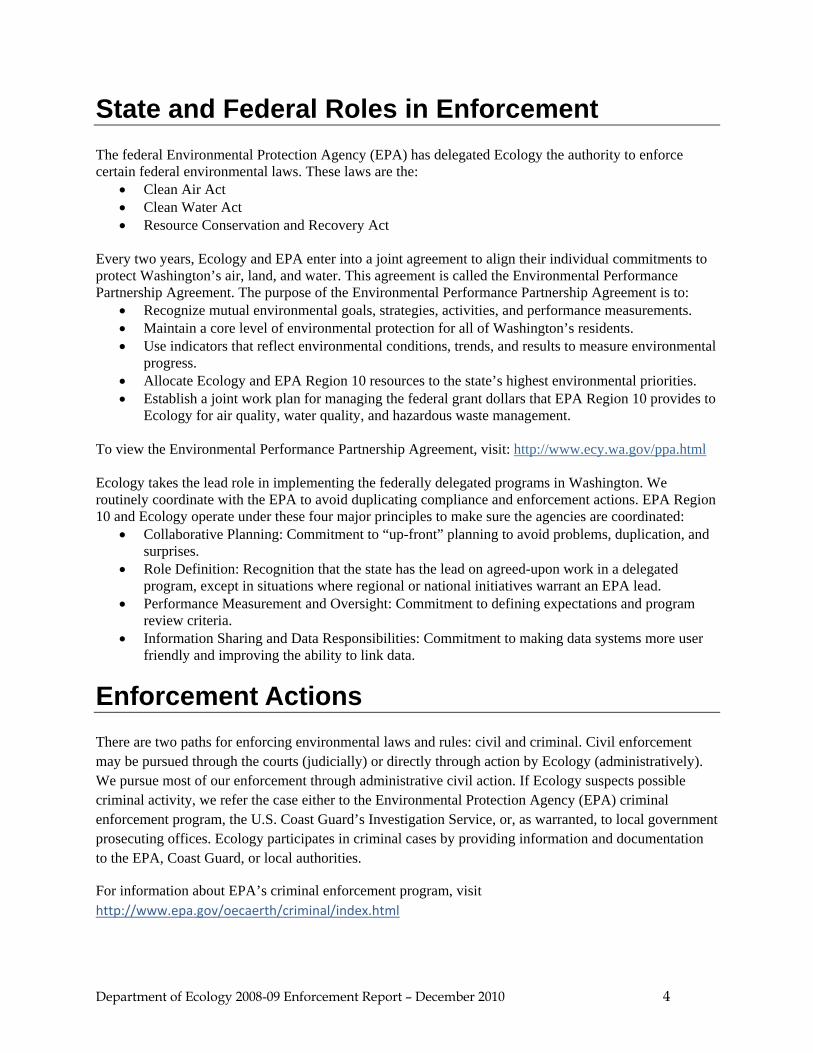
State and Federal Roles in Enforcement The federal Environmental Protection Agency (EPA) has delegated Ecology the authority to enforce certain federal environmental laws. These laws are the:
• Clean Air Act • Clean Water Act • Resource Conservation and Recovery Act
Every two years, Ecology and EPA enter into a joint agreement to align their individual commitments to protect Washington’s air, land, and water. This agreement is called the Environmental Performance Partnership Agreement. The purpose of the Environmental Performance Partnership Agreement is to:
• Recognize mutual environmental goals, strategies, activities, and performance measurements. • Maintain a core level of environmental protection for all of Washington’s residents. • Use indicators that reflect environmental conditions, trends, and results to measure environmental
progress. • Allocate Ecology and EPA Region 10 resources to the state’s highest environmental priorities. • Establish a joint work plan for managing the federal grant dollars that EPA Region 10 provides to
Ecology for air quality, water quality, and hazardous waste management. To view the Environmental Performance Partnership Agreement, visit: http://www.ecy.wa.gov/ppa.html Ecology takes the lead role in implementing the federally delegated programs in Washington. We routinely coordinate with the EPA to avoid duplicating compliance and enforcement actions. EPA Region 10 and Ecology operate under these four major principles to make sure the agencies are coordinated:
• Collaborative Planning: Commitment to “up-front” planning to avoid problems, duplication, and surprises.
• Role Definition: Recognition that the state has the lead on agreed-upon work in a delegated program, except in situations where regional or national initiatives warrant an EPA lead.
• Performance Measurement and Oversight: Commitment to defining expectations and program review criteria.
• Information Sharing and Data Responsibilities: Commitment to making data systems more user friendly and improving the ability to link data.
Enforcement Actions There are two paths for enforcing environmental laws and rules: civil and criminal. Civil enforcement may be pursued through the courts (judicially) or directly through action by Ecology (administratively). We pursue most of our enforcement through administrative civil action. If Ecology suspects possible criminal activity, we refer the case either to the Environmental Protection Agency (EPA) criminal enforcement program, the U.S. Coast Guard’s Investigation Service, or, as warranted, to local government prosecuting offices. Ecology participates in criminal cases by providing information and documentation to the EPA, Coast Guard, or local authorities.
For information about EPA’s criminal enforcement program, visit http://www.epa.gov/oecaerth/criminal/index.html

Department of Ecology 2008-09 Enforcement Report – December 2010 5
2008 Program Enforcement Actions 572 Total
Administrative enforcement is the exercise of state civil authority to direct the owner or operator of a facility, site, or property to comply with state law. An administrative enforcement action is based upon a violation, or potential to violate, a state law or rule; and the authority to enforce that law or rule. Administrative enforcement often starts with a warning letter or a letter of non-compliance. If the warning does not result in compliance, enforcement is escalated to notices, orders, or civil penalties. These tools are described in more detail in the following sections. Note that not all Ecology programs have legal authority to use all administrative enforcement tools available because we delegate some enforcement authority to local government. The following pie chart shows the number of enforcement actions issued by Ecology in 2008 and 2009. Figure 4: 2008 Program Enforcement Actions
Air Quality, 124
Hazardous Waste, 13
Industrial Section, 17
Nuclear Waste, 1Shorelands, 6
Spills, 151
Toxics Cleanup, 108
Waste 2 Resources (formerly Solid Waste),
20
Water Quality, 130 Water Resources, 2

Department of Ecology 2008-09 Enforcement Report – December 2010 6
2009 Program Enforcement Actions 587 Total
Figure 5: 2009 Program Enforcement Actions
Air Quality, 134
Hazardous Waste, 8
Industrial Section, 7
Nuclear Waste, 0
Shorelands, 4
Spills, 122
Toxics Cleanup, 153
Waste 2 Resources (formerly Solid Waste),
13
Water Quality, 114
Water Resources, 32
Department of Ecology 2008-09 Enforcement Report – December 2010 7
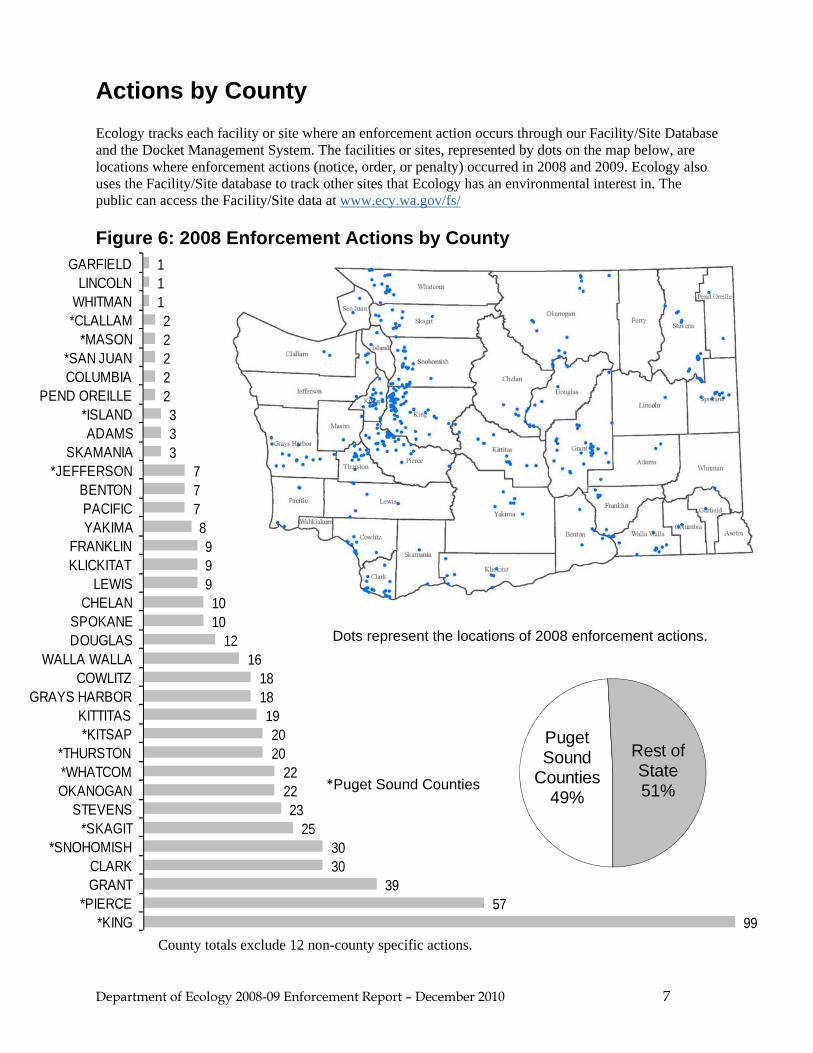
Actions by County Ecology tracks each facility or site where an enforcement action occurs through our Facility/Site Database and the Docket Management System. The facilities or sites, represented by dots on the map below, are locations where enforcement actions (notice, order, or penalty) occurred in 2008 and 2009. Ecology also uses the Facility/Site database to track other sites that Ecology has an environmental interest in. The public can access the Facility/Site data at www.ecy.wa.gov/fs/ Figure 6: 2008 Enforcement Actions by County 1
1122222333
77789991010
1216
1818192020
222223
253030
3957
99
GARFIELDLINCOLN
WHITMAN*CLALLAM
*MASON*SAN JUANCOLUMBIA
PEND OREILLE*ISLANDADAMS
SKAMANIA*JEFFERSON
BENTONPACIFICYAKIMA
FRANKLINKLICKITAT
LEWISCHELAN
SPOKANEDOUGLAS
WALLA WALLACOWLITZ
GRAYS HARBORKITTITAS*KITSAP
*THURSTON*WHATCOMOKANOGAN
STEVENS*SKAGIT
*SNOHOMISHCLARKGRANT
*PIERCE*KING
Puget Sound
Counties49%
Rest of State51%*Puget Sound Counties
Dots represent the locations of 2008 enforcement actions.
County totals exclude 12 non-county specific actions.

Department of Ecology 2008-09 Enforcement Report – December 2010 8
11122222333
77789991010
1216
1818192020
222223
253030
3957
99
GARFIELDLINCOLN
WHITMAN*CLALLAM
*MASON*SAN JUANCOLUMBIA
PEND OREILLE*ISLANDADAMS
SKAMANIA*JEFFERSON
BENTONPACIFICYAKIMA
FRANKLINKLICKITAT
LEWISCHELAN
SPOKANEDOUGLAS
WALLA WALLACOWLITZ
GRAYS HARBORKITTITAS*KITSAP
*THURSTON*WHATCOMOKANOGAN
STEVENS*SKAGIT
*SNOHOMISHCLARKGRANT
*PIERCE*KING
Figure 7: 2009 Enforcement Actions by County
Puget Sound
Counties53%
Rest of State47%
*Puget Sound Counties
Dots represent the locations of 2009 enforcement actions.
County totals exclude 8 non-county specific actions.

Department of Ecology 2008-09 Enforcement Report – December 2010 9
Trends in Notices, Orders, and Penalties The following graphs represent years of consistent data collection for agency notices, orders, and penalties, and the initial penalty assessment amount (the original dollar amount of the penalty before any appeal process). Throughout the mid-1980s and mid-1990s, the number of enforcement actions Ecology issued was constant. The increase in notices and orders seen in 1999, 2000, and 2001 are attributed to:
• Increased efforts to control smoke from agricultural burning. • Targeted inspections of facilities that produce hazardous waste. • Targeted inspections of underground storage tanks. • Large number of well drilling-related violations. • Slight increase in oil and hazardous material incidents responses. • Emphasis on compliance with water quality certifications, and orders to meter water use. • Increased dairy farm inspections. (The Legislature handed over dairy farm inspections to the
Department of Agriculture in 2003.)
Several of these actions came from new or enhanced programs authorized by the Washington State Legislature, the federal government, or an Ecology administrative action. Enforcement actions were steady for the past nine years with only a slight increase in overall totals in the last three years.

Department of Ecology 2008-09 Enforcement Report – December 2010 10
Figure 8: Agency-wide Notices, Orders & Penalties 1985-2009
0 200 400 600 800 1000 1200
2009200820072006200520042003200220012000199919981997199619951994199319921991199019891988198719861985
Agency-WideNotices, Orders & Penalties 1985 - 2009
Notices Orders Penalties

Department of Ecology 2008-09 Enforcement Report – December 2010 11
Table 1: Agency Total Enforcement Actions and Penalty Amounts*
YEAR Notices Orders Penalties Total
Enforcement Actions
Total Penalty Initial Assessed
Amount
1985 58 172 220 450 $822,028
1986 116 200 216 532 $1,009,468
1987 121 138 198 457 $1,046,147
1988 62 94 195 351 $1,082,875
1989 83 83 199 365 $1,615,977
1990 138 100 167 405 $2,566,900
1991 84 146 152 382 $1,532,580
1992 101 167 130 398 $2,246,782
1993 85 185 100 370 $1,811,350
1994 135 194 185 514 $1,211,150
1995 107 209 109 425 $703,380
1996 79 107 115 301 $1,128,899
1997 90 99 163 352 $1,506,295
1998 141 136 165 442 $1,895,777
1999 385 162 247 794 $2,691,353
2000 507 370 171 1048 $2,335,678
2001 231 707 166 1104 $1,193,650
2002 221 205 211 637 $17,051,430
2003 188 159 181 528 $1,207,992
2004 191 79 170 440 $1,465,362
2005 198 96 156 450 $1,991,441
2006 180 118 197 495 $2,056,023
2007 180 128 212 520 $2,778,557
2008 175 166 231 572 $1,732,269
2009 150 143 294 587 $2,058,266
*These penalty amounts reflect the initial assessment amount before any appeals process or negotiations where the total amount may be reduced. 2002 totals include $15,720,000 in penalties issued for the 1999 Bellingham spill and fire.

Department of Ecology 2008-09 Enforcement Report – December 2010 12
Notices Ecology uses a Notice of Violation or a Notice of Non-compliance to officially inform a facility or site owner they have violated or have the potential to violate environmental laws. Notices cannot be appealed to the Pollution Control Hearings Board or the Shoreline Hearings Board. In some cases, we will issue a field citation up to $3,000 with a Notice of Non-Compliance. Figure 9: Agency-wide Number of Notices by Year 1985-2009
58116121628313884101851351077990141385507231221188191198180180175150
0 100 200 300 400
1985198619871988198919901991199219931994199519961997199819992000200120022003200420052006200720082009
Agency-wide Notices 1985-2009

Department of Ecology 2008-09 Enforcement Report – December 2010 13
Administrative Orders Ecology uses Orders to direct a person or business to correct a violation of an environmental law. Orders are authorized by statute, and most can be appealed to either the Pollution Control Hearings Board or the Shoreline Hearings Board. Figure 10: Agency-wide Number of Orders by Year 1985-2009
1722001389483100146167185194209107991361623707072051597996114128166143
0 100 200 300 400
1985198619871988198919901991199219931994199519961997199819992000200120022003200420052006200720082009
Agency-wide Orders 1985-2009

Department of Ecology 2008-09 Enforcement Report – December 2010 14
Civil Penalties When Ecology issues a civil penalty, our investigation must prove that a violation of law occurred. State laws set the maximum amounts, usually on a per-day and/or per-violation basis. Civil penalties are not considered “punitive.” We use them to secure correction of violations and to deter future violations. Civil penalties can be appealed to the Pollution Control Hearings Board or the Shoreline Hearings Board. Figure 11: Agency-wide Number of Penalties by Year 1985-2009
For summaries of Ecology penalties, initially assessed $1,000 or more, visit: www.ecy.wa.gov/enforce.html
220216198195199167152130100185109115163165247171166211181170156195212231294
0 100 200 300 400
1985198619871988198919901991199219931994199519961997199819992000200120022003200420052006200720082009
Agency-wide Penalties 1985-2009
Department of Ecology 2008-09 Enforcement Report – December 2010 15
Penalty Assessment Civil penalties are a monetary incentive to change behavior to ensure compliance with state law. Monetary penalties are aimed at correcting environmental violations and deterring future violations. Ecology considers several factors when deciding the appropriate amount of the penalty. 1. The nature of the violation:
• Severity of the violation (public health and/or environmental effect). • Magnitude of the violation (amount and type of pollution). • Whether the violation was due to negligence, recklessness, or was intentional. • Precautions taken to prevent the violation.
2. The prior behavior of the violator:
• Record of similar violations or a pattern of violations. • Multiple notices of the violation and applicable corrective actions.
3. Actions taken by the violator to correct the problem:
• Degree of cooperation in working toward compliance. • Timeliness and appropriateness of corrective actions taken. • Compensation paid or agreed to for damages to public resources.
A violator has the option to respond to a penalty in one of four ways.
• The violator does not file an appeal within the allowed time and the penalty amount becomes due. • The violator appeals the penalty to the Pollution Control Hearings Board or the Shorelines
Hearings Board and the amount may be reduced. • The violator and Ecology negotiate a traditional or innovative settlement agreement that may
include a Supplemental Environmental Project in lieu of part of the penalty being reduced. Ecology makes every effort to collect the final penalty amount. In general, larger penalties that remain unpaid are referred to the state Attorney General’s Office. The Attorney General’s Office may seek a judgment in Superior Court and may have a lien placed on property owned by the penalized party. After taking appropriate legal actions, penalty collection may be referred to a collection agency. Not all penalty dollars are collected. This can be due to many factors:
• An inability to locate the debtor. • The costs exceed the benefits of further collection procedures. • A compromise is negotiated. • Collection remedies are exhausted. • The business is bankrupt. • The corporation has no assets. When a penalty is appealed, the Pollution Control Hearing Board
(PCHB) or Shorelines Hearing Board (SHB) may reduce the penalty amount owed. The following two figures show total initial penalty dollars assessed compared with the number of penalties, and the amount of penalties paid, reduced, under appeal, and the outstanding balance owed (not under appeal).

Department of Ecology 2008-09 Enforcement Report – December 2010 16
Figure 12: Agency-wide Initial Penalty Assessments 1985-2009
Agency-wide Initial Penalty Assessments 1985-2009
* 2002 totals exclude $15,720,000 in penalties issued for the 1999 Bellingham spill and fire. Note: The penalty issued dates prior to 2004 are derived from the dates Ecology inspectors requested an enforcement/docket tracking number for the enforcement action, not the date the action was taken.
$0
$500,000
$1,000,000
$1,500,000
$2,000,000
$2,500,000
$3,000,000
0
100
200
300
400
500
600
700
800
Agency Wide Initial Penalty Assessments
Total Number of Penalties Total $ Amount of Initial Penalty Assessment

Department of Ecology 2008-09 Enforcement Report – December 2010 17
Reduced by PCHB or Ecology,
-$4,016,630
Paid, $5,785,748
Under Appeal, $1,286,798
Amount Owed, $1,388,519
Figure 13: Cumulative Dollar Amount of Penalties
*The initial penalty amount is the amount prior to an appeals process where the amount may be reduced. The money collected from enforcement penalties is deposited in special accounts that pay for:
• Restoration and enhancement projects that compensate Washington citizens for damage to our environmental, recreational, archaeological, or aesthetic natural resources.
• Research and development of projects that help prevent or mitigate damage to our environmental resources and help protect human health.
• Permitting and regulatory programs to promote the wise management of our air, land, and water. • Projects that provide grants to local governments for various environmental programs. • Projects that help inform, educate, and assist local government, industry, and the public in order
to help preserve, protect, and enhance our natural resources and human health
The most common accounts and corresponding laws, Revised Code of Washington (RCW), are: • Air Pollution Control – RCW 70.94.015 • Biosolids Permit – RCW 70.95J.025 • Coastal Protection – RCW 90.48.400 and RCW 90.48.390 • Electronic Recycling – RCW 70.95N.130 • Oil Spill Prevention – RCW 90.56.510 • Reclamation – RCW 18.104.155 and RCW 89.16.020 • State Toxics Control – RCW 70.105D.070 • Underground Storage Tank – RCW 90.76.100 • Vessel Response – RCW 90.56.335
There are more accounts not listed here. To learn more about Ecology’s budget, account uses, and purposes go to the Ecology Budget & Program Overview 2009-2011 at http://www.ecy.wa.gov/biblio/0901014.html pages 103-112. To learn more about the RCWs go to the Washington State Legislature website visit: http://apps.leg.wa.gov/rcw/
Cumulative Dollar Amount of Penalties July 1, 2003 through December 2009
*Initial Assessment $10,723,942

Department of Ecology 2008-09 Enforcement Report – December 2010 18
Innovative Settlements and Supplemental Environmental Projects Violators can appeal all penalties to the Pollution Control Hearings Board or the Shorelines Hearing Board. Both boards strongly encourage each party to reach a settlement to avoid a formal hearing. Ecology’s settlement objective is to achieve compliance with state environmental laws and regulations, mitigate or restore damage done to the environment where possible, and encourage use of pollution prevention strategies to reduce future wastes generated. Settlements typically fall under two categories:
• Traditional Settlements: These types of settlements reduce a penalty or revise an order to avoid litigation.
• Innovative settlements: In these types of settlements all or portion of the penalty is diverted to a Supplement Environmental Project (SEP). This type of settlement does not allow for any type of reduction in the assessed penalty amounts for actions or activities that are already required by law or those that are set to become enforceable requirements at a future date.
In an innovative settlement the liable party is responsible for proposing activities that meet all of the innovative settlement criteria below:
• The proposal must result in benefits beyond correcting existing violations and provide assurances regarding future compliance.
• The penalty paid, plus the net cost of the innovative proposal, must reflect the gravity of the violation and the economic benefit of non-compliance.
• There should be a relationship between the nature of the violation and the environmental benefit sought through the proposal.
A Supplemental Environmental Project (SEP) should satisfy the three main elements above and must benefit the community where the violation took place. There are four types of SEPs:
• Pollution prevention. • Environmental restoration. • Enhancement and monitoring. • Environmental auditing; and public awareness projects.
To see examples of Ecology’s Innovative Settlements visit: http://www.ecy.wa.gov/services/enforce/settlements.html
Department of Ecology 2008-09 Enforcement Report – December 2010 19
Air Quality
Overview The mission of the Air Quality Program is to protect, preserve, and enhance the air quality of Washington to safeguard public health and the environment, and support high quality of life for current and future generations. Air quality affects public health, the environment, and quality of life. Air pollution causes lung disease and makes existing respiratory and cardiopulmonary disease worse. It can speed up the death of people who have these diseases. Hundreds of studies show that short and long-term exposure to air pollution increases emergency room visits, hospitalizations, and medication use. Exposure to air pollution can cause absences from work and school, and restricts the activity of people with impaired respiratory or cardiopulmonary function. Air pollution also harms plant and animal life, negatively affects the value of homes, and disrupts personal comfort and well-being. Three levels of government are responsible for controlling air pollution in Washington State:
• The federal government, through the Environmental Protection Agency (EPA), sets national air pollution standards. The EPA is also responsible for air quality issues on tribal lands and is working with Indian Reservations to set up individual tribal air quality programs.
• State government, through Ecology and, in some cases, the Energy Facility Site Evaluation Council, is required to enforce certain federal standards and state air quality requirements developed to meet the specific needs of Washington State.
• Local governments, in the form of local air agencies, have responsibility within single or multi-county jurisdictions. Local air agencies issue air permits and make sure businesses comply with state and federal air quality laws and regulations. They develop local rules to meet specific community needs.
Air Quality Permits Local air pollution control agencies and Ecology issue permits for new and existing industrial and commercial facilities that create air pollution. These permits are written to make sure all federal and state air quality laws and regulations are met. Ecology and local air agencies also issue air permits for agricultural, land clearing and other outdoor burning. These permits help ensure farmers, land owners, and businesses manage and minimize the public health threats from smoke. The priorities of our air quality permit programs are to:
• Protect public health and the environment. • Provide consistent and clear permit requirements to the regulated community. • Provide timely permit processing. • Focus on permit requirements that provide environmental benefit. • Keep local control of federal permit programs.
Compliance Assurance Ecology uses multiple approaches to make sure facilities and individuals comply with air quality requirements. These approaches all incorporate the Ecology Code of Conduct which emphasizes streamlined procedures, helpful communications, and cooperation. Examples of these approaches are:
• Site visits by trained field staff to build and maintain good relationships with the community. • Mutual agreements and negotiated orders to resolve difficult problems.

Department of Ecology 2008-09 Enforcement Report – December 2010 20
• Professional staff dedicated to technical and regulatory assistance. • Public participation meetings, workshops, and hearings on controversial issues. • Webpages, publications and public education and outreach to share information. • Media campaigns in newspapers, radio, and television. • Single-industry or sector based compliance assurance activities. • Assistance to applicants and the public in getting their questions answered or issues resolved
quickly. The goal of enforcement is to influence the behavior of both the violator and the general regulated community by motivating citizens, businesses, and industries to voluntarily comply with environmental requirements. If a business or citizen violates an air quality rule, Ecology attempts to resolve the problem quickly. Depending on how serious the violation is, Ecology may initiate formal enforcement actions to correct the problem. Types of enforcement actions Ecology’s Air Quality Program generally use are:
• Notice of Correction: Written warning to the violator that provides information on what they must do to comply with the law (no fines).
• Notice of Violation: Provides formal notice to the violator that a specific violation has occurred and that Ecology is considering a penalty action for the violations. The Notice offers the violator a 30-day window of opportunity to meet with Ecology to provide more information about their violations.
• Notice of Civil Penalty: A civil penalty is a monetary fine. When the 30 days are up through the Notice of Violation process, a Notice of Penalty may be issued. Penalties of up to $10,000 per day/ per violation may be levied against the violator. The penalty to be assessed is calculated from a matrix that considers severity of impacts, prior history of the violator, and economic benefit criteria. These penalties may be appealed to the Pollution Control Hearings Board.
• Compliance Orders: Compliance orders may accompany a Notice of Violation requiring the violator to take necessary corrective action or to submit a plan for corrective action. A date when such action will be initiated must be included.
Environmental Trends In 1991, the Washington State Legislature increased efforts to improve and protect air quality statewide. Since then, overall air quality in Washington has greatly improved. However, recent health studies show that air pollutants cause significant harm at much lower levels than previously thought. EPA is in the process of revising each of its national air quality health standards for six chemicals known as “criteria” pollutants. The criteria pollutants are:
• Sulfur dioxide • Carbon monoxide • Ozone • Particulate matter • Lead • Nitrogen dioxide
EPA recently strengthened the national air quality health standards for fine particulate matter (PM2.5) and is in the process of modifying ozone standards to better protect public health. PM2.5 is made up of tiny pieces of soot, dust, and gases. These particles are so small they penetrate deep into the lungs where they can cause serious health problem. Ozone is formed when emissions from motor vehicles and industry interact in the presence of sunlight. It affects the body’s respiratory system, especially in children and asthmatics.
Department of Ecology 2008-09 Enforcement Report – December 2010 21
When an area violates a federal air quality standard, EPA can designate the area “nonattainment.” EPA has designated the Wapato Hills-Puyallup River Valley area in nonattainment of the 24-hour PM2.5 standard. Ecology must submit a plan to EPA by December 2012 to bring this area back into attainment with PM2.5 standard by 2014. The Central Puget Sound area violated the 2008 ozone standard during the 2006-2008 period. EPA is now revisiting the 2008 standards for ozone. Until the new standards are agreed upon, Ecology is in a stand-by mode waiting to see how this scenario will develop, and if the new standards will result in additional ozone nonattainment areas. Besides the six criteria pollutants listed above, hundreds of other toxic or hazardous air pollutants enter the atmosphere from a variety of sources. Because of limited air quality data, we know less about the public health and environmental risks from toxic air pollutants than we do about the risks from criteria pollutants. With help from the EPA, Ecology has conducted toxic air pollutant studies in several locations in Seattle, Tacoma, Vancouver, and Spokane. We have also conducted a risk review to identify the most serious toxic air pollutants. Together, these studies indicate that diesel vehicle exhaust, wood smoke, and emissions that evaporate from motor vehicles have a significant impact on public health in Washington.
Enforcement Trends In the past, Ecology’s Air Quality Program focused our air quality enforcement activities on air pollution from commercial and industrial sources and burning. Commercial and industrial enforcement activity has been relatively stable over the last decade. We identify violations during routine inspections and site visits. We take enforcement actions when a business or industry is emitting more air pollution than state rules or permits allow. Ecology also may initiate enforcement action against industrial facilities that begin construction without an air quality permit as required by law. Minor violations that do not have significant environmental impact are normally resolved through technical assistance and education instead of enforcement. In 2008, there was a decrease in the total dollar amount of initial penalties assessed, even though the number of enforcement actions continued to climb in both 2008 and 2009. The reason for the decrease in 2008 was due to one large penalty issued in 2007. Increased education and outreach along with frequent inspections and a better understanding of air quality regulations helps industry and citizens stay in compliance. In 2009, Air Quality staff continued efforts to increase field presence. Site inspections, permit application inspections, and compliance response all increased. Both the number of violations investigated and the number of written enforcements increased. Though it might appear that more violations are occurring, Ecology believes that these violations have been occurring over the years and that Ecology, through increased field presence, is now more aware of violations and is following up on them. The Air Quality Program in 2008 and 2009 put a major emphasis on the collection of fees, review of compliance in the registration and Air Operating Permit programs and outdoor burning. Follow-through in our work is crucial for an appropriate, credible and responsive enforcement approach. The summary below covers the work on this during the last biennium. Registration: $320,300 in fees was assessed to air quality registration sources for the 2007-2009 biennium. The program sent delinquency notices for $22,000 in outstanding fees over the summer of 2009. Many sources were eventually persuaded to pay their outstanding fees, a few requested payment plans, and $4000 in fees was sent to collection.

Department of Ecology 2008-09 Enforcement Report – December 2010 22
Air Operating Permits: $2,764,231 was assessed in air operating permit fees to the largest air pollution sources in the state regulated by Ecology for the FY08/09 biennium. In FY08 and FY09, $218,519.46 in air operating permit fees from five sources were delinquent. Past due notices were sent out and the outstanding fees were paid. Recently, outdoor burning and wood stove smoke complaints made up a significant portion of Ecology’s Air Quality Program enforcement activities. In the winter, smoke management teams get complaints of excessive wood smoke from woodstoves and fireplaces, sometimes smelling like garbage or other noxious materials. In the spring and fall, they receive complaints of smoke from land clearing and residential backyard burning. Every complaint is tracked and followed up on by a smoke management team member. Technical assistance in the form of telephone calls, site visits, and referrals combined with education and outreach campaigns that explain the harmful effects of wood smoke often address these behaviors. However, we will issue a formal enforcement action when needed. Agricultural burning enforcement has continued to be a priority, especially during the major burn seasons of fall and spring. Because of the maturity of the program, when violations do occur, the nature of the violation has shifted from violations for burning without a permit to violations of permit conditions; in other words, burners generally purchase permits, but they don’t always follow the rules contained in those permits. Overall outdoor burning enforcement has increased for two main reasons:
1. As agricultural burning compliance improves, Ecology’s Air Quality Program is shifting its efforts to other types of outdoor burning. Coordination with other state and local agencies and an increased field presence is leading to an increase in reported outdoor burning violations.
2. As of January 1, 2007, residential and land clearing burning became illegal in all urban growth
areas affecting several smaller communities in the state. The Air Quality Program continues education, outreach, and technical assistance to help these communities better understand outdoor burning requirements and find alternatives to burning that work for their communities.
For more information about air quality in Washington State, visit Ecology’s website: www.ecy.wa.gov/programs/air/airhome.html

Department of Ecology 2008-09 Enforcement Report – December 2010 23
Table 2: Air Quality Program Enforcement Actions and Penalties Amounts
YEAR Notices Orders Penalties
Total Number of
Enforcement Actions
Total Amount of Initial Penalty Assessment
1985 3 5 20 28 $24,400
1986 4 3 8 15 $13,200
1987 3 1 23 27 $13,000
1988 5 18 43 66 $58,000
1989 30 8 20 58 $16,750
1990 61 23 84 $13,800
1991 31 2 11 44 $15,250
1992 23 2 10 35 $38,500
1993 31 8 10 49 $35,700
1994 41 2 4 47 $8,250
1995 18 15 4 37 $10,430
1996 15 2 5 22 $27,000
1997 32 2 10 44 $129,945
1998 24 2 7 31 $284,300
1999 130 5 33 168 $241,212
2000 208 11 23 242 $157,458
2001 103 34 5 142 $57,000
2002 60 9 3 72 $35,500
2003 41 2 2 45 $4,500
2004 90 3 13 106 $66,250
2005 75 1 12 88 $62,190
2006 78 1 10 89 $79,443
2007 97 7 10 114 $141,000
2008 106 7 11 124 $54,769
2009 109 12 13 134 $94,418

Department of Ecology 2008-09 Enforcement Report – December 2010 24
Figure 14: Air Quality Program Notices, Orders & Penalties 1985-2009
Figure 15: Air Quality Program Initial Assessed Penalty Trends 1985-2009
0
50
100
150
200
250
Air Quality ProgramNotices, Orders & Penalties 1985-2009
Notices Orders Penalties
$0
$50,000
$100,000
$150,000
$200,000
$250,000
$300,000
$350,000
$400,000
0
50
100
150
200
250
Air Quality ProgramInitial Assessed Penalty Trends 1985-2009
Penalties Total Amount of Initial Penalty Assessment
Note: The penalty issued dates prior to 2004 are derived from the dates Ecology inspectors requested an enforcement/docket tracking number for the enforcement action not the date action the action was taken.

Department of Ecology 2008-09 Enforcement Report – December 2010 25
Hazardous Waste Overview The mission of the Hazardous Waste and Toxics Reduction Program is to foster sustainability, prevent pollution, and promote safe waste management. Many manufacturers, businesses, service industries, and homes use hazardous and toxic chemicals. If these chemicals are not disposed of properly, they can harm the environment and the public. When these chemicals get into the environment through the waste stream, they may cause immediate environmental damage or may stay for a very long time and build up in the food chain. Currently, about 4,100 hazardous waste generators generate more than 112 million pounds of hazardous waste each year in Washington (2008 data-update1). Ecology’s goal is to work with these generators to reduce the amount of hazardous waste they generate each year by 2 percent. To accomplish its mission, Ecology’s Hazardous Waste and Toxics Reduction Program focuses its work around these objectives:
• Reduce the generation of hazardous waste through technical assistance. • Increase safe hazardous waste management through technical assistance. • Increase compliance and take action on significant environmental threats from hazardous waste. • Prevent hazardous waste pollution through permitting, closures, and corrective actions. • Improve community access to hazardous waste information and quality data.
Hazardous Waste Management Permits Ecology requires all facilities that treat, store and/or dispose of hazardous wastes to get a permit. This permit makes sure their design, construction, maintenance, and operating procedures protect public health and the environment. Currently, Washington State has 14 active facilities covered under the Treatment, Storage and Disposal Permitting Program. These facilities treat and dispose of hazardous waste from around the state, from other states, and even from other countries. Besides their operating permit, Ecology requires these facilities to have a closure plan and financial assurance. The closure plan has step-by-step procedures the facility must follow to remove all waste and clean structures when the facility stops operating. The goal is to prevent pollution and restore the land for future use. Financial assurance will pay for the proper closure of the facility.
Compliance Assurance Voluntary Compliance Ecology expects dangerous waste generators to voluntarily comply with the state dangerous waste rules2. Ecology uses a variety of tools to educate facilities on the rules, including publications, and web-based material for specific industries.
1 Source: 2008 Beyond Waste Data 2 Chapter 173-303 Washington Administrative Code
Department of Ecology 2008-09 Enforcement Report – December 2010 26
Compliance Assistance Ecology provides compliance assistance visits to hundreds of businesses and facilities every year. These visits are often aimed at specific geographic areas, waste streams, or industry types. The purpose of the visits is to:
• Make business operators aware of hazardous waste requirements. • Provide information on how regulations apply to their business. • Offer information to gain voluntary compliance with the requirements.
An enforcement action would result from a compliance assistance visit only if an imminent or actual threat to human health or the environment were discovered. Ecology will conduct on-site compliance assistance visits upon request. Unannounced Inspections Ecology routinely conducts unannounced inspections to determine regulatory compliance. Depending on the significance of the violation(s), most are resolved through informal enforcement. Ecology will send the business a report and a compliance certificate to ask them to correct the problems they found during the inspection. For significant violations, Ecology may contact the facility again to ensure they understand the requirements and have corrected the violations. Ecology recognizes that enforcement is costly for both the agency and the business. Ecology is usually willing to work with the business to address issues without formal enforcement if the issues are resolved in a timely fashion. If the business does not comply through the informal processes, Ecology may take one of the more formal actions to get them to comply with the rules. Typically, we do not need to take these more aggressive actions. When formal enforcement is used, Ecology often pursues innovative settlements to allow portions of penalties to be used for Supplemental Environmental Projects (SEPs). In addition, technical assistance is provided through the Technical Resources for Engineering Efficiency (TREE) program. The TREE program makes it possible for Ecology engineers to help businesses identify ways to reduce energy and water use, and to reduce, reuse or recycle wastes instead of incinerating or burying them. For more information about this program, visit Ecology’s website: http://www.ecy.wa.gov/tree/index.html Pollution Prevention Plans The state Hazardous Waste Reduction Act requires certain businesses to prepare plans for voluntary waste reduction1. Ecology conducts more than 720 toxics-related technical assistance visits2 each year to these facilities. Read the Hazardous Waste and Toxics Reduction Program Plan on Ecology’s website: www.ecy.wa.gov/pubs/0501055/0501055_hwtr.pdf
1 For waste reduction tracking, the program does not include non-recurrent waste streams, waste reported by the Hanford Nuclear Reservation, waste reported by treatment, storage and disposal facilities (because this waste is already reported by generators) and certain wastes that are treated on-site or discharged as waste water under a water quality permit or authorization. 2 Targeted toxics-related technical assistance visits for FY 2010 (starting July ’09)
Department of Ecology 2008-09 Enforcement Report – December 2010 27
Environmental Trends In 1992, Washington businesses generated 317 million pounds of hazardous waste. By 2008, the amount was reduced to 112 million pounds. This 64 percent reduction was due to:
• Pollution prevention awareness. • Implementing pollution prevention business practices. • Reduced business activity. • Improved compliance with rules.
Enforcement Trends Since early 1996, Ecology has analyzed the “compliance indicator violations” issued to find out if our compliance inspections helped facilities reduce problems that affect the environment and public health problems. These violations indicate threatened or immediate actual harm to human health or the environment and suggest that other significant violations may also be occurring at the site. Ecology looks for compliance indicator violations during every inspection. They include specific violations of the dangerous waste rules such as:
• Spills to the environment. • Illegal disposal of a hazardous waste. • Failing to check if wastes were hazardous. • Serious waste storage (container) violations.
Results of the analysis show that when inspectors emphasize technical assistance, environmental threats decrease. To further reduce environmental threats, Ecology began to target inspections based on:
• Increased response on significant complaints. • Increased use of referrals from local government and other Ecology employees. • Better use of our data to target generators not inspected before. • A “Hitting the Highpoints” philosophy of spending more time resolving environmental threats,
and less time at facilities that are managing their waste safely. The data we collect in the next few years will help us decide if our current strategy is still effective or if change is required. The next graph shows the number of penalties and environmental threats Ecology found during compliance inspections. In general, penalties track closely to the number of environmental threat violations found during inspections.

Department of Ecology 2008-09 Enforcement Report – December 2010 28
Figure 16: HWTR – Number of Penalties vs. Number of Environmental Threats
Figure 17: HWTR – Number of Inspections and Environmental Threats Resolved
0
2
4
6
8
10
12
0
50
100
150
200
250
300
350
400
450
2000 2001 2002 2003 2004 2005 2006 2007 2008 2009
Number of Environmental Threats Number of Penalties
0
50
100
150
200
250
300
350
400
450
2000 2001 2002 2003 2004 2005 2006 2007 2008 2009
Number of Environmental Threats Number of Inspections
Penalties Environmental
Threats

Department of Ecology 2008-09 Enforcement Report – December 2010 29
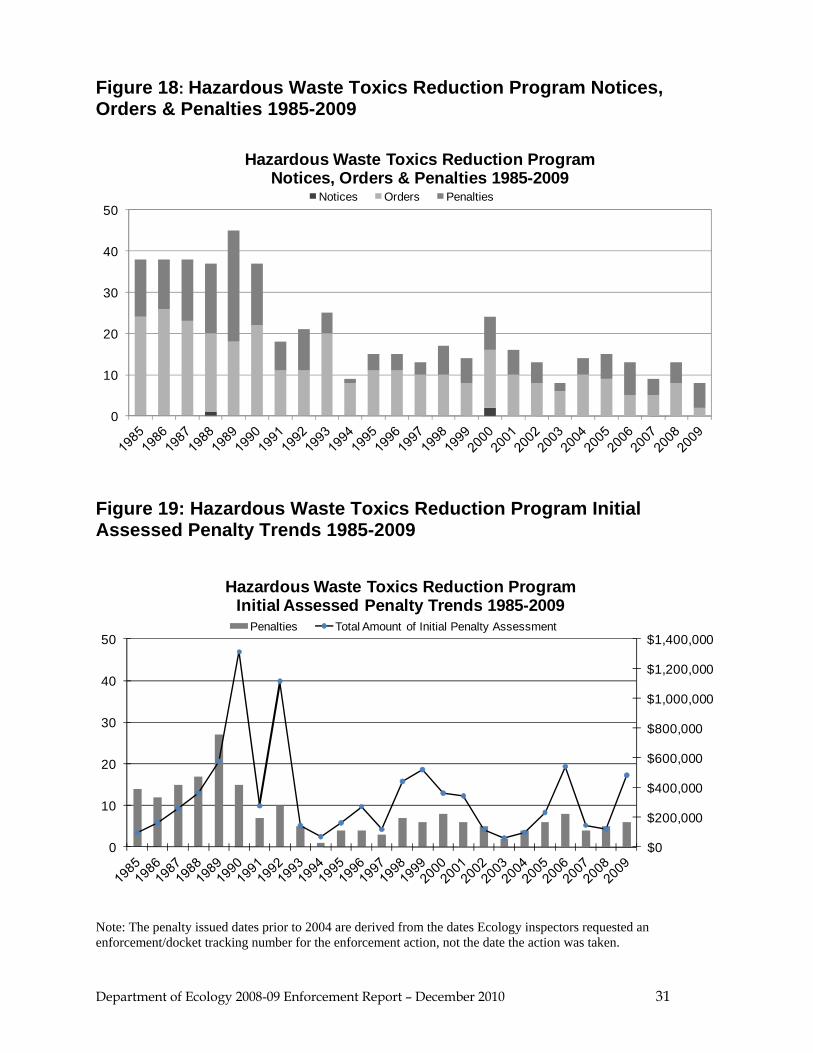
Environmental Threats Resolved The previous graph shows the number of compliance inspections and environmental threat violations Ecology found and resolved. With more inspections and education, the number of environmental threats decreased from 2000 to 2003. Since 2003, some environmental threats have not been resolved voluntarily, but have instead resulted in formal enforcement actions. The number of environmental threats was decreasing until 2008, when an increase in inspections saw a corresponding increase in environmental threats. In 2009, the number of inspections and environmental threats has stayed fairly consistent. With five penalties assessed in 2008 and six assessed in 2009, the number of penalties was fairly consistent. The total dollar amount of initial penalties assessed increased dramatically in 2009 because of two very large penalties ($288,000 and $101,000) (see following Table 3). For more information about the Hazardous and Toxic Reduction Program, visit Ecology’s website: www.ecy.wa.gov/programs/hwtr/index.html

Department of Ecology 2008-09 Enforcement Report – December 2010 30
Table 3: Hazardous Waste Management Enforcement Actions and Penalty Amounts
YEAR Notices Orders Penalties Total
Enforcement Actions
Total Amount of Initial Penalty Assessment
1985 0 24 14 38 $97,500
1986 0 26 12 38 $163,000
1987 0 23 15 38 $259,847
1988 1 19 17 37 $365,000
1989 0 18 27 45 $577,000
1990 0 22 15 37 $1,314,500
1991 0 11 7 18 $277,000
1992 0 11 10 21 $1,116,000
1993 0 20 5 25 $145,000
1994 0 8 1 9 $70,000
1995 0 11 4 15 $163,000
1996 0 11 4 15 $272,000
1997 0 10 3 13 $119,000
1998 0 10 7 17 $441,500
1999 0 8 6 14 $521,500
2000 2 14 8 24 $363,500
2001 0 10 6 16 $343,000
2002 0 8 5 13 $118,480
2003 0 6 2 8 $59,000
2004 0 10 4 14 $97,000
2005 0 9 6 15 $234,000
2006 0 5 8 13 $541,500
2007 0 5 4 9 $146,000
2008 0 8 5 13 $121,000
2009 0 2 6 8 $482,500
Department of Ecology 2008-09 Enforcement Report – December 2010 31
Figure 18: Hazardous Waste Toxics Reduction Program Notices, Orders & Penalties 1985-2009
Figure 19: Hazardous Waste Toxics Reduction Program Initial Assessed Penalty Trends 1985-2009
Note: The penalty issued dates prior to 2004 are derived from the dates Ecology inspectors requested an enforcement/docket tracking number for the enforcement action, not the date the action was taken.
0
10
20
30
40
50
Hazardous Waste Toxics Reduction ProgramNotices, Orders & Penalties 1985-2009
Notices Orders Penalties
$0
$200,000
$400,000
$600,000
$800,000
$1,000,000
$1,200,000
$1,400,000
0
10
20
30
40
50
Hazardous Waste Toxics Reduction ProgramInitial Assessed Penalty Trends 1985-2009
Penalties Total Amount of Initial Penalty Assessment

Department of Ecology 2008-09 Enforcement Report – December 2010 32
Industrial Section
Overview The mission of the Industrial Section is to partner with many of Washington’s largest industrial facilities to limit their impact on citizens and the environment. The Industrial Section is a unique section within the Waste 2 Resources Program (formerly the Solid Waste and Financial Assistance Program) that focuses on permits and compliance for three major industries and other minor industries of Washington State:
• Aluminum smelters • Oil refineries • Pulp and paper mills • Other minor industries
Industrial Section employees are trained to handle the complex issues related to these specific industries. They are responsible for environmental permitting, site inspections, and compliance issues. They regulate air, water, hazardous waste and cleanup activities at pulp and paper mills and aluminum smelters. They also regulate water, hazardous waste, and cleanup activities at oil refineries. Because of recent aluminum smelter closures, the Industrial Section has accepted more responsibilities. This includes water, dangerous/solid waste, and clean up issues at:
• Agrium (a fertilizer manufacturer) • Emerald Kalama Chemical (formerly Noveon, a chemical manufacturer) • Pacific Functional Fluids (formerly Lilyblad) (a chemical blender) • Columbia Ethanol (a fuel grade ethanol manufacturer) • Ocean Protein LLC (a fish waste processing plant) • Sonoco Products Company (a recycled paperboard manufactures)
The goal of the Industrial Section is to provide a single point of contact for these major facilities. Rather than having multiple inspectors work on the many environmental issues at a plant, one engineer provides coverage for air, water, and dangerous/solid waste permitting and compliance activities. In addition, upon request by the regions within the Department of Ecology, the Industrial Section will provide engineering responsibilities as an in-house consultant. As an example, the Industrial Section provides technical assistance related to new source review for the Air Program’s eastern regional office.

Department of Ecology 2008-09 Enforcement Report – December 2010 33
Permits The Industrial Section issues and manages the following types of permits for 43 major industries and their associated industries in Washington State. Table 4: Industrial Section Permit Types
Type of Permit Type of Industry 2008 Number of Permits
2009 Number of Permits
Wastewater Discharge Permits
National Pollutant Discharge Elimination System (NPDES) Permits
32 31
State wastewater discharge permits 14 12
Title V Air Operating Permits Aluminum smelters and pulp and paper mills 11 10
Resource Conservation and Recovery Act (RCRA) permits
Four of the largest oil refineries and two aluminum smelters. 6 6
Solid Waste Permits
One pulp and paper mill and two oil refineries 3 3
Compliance Assurance
In an effort to assure compliance, the Industrial Section conducts unannounced inspections. The inspections are not based on an individual permit for compliance purposes. Instead, inspectors focus on multiple permits the industry is responsible for complying with. Engineers also collect and analyze water samples for parameters with limits in the permit to determine compliance with those limits. Another tool for compliance assurance is monitoring requirements, which are specified in the RCRA, air quality, and water quality permits. Also, some monitoring and reporting requirements are specified in regulations. In such cases, the monitoring and reporting required by applicable rules and regulations is included in the permits. When absent from the applicable rules, monitoring requirements are assigned in the permit when appropriate. Monitoring and reporting procedures are often derived by best professional judgment. The monitoring requirements are prescribed to assure compliance with limits, as required by the respective programs. One of the important roles of the section is its capability to enforce the limits in the permits and rules when the engineers find violations as the results of the inspections. The available tools include civil penalty and technical assistance for compliance purposes.
Environmental Trends Air quality continues to improve as waste streams at major industries are collected and treated. This is particularly apparent when compared to other sources such as motor vehicles. One of the major reasons for fewer emissions from industries is compliance with the Federal Maximum Achievable Control Technology (MACT) standards for hazardous air pollutants. The first stage of MACT standards went into effect in 2001. Additional stages now apply, and others are expected. The increased monitoring required by MACT can be difficult at times, but industry compliance has been good. The regulatory scheme continues to push for reduced pollution per unit of production.

Department of Ecology 2008-09 Enforcement Report – December 2010 34
Enforcement Trends The economy contributed to fewer enforcement actions during the last several years. High electrical costs forced most aluminum smelters in the state to cut back on their operations. Sluggish economic activity reduced the demand for packaging products made by the pulp and paper industry. Reduced mill activities, along with industry efforts to comply with environmental requirements also contributed to fewer enforcement actions. For more information about the Industrial Section, visit Ecology’s website: www.ecy.wa.gov/programs/swfa/industrial/

Department of Ecology 2008-09 Enforcement Report – December 2010 35
Table 5: Industrial Sections Enforcement Actions and Penalty Amounts
YEAR Notices Orders Penalties Total Enforcement Actions
Total Amount of Initial Penalty Assessment
1985 9 27 91 127 $277,200
1986 7 12 77 96 $390,350
1987 2 10 50 62 $427,250
1988 3 9 59 71 $381,950
1989 6 13 92 111 $589,100
1990 7 11 61 79 $483,350
1991 3 22 65 90 $842,000
1992 28 28 41 97 $438,750
1993 10 6 25 41 $202,400
1994 31 13 34 78 $267,200
1995 21 17 28 66 $209,900
1996 16 18 28 62 $173,250
1997 26 9 36 71 $226,500
1998 15 6 20 41 $181,977
1999 15 13 19 47 $326,848
2000 14 18 28 60 $572,800
2001 10 27 17 54 $95,000
2002 4 6 7 17 $77,500
2003 10 10 15 35 $70,817
2004 15 5 19 39 $237,564
2005 5 4 11 20 $49,500
2006 7 2 11 20 $44,000
2007 10 2 9 21 $62,750
2008 7 0 10 17 $28,000
2009 2 0 6 8 $156,000

Department of Ecology 2008-09 Enforcement Report – December 2010 36
Figure 20: Industrial Section Notices, Orders & Penalties 1985-2009
Figure 21: Industrial Section Initial Assessed Penalty Trends 1985-2009
Note: The penalty issued dates prior to 2004 are derived from the dates Ecology inspectors requested an enforcement/docket tracking number for the enforcement action, not the date the action was taken.
0
20
40
60
80
100
120
140
Industrial SectionNotices, Orders & Penalties 1985-2009
Notices Orders Penalties
$0
$200,000
$400,000
$600,000
$800,000
$1,000,000
0
20
40
60
80
100
120
140
Industrial SectionInitial Assessed Penalty Trends 1985-2009
Penalties Total Amount of Initial Penalty Assessment

Department of Ecology 2008-09 Enforcement Report – December 2010 37
Nuclear Waste
Overview The mission of the Nuclear Waste Program (NWP) is to ensure sound management of nuclear waste statewide and to promote the sound management and protection of the environment at, and adjacent to, the U.S. Department of Energy’s (U.S. DOE)Hanford Site. The Hanford site consists of 560 square miles in southeast Washington. Hanford’s half-century of nuclear materials production has created one of the world’s most polluted areas. Objectives include:
• Enforce regulatory compliance and cleanup at the Hanford Site and at other facilities managing nuclear waste statewide.
• Promote public involvement, congressional and federal contact, and interstate activities in order to enhance nuclear waste management, compliance, and cleanup of the Hanford Site.
• Ensure appropriate oversight for the safe management and disposal of radioactive wastes at the Richland commercial low-level radioactive waste disposal site.
• Provide oversight of the Hanford Reservation and other facilities managing mixed waste to ensure compliance with the dangerous waste permit, Tri-Party Agreement (TPA), and environmental regulations.
To accomplish its Hanford mission, NWP focuses its work around specific program projects: • Hanford tank waste storage • Hanford tank waste disposal • Hanford waste management • Hanford facility transition • Hanford environmental restoration
In addition to the Hanford mission, the Nuclear Waste Program oversees mixed waste management at the permitted Puget Sound Naval Shipyard, and Permafix facilities.
Nuclear Waste Management Permits
Compliance Assurance Ecology maintains a close working relationship with the U.S. DOE and their contractors located on-site. Permit conditions are typically developed together, and all parties meet almost daily on one issue or another. The comprehensive permitting process, public comment cycles, Hanford Advisory Board meetings, and various project manager meetings provide opportunities for Ecology to provide technical assistance to the U.S. DOE. At United States Department of Defense and commercial nuclear facilities, the Nuclear Waste Program conducts regular site visits and uses a permitting process similar to that used for Hanford. The Nuclear Waste Program issues and manages the following types of permits for the Hanford site and associated mixed waste facilities in Washington State.

Department of Ecology 2008-09 Enforcement Report – December 2010 38
Table 6: Nuclear Waste Permit Types
Type of Permit Type of Industry 2008 Number of Permits
2009 Number of Permits
Waste Discharge Permits
State wastewater discharge permits
6 6
Hanford Sitewide Air Operating Permits
Air Emissions Sitewide
1 1
Hanford Dangerous Waste permit
One of the largest permits made up of 55 DW operating units, closure, corrective action and post-closure
1 1
Statewide Mixed Waste Permits
One federal and one commercial
2 2
If a facility owner or operator fails to comply with a permit condition, Ecology will generally address the violation through formal or informal enforcement actions. Ecology often adds the corrective measures designed to remedy violations into the various dangerous waste operating permits to help avoid repeat violations.
Compliance Assurance The NWP main focus for compliance is with dangerous and/or mixed waste for the state. The Hanford Reservation is our largest facility. In an effort to maintain compliance and oversight we use the dangerous waste Sitewide Permit, Hanford Federal Facility Agreement and Consent Order Tri-Party Agreement (TPA), and state and federal hazardous waste and superfund cleanup laws. Dangerous waste permits are used for the other 2 facilities. Announced and unannounced dangerous waste permit inspections are conducted as well as inspections based on TPA milestones. Site visits to assess cleanup activities occur weekly and at many locations. Compliance assurance also includes the requirements of air quality and water quality permits, more importantly the monitoring and reporting requirements of all the Hanford permits and TPA. Groundwater monitoring requirements is significant at Hanford and is specified in permits and through regulations and the TPA. Additional tools for compliance assurance are Hanford Advisory Board meetings, various stakeholder meetings and NWP project manager meetings providing opportunities for our program to provide technical assistance to the Permittees and answer public concerns. Enforcement is how Ecology uses its state civil authority to require Permittees to comply with permits and laws. It is an important tool for protecting human health and the environment. Our program has a graduated approach matching the enforcement action to the significant or seriousness of the violation. Enforcement tools are warning letters, non-compliance letters, formal actions, orders, and civil penalties.

Department of Ecology 2008-09 Enforcement Report – December 2010 39
Environmental Trends Air quality continues to improve with completion of a three-year cycle Full Compliance Evaluation in December 2010 and two Hanford AOP revisions. Two semiannual and two annual compliance certification assessments were completed. Water quality program at Hanford continues to improve establishing fewer discharges to the ground decreasing the impacts to migration of contaminants across the site. One of the reasons for fewer discharges is compliance with the Hanford state wastewater discharge permits, oversight of best management practices and closure of operating facilities.
The permit work to issue a new dangerous waste sitewide permit to Hanford has created a new phase of sitewide compliance for U.S. DOE and its contractors. When the new permit is issued and becomes effective, permit compliance will be much better. Groundwater remediation and monitoring continues and improves with a requirement from U.S. DOE to install more monitoring wells in the next 5 years. Considerable challenges remain to treat or stop the spread of contaminated groundwater plumes and protect the Columbia River.
Enforcement Trends U.S. DOE Hanford is in Significant Non-Compliance (SNC) because of noncompliance with schedules established in a consent agreement (TPA). This 1989 agreement and consent order between Ecology, EPA, and U.S. DOE established schedules and milestones for cleanup activities at the 560 square mile Hanford federal facility. Cleanup and compliance activities at the Hanford Site are complex and not easily resolved. Hanford's SNC status will continue for some time. In the past six years, NWP has conducted 52 dangerous waste inspections, issued 14 notices of violation, including corrective measures, and issued 4 administrative orders or civil penalties. We assessed $770,000 in civil penalties. We initiated a lawsuit to compel United States Department of Energy to perform an adequate study of the environmental impact of proposed federal waste management decisions and initiated a lawsuit to enforce the terms of the Tri-Party Agreement after negotiations to change some key deadlines came to an impasse. Legal negotiations of milestones under the TPA and high program resources to complete the new Hanford Sitewide Permit contributed to fewer enforcement actions. Additionally, a high turnover in staff reduced enforcement activities. For air quality, NWP will have completed 45 on-site physical inspections. Inspections have led to three determinations of violation, one Notice of Correction, and three agency initiated permit modifications or revocations The graphs at the end of this section appear to show a cyclical pattern of dangerous waste enforcement actions, but this is coincidental. Issuing enforcement actions depends on a number of factors, including the types of operations that occur on Hanford at the time and degree of success in resolving dangerous and/or mixed waste management issues voluntarily. For more information about the Nuclear Waste and Hanford Nuclear Reservation, visit Ecology’s website: www.ecy.wa.gov/programs/nwp/index.html
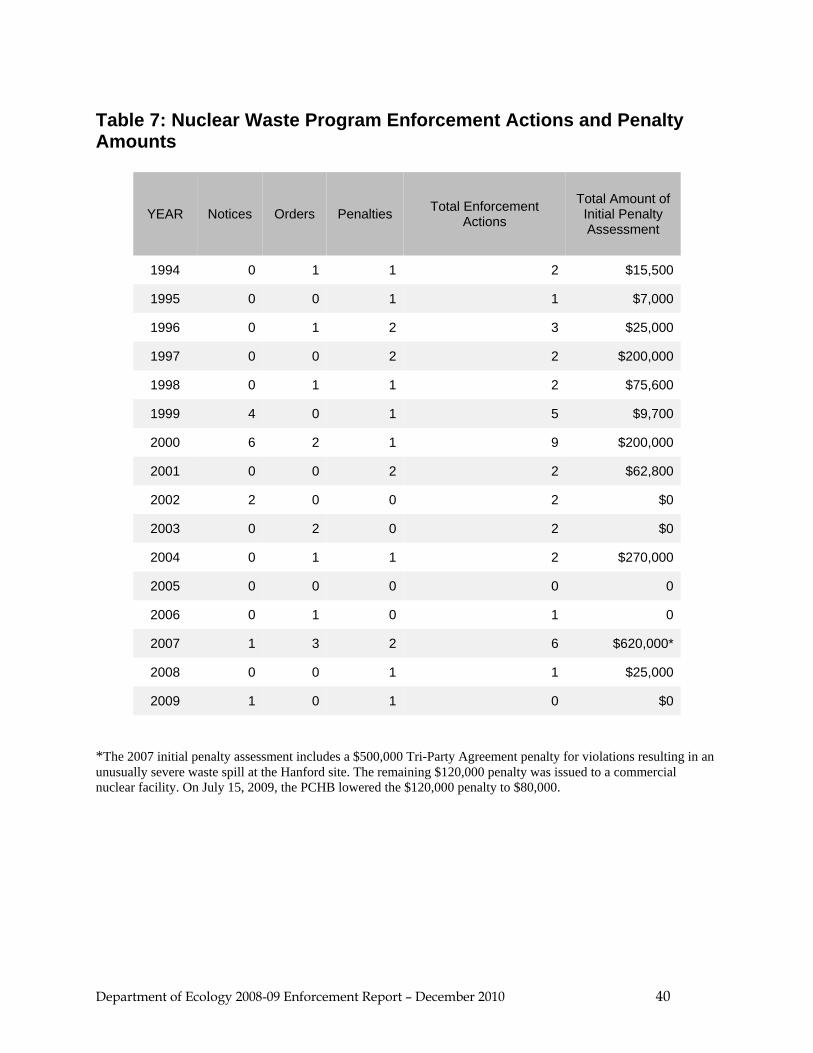
Department of Ecology 2008-09 Enforcement Report – December 2010 40
Table 7: Nuclear Waste Program Enforcement Actions and Penalty Amounts
YEAR Notices Orders Penalties Total Enforcement Actions
Total Amount of Initial Penalty Assessment
1994 0 1 1 2 $15,500
1995 0 0 1 1 $7,000
1996 0 1 2 3 $25,000
1997 0 0 2 2 $200,000
1998 0 1 1 2 $75,600
1999 4 0 1 5 $9,700
2000 6 2 1 9 $200,000
2001 0 0 2 2 $62,800
2002 2 0 0 2 $0
2003 0 2 0 2 $0
2004 0 1 1 2 $270,000
2005 0 0 0 0 0
2006 0 1 0 1 0
2007 1 3 2 6 $620,000*
2008 0 0 1 1 $25,000
2009 1 0 1 0 $0
*The 2007 initial penalty assessment includes a $500,000 Tri-Party Agreement penalty for violations resulting in an unusually severe waste spill at the Hanford site. The remaining $120,000 penalty was issued to a commercial nuclear facility. On July 15, 2009, the PCHB lowered the $120,000 penalty to $80,000.

Department of Ecology 2008-09 Enforcement Report – December 2010 41
Figure 22: Nuclear Waste Program Notices, Orders & Penalties 1994-2009
Figure 23: Nuclear Waste Program Initial Assessed Penalty Trends 1994-2009
Note: The penalty issued dates prior to 2004 are derived from the dates Ecology inspectors requested an enforcement/docket tracking number for the enforcement action, not the date the action was taken.
0
2
4
6
8
10
Nuclear Waste ProgramNotices, Orders & Penalties 1994-2009
Notices Orders Penalties
No ActionsNo
Actions
$0
$50,000
$100,000
$150,000
$200,000
$250,000
$300,000
0
2
4
6
8
10
Nuclear Waste ProgramInitial Assessed Penalty Trends 1994-2009
Penalties Total Amount of Initial Penalty Assessment
No Actions No ActionsNo
Actions
$620,000
No Actions No ActionsNo
Actions
$620,000
Department of Ecology 2008-09 Enforcement Report – December 2010 42
Shorelands and Environmental Assistance
Overview The mission of the Shorelands and Environmental Assistance Program is to work in partnership with communities to support healthy watersheds and promote statewide environmental interests. To achieve its mission, Ecology’s Shorelands and Environmental Assistance Program staff work on the following objectives:
• Protect, restore, and manage shorelands and wetlands, with local government. • Streamline the review of environmental permits for major transportation projects. • Provide technical and financial assistance to local governments for reducing flood hazards and
local watershed planning. • Provide technical training, education, and research through the Padilla Bay Estuarine Reserve. • Restore watersheds by supporting community-based projects with the Washington Conservation
Corps. • Protect water quality by reviewing and conditioning projects. • Provide technical assistance on reviews required by the state Environmental Policy Act.
In the arena of environmental compliance, the Shorelands and Environmental Assistance Program works in close collaboration with local governments, the Ecology Water Quality Program, the U.S. Army Corps of Engineers (Corps) and other entities. In some cases, we are in the leading role with support from others. In other situations, we provide support to the agency taking lead on compliance. Our support role ranges from technical support to staff to legal involvement.
Shorelines Management Permits Since the early 1970s, Ecology has been the lead state agency for developing long-term strategies for how to manage the state’s shorelands. This includes about 800 lakes, 22,000 river miles, 2,337 miles of marine shorelines, and countless wetlands. Ecology works with local governments to protect and maintain shoreline health. About 250 counties and cities have the primary authority to enforce the Shoreline Management Act (state law) and Shoreline Management Guidelines (state rules). Ecology’s primary role is to:
• Write and adopt the state rules. • Approve city and county Shoreline Master Program updates. • Provide assistance to local governments. • Ensure compliance with state law and rules.
The state’s shoreline program is designed to protect and manage development of:
• Wetlands • Floodplains • Estuaries • Beaches • Dunes • Fish and wildlife habitat
Ecology provides technical and financial assistance to local governments for coastal and floodplain development projects that protect water quality, wildlife habitat, human health, and property. There is an interdependent relationship between local government and Ecology in protection of shoreline resources.

Department of Ecology 2008-09 Enforcement Report – December 2010 43
The Shoreline Management Act (SMA) regulates development on land and in water. Violation of the SMA may occur when someone violates the conditions of a permit or attempts to develop on shorelines without a permit. Just as common are activities exempt from Shoreline permitting but are violations of the standards in the local Shoreline Master Program. In practice, this is often building within a buffer zone or filling in a wetland or flood zone. For more information about shorelands management, visit Ecology’s website: www.ecy.wa.gov/programs/sea/shorelan.html
Shorelands and Coastal Zone Management Permits Each year Ecology has the opportunity to review about 400 Substantial Development Permits (SDPs) issued by local governments. We have the opportunity to appeal SDPs to the Shoreline Hearings Board. Such appeals have been rare in recent years (one appeal filed in the past three years). Ecology also reviews about 150 Variance or Conditional Use Permits from local governments each year. Ecology takes final action on these Variance and Conditional Use Permits, including modifying permit conditions or occasionally reversing the action taken by local government. Instead of waiting until the application reaches Ecology for review, we provide technical assistance to applicants and local governments early in the process to make sure they “get it right the first time.” As a result, Ecology denies less than half of a percent of all shoreline permit applications submitted. We are also able to reduce the number of major changes to permit conditions and the need to reverse actions taken by local governments.
401 Water Quality Certification Under the Federal Clean Water Act, Section 401, Ecology reviews projects that require a federal permit or license that may result in a discharge to waters of the United States. Applicants for these permits or licenses must first get a 401 Water Quality Certification from the state to prove that the proposed project will meet state water quality standards and other aquatic protection regulations. The 401 Water Quality Certification covers both the construction and operation of the proposed project as well as any mitigation that may be required to compensate for the impacts of the project. If the project is out of compliance with the terms and conditions of the 401 Water Quality Certification, Ecology may issue an enforcement action. The 401 Water Quality Certification is a primary tool for regulating fill of wetlands. In wetland compliance actions, we may engage with local governments, the Water Quality Program, and/or the Corps. Wetland violations under the Clean Water Act are often associated with a water quality violation. We often coordinate site visits with the water quality inspectors and may rely on their capacity and expertise to pursue the enforcement action. Similarly, we often are in a supporting role as the Corps pursues illegal fill of wetlands or other waters of the United States. For more information on the 401 Water Quality Certification program, visit Ecology’s website: www.ecy.wa.gov/programs/sea/fed-permit/index.html
Department of Ecology 2008-09 Enforcement Report – December 2010 44
Compliance Assurance Ecology expects all permit holders to comply with conditions of orders, laws, and regulations. Our primary focus is education and outreach to citizens and local government officials. We often schedule meetings with applicants before and after they apply for a 401 Water Quality Certification to assist them with compliance. If Ecology finds a project is not in compliance, we make every effort to resolve the problem through voluntary compliance. If we cannot get voluntary compliance within a reasonable time, we will take formal enforcement action. If a formal enforcement action is necessary, we make sure the action is appropriate according to our Compliance Assurance Manual. We prefer to use escalating levels of enforcement to get people to comply and will issue a fair penalty depending on how serious the violation is and the responsiveness of the applicant.
Environmental Trends Shorelines remain very desirable locations for residences and other development. At the same time, our understanding is increasing that certain activities that were common in the past—such as bulkheads on marine shorelines—can damage highly valuable resources such as forage fish spawning areas. Local government’s Shoreline Master Programs are the primary tool used to protect shorelines. To improve the state’s shoreline protection, a process to update the Shoreline Master Programs was started in 2004 and will continue through 2014. We also provide technical assistance to local government authorities and “backstop” oversight of permitting for significant projects on the shoreline. To date, Ecology has not invested in a meaningful comprehensive inventory of shoreline resources to show the status of the resource over time. This limits our ability to track environmental “outcome” trends, (in contrast to “output” trends, such as investment in Shoreline Master Program updates). It is becoming increasingly common for 401 Water Quality Certifications and other permits to require permittees to send their monitoring results to Ecology. We may be able to use this data to see a trend in the future.
Enforcement Trends The following graphs show a trend of fewer Ecology penalties (late 1980s and early 1990s) and more Notices of Correction (after 2000) when state lawmakers approved them as an enforcement tool. The rise in the number of orders in 2002 and 2003 is due to an increase in requests for 401 Water Quality Certification instead of a change in the Shoreline Management Act enforcement. The focus over the last several years has been to improve the local Shoreline Master Programs, instead of trying to address problems on a project-by-project level through enforcement. Due to staff workload, there has been limited compliance oversight of 401 Water Quality Certifications during construction of development projects. Some regional wetland specialists have been focusing a little of their time on the enforcement of unpermitted wetland fill, which is reflected in Table 7. At this time, we still do not see a clear trend for enforcement actions or penalties. For many projects that involve permitted wetland fill, compensatory mitigation is required. Ecology has implemented an increased level of effort to check on the compliance of the compensatory mitigation with wetland conditions in 401 Water Quality Certifications. The initial focus is on voluntary compliance and technical assistance to insure that mitigation and other wetland conditions are successfully implemented.

Department of Ecology 2008-09 Enforcement Report – December 2010 45
In the coming years, we may see an increase in enforcement actions related to this improvement in wetland compliance checking. Ultimately, however, we are fundamentally shifting wetland mitigation compliance issues to a new way of achieving mitigation in the first place through an increase in the number of innovative wetland mitigation approaches such as wetland banks, and fee-in-lieu programs. In this way, we can help project proponents achieve much more effective mitigation in a manner that is more efficient for them. For more information about shorelands and wetlands management, visit Ecology’s webpages: www.ecy.wa.gov/programs/sea/shorelan.html and www.ecy.wa.gov/programs/sea/wetlands
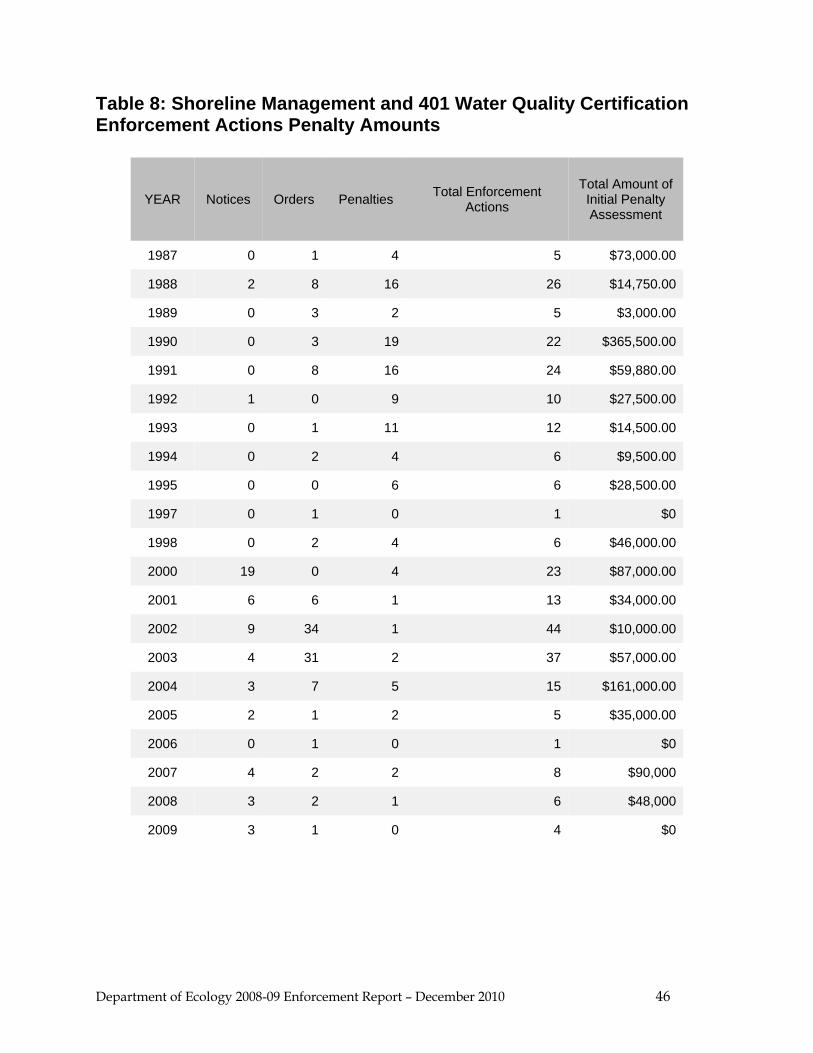
Department of Ecology 2008-09 Enforcement Report – December 2010 46
Table 8: Shoreline Management and 401 Water Quality Certification Enforcement Actions Penalty Amounts
YEAR Notices Orders Penalties Total Enforcement Actions
Total Amount of Initial Penalty Assessment
1987 0 1 4 5 $73,000.00
1988 2 8 16 26 $14,750.00
1989 0 3 2 5 $3,000.00
1990 0 3 19 22 $365,500.00
1991 0 8 16 24 $59,880.00
1992 1 0 9 10 $27,500.00
1993 0 1 11 12 $14,500.00
1994 0 2 4 6 $9,500.00
1995 0 0 6 6 $28,500.00
1997 0 1 0 1 $0
1998 0 2 4 6 $46,000.00
2000 19 0 4 23 $87,000.00
2001 6 6 1 13 $34,000.00
2002 9 34 1 44 $10,000.00
2003 4 31 2 37 $57,000.00
2004 3 7 5 15 $161,000.00
2005 2 1 2 5 $35,000.00
2006 0 1 0 1 $0
2007 4 2 2 8 $90,000
2008 3 2 1 6 $48,000
2009 3 1 0 4 $0
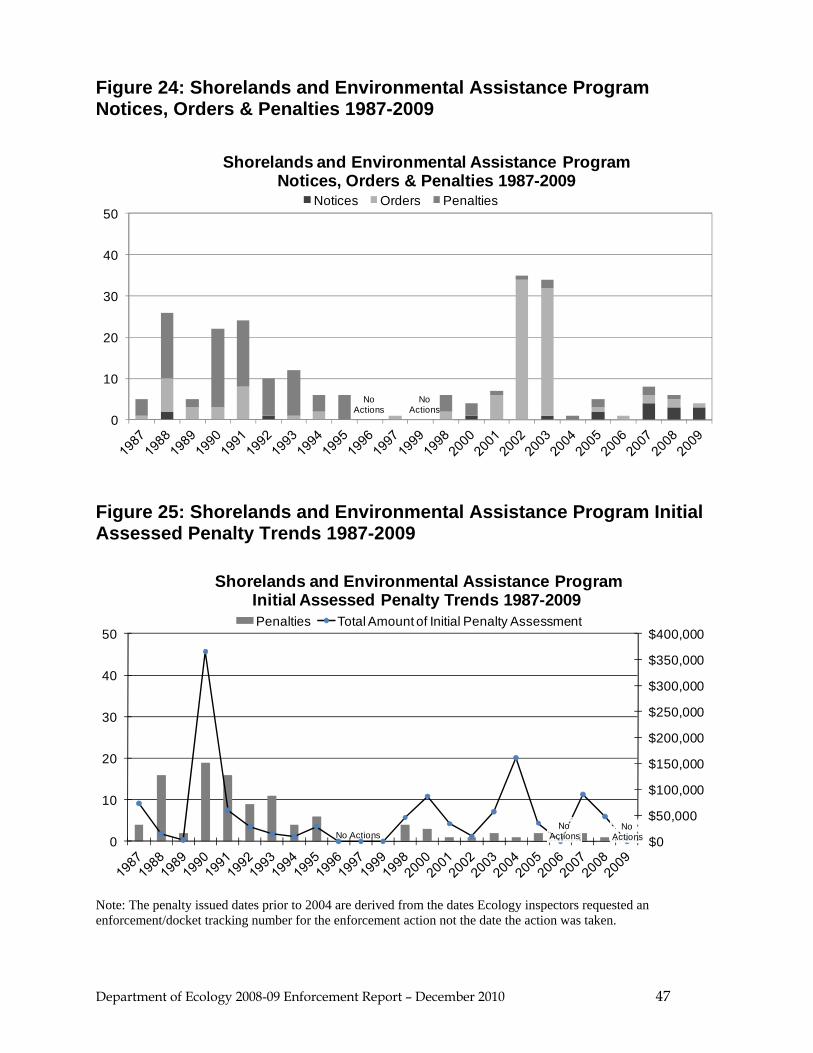
Department of Ecology 2008-09 Enforcement Report – December 2010 47
Figure 24: Shorelands and Environmental Assistance Program Notices, Orders & Penalties 1987-2009
Figure 25: Shorelands and Environmental Assistance Program Initial Assessed Penalty Trends 1987-2009
Note: The penalty issued dates prior to 2004 are derived from the dates Ecology inspectors requested an enforcement/docket tracking number for the enforcement action not the date the action was taken.
0
10
20
30
40
50
Shorelands and Environmental Assistance ProgramNotices, Orders & Penalties 1987-2009
Notices Orders Penalties
No Actions
No Actions
$0
$50,000
$100,000
$150,000
$200,000
$250,000
$300,000
$350,000
$400,000
0
10
20
30
40
50
Shorelands and Environmental Assistance ProgramInitial Assessed Penalty Trends 1987-2009Penalties Total Amount of Initial Penalty Assessment
No ActionsNo
ActionsNo
Actions

Department of Ecology 2008-09 Enforcement Report – December 2010 48
Spill Prevention, Preparedness and Response
Overview The mission of the Spill Prevention, Preparedness and Response Program (generally referred to as the Spills Program) is to protect Washington’s environment, public health and safety through a comprehensive spill prevention, preparedness and response program. The Spills Program focuses on preventing oil spills to Washington waters and land and ensuring effective response to oil and hazardous substance spills whenever they occur. Billions of gallons of oil and hazardous chemicals move through Washington each year by barge, ship, pipeline, rail, and road. Oil and chemical spills to Washington’s waters and shorelines compromise productive and valuable ecosystems that support endangered salmon and Orca populations. Spills threaten the public’s health and safety, and, in a worst case, impede the economy. The Spills Program works with oil companies, shippers and transporters, and users of oil to prevent spills and quickly respond to those that do occur. The Spills Program is comprised of three main sections, Prevention, Preparedness, and Response. To accomplish its mission, Ecology’s Spills Program is working on these objectives:
• Prevent spills from vessels and oil-handling facilities. • Prepare for spill response through planning and drills. • Respond to and clean up oil and hazardous material spills. • Restore environmental damage caused by oil spills.
Compliance Assistance Prevention Prevention is about educating vessel and facility personnel to be safe and vigilant. Each year, approximately 3,500 commercial ships and barges make an average of 7,200 trips to Washington waters typically bound for Washington, Canadian, and Oregon ports. There are also 4,500 oil barge trips in our waters. Each of these vessels pose a risk of a serious oil spill. Ecology vessel inspectors conduct about 1,000 onboard vessel inspections per year. Rules governing oil transfers over state waters (fueling and cargo operations) went into effect October 26, 2006, adding approximately 125 new facilities to the Prevention Section’s regulated community. Over 2008, some facilities made choices that brought them either within or outside of Spills transfer regulations. Currently, of the four classes of facilities:
• Class 1 facilities include 23 large, previously regulated facilities, and a biodiesel plant in Grays Harbor;
• Class 2 facilities include 22 tank truck companies, one less than in 2007; • Class 3 facilities include 3 small shoreside tank farms, the same as in 2007; and • Class 4 facilities includes approximately 65 marinas that fuel boats, nine less than in 2007.
In 2008, Ecology personnel conducted 2,547 vessel and oil handling facility inspections—up from 2,234 in 2007. In 2008, we conducted 495 cargo and passenger vessel inspections, up from 461 in 2007. We conducted 1,492 vessel fueling or cargo oil transfer inspections, 292 more than in 2007. In 2009, Ecology oil transfer inspectors conducted 1,496 oil transfer inspections, 10.85% of all reported oil transfers over Washington waters. This is up from 1,486 inspections in 2008 and 9.85% of all

Department of Ecology 2008-09 Enforcement Report – December 2010 49
reported oil transfers. This inspection program has resulted in an 87% reduction in average monthly violations found during oil transfer operations since January, 2008. Ecology’s vessel inspectors boarded 1,088 commercial vessels which resulted in 1,000 inspection and oil spill notification drills. 2009 numbers were slightly down from 2008 (1,108 boarding’s and 1,051 inspections and oil spill drills) as a result of losing two vessel inspector positions in the 2009 budget reductions. However, Ecology refocused its vessel inspections to the highest risk vessels and increased comprehensive compliance inspections from 91 in 2008 to 227 in 2009, a 150% increase. Spills and threats of spills also provide the opportunity to identify prevention measures that can be implemented in the future. Careful investigation and analysis of the systems and personnel involved lead to lessons learned for the company and the agencies involved. In 2008, prevention investigators conducted 24 spill investigations leading to enforcement and prevention recommendations, three more than in 2007. In 2009, investigators completed 11 spill investigations, 13 fewer than in 2008. Preparedness Oil handling facilities, commercial vessels, and petroleum pipelines must develop and maintain a spill contingency plan to be used in the event of an oil spill. These plans cover:
• Over 750 miles of oil transmission pipelines. • More than 30 facility terminals. • Thousands of vessel transits by tankers bound for state refineries, and cargo, fishing and
passenger vessels. • 14 primary response state-approved response contractors cited in these plans able to respond to a
spill 24 hours a day. • Equipment pre-staged in more than 20 counties across the state.
These facilities, vessels, and pipelines must also conduct spill drills to test their contingency plans to make sure they can provide an effective response should an actual spill occur. In 2008, preparedness plan managers reviewed and approved 36 oil spill contingency plans that covered over a thousand vessel companies, oil refineries and terminals, tank ships and barges, pipelines, and other smaller oil handling facilities. One new pipeline plan was added in 2008. Fourteen response contractors submitted applications for Ecology approval in 2008, three more than in the past. In 2009, preparedness plan managers reviewed 30 contingency plans, six less than in 2008, of which 16 were granted full approval. Fourteen were conditionally approved as companies continue to improve plans to meet the regulatory standards. In addition to review and approval of plans and contractor applications, preparedness planners evaluated drills to ensure companies were able to implement their plans in the event of a spill. Drills were evaluated by preparedness staff using established regulatory standards. Plans and drills are designed to demonstrate readiness to respond to oil spills, large and small, and to minimize impacts to human health, water quality, fish and wildlife, cultural, and economic resources. In 2008, contingency plan holders conducted 556 drills, 56 more than in 2007:
• 542 were unannounced vessel notification drills, of which 75 notification drills were conducted as technical assistance visits rather than evaluated for drill credit,
• 63 deployment drills, • 19 management team table-top drills, • 10 worst-case scenario table-top drills, and • No unannounced table-top drills.

Department of Ecology 2008-09 Enforcement Report – December 2010 50
In addition, one actual spill response was granted drill credit, and Ecology conducted two internal drills. Overall, drill participation by the Spills Program was significantly reduced in 2009 due to budget cuts. Emphasis was shifted from agency participation in the design, staffing, and evaluation of tabletop drills. The oil handling companies began to self-certify for table-top drill credit. Additionally, the reduced budget and personnel cuts forced Spills to scale back unannounced vessel notification drills. During 2009, contingency plan holders conducted a total of 434 drills, 132 fewer than in 2008:
• 354 were unannounced compliance vessel notification drills. • 49 equipment deployment drills during which 41 different Geographic Response Plan strategies
were tested during these drills. Additionally, three of the deployments were actual spill responses granted drill credit.
• 19 management team table-top drills. 10 were self-certified by the company. • 12 worst-case scenario table-top drills. One conducted out of state and 6 self –certified. • No unannounced table-top drills.
In 2008 and 2009, the Spills Program emphasized large-scale deployment drills to test simultaneous response actions, such as deployments to reduce impacts to natural resources along with enhanced on water skimming. This type of drill allows us to simulate the complexity of communications and coordination that would occur during an actual spill. A preparedness milestone of 2009 was the first ever deployment of the state’s new oiled wildlife rehabilitation equipment. Companies must have access to equipment capable of rehabilitating 100 birds mobilized within 24 hours of becoming aware of a spill. In response to this standard, a mobile rehabilitation system was designed and constructed. The system is pre-staged, and is ready to be brought to a spill site as needed. Response The Spills Program is the state’s spill responder for spills of oil or hazardous substances to water. Most spill reports are of small sheens, smells, unknown substances from unknown sources. Ecology’s response units work with federal agencies, and local and regional fire, police and health agencies to improve response times and effectiveness. In 2008, Ecology’s spill responders received a total of 3,742 incident reports throughout the state, 70 less than in 2007. The incidents included:
• 2,466 reports of oil spills. • 173 reports of chemical spills. • 197 reports of methamphetamine labs. • 921 reports of unclassified discharges.
Based on these reports, response units conducted a field response to 1,183 incidents and confirmed 32 oil spills equal to or greater than 25 gallons spilled to surface waters of the state for a total of 3,127 gallons of oil. In 2009, Ecology’s spill responders received 3,707 incident reports throughout the state, 35 less than 2008. The incidents included:
• 2,467 reports of oil spills. • 202 reports of chemical spills. • 186 reports of methamphetamine labs. • 858 reports of unclassified discharges.

Department of Ecology 2008-09 Enforcement Report – December 2010 51
Based on these reports, response units conducted a field response to 1,188 incidents and confirmed 22 oil spills equal to or greater than 25 gallons spilled to surface waters for a total of 3,686 gallons of oil.
Environmental Trends Measuring the health of Washington’s waters by the increase or decrease in the number and quantity of oil spills assumes Ecology receives reports of all spills and quantities. This is not the case. The Spills Program, however, can estimate improvement by measuring our response to spills and the number of significant spills from identified sources. For example:
• Since 2002, the number of oil spills greater than 25 gallons has decreased. In 1999, the number of these spills rose from an average of 30 per year, to a three-year high of 42 in 2002.
• Since 2003, the number of oil spills of 25 gallons or more has returned to the trend of 30 per year. • In 2008, there were 32 spills of 25 gallons or more. • In 2009, there were 22 spills of 25 gallons or more.
The three-year spike in spill numbers may represent Ecology’s greater emphasis on detecting and reporting spills, while the decline was a result of the greater awareness of the legal liabilities of the responsible party. Tracking vessel incidents provides a sense of operational safety and pollution prevention. The vessel incident rate is calculated as the percentage of trips during which large commercial vessels experience significant problems—such as an oil spill, fire, flooding, collision, or a loss of propulsion, steering or cargo—out of the total number of vessel transits in state waters. The incident rate is an indicator of the overall safety of the maritime industry.
• Between 2003 and 2007, the vessel incident rate hovered around 1 percent. • In 2008, the incident rate jumped up to 2.3 percent and the Spills Program documented 55 vessel
spills, nearly double the 2007 number. • In 2009, the incident rate was 2.11 percent and the Spills Program documented 32 vessel spills.
Based on the Spills Program investigation of 33 fuel oil transfer spills between 1999 and 2009, we were able to chart immediate causes and contributing factors.
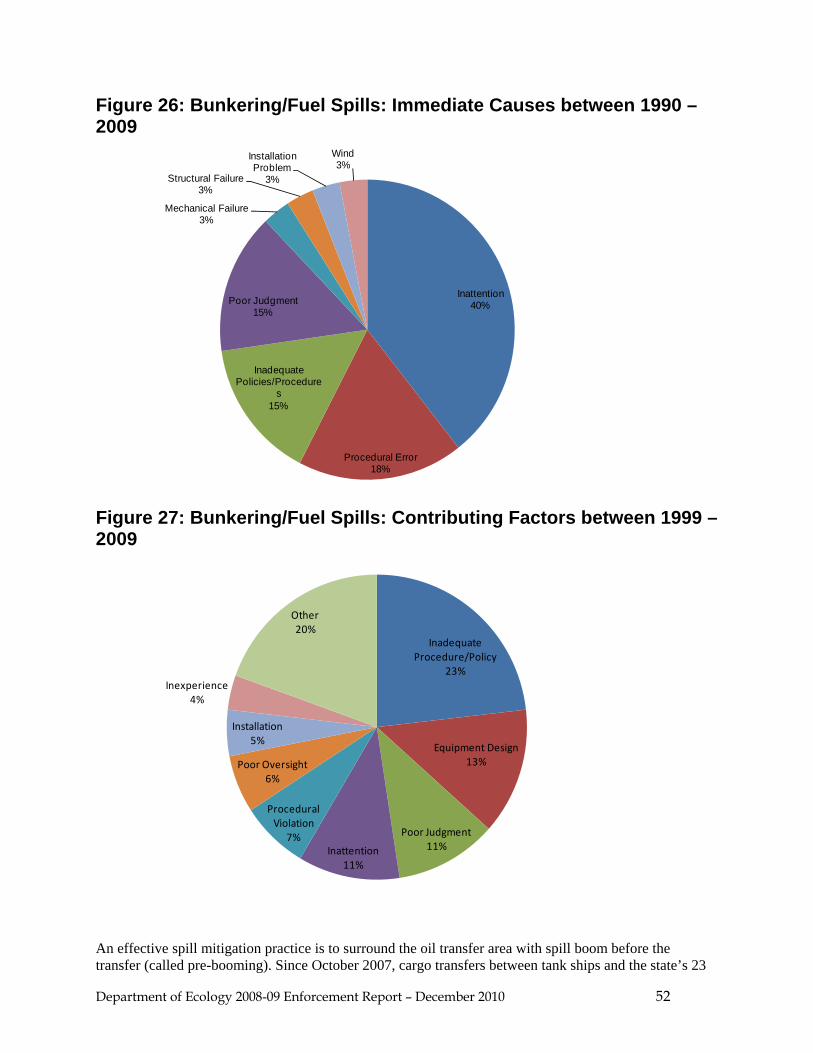
Department of Ecology 2008-09 Enforcement Report – December 2010 52
Inattention40%
Procedural Error18%
Inadequate Policies/Procedure
s15%
Poor Judgment15%
Mechanical Failure3%
Structural Failure3%
Installation Problem
3%
Wind3%
Inadequate Procedure/Policy
23%
Equipment Design13%
Poor Judgment11%Inattention
11%
Procedural Violation
7%
Poor Oversight6%
Installation5%
Inexperience4%
Other20%
Figure 26: Bunkering/Fuel Spills: Immediate Causes between 1990 – 2009
Figure 27: Bunkering/Fuel Spills: Contributing Factors between 1999 – 2009
An effective spill mitigation practice is to surround the oil transfer area with spill boom before the transfer (called pre-booming). Since October 2007, cargo transfers between tank ships and the state’s 23

Department of Ecology 2008-09 Enforcement Report – December 2010 53
Class 1 facilities were required to be pre-boomed around the vessel and dock area when safe and effective to do so. In 2008, 79% of all oil transfers required to be pre-boomed between a regulated facility and a vessel were pre-boomed. In 2009, as a result of another solid year for the inspection program, the rate increased to 88%. In 2008, the overall pre-booming compliance rate for all oil transfers required to be pre-boomed, including vessel to vessel fueling transfers, was 81%. This accounted for 66% of oil transferred during these operations. In 2009, the overall compliance rate increased substantially to 89% accounting for 82% of the volume of oil transferred during these transfer operations. In just over 2 years since the pre-booming requirements went into effect, 89% of all oil transfers over water that are required to be pre-boomed are now being pre-boomed . This is an excellent compliance achievement that helps to protect Washington waters. Supplemental Environmental Projects (SEPs) are restoration or similar projects directly funded by a responsible party in settlement of a penalty. The Spills Program encourages SEPs as a means to put money directly to use in benefiting the environment. Following are some SEPs the Spills Program worked on during 2008 and 2009:
• Miller Bay Estuary – In January 2008, Foss Maritime paid Kitsap County $415,000 to construct a larger culvert on Chief Sealth Drive to allow greater tidal influence to the estuary. Foss was penalized for a December 2003 oil spill that dumped 4,700 gallons of heavy oil into Puget Sound. Design and planning were completed and the project is scheduled to begin construction in the fall of 2010.
• Cottage Lake Park restoration-In April 2010, Associated Petroleum paid the non-profit Friends of Cottage Lake $8,000 to help restore 100 linear feet of Cottage Lake Park with native plants. In April 2009, Ecology penalized Associated Petroleum $10,000 for a 15-gallon spill on February 14, 2008, that Ecology determined to be a negligent oil spill. Settlement of the penalty involved Associated Petroleum paying Friends of Cottage Lake $8,000 for the restoration project.
Enforcement Trends The bulk of Ecology’s spill-related enforcement is issued in the form of citations that can be up to $3,000 for small spills (less than 100 gallons). Penalties that are more substantial are issued for larger spills and for spills that investigators determine were negligent and preventable. Factors that influence penalty amounts include the significance of the environmental impact, the responsible party’s compliance history, the impact to human health and safety, and effectiveness of the responsible party’s response to the incident. Other factors that mitigate or compound the response or impact of a spill may also be considered. Effective July 2007, the penalty range for negligent, reckless, or intentional oil spills was increased from a maximum of $20,000 per day that oil poses a risk to the environment, to $100,000 per day. Additionally, the size of the responsible party’s business was added as another factor to determine the penalty amount. The number of citations steadily increased from 25 in 2003 to 82 in 2008. In 2009, the number of citations issued fell to 62. The total penalty amount assessed by citation increased from $20,500 in 2003, to $52,800 in 2008, and fell to $37,550 in 2009. We assume the drop in the number of citations and the total amount from 2008 to 2009 is a reflection of the poor economy.

Department of Ecology 2008-09 Enforcement Report – December 2010 54
The Spills Program issued 13 Notices of Penalty in 2008 for a total assessed amount of $563,500, and 16 penalties in 2009 for a total assessed amount of $220,000. In 2007, Spills issued nine Notices of Penalty for a total assessed amount of $59,000. Since 2003, Spills has issued between nine and 13 Notices of Penalty per year with fluctuating totals. Other enforcement actions, such as Notices of Violation, Notices of Correction, and Administrative Orders, are issued to companies to encourage them to prevent and prepare for oil spills. In addition, the Spills Program recovers the costs state agencies incur when they respond to an oil spill by issuing an Order for Reimbursement of Expenses to the responsible party. In 2008, of the 48 Orders listed in Table 9, 43 were Orders of Reimbursement for Expenses totaling $245,999 in costs incurred by state. In 2009, of the 36 Orders listed, 33 were Orders of Reimbursement totaling $335,740 in costs incurred by the state. There was a substantial drop in Notices of Violation after 2004 which coincides with the development of the Spills Program’s Oil Transfer Program and a change in focus for vessel inspectors. Table 9: Spills Program Enforcement Actions Penalty Amounts
*Note: The 2002 total includes $15,720,000 in penalties issued for the 1999 Bellingham spill and fire.
YEAR Notices Orders Penalties Total Enforcement Actions
Total Amount of Initial Penalty Assessment
1997 0 0 2 2 $5,500
1998 47 15 23 85 $400,660
1999 100 15 19 134 $302,000
2000 101 19 29 149 $294,750
2001 42 5 36 83 $137,250
2002 48 4 61 113 $16,140,950*
2003 32 5 38 75 $520,242
2004 26 0 49 75 $178,753
2005 10 9 50 69 $778,750
2006 2 29 60 91 $646,225
2007 10 16 83 109 $118,300
2008 10 48 96 154 $626,800
2009 9 36 77 122 $257,550

Department of Ecology 2008-09 Enforcement Report – December 2010 55
Figure 28: Spills Program Notices, Orders & Penalties 1997-2009
Figure 29: Spills Program Initial Assessed Penalty Trends 1997-2009
Note: The penalty issued dates prior to 2004 are derived from the dates Ecology inspectors requested an enforcement/docket tracking number for the enforcement action, not the date the action was taken.
0
50
100
150
Spills ProgramNotices, Orders & Penalties 1997-2009
Notices Orders Penalties 158
$0
$200,000
$400,000
$600,000
$800,000
$1,000,000
0
50
100
150
Spills ProgramInitial Assessed Penalty Trends 1997-2009
Penalties Total Amount of Initial Penalty Assessment
Not included are $15,720,000 in penalties for the 1999 Bellingham f ire and spill

Department of Ecology 2008-09 Enforcement Report – December 2010 56
Toxics Cleanup
Overview The mission of the Toxics Cleanup Program is to get and keep contaminants out of the environment. Ecology has identified over 11,500 sites in Washington that are contaminated with toxic substances. To date, 57 percent of these sites have been cleaned up independently or with Ecology oversight. Over 6,700 sites were identified because a leaking underground storage tank contaminated the soil and/or underground water (groundwater). Contamination at each site is unique and can pose a different type and level of risk to human health and the environment. It is a priority for Ecology to prevent future leaks from underground storage tanks. We currently regulate about 10,600 active underground storage tanks on about 3,900 different sites/properties. These properties include gas stations, industries, commercial properties, and government-owned locations. Ecology’s role is to make sure tank owners install, manage, and monitor their tanks in a way that prevents soil and groundwater contamination. We conduct compliance inspections and provide technical assistance to tank owners to help them comply with underground storage tank rules. In addition to leaking underground tank sites, Ecology helps liable party voluntarily clean up other contaminated sites. We also conduct site investigations, cleanup studies and cleanup work. If Ecology cannot find a potential liable party, we take the lead to clean up the site. To accomplish its mission, the Toxics Cleanup Program focuses its work around these objectives:
• Clean the worst contaminated upland and aquatic sites first. • Manage underground storage tanks to minimize releases. • Provide fee-based services to site owners that volunteer to clean up their contaminated sites.
Compliance Assurance When Ecology identifies a contaminated site, we put it on a state or federal cleanup list. Ecology’s first course of action is to encourage the property owner to independently and voluntarily clean up the contaminated soil or water. To date, half of the cleanup sites (5,613) have or are done independently or through Ecology’s voluntary cleanup process. When more formal agreements are needed, Ecology will enter into agreed orders or consent decrees with the property owner(s). As a last resort, Ecology will use its enforcement authority to order the property owner to clean up the contaminated property. Ecology relies on a tiered approach to achieve compliance with underground storage tank rules:
• A compliance inspection or technical assistance visit. • A written warning (notice of non-compliance) if violations are found. • A field citation (monetary penalty), if problems are serious or prior violations were not corrected. • A formal enforcement order and penalty if compliance is not achieved through the field citation.
Formal orders may also include revoking a facility compliance tag, which prevents delivery of fuel to the entire facility until the violations are corrected.
Department of Ecology 2008-09 Enforcement Report – December 2010 57
Underground storage tank owners and operators can request a technical assistance inspection from Ecology. We will not issue a penalty during a technical assistance inspection unless we discover serious violations that may result in significant harm to human health or the environment.
Environmental Trends The Toxics Cleanup Program has made significant progress since Ecology adopted the Model Toxics Control Act (MTCA) rules in 1990. Figure 30 shows that as of December 2009, there have been 6,556 contaminated sites cleaned up or reported cleaned up in Washington State. This represents 57 percent of the 11,520 known and suspected contaminated sites in Washington. Most of these cleanups have occurred without the need for formal orders, consent decrees, or unilateral enforcement orders. In addition, cleanup work continues at another 2,930 contaminated sites, which represents 25 percent of known and suspected contaminated sites in Washington. Cleanups need to be started at 2,031 sites, which is 18 percent of the total. In 1990, Ecology adopted rules for managing underground storage tanks. Those rules are currently being revised with a projected adoption date during the fall of 2011. The Underground Storage Tank Program regulates the operation and maintenance of in-use underground storage tanks and it falls under the Toxics Cleanup Program. The Underground Storage Tank Program is a federally delegated program. Ecology received federal delegation of the program from the U.S. Environmental Protection Agency in the early 1990s. Since 1990, the number of reported leaking underground storage tanks has steadily fallen from 922 in 1990, to 78 in 2008, and 50 in 2009. In 2007, the Washington State Legislature amended the Underground Storage Tank law to incorporate more stringent federal Energy Policy Act requirements. In 2011, Ecology will be amending the associated tank rules and seeking public comment on the proposed changes.

Department of Ecology 2008-09 Enforcement Report – December 2010 58
Figure 30: Toxic Cleanup Trends of Known and Suspected Contaminated Sites as of December 2009
Enforcement Trends The Model Toxics Control Act (MTCA) authorizes Ecology to issue penalties up to $25,000 per day for failure to comply with orders and decrees. So far, Ecology has not needed to use this authority because the unique features of MTCA do not allow appeals, and it holds all parties jointly and individually liable. Ecology typically works with site owners through the Voluntary Cleanup Program, agreed orders, and consent decrees. Once in a while, Ecology does need to use its unilateral enforcement authority. In 2008 and 2009, Ecology conducted a total of about 2,600 underground storage tank inspections (900 and 1,700 respectively). The Federal Energy Policy Act of 2005 requires each state to conduct compliance inspections at underground storage tank facilities at least once every three years. In 2008 and 2009, Ecology received assistance from the U.S. EPA to help meet the federal inspection requirement by having them conduct about 450 inspections across the state. Those inspections were conducted primarily at government-owned facilities. Of the 2,600 inspections conducted by Ecology over the two year period, about eight percent of the facilities received monetary field penalties/citations. In 2008, Ecology issued 75 field penalties for a total of $30,500—an average of about $ 410 per citation. For 2009, it was 131 citations for a total of $42,200—an average of about $ 320 per citation. The two-year average is about $ 350 per citation, while and citations ranged from $100 to $1,800. The maximum underground storage tank penalty allowed by Ecology to be issued via a field citation is $2,000. During the 2008-09 period, Ecology issued only one two formal administrative enforcement orders and penalty penalties under the underground storage tank regulations. Ecology expects compliance rates to improve as underground storage tank facilities are inspected more frequently. If compliance doesn’t improve,
0
2,000
4,000
6,000
8,000
10,000
12,000
No Further Action
Cleanups in Progress
Cleanups Pending
32%
49%
19%
57%
25%
18%

Department of Ecology 2008-09 Enforcement Report – December 2010 59
Ecology expects to issue more field penalties and formal administrative enforcement orders and associated formal penalties. Ecology’s Underground Storage Tank (UST) inspectors issue Notices of Non-Compliance (NONC) to owners and operators of underground tanks. NONCs are warning letters that identify the violations found during the inspection and give timeframes for when the violations should be corrected. Ecology inspectors issue NONCs routinely. In 2008 and 2009, Ecology UST inspectors issued about 1,300 NONCs. NONCs may not be appealed to the Pollution Control Hearings Board (PCHB) or to State Superior Court. A Notice of Penalty (field citation) may be issued with an NONC. Field citations may be appealed to the PCHB. Underground storage tank NONCs are not shown on Table 10. Any enforcement or penalties issued by EPA during their inspections are also not included in Table 10. In 2008, Ecology began the process of updating its Underground Storage Tank rule, Chapter 173-360 WAC. The 1990 rule is being revised to implement the new federal requirements added to the UST statute in 2007 by the state legislature. It is also being revised and to make other needed updates and changes to make the rule easier to understand and therefore easier to comply with. Ecology plans to complete the rule writing and adoption process, including extensive opportunities for formal public review and comment in 2011. In 1995, the Washington State Legislature passed a new law, RCW 43.05, Technical Assistance Programs. This law made it possible for Ecology to provide technical assistance inspections without subjecting the facility to monetary penalties unless the inspector finds a serious potential threat to human health or the environment. The state’s delegation of the federal UST program required that it maintain authority to issue monetary penalties, even during technical assistance visits. The UST program maintains that penalty authority, however, its practice is to provide technical assistance as often as requested. For more information about cleaning up sites contaminated from a leaking underground storage tank, visit Ecology’s website: www.ecy.wa.gov/programs/tcp/cleanup.html

Department of Ecology 2008-09 Enforcement Report – December 2010 60
Table 10: Toxics Cleanup Program Enforcement Actions and Penalty Amounts
YEAR Notices Orders Penalties Total Enforcement Actions
Total Amount of Initial Penalty
Assessment
1985 0 0 3 3 $23,000
1986 0 0 0 0 $0.00
1987 0 0 0 0 $0.00
1988 1 1 0 2 $0.00
1989 0 6 0 6 $0.00
1990 0 13 5 18 $113,000
1991 0 29 0 29 $0.00
1992 0 19 2 21 $105,052
1993 0 18 10 28 $133,850
1994 0 15 24 39 $7,800
1995 0 9 22 31 $11,600
1996 0 7 6 13 $6,850
1997 0 4 18 22 $12,950
1998 0 3 12 15 $9,100
1999 4 3 79 86 $83,900
2000 6 32 31 69 $34,270
2001 0 16 32 48 $21,100
2002 0 21 29 50 $11,500
2003 0 15 36 51 $120,515
2004 0 12 50 62 $21,850
2005 0 19 35 54 $24,150
2006 0 15 42 57 $20,500
2007 0 20 50 70 $48,100
2008 0 35 73 108 $32,800
2009 0 34 119 153 $72,100

Department of Ecology 2008-09 Enforcement Report – December 2010 61
Figure 31: Toxics Cleanup Program Notices, Orders & Penalties 1985-2009
Compliance with the operation and maintenance requirements on the date of inspection rose from 35 percent in 2001 to about 48 percent in 2006. Compliance, measured 60-days after an inspection, ranges from 68 to 89 percent. Figure 32: Toxics Cleanup Program Initial Assessed Penalty Trends 1985-2009
Note: The penalty issued dates prior to 2004 are derived from the dates Ecology inspectors requested an enforcement/docket tracking number for the enforcement action, not the date the action was taken.
0
20
40
60
80
100
Toxics Cleanup ProgramNotices, Orders & Penalties 1985-2009
Notices Orders Penalties
No Actions
73 119
$0
$25,000
$50,000
$75,000
$100,000
$125,000
$150,000
$175,000
$200,000
0
20
40
60
80
100
Toxics Cleanup ProgramInitial Assessed Penalty Trends 1985-2009
Penalties Total Amount of Initial Penalty Assessment
No Actions
119
Department of Ecology 2008-09 Enforcement Report – December 2010 62
Waste 2 Resources
Overview The mission of the Waste 2 Resources Program is to reduce both the amount and the effects of wastes generated in Washington State. Solid Waste Despite the efforts of businesses and citizens to reduce, reuse, and recycle solid wastes the amount of solid waste we generate continues to increase each year. Most of the solid waste created in Washington is taken to eastern Washington landfills for disposal. In Washington State, local governments are responsible for regulating and permitting the solid waste handling systems. Solid waste handling includes the:
• Management • Storage • Collection • Diversion • Transportation • Treatment • Use • Processing • Final disposal of household, business and industrial wastes.
Ecology’s role is to set environmental protection standards for the design and operation of disposal facilities. We also provide technical and financial assistance to local governments. To achieve our mission and long-term vision, the Waste 2 Resources Program focuses its work on these objectives:
• Eliminate wastes and manage the remaining garbage. • Fund local government efforts to clean up toxic sites and manage or reduce waste. • Employ Washington students to pick up litter.
Biosolids Management Permits Ecology regulates biosolids-related activities. Biosolids are defined as municipal sewage sludge that is a primarily organic, semi-solid product resulting from the treatment of sewage wastewater that has met the quality requirements in the state biosolids rule. Biosolids are commonly applied to land as a soil amendment. All facilities that treat, apply to land, transport, or dispose of biosolids must get a biosolids management permit from Ecology. Biosolids contain essential plant growth nutrients and small amounts of pollutants and microorganisms. Biosolids must be properly treated to protect public health before applying them on land. In some instances, Ecology delegates portions of the biosolids program to a local health district. However, it is Ecology’s responsibility to issue biosolids permits and to enforce the biosolids laws, rules, and permit requirements. Electronic Product Recycling In 2007, the Waste 2 Resources Program began implementing RCW 70.95N, Electronic Product Recycling. This law requires manufacturers (brand owners) of computers, computer monitors and televisions to register annually with Ecology in order to sell their products in or into the state. In addition,

Department of Ecology 2008-09 Enforcement Report – December 2010 63
manufacturers must finance and participate in a program for the collection, transportation, and recycling of these electronics at the end of their useful lives.
Compliance Assurance Biosolids To make sure facilities comply with biosolids laws and rules, Ecology provides technical assistance and education materials to the regulated community. Ecology expects all owners and operators of regulated facilities to voluntarily comply with biosolids management laws and rules. When a facility does not voluntarily comply, it may be necessary for us to move to an enforcement action. When this is the case, we make sure we clearly define the violation and that the enforcement action is consistent with the extent of the violation. Formal enforcement actions may include an order, civil penalty, referral to the state Attorney General’s Office for court action, permit revocation, or criminal action. When Ecology issues a civil penalty, innovative solutions may be considered as appropriate mitigation, as long as the solution complies with the laws and rules. Innovative solutions include mediation, environmental audits, mandatory education programs, and compensatory action such as Supplemental Environmental Projects. Electronic Product Recycling Information about requirements for manufacturers and retailers in the new Electronic Product Recycling Law are made available on Ecology's website. Ecology has notified manufacturers, retailers, and affected businesses about the new law and its requirements through:
• A group distribution email list (List Serve) with several thousand interested party members. • Individual e-mails to specific companies. • Direct telephone contacts. • Trade associations such as the Washington Retailers Association.
The Electronic Product Recycling page on Ecology's website http://www.ecyclewashington.org includes a variety of information such as: to-date collection summaries, links to the law and Ecology's rule, a description of the program and its requirements for affected parties, Focus Sheets, Frequently Asked Questions, and lists of participants and their compliance status.
Environmental Trends Solid Waste Advances in technology and social values have increased reduction and recycling activities. Improved landfill designs have reduced potential threats to the environment. However, we have now reached a point where we need to shift our focus from proper handling of solid waste after it is generated, to preventing waste in the first place. Ecology now has a long-range plan for how to:
• Reduce the amount of solid waste generated. • Properly manage wastes that remain. • Reduce the use of toxic substances.
This plan, called “Beyond Waste,” was completed in 2004 and updated in 2009. For more information about this plan, visit Ecology’s website: www.ecy.wa.gov/beyondwaste/
Department of Ecology 2008-09 Enforcement Report – December 2010 64
Biosolids Over the past couple of decades, there has been a sharp decline in the amount of pollutants in biosolids in Washington and across the nation. Industrial pretreatment programs, improved manufacturing practices, and consumer awareness have all contributed to this success. In the past few years, use of biosolids has been increasingly market driven. Biosolids treatment facilities are allowing consumer interest to drive decisions about treatment processes and final uses of biosolids. As a result, “exceptional-quality” biosolids are meeting the more stringent requirements to protect public health from potential pollutants and pathogens. Exceptional quality biosolids may be sold or applied to the land without further site or management restrictions. Generating exceptional quality products often involves significant upgrades or changes in treatment technologies, and is not essential to successful biosolids management programs. Therefore, the shift to exceptional quality biosolids has been slow.
Enforcement Trends Solid Waste Ecology continues to work with local government to make sure solid waste handling facilities comply with solid waste laws and rules. We adopted new rules in 2003 to clarify our expectations for how to properly handle a variety of waste streams. We are also increasing our focus on prevention through education. We hope this will reduce the need for enforcement. Analyzing trends for Ecology solid waste enforcement actions does not give a complete picture, since primary authority for most solid waste enforcement rests with local government. We can relate a subjective analysis: while there will always be a small number of “bad actors” in the solid waste arena, the majority of operators try to do the right thing, and the rules are fairly straightforward and easy to follow. Biosolids Between 1996 and 2003, Ecology took very few enforcement actions as the new program was being developed and implemented. During this time, Ecology worked diligently with the regulated community on training and other technical assistance measures to develop an understanding of the new program. Between 2004 and 2006, Ecology increased its enforcement activities substantially. This included issuing a Notice of Correction to facilities that continually failed to report their biosolids management activities and those who failed to submit the necessary permitting documents. We also issued a large penalty to a facility for extensive and extreme violations. From 2007 to 2009, we issued significantly fewer enforcement actions compared to the prior three years. We believe this is because our earlier efforts resulted in most permittees achieving compliance with the management and administrative requirements of the biosolids program. During this period, the vast majority of the penalty amount was either committed to correcting the problem, committed to an environmental project, or suspended. Electronic Product Recycling The "producer responsibility" basis of the Electronic Products Recycling law is a recent and significant change in the field of environmental law. As with any major change, a period of adjustment was needed.

Department of Ecology 2008-09 Enforcement Report – December 2010 65
Manufacturers are not accustomed to being held responsible for the proper management of their products after use by consumers. In addition, most of the manufacturers are located out-of-state or overseas and some do not directly sell their products in or into Washington or only sell their products over the internet. Due to this unique set of circumstances, Ecology has been putting a great deal of effort into education, relationship-building and, when necessary, enforcement starting in 2007. Thanks in part to similar laws in a few other states, and a lot of one-on-one work by Ecology staff, the relationship-building approach was very successful. From the beginning, enforcement actions in the E-Cycle Washington program were only taken after repeated attempts to achieve compliance with the requirements of the law were ignored. In 2007, 22 Notices of Violation were issued along with two penalties. In 2008, only nine Notices of Violation were issued. In 2009, seven Notices of Violation were issued, and one penalty. This overall decrease in enforcement actions is due in large part to the outreach and relationship-building efforts of Waste 2 Resources Program staff. For more information about solid waste and biosolids management, visit Ecology’s website: www.ecy.wa.gov/programs/swfa/index.html

Department of Ecology 2008-09 Enforcement Report – December 2010 66
Table 11: Waste 2 Resources Program Enforcement Actions and Penalty Amounts
YEAR Notices Orders Penalties Total Enforcement Actions Total Amount of Initial Penalty Assessment
1996 1 1 0 2 $0
1997 0 0 0 0 $0
1998 0 4 2 6 $32,000
1999 0 0 0 0 $0
2000 1 2 1 4 $2,000
2001 0 2 1 3 $3,000
2002 0 5 3 8 $32,000
2003 0 3 2 5 $7,000
2004 16 2 0 18 0
2005 66 1 3 70 $277,740
2006 53 4 3 60 $10,000
2007 22 6 5 33 $371,826
2008 18 0 2 20 $145,000
2009 7 4 2 13 $14,500
In 2009, seven Notices of Violation were issued, and one penalty (eight enforcement actions in the E-Cycle Washington program). The penalty amount was $10,000 but through a settlement agreement reached in 2010, the penalty has been waived provided certain requirements are met. This makes up most of the penalty total for 2009.

Department of Ecology 2008-09 Enforcement Report – December 2010 67
Figure 33: Waste 2 Resources Program Notices, Orders & Penalties 1996-2009
Figure 34: Waste 2 Resources Program Initial Assessed Penalty Trends 1996-2009
Note: The penalty issued dates prior to 2004 are derived from the dates Ecology inspectors requested an enforcement/docket tracking number for the enforcement action not the date the action was taken.
0
10
20
30
40
50
Waste 2 Resources ProgramNotices, Orders & Penalties 1996-2009
Penalties Orders Notices 72 60
No Actions No Actions
$0
$50,000
$100,000
$150,000
$200,000
$250,000
$300,000
0
10
20
30
40
50
Waste 2 Resources ProgramInitial Assessed Penalty Trends 1996-2009
Penalties Total Amount of Initial Penalty Assessment
No Actions No Actions No Actions
$371,826
Department of Ecology 2008-09 Enforcement Report – December 2010 68
Water Quality
Overview The mission of the Water Quality Program is to protect and restore Washington’s waters. Ecology protects Washington’s waters by regulating point source (direct) discharges of pollutants to surface and underground waters (groundwater). We accomplish this through a wastewater discharge permit program for sewage treatment plants and other industries that have on-site wastewater treatment. We also have a permit program in place to control the pollution in stormwater runoff from municipal, industrial, and construction sites. Ecology also protects water quality by educating and working with communities on controlling nonpoint source pollution. Nonpoint source pollution is caused by the everyday actions of citizens and businesses across the state. Sources include:
• Pesticides and fertilizers running off. • Irrigated agricultural land. • Rural lands. • Homeowners’ lawns. • Oil and grease running off parking lots and roads. • Failing septic tanks.
Ecology’s goals for protecting water quality are to prevent water pollution, clean up water pollution, and support sustainable choices to reduce water pollution. To meets its mission and goals, Ecology’s Water Quality Program is working on these objectives:
• Prevent point source water pollution. • Control stormwater pollution. • Reduce nonpoint source water pollution. • Provide water quality financial assistance. • Clean up polluted waters.
Water Quality Permits Ecology has authority to investigate and manage water quality through the Federal Clean Water Act and the state Water Pollution Control Act. We issue permits to more than 4,000 industrial and municipal facilities in Washington State to make sure they manage pollution so it can be safely discharged to lakes, rivers, marine, or groundwaters. Ecology inspects about 25 percent of the permitted facilities each year.

Department of Ecology 2008-09 Enforcement Report – December 2010 69
Table 12: Water Quality Permits as of December 31, 2008*
.
* 2009 data not available at the time of report printing
PERMIT TYPE
2007 2008
NPDES Stormwater Construction General Permit 2,909 3,131
NPDES Industrial Stormwater General Permit 1,202 1,276
Sand and Gravel General Permit 913 963
NPDES Minor 357 356
Fresh Fruit Packer General Permit 184 182
State to Groundwater 172 146
State to POTW (publicly-owned treatment works) 173 168
Aquatic Pesticides General Permit 137 139
Boatyard General Permit 91 83
NPDES Major 77 78
Fish Hatchery General Permit 79 81
Dairy General Permit 322 25
Water Treatment Plant General Permit 313 33
Municipal Stormwater General Permit 144 152

Department of Ecology 2008-09 Enforcement Report – December 2010 70
Figure 35: Water Quality-Number of Permits Per Enforcement Staff Member by Fiscal Year*
*Fiscal years start July 1st and end June 30th of following year.
Compliance Assurance Individual Wastewater Discharge Permits Ecology expects voluntary compliance with water pollution protection laws. When we detect a violation, we gather the initial information through inspections, documented telephone calls, or letters. The violation may result in a warning letter, technical assistance, or both. Ecology requires permitted facilities to monitor their discharges and report them to us by submitting a Discharge Monitoring Report (DMR). We require them to identify violations in their report and they must explain the cause of the violation and the action taken to stop and prevent further violation. When Ecology cannot get a facility to voluntarily comply through informal enforcement actions, we use a progressive method of enforcement. Generally, each response increases in severity until the facility resolves the problem. If the facility continues non-compliance, Ecology may issue a formal enforcement action in the form of a notice, order, or penalty. Ecology provides technical assistance on proper design of wastewater treatment facilities and the development of corrective action strategies to prevent water quality violations. Compliance at wastewater treatment facilities is enhanced by training treatment plant operators in key positions. State law requires municipal wastewater treatment operators to take training and pass written tests to become certified to run facilities. Operators must also meet continuing education requirements to maintain their certification. In addition to the Operator Certification Program, Ecology has a well established Environmental Laboratory Accreditation Program. These two efforts contribute significantly to the state’s environmental compliance efforts by ensuring operators are qualified to run facilities and collect water quality samples, and that the analyses performed by laboratories are accurate and defensible. Ecology’s Water Quality Program, along with the Federal Environmental Protection Agency, provide direct assistance to smaller municipal wastewater treatment plants through the use of two roving outreach specialists. These specialists travel from plant-to-plant to respond to facility requests for technical
661581 586 621
733 748
1016
1145
0
200
400
600
800
1000
1200
1400
94 & 95 96 & 97 98 & 99 00 & 01 02 & 03 04 & 05 06 & 07 08 & 09
Num
ber o
f Per
mits
Fiscal Year

Department of Ecology 2008-09 Enforcement Report – December 2010 71
assistance. There is one outreach specialist for facilities located on the west side of the Cascade Mountains, and one for facilities on the east side of the mountains. General Permits General Permits cover groups of similar types of facilities, or similar discharges, under one set of permit requirements (Table 12). General permits usually have a small size or other location cutoff below which facilities don’t require permit coverage and are managed as nonpoint sources. An individual permit may be required if the general permit is not adequate for local conditions, or when a facility is not meeting the requirements of their general permit. Similarly, a facility otherwise excluded from the general permit may be required to obtain general permit coverage as a “significant contributor of pollutants.” Permit requirements vary, but generally require plans containing Best Management Practices with some monitoring. The less experienced and more variable nature of general permittees necessitates compliance efforts that emphasize inspections and technical assistance. Formal enforcement actions such as orders and penalties can be used if more informal methods don’t result in compliance. Starting this year, Water Quality Program field inspectors started using field tickets for warnings and penalties for water quality violations at sites covered by the state's Industrial Stormwater, Construction Stormwater, and Sand and Gravel General Permits. Field penalty tickets range from $500 to $3,000. Inspectors write tickets only after they have issued a written warning or noted the problem in a previous inspection report. This gives site operators time to make the fix. Field tickets provide near-immediate consequences for water quality violations, serve as a deterrent, save state resources, and speed the enforcement process. They help Ecology efficiently enforce existing regulations to protect and restore water quality. So far, the Water Quality Program has issued over 100 field warning tickets, and approximately 25 field penalty tickets. Inspectors have found that the field warning ticket is very effective at getting violations quickly corrected without having to issue a penalty. Nonpoint Pollution Most pollution in Washington's waters comes from many different, hard-to-trace sources with no obvious point of discharge. This is known as polluted runoff or nonpoint pollution. It includes pollution from stormwater (outside of the general permits), agriculture, forestry, recreation, habitat alteration and urban land uses. Compliance efforts range from funding through local governments and technical assistance, to referrals to other agencies, and even formal enforcement actions such as orders and penalties.
Environmental Trends Ecology does not have enough resources to monitor every water body in the state. However, for the past nine years, we have been systematically collecting water quality data at 62 long-term sampling stations around the state. These stations typically correspond to the larger streams in many of the 62 Water Resource Inventory Areas, or watershed planning areas in the state. Figure 36 indicates overall statewide trends over the last 16 years. The “Water Quality Index” summarizes results for temperature, pH, fecal coliform bacteria, dissolved oxygen, total suspended sediment, turbidity, total phosphorus, and total nitrogen at representative long-term stations. Higher scores indicate better quality.

Department of Ecology 2008-09 Enforcement Report – December 2010 72
Figure 36: Water Quality Index-Quarterly
Note: Scores are based on data from the preceding three months. These data have not been adjusted to account for the effects of flow on water quality. Scores based on data collected since October 2009 are provisional.
The quarterly Water Quality Index shows a general improving trend in overall water quality. Index scores tend to be lowest in October, which is based on July through September data. Temperature is highest during those months, and temperature is one of the biggest contributors to low index scores. Ecology also collects a large amount of water quality data generated by many other studies and projects. We use this data to prepare a list of water bodies that do not meet the state’s water quality standards, known as the 303(d) list. We also use the list to target the development and implementation of total maximum daily load (TMDL) plans called water cleanup plans. The four main pollutants that cause a water body to be listed as polluted are:
• Temperature • Fecal coliform • Oxygen • pH
Since 1996, the number of water bodies listed for fecal coliform, oxygen, and pH has declined while those listed for temperature have increased. Changes in the number of listings may be due to data availability and not necessarily from environmental trends. High temperatures can be caused by loss of vegetation along streams and low water flows in rivers and streams. The fecal coliform trend in both 303(d) listings and in Figure 36 is not surprising. Since state lawmakers adopted the Dairy Nutrient Management Act5 in 1998, Ecology and many people across the state have worked hard to reduce the amount of fecal coliform bacteria that enters state waters.
5 The Legislature gave responsibility for dairy farm inspections to the Department of Agriculture in 2003.
50
55
60
65
70
75
80
85
90
Wat
er Q
ualit
y In
dex
Scor
eWater Quality Index - Quarterly
Department of Ecology 2008-09 Enforcement Report – December 2010 73
For more Water Quality Monitoring information, see Publication 02-03-052, A Water Quality Index for Ecology's Stream Monitoring Program at www.ecy.wa.gov/biblio/0203052.html.
Enforcement Trends Ecology issues permits to more than 4,000 industrial and municipal facilities in Washington to protect water quality. In 2007,(2008 and 2009 data not available at this time), the Water Quality Program took more than 1,523 compliance or enforcement actions (not including inspections) on facilities with permits (2008 data not available at time of report printing). To evaluate the effectiveness of our enforcement activity, we evaluate the compliance rates and number of facilities with five or more violations per year. In 2007, wastewater monitoring reports and Ecology inspections showed that Washington had a compliance rate of approximately 98 percent for water quality protection. The type of enforcement action and the amount of penalty depends on the type of violation and the potential impact to public health and the environment. There is no clear trend for enforcement actions or penalties. One very serious case with a large penalty can greatly affect the numbers for any given year. For more information on water quality policy, visit Ecology’s website: www.ecy.wa.gov/programs/wq/wqhome.html For information on the condition of Washington’s waters, visit Ecology’s website: www.ecy.wa.gov/programs/eap/env-info.html
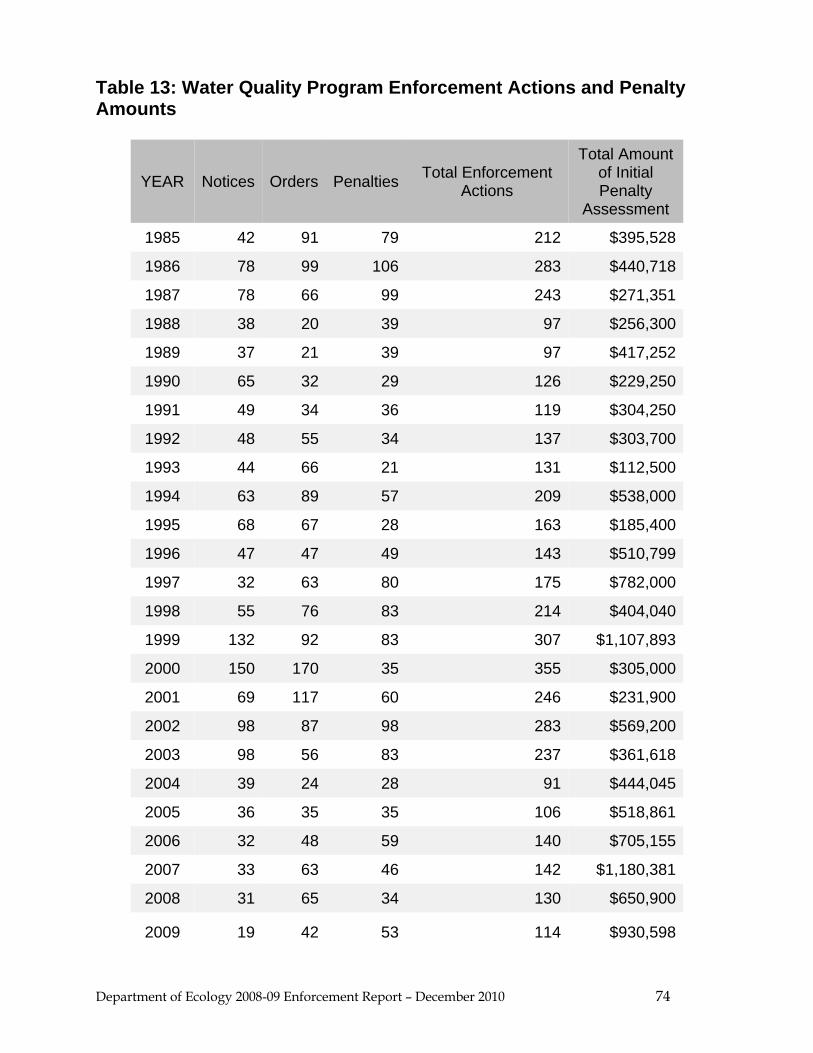
Department of Ecology 2008-09 Enforcement Report – December 2010 74
Table 13: Water Quality Program Enforcement Actions and Penalty Amounts
YEAR Notices Orders Penalties Total Enforcement Actions
Total Amount of Initial Penalty
Assessment
1985 42 91 79 212 $395,528
1986 78 99 106 283 $440,718
1987 78 66 99 243 $271,351
1988 38 20 39 97 $256,300
1989 37 21 39 97 $417,252
1990 65 32 29 126 $229,250
1991 49 34 36 119 $304,250
1992 48 55 34 137 $303,700
1993 44 66 21 131 $112,500
1994 63 89 57 209 $538,000
1995 68 67 28 163 $185,400
1996 47 47 49 143 $510,799
1997 32 63 80 175 $782,000
1998 55 76 83 214 $404,040
1999 132 92 83 307 $1,107,893
2000 150 170 35 355 $305,000
2001 69 117 60 246 $231,900
2002 98 87 98 283 $569,200
2003 98 56 83 237 $361,618
2004 39 24 28 91 $444,045
2005 36 35 35 106 $518,861
2006 32 48 59 140 $705,155
2007 33 63 46 142 $1,180,381
2008 31 65 34 130 $650,900
2009 19 42 53 114 $930,598

Department of Ecology 2008-09 Enforcement Report – December 2010 75
Figure 37: Water Quality Program Notices, Orders & Penalties 1985-2009
Figure 38: Water Quality Program Initial Assessed Penalty Trends 1985-2009
Note: The penalty issued dates prior to 2004 came from the dates Ecology inspectors requested an enforcement/docket tracking number for the enforcement action, not the date the action was taken.
0
50
100
150
200
250
300
350
400
Water Quality Program Notices, Orders & Penalties 1985-2009
Notices Orders Penalties
$0
$200,000
$400,000
$600,000
$800,000
$1,000,000
$1,200,000
0
50
100
150
200
250
300
350
400
Water Quality Program Initial Assessed Penalty Trends 1985-2009
Penalties Total Amount of Initial Penalty Assessment

Department of Ecology 2008-09 Enforcement Report – December 2010 76
Water Resources
Overview The mission of the Water Resources Program is to meet current water needs and ensure future water availability for people, fish and the natural environment. Washington is facing the challenge of how to meet the growing demands for water that are fueled by population and economic growth, while maintaining the natural environment. The threat of extinction to once abundant fish stocks due to poor water quality and inadequate stream flow are significant factors in the debate about water resources. Water use and water resources management are regulated by a complex web of state law and case law (court interpretations), including English Common Law adopted while Washington was still a territory. To accomplish its mission and to manage the ever-increasing demand for water, the Water Resources Program is working on these objectives:
• Promote compliance with water law. • Manage water rights through sound and timely decision-making. • Prepare for and respond to drought and climate change. • Assess, set, and achieve instream flows. • Support water use efficiency. • Regulate well construction. • Ensure dam safety. • Support local watershed management of water resources. • Provide water resources data and information. • Adjudicate water rights and water right claims. • Regulate instream flows to protect existing water rights.
Water Resources Program Compliance Activities The Water Resources Program allocates water by reviewing and processing applications for new water rights and changes to existing water rights and claims. A water right is legal permission to withdraw or divert a certain amount of water from a specific source for use in a specific place for one or more specific purposes. The program works to make sure all water users comply with the state’s water laws so that:
• Other legal water users are not impaired. • Water use remains sustainable over the long term. • The environment is protected.
Ecology licenses and regulates well drillers. We investigate complaints to make sure all well drilling activities comply with the state minimum construction standards for wells. The well driller and property owner are responsible for meeting the standards and for protecting groundwater from contamination or impairment. Ecology also regulates dams that capture and store at least 10 acre-feet or more of water or watery materials such as mine tailings, sewage, and manure waste. Through plan reviews and construction inspections, we make sure these facilities are properly designed and constructed. To reasonably secure the safety of human life and property, we also conduct inspections of existing dams to assure proper operation and maintenance.

Department of Ecology 2008-09 Enforcement Report – December 2010 77
Compliance Assurance Ecology’s goal is to achieve voluntary compliance with state water laws. We do this through education, outreach, technical assistance, training, and licensing activities. These efforts are geared toward the public, water users in specific areas, and individuals. Enforcement actions are important tools that we use in a limited number of special cases when:
• Voluntary or informal compliance efforts are not successful. • Water rights are impaired. • Risks to safety, health, and the environment are high. • We have sufficient resources to use formal enforcement actions.
Compliance Priorities Current compliance priorities are to:
• Ensure that a minimum of 80% of water rights in the 16 fish-critical basins, where fish stocks are depressed, meter and report their water use to Ecology.
• Ensure that 100% of all water rights within a 1 mile-wide corridor along the Columbia River meter and report their water use to Ecology.
• Fully implement an online reporting system for metering data. • Respond to public complaints of water code violations. Provide information and technical
assistance to those out of compliance with state water laws. Where necessary, follow up with formal enforcement actions. Monitor and protect purchased trust water rights.
• Regulate water use during periods of low flows to protect senior water users and streams that have stream flow limits.
• Continue formal and informal actions to gain compliance with court rulings in the Yakima adjudication.
• Continue implementation of the federal court-approved Lummi Peninsula Settlement Agreement. • Communicate our enforcement actions for water right violations to discourage future violations. • Provide compliance expertise for special projects, including Walla Walla exempt well
requirements and WRIA 1 instream flow negotiations. Formal enforcement actions and responses are generally used when voluntary compliance is not achieved. Below is an example of the progression from voluntary compliance to formal enforcement for a water rights case:
• Contact the person who complained and/or the alleged violator. After we make contact, we may further investigate the complaint, depending on the information received.
• Pursue voluntary compliance through outreach via telephone, site visit, written communications, and/or meetings.
• Provide information to the violator about the potential need for them to apply for a new water right or water right change.
• Refer the violator to their local government for land use issues, Department of Fish and Wildlife for habitat issues, and other Department of Ecology programs, as appropriate.
• Follow up through a letter to bring formal closure or to document with a timeline what efforts will be made to gain compliance.
• Schedule a follow up site visit to verify water is no longer being used illegally. If the business or individual continues to use water illegally and refuses to voluntarily comply, we may take the following formal enforcement actions:
• Send a series of escalating letters that explains the formal enforcement process and the actions we will take if they do not comply within a certain timeframe.

Department of Ecology 2008-09 Enforcement Report – December 2010 78
• Issue an Order, possibly with a Notice of Penalty. • Continue with follow-up site visit(s). This includes:
• Interviewing neighbors • Collecting complaint and witness statements • Taking pictures of the property and the water source being used • Documenting continued illegal use • Issue additional Notices of Penalty, as appropriate.
Environmental Trends Washington has been viewed as a water-rich state and residents have historically enjoyed an abundance of clean inexpensive water. This is changing as unprecedented population and economic growth has fueled the growing demand for water. A number of other factors also contribute to this change:
• In many areas, there is not enough water to allocate for future uses without impairing senior water rights, reducing stream flows, and/or depleting aquifers.
• The threat of extinction of once-abundant fish stocks due to over-appropriation of surface water and groundwater connected with surface water resources.
• Competition and lawsuits over water. • Repeated drought conditions that result in dry streams, withered crops, dead fish, reduced
hydropower production, and increased wildfires. • Growing interest and investment in water use efficiency technology, reclaimed water, rainwater
catchments, and methods that take salt or chemicals out of water. An emerging concern is the effect of global warming and climate change trends on water availability. A reduction in future water supplies may occur due to reduced volume of stored water in the mountain snow-pack, changes in the timing of snow-pack melt, and the amount and location of precipitation.
Statewide Source Water Metering Program The Water Resources Program is working to meter and report water use in 16 basins with depressed fish stocks, and over 50% of our compliance staff are dedicated to the metering effort. Ecology has:
• Sent orders to over 1,000 water users in these basins to meter and report their water use, as required under a court settlement agreement. This represents an estimated 80% of the water volume certificated in those basins.
• Required new water users and those who have applied for changes in these basins to install meters and report their water use.
• Provided funds to help users install meters. • The Water Resources Program acquired funding to develop a data management system for
metering data, and database work has largely been completed. • The metering program has expanded to include the Columbia River water rights and an electronic
filing process has been set up for larger water users. In addition to the court-ordered metering and reporting requirements, new permits or changes to existing permits contain metering requirements. We are following-up with water users to make sure they are complying with the metering and reporting requirements.

Department of Ecology 2008-09 Enforcement Report – December 2010 79
Enforcement Trends In 2008, compliance work associated with the metering effort represented the single largest investment of compliance staff time. In addition, we placed more emphasis on permit maintenance, including permit cancellations and relinquishments. In 2009, the jump in the number of enforcement orders and penalties (Figure 39) was due to an increased emphasis on well-drilling violations, including proper licensing and well sealing; use of water without a permit or water right; and Dam Safety violations. Included were a number of penalties issued for State Water Users failure to comply with aspects of the federal court approved Lummi Peninsula Groundwater Settlement Agreement. For more information about the Water Resources Program, visit the Water Resources Program website: www.ecy.wa.gov/programs/wr/wrhome.html
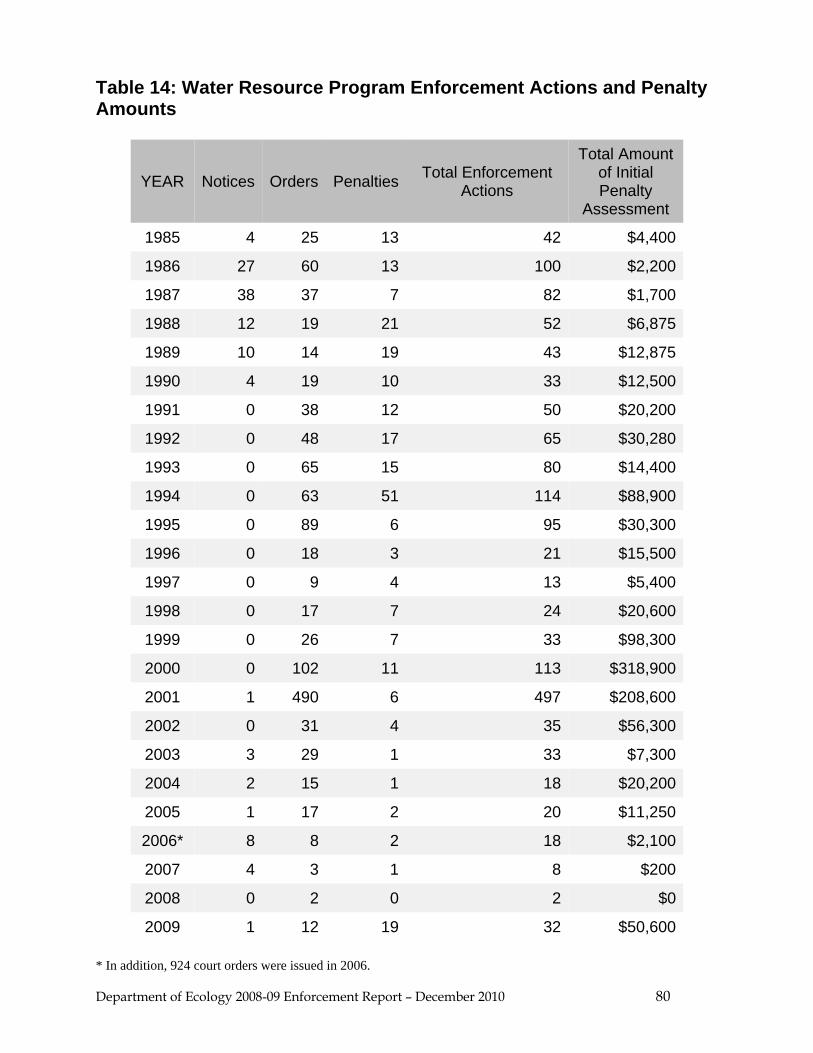
Department of Ecology 2008-09 Enforcement Report – December 2010 80
Table 14: Water Resource Program Enforcement Actions and Penalty Amounts
YEAR Notices Orders Penalties Total Enforcement Actions
Total Amount of Initial Penalty
Assessment
1985 4 25 13 42 $4,400
1986 27 60 13 100 $2,200
1987 38 37 7 82 $1,700
1988 12 19 21 52 $6,875
1989 10 14 19 43 $12,875
1990 4 19 10 33 $12,500
1991 0 38 12 50 $20,200
1992 0 48 17 65 $30,280
1993 0 65 15 80 $14,400
1994 0 63 51 114 $88,900
1995 0 89 6 95 $30,300
1996 0 18 3 21 $15,500
1997 0 9 4 13 $5,400
1998 0 17 7 24 $20,600
1999 0 26 7 33 $98,300
2000 0 102 11 113 $318,900
2001 1 490 6 497 $208,600
2002 0 31 4 35 $56,300
2003 3 29 1 33 $7,300
2004 2 15 1 18 $20,200
2005 1 17 2 20 $11,250
2006* 8 8 2 18 $2,100
2007 4 3 1 8 $200
2008 0 2 0 2 $0
2009 1 12 19 32 $50,600 * In addition, 924 court orders were issued in 2006.

Department of Ecology 2008-09 Enforcement Report – December 2010 81
Figure 39: Water Resources Program Notices, Orders & Penalties 1985-2009
Figure 40: Water Resources Program Initial Assessed Penalty Trends 1985-2009
Note: The penalty issued dates prior to 2004 are derived from the dates Ecology inspectors requested an enforcement/docket tracking number for the enforcement action, not the date the action was taken.
0
20
40
60
80
100
120
Water Resources ProgramNotices, Orders & Penalties 1985-2009
Notices Penalties Orders 490
$0
$50,000
$100,000
$150,000
$200,000
$250,000
$300,000
$350,000
$400,000
0
20
40
60
80
100
120
Water Resources ProgramInitial Assessed Penalty Trends 1985-2009
Penalties Total Amount of Initial Penalty Assessment

82
Additional Ecology Enforcement Information
Enforcement information is available on the web at: http://www.ecy.wa.gov/enforce.html
Contributions and Acknowledgments Thank You to the following Ecology Employees for the assistance in the preparation of this report:
Editing, reviewing, and content contributors
Ecology’s Enforcement Coordination Team: Mike Blum, Kerry Carroll, Emily Celto, Kathy Conaway, Stuart Clark, Jeff Fishel, Don Davidson, Mark Dirkx, Sean Hopkins, Miles Kuntz, Marc Pacifico, James Pearson, Kary Peterson, Steve Szendre, Eric Van Mason
Ecology Employees or Other Contributors:
Larry Altose, Carey Cholski, Laurie Dumar, Dawne Gardiska, Jani Gilbert, Mike Hepp, David Hallock, Sandra Hughes, Valerie Pearson, Dan Saul, Kim Schmanke, Daniel Thompson, Joye Redfield-Wilder, David Workman
Editing and quality assurance Dee Peace Ragsdale, Performance and Recognition Data collection, writing, quality assurance and graphs
Maylee Collier, Financial Services, Docket Management System Administrator
For Information About This Report Dee Peace Ragsdale, 360-407-6986 or [email protected]