Embed Size (px)
Citation preview
CONSULTING ENGINEERS Grafton Bond Store 60 Hickson Road Sydney NSW 2000 PO Box H171 Australia Square NSW 1215 Telephone (02) 9241 4188 Facsimile (02) 9241 4324 Email [email protected]
WAGGA WAGGA PLANNING STUDY
ESTELLA WEST AREA ENVIRONMENTAL STUDY -
STORMWATER
JOB NUMBER: 07519 REVISION: 3 DATE: September 2008
Prepared For:
Wagga Wagga Ci ty Counci l
Prepared by:
S. Fryer
Northrop Engineers
Reviewed by:
M. Richards
Northrop Engineers

Wagga Wagga Planning Studies – Estella West 1
TABLE OF CONTENTS
1.0 Estella West Study Area 2 2.0 Hydrology 2 3.0 Stormwater Drainage 5 4.0 Flooding of the Estella West Study Area 5 5.0 Existing Site Runoff Quality 5 6.0 Built Environment 6 7.0 Costing 13 8.0 Stormwater Management Recommendations 13 Appendix A - Stormwater Planning Matrix 16 Appendix B – Stormwater Quantity Management 22 Appendix C – Stormwater Quality Management 26 Appendix D – Water Sensitive Urban Design (WSUD) 29

Wagga Wagga Planning Studies – Estella West 2
1.0 Estella West Study Area
The Estella West Study Area is located north-west of the Wagga Wagga town centre (adjacent to the Old Narrandera Rd and Pine Rd). It occupies an area of 277 ha.
The subject Study Area ranges in elevation from RL 240m AHD to RL 180m AHD. The site generally falls to the south and south-west.
The majority of the land is currently utilised for rural purposes such as grazing. Existing vegetation is predominantly cleared land with low grass cover and pockets of natural vegetation. Small pockets of rocky outcrops are located on the site.
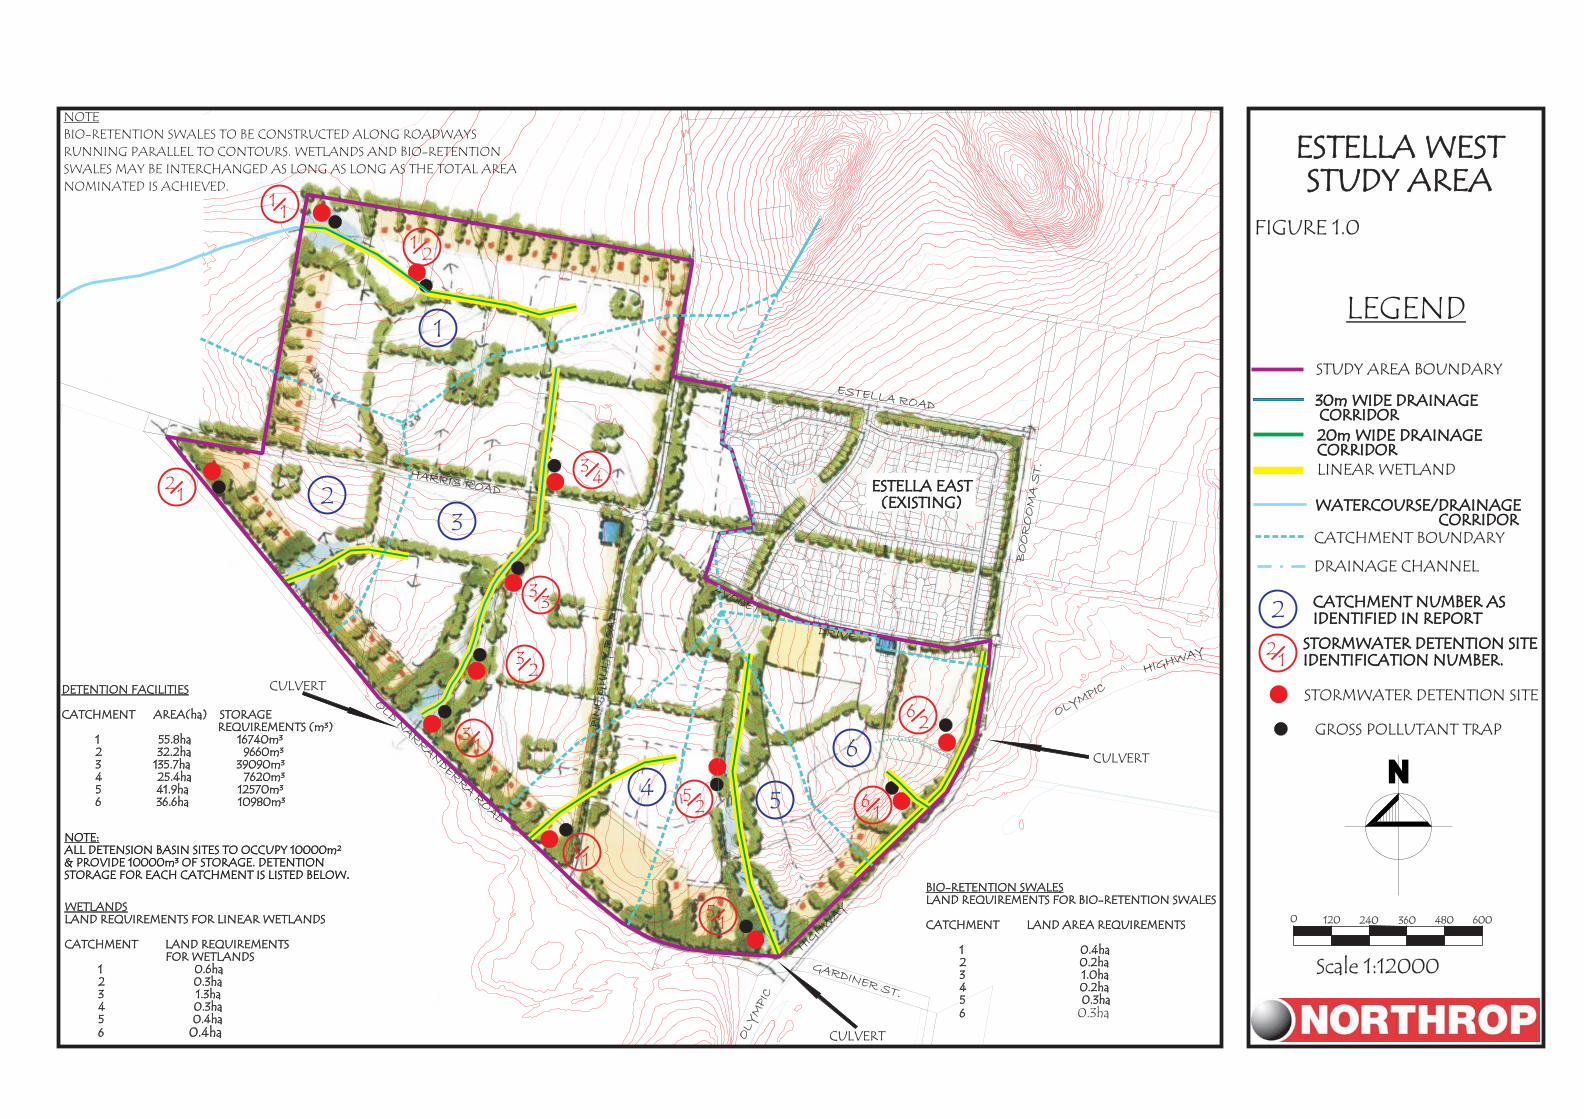
One (1) watercourse flowing north to south traverses the site, parallel to Pine Gully Road. The watercourse is located approximately midway between Pine Gully Rd and the western site boundary. Figure 1.0 shows the extent of the site and key features.
Photo 1.0 View South from Harris Rd Photo 1.1: View North from Harris Rd
2.0 Hydrology
The study area consists of six (6) separate catchments. These are shown on Figure 1.0.
o Catchment 1 incorporates portions of the site, and areas extending outside the site boundary. Approximately 40% is located within the Estella West Study Area. A further 20% is located upstream, and the remaining 40% downstream of the Study Area.
o Catchment 2 is located in the south-west portion of the site. There is no defined depression or watercourse within this catchment, but stormwater runoff would become concentrated upon reaching Old Narrandera Road.
o Catchment 3 is located wholly within the study area and drains to a watercourse. This watercourse discharges to the floodplain via a culvert under Old Narrandera Road.
o Catchment 4 is located wholly within the study area and generally drains south where it is intercepted by the drainage system associated with Old Narrandera Road.
o Catchment 5 is located wholly within the study area and generally flows to the south. Stormwater runoff is concentrated at a culvert crossing the Olympic Highway. The culvert discharges to Dukes Creek.
Wagga Wagga Planning Studies – Estella West 3
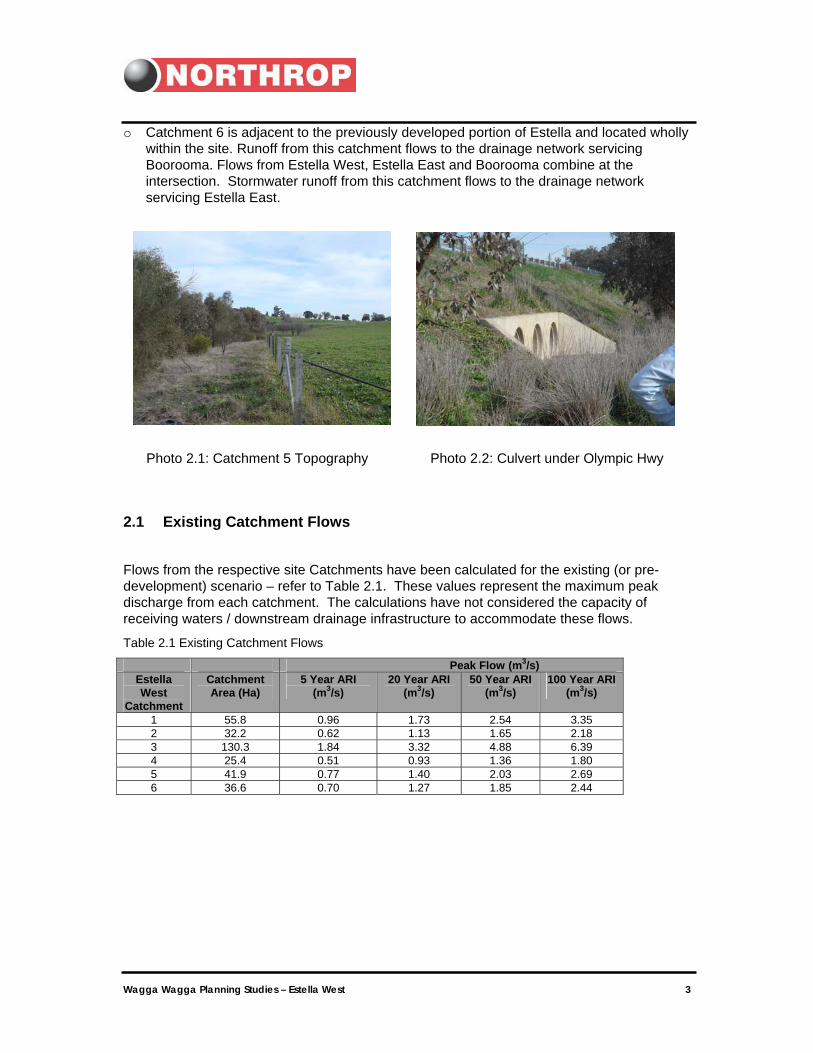
o Catchment 6 is adjacent to the previously developed portion of Estella and located wholly within the site. Runoff from this catchment flows to the drainage network servicing Boorooma. Flows from Estella West, Estella East and Boorooma combine at the intersection. Stormwater runoff from this catchment flows to the drainage network servicing Estella East.
Photo 2.1: Catchment 5 Topography Photo 2.2: Culvert under Olympic Hwy
2.1 Existing Catchment Flows
Flows from the respective site Catchments have been calculated for the existing (or pre-development) scenario – refer to Table 2.1. These values represent the maximum peak discharge from each catchment. The calculations have not considered the capacity of receiving waters / downstream drainage infrastructure to accommodate these flows.
Table 2.1 Existing Catchment Flows
Peak Flow (m3/s) Estella West
Catchment
Catchment Area (Ha)
5 Year ARI (m3/s)
20 Year ARI (m3/s)
50 Year ARI (m3/s)
100 Year ARI (m3/s)
1 55.8 0.96 1.73 2.54 3.35 2 32.2 0.62 1.13 1.65 2.18 3 130.3 1.84 3.32 4.88 6.39 4 25.4 0.51 0.93 1.36 1.80 5 41.9 0.77 1.40 2.03 2.69 6 36.6 0.70 1.27 1.85 2.44
ESTELLA WEST
STUDY AREA
ESTELLA WEST
STUDY AREA
FIGURE 1.0
ESTELLA EAST
(EXISTING)
ESTELLA EAST
(EXISTING)
0 120 240 360 480 600
Scale 1:12000
OLD
NA
RR
AN
DERR
AR
OA
D
OL
YM
PIC
GARDINER ST.
OLYMPIC
HIGHWAY
HIG
HW
AY
BO
OR
OO
MA
ST
.
AVOCET
ESTELLA ROAD
DRIVE
PIN
EG
UL
LY
RO
AD
HARRIS ROAD
LEGEND
STUDY AREA BOUNDARY
WATERCOURSE/DRAINAGECORRIDOR
WATERCOURSE/DRAINAGECORRIDOR
CATCHMENT BOUNDARY
DRAINAGE CHANNEL
N
NOTE:
ALL DETENSION BASIN SITES TO OCCUPY 10000m²
& PROVIDE 10000m³ OF STORAGE. DETENTION
STORAGE FOR EACH CATCHMENT IS LISTED BELOW.
NOTE:
ALL DETENSION BASIN SITES TO OCCUPY 10000m²
& PROVIDE 10000m³ OF STORAGE. DETENTION
STORAGE FOR EACH CATCHMENT IS LISTED BELOW.
DETENTION FACILITIES
CATCHMENT AREA(ha) STORAGE
REQUIREMENTS (m³)
1 55.8ha 16740m³
2 32.2ha 9660m³
3 135.7ha 39090m³
4 25.4ha 7620m³
5 41.9ha 12570m³
6 36.6ha 10980m³
DETENTION FACILITIES
CATCHMENT AREA(ha) STORAGE
REQUIREMENTS (m³)
1 55.8ha 16740m³
2 32.2ha 9660m³
3 135.7ha 39090m³
4 25.4ha 7620m³
5 41.9ha 12570m³
6 36.6ha 10980m³
WETLANDS
LAND REQUIREMENTS FOR LINEAR WETLANDS
CATCHMENT LAND REQUIREMENTS
FOR WETLANDS
1 0.6ha
2 0.3ha
3 1.3ha
4 0.3ha
5 0.4ha
6 0.4ha
WETLANDS
LAND REQUIREMENTS FOR LINEAR WETLANDS
CATCHMENT LAND REQUIREMENTS
FOR WETLANDS
1 0.6ha
2 0.3ha
3 1.3ha
4 0.3ha
5 0.4ha
6 0.4ha
BIO-RETENTION SWALES
LAND REQUIREMENTS FOR BIO-RETENTION SWALES
CATCHMENT LAND AREA REQUIREMENTS
1 0.4ha
2 0.2ha
3 1.0ha
4 0.2ha
5 0.3ha
6 0.3ha
BIO-RETENTION SWALES
LAND REQUIREMENTS FOR BIO-RETENTION SWALES
CATCHMENT LAND AREA REQUIREMENTS
1 0.4ha
2 0.2ha
3 1.0ha
4 0.2ha
5 0.3ha
6
2
21
6
54
1
3
2
CULVERT
CULVERT
CULVERT
CATCHMENT NUMBER AS
IDENTIFIED IN REPORT
CATCHMENT NUMBER AS
IDENTIFIED IN REPORT
STORMWATER DETENTION SITE
IDENTIFICATION NUMBER.
STORMWATER DETENTION SITE
IDENTIFICATION NUMBER.
21
11
12
30m WIDE DRAINAGECORRIDOR30m WIDE DRAINAGECORRIDOR
GROSS POLLUTANT TRAP31
32
33
41
51
52 6
1
62
34
20m WIDE DRAINAGECORRIDOR20m WIDE DRAINAGECORRIDOR
LINEAR WETLAND
STORMWATER DETENTION SITE
NOTE
BIO-RETENTION SWALES TO BE CONSTRUCTED ALONG ROADWAYS
RUNNING PARALLEL TO CONTOURS. WETLANDS AND BIO-RETENTION
SWALES MAY BE INTERCHANGED AS LONG AS LONG AS THE TOTAL AREA
NOMINATED IS ACHIEVED.

Wagga Wagga Planning Studies – Estella West 5
3.0 Stormwater Drainage
No formal drainage networks exist within the Study Area, apart from culverts under Old Narrandera Rd and Olympic Hwy. Table drains service the adjoining roads. These drains are graded to a convenient low point and discharged via overland flow.
All catchments draining Estella West flow to the floodplain for the Murrumbidgee River. Catchments 1, 2 and 3 rely on individual respective culvert systems under Old Narrandera Road to discharge to the floodplain. Similarly, Catchments 4 and 5 utilise a culvert system under the Olympic Highway to drain to the floodplain. Catchment 6 flows to the existing drainage network for Estella East.
4.0 Flooding of the Estella West Study Area
The Estella West Study Area is unaffected by flooding from the Murrumbidgee River. Localised flooding may occur along watercourses within the site. This would need to be investigated and managed during the site planning and development process.
As the Estella West area is reliant on culverts to discharge runoff to the floodplain, backwater effects (i.e. resultant flooding) will need to be considered. 5.0 Existing Site Runoff Quality
Existing site runoff quality has been considered based on the current usage of the Study Area. The following table identifies potential sources of contaminants for the site under pre-developed conditions. The risk of contamination to watercourses due to current usage is considered to be minor.
Table 5.1 Existing Potential Contaminant Sources
Contaminant Catchment Solids Nutrients Micro-
Organisms Dissolved Oxygen Demands
Metals Oils Synthetic Organics
All Catchments
Soil Erosion Cleared Land Animal Waste
Soil Erosion Cleared Land Animal Waste Fertilisers
Cleared Land Animal Waste
Soil Erosion Animal Waste
Soil Erosion Fertilisers Pesticides
Pesticides Pesticides
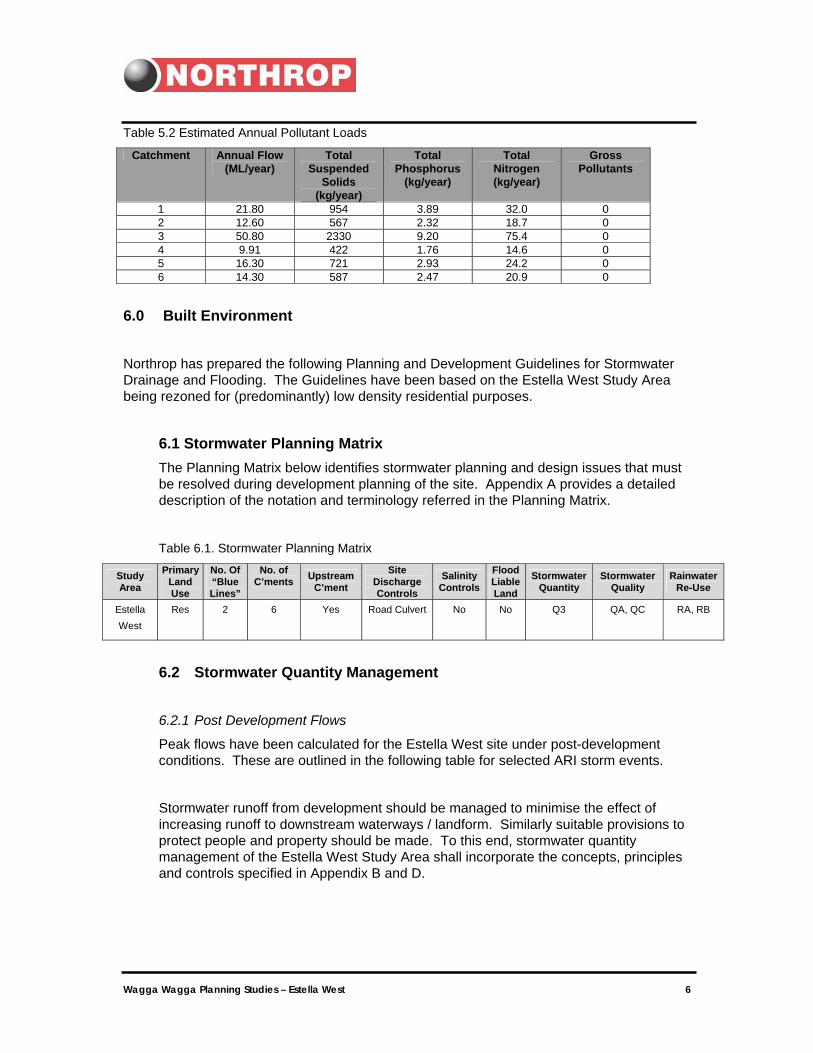
Northrop has undertaken preliminary analysis to estimate annual pollutant loads for the Estella West Study Area. “MUSIC” water quality modelling software was used. Results of the initial modelling are summarised below.
Wagga Wagga Planning Studies – Estella West 6
Table 5.2 Estimated Annual Pollutant Loads
Catchment Annual Flow (ML/year)
Total Suspended
Solids (kg/year)
Total Phosphorus
(kg/year)
Total Nitrogen (kg/year)
Gross Pollutants
1 21.80 954 3.89 32.0 0 2 12.60 567 2.32 18.7 0 3 50.80 2330 9.20 75.4 0 4 9.91 422 1.76 14.6 0 5 16.30 721 2.93 24.2 0 6 14.30 587 2.47 20.9 0
6.0 Built Environment
Northrop has prepared the following Planning and Development Guidelines for Stormwater Drainage and Flooding. The Guidelines have been based on the Estella West Study Area being rezoned for (predominantly) low density residential purposes.
6.1 Stormwater Planning Matrix The Planning Matrix below identifies stormwater planning and design issues that must be resolved during development planning of the site. Appendix A provides a detailed description of the notation and terminology referred in the Planning Matrix.
Table 6.1. Stormwater Planning Matrix
Study Area
Primary Land Use
No. Of “Blue Lines”
No. of C’ments
Upstream C’ment
Site Discharge Controls
Salinity Controls
Flood Liable Land
Stormwater Quantity
Stormwater Quality
Rainwater Re-Use
Estella West
Res 2 6 Yes Road Culvert No No Q3 QA, QC RA, RB
6.2 Stormwater Quantity Management
6.2.1 Post Development Flows
Peak flows have been calculated for the Estella West site under post-development conditions. These are outlined in the following table for selected ARI storm events.
Stormwater runoff from development should be managed to minimise the effect of increasing runoff to downstream waterways / landform. Similarly suitable provisions to protect people and property should be made. To this end, stormwater quantity management of the Estella West Study Area shall incorporate the concepts, principles and controls specified in Appendix B and D.

Wagga Wagga Planning Studies – Estella West 7
Table 6.2.1. Peak Post-development Flows
Peak Flow (m3/s) Boorooma Catchment
Catchment Area (Ha)
5 Year ARI 20 Year ARI 50 Year ARI 100 Year ARI
1 62 4.94 7.45 9.93 11.92 2 40 5.00 7.77 10.35 12.36 3 128 10.90 16.66 21.90 26.37 4 30 3.26 4.99 6.65 7.97 5 23 2.33 3.59 4.79 5.69 Note: Where catchments extend beyond the study area the peak flows has been calculated only for the portion of the
catchment that will be developed (i.e. falls within the study area).
Measures to be considered in developing an integrated stormwater management strategy (by adopting Water Sensitive Urban Design (WSUD) principles) is also presented in Section 6.6.
The stormwater quantity management facilities shall allow for flows from any upstream portion of the catchment that is external to the study area.
6.2.2 Managing Discharge to Downstream Infrastructure / Watercourses
Estimates for catchment-based on-site stormwater detention storage requirements are provided below. These are results of preliminary calculations and represent the detention volume required to limit site discharge to pre-development levels. The calculated volumes do not allow for any storage benefit achieved through provision of a rainwater re-use system.
Table 6.2.2: Detention storage requirements and approximate surface area
Catchment Total Detention Volume (m3) Approx. Surface Area (m2) (assuming 1000mm deep)
1 16740 55.8 2 9660 32.2 3 39090 130.3 (135.7) 4 7620 25.4 5 12570 41.9 6 10980 36.6
Note: The above volumes represent the total amount of storage required for a catchment. On-site stormwater detention may be provided as a single storage or as discrete storages strategically located throughout the catchment. Preliminary volumes will need to be reviewed against final development proposals and configuration of OSD facilities.
Site catchment discharge may need to be limited due to the existing downstream drainage network having inadequate capacity for current flows. In this regard the capacity of the existing culverts under the Olympic Highway will need to be assessed to confirm the allowable rate of flow from the site. If the capacity is found to be insufficient additional storage or amplification of the existing culverts may be required.
Possible locations for on-site stormwater quantity management facilities are indicated on Figure 1.0. This scheme is based on the strategy to service the development at a local (whole-of-site) catchment level. Typically, the storage areas are nominated toward the southern end of the site within green space zones adjacent to watercourses / riparian corridors.
Wagga Wagga Planning Studies – Estella West 8
6.3 Stormwater Quality Management
The concepts, principles and controls specified in Appendix C and D must be considered when implementing a water quality management strategy for the site. Measures to be considered in developing an integrated stormwater management strategy (by adopting Water Sensitive Urban Design (WSUD) principles) is also presented in Section 6.6.
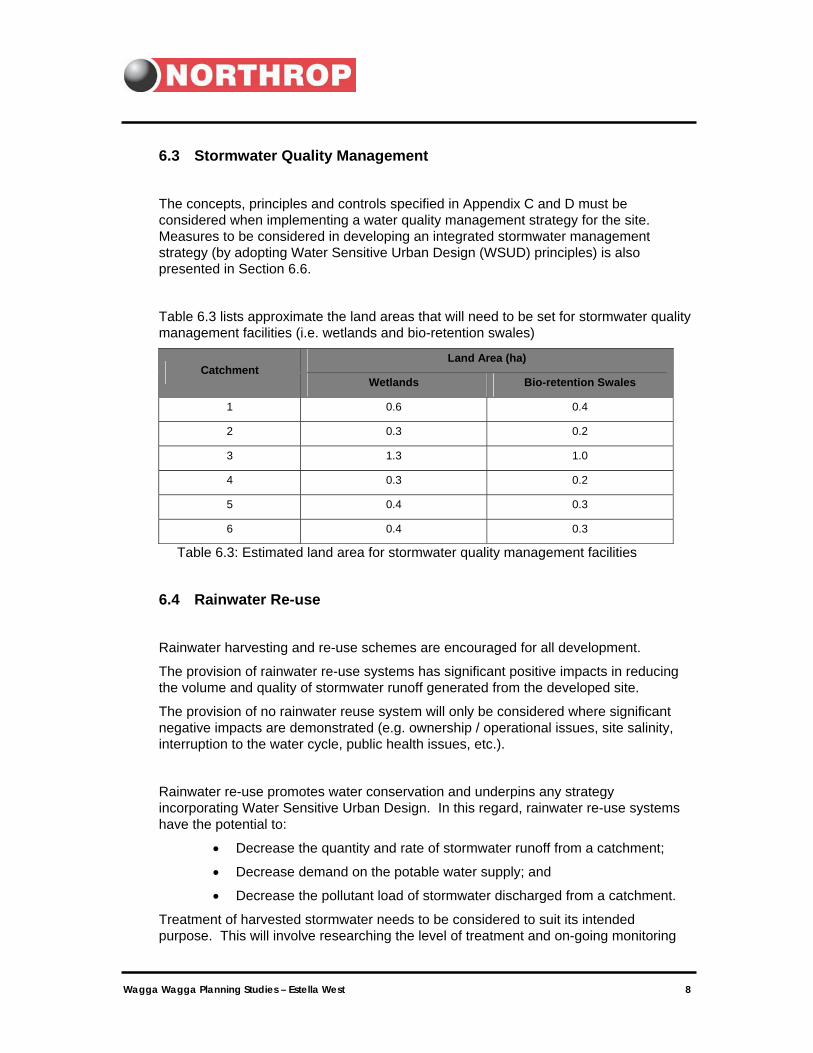
Table 6.3 lists approximate the land areas that will need to be set for stormwater quality management facilities (i.e. wetlands and bio-retention swales)
Catchment Land Area (ha)
Wetlands Bio-retention Swales
1 0.6 0.4
2 0.3 0.2
3 1.3 1.0
4 0.3 0.2
5 0.4 0.3
6 0.4 0.3
Table 6.3: Estimated land area for stormwater quality management facilities
6.4 Rainwater Re-use
Rainwater harvesting and re-use schemes are encouraged for all development.
The provision of rainwater re-use systems has significant positive impacts in reducing the volume and quality of stormwater runoff generated from the developed site.
The provision of no rainwater reuse system will only be considered where significant negative impacts are demonstrated (e.g. ownership / operational issues, site salinity, interruption to the water cycle, public health issues, etc.).
Rainwater re-use promotes water conservation and underpins any strategy incorporating Water Sensitive Urban Design. In this regard, rainwater re-use systems have the potential to:
• Decrease the quantity and rate of stormwater runoff from a catchment;
• Decrease demand on the potable water supply; and
• Decrease the pollutant load of stormwater discharged from a catchment.
Treatment of harvested stormwater needs to be considered to suit its intended purpose. This will involve researching the level of treatment and on-going monitoring

Wagga Wagga Planning Studies – Estella West 9
and maintenance necessary to minimise risks of contamination to end-users and operators of the subject facility.
6.5 Drainage Corridors
The “Blue Line” watercourses and natural depressions depicted in Figure 1.0 will form the routes of drainage corridors for each catchment. Table 6.5 provides the minimum widths required for the respective major drainage corridors to convey 100-year ARI flows.
Table 6.5 Drainage Corridor Width
Catchment Drainage Corridor Width (m) 1 30 (Depression) 2 20 (Depression) 3 30(Watercourse) 4 20 (Depression) 5 20 (Depression) 6 20 (Depression)
Where no “Blue Line” watercourse has been identified within a catchment, drainage corridors are still to be provided. Defined drainage corridors shall be provided at locations where stormwater runoff is concentrated. Figure 1.0 shows where drainage corridors need to be provided, in addition to potential zones for riparian protection. Development can not occur within these corridors.
Major drainage corridors can offer space for other functions, while forming the trunk drainage system for a catchment. This could be achieved by enabling a (narrower) defined flow route for (frequent) minor storm runoff (e.g. up to 5 year ARI); while providing for stormwater treatment, stormwater detention and conveyance of runoff from major storm events (i.e. up to 100 year ARI) in the upper bank / overflow extremities of the corridor. However, it should be noted the final width and extent of work allowed within the drainage corridor would be subject to the habitat protection objectives - prescribed by the NSW Department of Water.
Stormwater runoff from the Estella West Study Area will be discharged to land that is privately-owned and flood-prone (on the southern side of the Olympic Highway). Negotiation with the subject land holders is likely, in order to agree an acceptable drainage path through downstream sites.
6.6 Integrated Stormwater Management Strategy This section outlines an integrated stormwater management strategy for the Estella Study Area. The concepts described represent a guide for stormwater management for this particular site. Reference should also be made to the concepts and objectives presented in Appendices.

Wagga Wagga Planning Studies – Estella West 10
Stormwater Quantity Management
Figure 1.0 is a layout plan nominating potential locations for stormwater detention, wetlands, bio-retention swales and gross pollutant traps.
Detention basins – the preliminary sizes are based on a 1.0m maximum water depth and reducing developed site runoff to pre-development conditions. Development planning will require analysis of downstream drainage infrastructure to ascertain the capacity to accommodate. (ie existing culverts).
It is envisaged detention basins would be “off-line” - to fill during larger storm events (only). This optimises the use of the space by enabling recreational activities in times of little or no rainfall. It is important the surface and ground conditions of the basin are suitably designed to tolerate short periods of saturation.
The estimated sizes of basins (as shown on the layout plan) have not accounted for the potential offset available if rainwater re-use systems are adopted.
Drainage Corridors - Figure 6.6 provides a general concept for trunk drainage corridors and indicative arrangement for minor, major and environmental flow conveyance. The width of the corridor relates to the catchment (runoff rate) and habitat preservation (riparian corridor).
Minor (or frequent storms), up to and including the 1:20 ARI, are collected in a traditional pit and pipe network within the road reserves. The pit and pipe network conveys flows to a linear wetland within the drainage corridor. The linear wetland treats minor storm runoff before discharging environmental flows to the natural watercourse (refer also to Stormwater Quality Management).
For major storm events, run-off by-passes the wetland, and enters the watercourse. The road network will also be utilised to direct runoff from storm events greater than the 20 year ARI to the drainage corridor. Flows within the drainage corridor would be controlled by “off-line” detention basins prior to leaving the Study Area and discharging to drainage infrastructure (downstream).
The major / minor drainage concept seeks to (a) maintain convenience and amenity during minor storms, and (b) provide protection for life and property during major storms.
Stormwater Quality Management
Figure 1.0 nominates the approximate land area required for stormwater treatment to achieve the water quality targets listed in Appendix C. The “stormwater treatment train” for the Estella Study Area is envisaged to comprise a combination of bio-retention systems, linear wetlands and gross pollutant traps strategically located within catchments.
Bio-retention swales - are proposed primarily to address road runoff where practical. This will require careful coordination and integration with the streetscape. Smaller, more frequent, bio-retention treatment sites are considered more efficient in terms of performance and maintenance.

Wagga Wagga Planning Studies – Estella West 11
Figure 6.6 shows a typical street which incorporates bio-retention swales. In general, bio-retention systems are more efficient on roadways orientated parallel to site contours. Generally the systems are sized to treat stormwater flows from critical 3-month ARI storm.
Gross Pollutant Traps – Suspended solids, debris and litter in stormwater runoff requires screening prior to discharging to the downstream watercourse. Gross Pollutant Traps (GPT’s) are proposed for this function. GPT’s are to be strategically placed prior to stormwater disposal into the linear wetland schemes.
Linear wetlands – will be located to treat runoff from (a) developing areas connecting directly to the pit / pipe system, and (b) roadways that are not suitable for bio-retention systems. Bio-retention swales and linear wetlands will promote nutrient removal from stormwater runoff and trap oils and hydrocarbons within the substrate.
Water Sensitive Urban Design (WSUD)
The concepts presented for Stormwater Quantity and Quality Management (outlined above) are in line with the principles of WSUD. WSUD, however, incorporates consideration of the entire water cycle. In this regard rainwater re-use can form an integral part to WSUD and water conservation initiatives.
Section 6.4 outlines what needs to be considered for rainwater collection and re-use to form part of the overall Stormwater Management Strategy for the Study Area. Appendix D identifies appropriate WSUD targets for the site.

WAGGA WAGGA
PLANNING STUDY
WAGGA WAGGA
PLANNING STUDY
FIGURE 6.6
TYPICAL DRAINAGE
CORRIDOR
TYPICAL DRAINAGE
CORRIDOR

Wagga Wagga Planning Studies – Estella West 13
7.0 Costing
Refer Figure 7.1 for cost estimate of major stormwater management facilities
8.0 Stormwater Management Recommendations
Development activity is likely to increase runoff volumes and pollutant loads. Post-development flows need to be managed to minimise impacts downstream, while maintaining existing (environmental) flows to support habitats.
The following measures should be considered as part of an overall stormwater management system. The system shall ensure existing site flows are maintained, while minimising the effects of excessive runoff rates and volumes.
The following strategies should be employed as part of an overall stormwater management and water cycle plan.
• Stormwater Detention allows for the controlled release of stormwater runoff. In general, facilities should be provided at a local catchment level and located toward the downstream end of the catchment (outside areas susceptible to flooding – 100-year ARI).
• Rainwater Re-use Schemes provide an alternative water source. The harvested water can easily be used for non-potable purposes (although, requirements for monitoring and treating the condition of harvested rainwater need to be considered). Typically residential lots would utilise rainwater storages up to 10,000 litres capacity. Community-based systems (such as irrigation of open space and parklands) should also be considered.
• Reducing Impervious Areas assists to control the volume and rate of stormwater runoff. Measures to assist with optimising pervious / impervious ratios include limiting paved surfaces, incorporating of permeable paving and grass-lined corridors for drainage to complement landscaping. This strategy should be incorporated with a vegetation management plan to use native plant species.
• Water Sensitive Urban Design (WSUD) Principles that control the quality of stormwater discharged from the Study Area are to be incorporated (as outlined in Appendix D). Specific measures include pollution control devices, wetlands systems, bio-retention treatment facilities and maintaining site discharge rates that support environmental habitat downstream.
• Water quality targets shall be determined by the procedure indentified in Appendix C. As a minimum pollutant levels for the post-development scenario shall not exceed pre-development levels.

Wagga Wagga Planning Studies – Estella West 14
• Provide drainage corridors to manage concentrated surface trunk drainage flow within catchments. The drainage corridors would be utilised in a similar manner to the “Blue Line” water courses / riparian corridors.
• Analysis of existing culverts to confirm capacity and determine the impact of backwater effects (if any).

Wagga Wagga Local Environment Study
Estella West Study AreaFigure 7.1 Cost Estimate for Trunk Stormwater Facilities
CatchmentFacility Rate Unit Qty Total Qty Total Qty Total Qty Total Qty Total Qty Total
Stormwater Detention 25 $/m2 16740 418,500$ 9660 241,500$ 39090 977,250$ 7620 190,500$ 12570 314,250$ 10980 274,500$
Wetlands 50 $/m2 6000 300,000$ 3000 150,000$ 13000 650,000$ 3000 150,000$ 4000 200,000$ 40000 2,000,000$
Bioretention Swale 60 $/m2 4000 240,000$ 10000 600,000$ 2000 120,000$ 12000 720,000$ 3000 180,000$ 4000 240,000$ GPT 60000 ea 2 120,000$ 1 60,000$ 4 240,000$ 1 60,000$ 2 120,000$ 2 120,000$
1,078,500$ 1,051,500$ 1,987,250$ 1,120,500$ 814,250$ 2,634,500$
Total For Lloyd Study Area 8,686,500$
1 2 3 4 5 6
Wagga Wagga Planning Study ‐ Estella West
Northrop Consulting Engineers September 08

Wagga Wagga Planning Studies – Estella West 16
APPENDIX A – STORMWATER PLANNING MATRIX A1 Description of Matrix The purpose of the matrix is to provide a systematic approach in identifying opportunities and constraints to stormwater management for the Study Areas associated with the 2007 Wagga Wagga Planning Study. This will then enable stormwater management measures to be implemented to optimise development, respond to specific site conditions and consider the proposed land-use.
Study Area
Primary Land Use
No. Of “Blue Lines”
No. of C’ments
Upstream C’ment
Site Discharge Controls
Salinity Controls
Flood Liable Land
Stormwater Quantity
Stormwater Quality
Rainwater Re-Use
Refer to
Section A2
Refer to Section A3
Refer to Section
A4
Refer to Section A5
Refer to Section A6
Refer to Section A7
Refer to Section A8
Refer to Section
A9
Refer to Section A10
Refer to Section A11
Refer to Section A12
The Stormwater Planning Matrix identifies key issues and objectives to facilitate the planning and design of major drainage system components. The Matrix provides the framework for designers to determine solutions that will address the likely impact of proposed development. The process also seeks to inform the LES process by identifying appropriate stormwater drainage measures that are environmentally sensitive and minimise this impact.
The Goal of the Matrix is to identify the Stormwater Planning Controls associated with each of the respective Study Areas, while still encouraging innovation and best practice solutions.
Appendix A provides detailed descriptions for the criteria used to identify opportunities and constraints, as well as a method for constructing the stormwater planning framework for each Study Area.
A2 Primary Land Use Land-use correlates to the quantity and quality of stormwater runoff from a site. The amount of impervious area characterising the land-use is the main influence of this. As impervious area increases so does the volume of stormwater runoff and the potential for pollutant runoff. Conversely, more pervious site areas encourage ground infiltration and filter pollutants in runoff.
Typically, for urban areas, industrial lands have the highest impervious area ratio, while low density residential lands have the least. For calculation of peak runoff values for the sites nominated in the Wagga Wagga Planning Study the following post-development fraction impervious values were adopted.

Wagga Wagga Planning Studies – Estella West 17
Land Use Fraction Impervious
Low Density Residential 65% Industrial 90%
Mixed Use 85%
With reference to the Planning Matrix:
o The “Primary Land-use” column defines the predominant type of development expected in the study area (Post-Development Case).
o Residential development is defined low density housing (typical lot size between 750m2 and 1000m2 dispersed with small pockets of commercial and special uses lands).
o Residential development also incorporates commercial area, roadways, open space or recreational areas normally found within this type of development.
o For portions of the study areas where rural residential development is proposed a lower fraction impervious value of 40% may be adopted.
o Industrial Development refers to employment lands used for shop fronts, light manufacturing, warehousing / stockpiling, or transport depots. Heavy manufacturing is not expected on these sites as water and sewer infrastructure could not accommodate demands. Types of operations within industrial lands needs to be considered for specific sites, as it can directly impact the quality of stormwater runoff.
o Mixed land use refers to commercial developments such as petrol stations, truck stops or other enterprises requiring a shop front. Types of activities on mixed use lands needs to be considered for specific sites, as this can directly impact the quality of stormwater runoff.
A3 “Blue Line” Watercourses
The NSW Department of Water identifies “Blue Line” watercourses (as shown on 1:25,000 topographic maps) as significant drainage corridors. These corridors are typically associated with provisions for riparian habitat protection.
Protected watercourses are graded according to their ecological value. Typically, the higher the ecological value, the wider the associated riparian (protection) zone. In this instance, the width of the riparian zone can be dictated by ecological value, rather than width for conveying stormwater runoff.
“Blue line” watercourses can be ephemeral or have permanent flows. The watercourses are natural valleys or depressions within the catchment where surface stormwater runoff is concentrated. Utilising the existing topography of the study area for conveying this runoff provides the most cost-effective outcome for stormwater drainage, habitat protection and maintaining environmental flows to downstream watercourses.
Wagga Wagga Planning Studies – Estella West 18
A4 Number of Catchments in Study Area
The number of catchments refers to quantity of drainage catchments within the study area. Typically each catchment will drain to a “Blue Line” watercourse. Identification of catchments forms the basis for design of catchment-based (communal) stormwater management systems.
A5 Upstream Catchment
This column identifies whether there are upstream catchments outside of the Study Area that will contribute stormwater runoff to the site (e.g. via surface, watercourses or depressions). Flows from upstream catchments need to be considered when managing stormwater flows in each of the study area.
The capacity of proposed drainage networks within Study Areas will need to accommodate the flows from any upstream catchment – in order to maintain natural flow paths and convey safely through the site.
A6 Site Discharge Controls
This column identifies existing downstream elements or features that will influence the rate and volume of stormwater being discharged from a Study Area.
A7 Salinity Controls
Salinity can be managed by good stormwater management practices. Adoption of water sensitive urban design (WSUD) principles will inherently assist in the management of salinity. Some stormwater management measures such as ground water recharge or infiltration are not suitable in areas susceptible to salinity. Flagging salinity early in the planning process allows sympathetic stormwater management measures to be economically adopted.
Any stormwater infiltration mechanism that raises groundwater must be avoided in order to manage salinity. In some instances, it may also be preferable to reduce existing levels of infiltration to prevent adverse impacts of salinity.

Wagga Wagga Planning Studies – Estella West 19
A8 Flood Liable Land
Flooding of land within each of the study area can occur as a result of one (1) of two (2) events:
• The Murrumbidgee River overtopping its banks or; • A localised storm event generating stormwater runoff greater than the capacity of the
formal drainage system.
The source of the flooding risk for each study area is identified in this column of the Stormwater Planning Matrix. FL1 denotes flooding is due to the Murrumbidgee River overtopping its banks or levee and inundating the subject site. FL2 denotes indicates the site is susceptible to flooding due to a storm event occurring within the catchment. Generally flood risk denoted as FL2 is due to the existing downstream drainage network being under capacity.
This assessment has not considered the potential effects of the two (2) events occurring simultaneously, due to its unlikelihood.
Appropriate site stormwater management measures are influenced by the potential for site flooding. Furthermore the cause of flooding will influence the type of stormwater management options chosen. For example, if flooding occurs due to a catchment storm event, it is desirable to discharge the peak runoff of low lying lands (or lands subject to flooding) early in a storm event to allow the maximum capacity of the drainage system to be utilised. In such instances stormwater detention would be detrimental to the lower portions of the catchment.
A9 Stormwater Quantity Management
Urbanisation increases the quantity of stormwater runoff. As a result stormwater quantity management measures need to be adopted so the risk of flooding downstream is not increased. The principles of stormwater quantity management are outlined in Appendix B.
The quantity and rate of runoff discharged from a site can be controlled by the incorporation of stormwater retention and detention facilities into the drainage system. Source controls, such as limiting the amount of impervious area can also be incorporated in order to reduce the peak discharge from a catchment.
The baseline approach to designing for acceptable site stormwater discharge conditions is to control the peak post-development site discharge to be no greater than the pre-development scenario. This is generally to ensure the development does not increase any existing potential for downstream flooding.
Wagga Wagga Planning Studies – Estella West 20
Alternatively, any shortcomings in the existing drainage system to convey runoff can influence design - by dictating a maximum discharge from a catchment to suit inadequate downstream capacity. This further increases the reliance on detention and/or retention measures.
The Stormwater Planning Matrix considers design for stormwater quantity management measures according to the following categories:
• Q1 – Pre-development stormwater runoff not to exceed post development for 5 to 100 year ARI storm events for all durations.
• Q2 – Study Area or parts of Study Area located in flood prone land therefore not requiring stormwater detention.
• Q3 – Downstream discharge controls requiring flows to be limited to less than the pre development discharge rates.
• Q4 – Community-based stormwater detention facilities to be provided. • Q5 – Lot based or on-site stormwater detention (OSD) facilities to be provided.
A10 Stormwater Quality Management
The impact of urban stormwater on receiving waters is to be understood and managed as part of the development process. The purpose of this column of the Stormwater Planning Matrix is to identify an appropriate stormwater quality target which is dependent on the receiving waterway.
Stormwater runoff from all Study Areas forming the Wagga Wagga Planning Study will eventually flow to the Murrumbidgee River. In this regard stormwater quality targets will be defined by the Murrumbidgee Catchment Authority, in conjunction with engineering best practice.
Invariably, development activity necessitates stormwater treatment measures to be introduced to the drainage network in order to achieve water quality targets. These can be applied through community-based facilities or lot based measures. The Stormwater Planning Matrix considers design for stormwater quality measures according to the following categories:
• QA – Water quality target values which are specified by receiving waters stakeholders • QB – Site specific values due to location, catchment conditions or site use • QC – Community-based treatment measures to be provided • QD – Lot-based treatment measures to be provided

Wagga Wagga Planning Studies – Estella West 21
A11 Rainwater Reuse Rainwater is defined as stormwater runoff that is collected and treated to a level that allows re-use for a specified purpose. There are numerous ways to utilise rainwater in urban catchments. The potential for rainwater reuse is dependent on the applications within the catchment that can accept rainwater as an alternative means for water supply.
Typically domestic dwellings within urban catchments can easily collect rainwater for non-potable uses - outdoor supply (e.g. irrigation, car washing), toilet flushing and clothes washing machines. Larger scale rainwater reuse facilities can also be incorporated into the drainage network by providing water for open space irrigation and water features.
Each Study Area has the potential to be serviced by a rainwater re-use system. The goal of the Stormwater Planning Matrix is to facilitate full potential for rainwater re-use. Opportunities for rainwater re-use have been identified as follows:
• RA – Lot-based rainwater re-use systems • RB – Community-based rainwater re-use systems.
Rainwater re-use is a key component of WSUD and therefore every opportunity for incorporation into future development should be explored.

Wagga Wagga Planning Studies – Estella West 22
Appendix B – STORMWATER QUANTITY MANAGEMENT B1 Introduction
When urban development takes place in existing rural catchments significant pervious areas are replaced by impervious surfaces. This change leads to an increase in peak catchment flows and an increased volume of surface runoff (downstream of the site).
Increasing impervious area can lead to potential for:
• Flooding of downstream property
• Increasing overland flow to extend outside defined flow paths
• Erosion of natural watercourses
Stormwater quantity management minimises these problems by controlling runoff.
B2 Objectives
1. Development that does not increase the impact of rainfall events.
2. Development that does not adversely affect the integrity of natural waterways, groundwater and ecosystems.
3. Stormwater quantity management that is in accordance with best practice.
4. Provide stormwater quantity management measures that are functional and effective for the duration of their existence.

Wagga Wagga Planning Studies – Estella West 23
B3 Performance Outcomes for Infrastructure Best practice stormwater quantity management systems are dependent on three (3) aspects. These derive from (a) the adoption of the major / minor stormwater drainage philosophy, and (b) incorporating detention or attenuation to maintain / improve receiving waterways, habitats and infrastructure.
Major / minor drainage concepts seek to maintain convenience and amenity within the urban landscape during minor (nuisance) storm events and protection for life and property during major (excessive) storms.
Stormwater quantity management need to be considered in conjunction with the major / minor system managing runoff. While, best practice solutions will consider stormwater quality management and Water Sensitive Urban Design (WSUD) principles, also.
As a result, there is a strong interrelationship between the following aspects of design for stormwater quantity management.
B3.1 Minor Stormwater Drainage System The minor drainage system comprises the drainage network components that provide convenience and safety to pedestrians and traffic during frequent or minor storm events by controlling catchment flows within prescribed limits. The minor drainage system consists of kerbs, gutters, roadside channels, swales, stormwater pipes and pits designed to contain and convey stormwater runoff for events up t and including minor storms.
The minor drainage system shall be designed to contain and convey the peak flow due to the 5 Year ARI storm.
B3.2 Major Stormwater Drainage System The major drainage system incorporates drainage components that ensure residential, commercial, industrial and other habitable areas are protected from inundation during major storm events. The major drainage system consists of roadway reserves, open space areas, floodway channels, and natural watercourses to contain and convey stormwater runoff due to a major or infrequent storm event. Design of the major system is to occur at the Master Plan stage of development, so that a satisfactory level of safety and amenity is provided, whilst preventing devastation caused by major (excessive) storm events.
The major system shall be designed to contain and convey the peak flow due to the 100 Year ARI storm. These systems are to be designed so that velocity/ depth conditions are within prescribed limits.
B3.3 Stormwater Detention/Attenuation Stormwater runoff from the post-developed catchment condition is to be retained so that the flow characteristics of receiving waters are improved or as a minimum unchanged from pre-development conditions. This is typically achieved by providing detention / attenuation measures as part of the major drainage system.
In some circumstances, pre-existing flooding conditions downstream or inadequate capacity of receiving infrastructure, watercourses or topography, may require reducing post-development catchment discharge to less than pre-development levels.
Wagga Wagga Planning Studies – Estella West 24
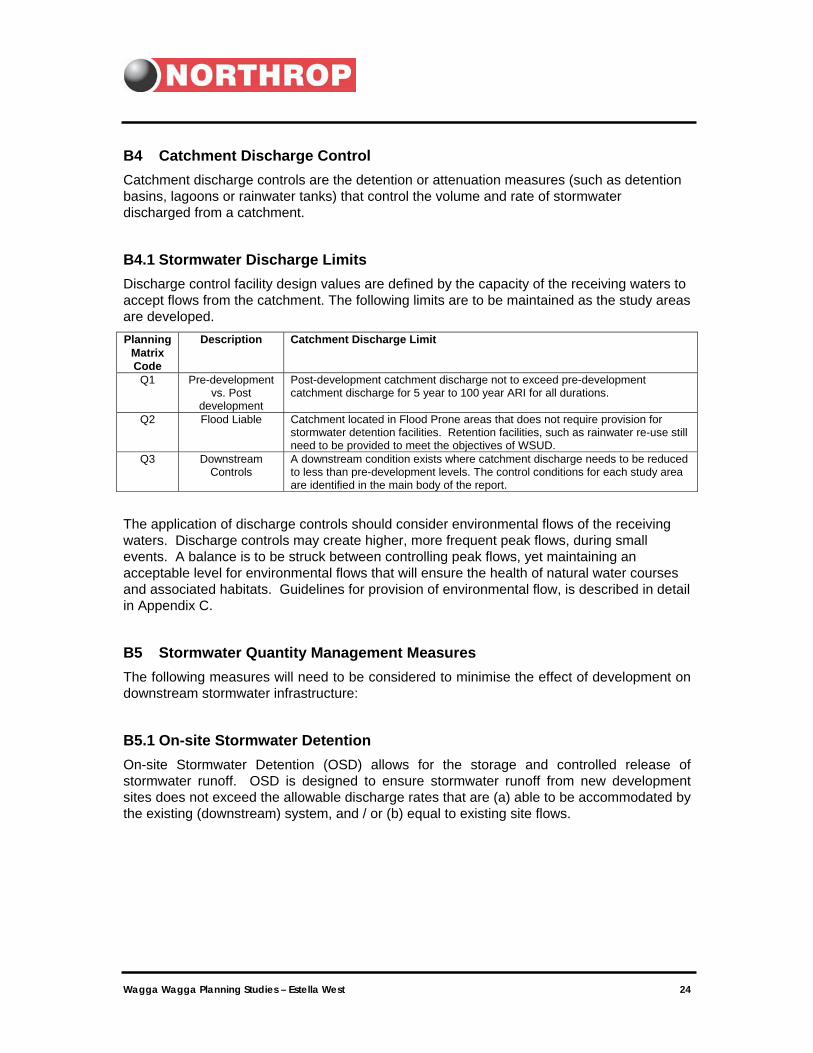
B4 Catchment Discharge Control Catchment discharge controls are the detention or attenuation measures (such as detention basins, lagoons or rainwater tanks) that control the volume and rate of stormwater discharged from a catchment.
B4.1 Stormwater Discharge Limits Discharge control facility design values are defined by the capacity of the receiving waters to accept flows from the catchment. The following limits are to be maintained as the study areas are developed. Planning
Matrix Code
Description Catchment Discharge Limit
Q1 Pre-development vs. Post
development
Post-development catchment discharge not to exceed pre-development catchment discharge for 5 year to 100 year ARI for all durations.
Q2 Flood Liable Catchment located in Flood Prone areas that does not require provision for stormwater detention facilities. Retention facilities, such as rainwater re-use still need to be provided to meet the objectives of WSUD.
Q3 Downstream Controls
A downstream condition exists where catchment discharge needs to be reduced to less than pre-development levels. The control conditions for each study area are identified in the main body of the report.
The application of discharge controls should consider environmental flows of the receiving waters. Discharge controls may create higher, more frequent peak flows, during small events. A balance is to be struck between controlling peak flows, yet maintaining an acceptable level for environmental flows that will ensure the health of natural water courses and associated habitats. Guidelines for provision of environmental flow, is described in detail in Appendix C.
B5 Stormwater Quantity Management Measures The following measures will need to be considered to minimise the effect of development on downstream stormwater infrastructure:
B5.1 On-site Stormwater Detention On-site Stormwater Detention (OSD) allows for the storage and controlled release of stormwater runoff. OSD is designed to ensure stormwater runoff from new development sites does not exceed the allowable discharge rates that are (a) able to be accommodated by the existing (downstream) system, and / or (b) equal to existing site flows.

Wagga Wagga Planning Studies – Estella West 25
On-site stormwater detention facilities will be provided at a local catchment level. The facilities are best located:
• Toward the downstream end of sites,
• Outside riparian/conservation corridors and discharge so as not to affect these areas,
• Outside areas susceptible to flooding (up to 100-year ARI), and
• So that connections are not susceptible to backwater from downstream drainage systems.
Care needs to be taken to ensure that stormwater runoff from the development site is not reduced to a level that affects environmental flows supporting downstream aquatic habitats.
B5.2 Stormwater Retention (Attenuation) Stormwater retention reduces site runoff discharging to the downstream drainage system. Stormwater is captured to provide an alternative water supply source – thereby conserving mains water consumption. Rainwater can be an alternative source of supply for non-potable and potable water-use purposes – depending on the level of treatment.
Stormwater retention/re-use systems can be applied to individual lots or at a local level. The capacity of individual lots systems can vary from 3,000 to 10,000 litres. The size of local systems is dependent on the demand and use (e.g. irrigation, non-potable water supply to residential lots, etc.).
B5.3 Optimising Impervious Site Areas Encouraging pervious site areas reduces the effect of increasing runoff due to paved / hard surfaces. Planning to optimise pervious and impervious spaces can lead to reducing development site runoff. This might consider:
• Permeable paving for public access areas and/or residential driveways/pavements. This will be subject to installing filtration media and subsurface drainage systems – where clay / impermeable soils exist on-site.
• Grassed swales for collecting and conveying stormwater runoff. Again, this will be subject to installing trickle drain / filtration media and sub-surface drainage systems to avoid saturating ground immediately under grass / vegetation.
• Limiting paved surfaces.
B5.4 Off-Site Works Scope may exist for an infrastructure augmentation strategy. Typically, permissible site discharge is governed by the capacity of the receiving drainage system. A cost-effective approach may be to augment downstream drainage infrastructure to improve capacity to cater for site flow. Such a strategy may reduce the amount of OSD required on the site and subsequently increase developable area.

Wagga Wagga Planning Studies – Estella West 26
Appendix C – STORMWATER QUALITY MANAGEMENT
C1 Introduction
Urban development typically increases impervious surfaces within a catchment, leading to potential increase in stormwater runoff. During regular rainfall events, runoff flushes pollutants that have been deposited during dry periods, resulting in higher pollutant loads reaching the receiving waters. To this end, rural runoff is of a higher quality than urban runoff.
Development within the City of Wagga Wagga involves converting rural lands to urban landscapes. As a result, stormwater quality management becomes critical. The impact of the pollutants depends on the pollutant, the sensitivity of the receiving watercourse and the concentration of the pollutants at the point of entry.
C2 Objectives
1. Protection of aquatic and terrestrial environments
2. Minimise disturbance to catchments downstream of the study areas
3. Regular rainfall events do not adversely affect water quality
4. Compliance with legislation
C3 Background
The major drivers of impacts on receiving waters that need to be considered in managing stormwater quality are as follows:
• Toxicants (heavy metals, hydrocarbons, pesticides, ammonia)
• Nutrients (phosphorus, nitrogen, carbon)
• Oxygen demanding substances (organic material (biochemical oxygen demand), ammonia, hydrocarbons, sulphides)
• Physical contaminants (suspended solids)
• Change in stream flow levels and frequency
• Microbial pathogens (enteric viruses, bacteria, protozoa, helminths)

Wagga Wagga Planning Studies – Estella West 27
• Aesthetic contaminants (organic and anthropogenic litter, hydrocarbon, nuisance algal-related scums, anaerobic-related scums and odours).
(Source –Australian Runoff Quality 2006)
Contamination of a waterway occurs when the concentration of an element is greater than natural levels. Current practice determines stormwater quality targets by assessing risk to the specific ecosystem to which stormwater runoff is being discharged.
“Trigger” levels, below which there is a low risk of harm to the environment, are being adopted instead of adoption of absolute values. If the trigger level is exceeded further analysis is required to determine ecosystem response.
The above concepts have been drawn from ANZECC Guidelines.
Table 3.1: Typical water quality values for urban runoff and guideline values: Variable
(mg/L unless otherwise indicated)
Urban Runoff Urban Guidelines
SS 250 (3-1620) <25 BOD 15 (7-40) <2 Lead 0.01-2.0 <0.025 Zinc 0.01-5.0 <0.05
Copper 0.4 <0.01 Chromium 0.02 <0.01 Cadmium 0.002-0.05 <0.0004
Faecal Coliforms (orgs/100mL) 104 (103-105) <103 Total Phosphorus 0.6 (0.1-3) <0.05
Ammonium 0.7 (0.1-2.5) <0.2 Oxidised Nitrogen 1.5 (0.4-5)
Total Nitrogen 3.5 (0.5-13) <0.5 Note: 1. Table sourced from Australian Runoff Quality 2006 2. SS = suspended solids 3. BOD = biochemical oxygen demand
C4 Stormwater Quality Management Controls The above guideline values can be used to plan stormwater quality management facilities for each study area. Further investigations will be required to design an appropriate stormwater quality management system.
Targets and controls for Stormwater Quality management are to be selected in accordance with the procedure presented in Chapter 7 of Australian Runoff Quality – A Guide to Water Sensitive Urban Design.
Selection of stormwater quality targets is a two phase process.
• Phase 1 - select trigger values for stormwater runoff contaminant loads. This is undertaken by utilising the ANZECC / ARMCANZ water resources and management framework to identify environmental and use values of the receiving waterway. The trigger values represent a runoff quality level that must be met to in order to limit the risk to the values to acceptable levels.

Wagga Wagga Planning Studies – Estella West 28
• Phase 2 - estimate the Permissible Average Annual Export Load (PAAEL) for the catchment to be compared to the trigger values for the receiving waters. The design of stormwater quality measures will address the imbalance between the untreated PAAEL and the trigger values.
The above process recognises the differences in the way contaminants may enter stormwater runoff as well as the variable impacts contaminants may have on the receiving waterway. Furthermore by adopting trigger levels, a more efficient design process is achieved, by limiting the need for field sampling and laboratory analysis to situations where the risk of impact of the development has increased.
C5 References ANZECC / ARMCANZ - Australian and New Zealand Environment and Conservation Council/ Agricultural and Resource Management Council of Australian and New Zealand
ARMCANZ and ANZECC (1994), National Water Quality Management Strategy: Policies and Principals
Environment Australia (2000), ANZECC / ARMCANZ Guidelines for Fresh and Marine Water Quality, 2000
Engineers Australia (2006), Australian Runoff Quality A guide to Water Sensitive Urban Design

Wagga Wagga Planning Studies – Estella West 29
Appendix D - Water Sensitive Urban Design (WSUD) D1 Introduction Water Sensitive Urban Design (WSUD) integrates urban water cycle management with urban planning and design. WSUD drives the beneficial outcomes to the built environment by:
• Improving the urban landscape
• Reducing pollutant export
• Retarding storm flows
• Preserving the natural hydrological regime of catchments
• Reducing irrigation requirements
• Reducing demand on the potable water supply
In practice, WSUD aligns innovative water management technologies within the built environment. The goal of WSUD is to bring together the water environment and infrastructure service design at the early planning stages. WSUD is applicable to a range of projects, scaling from individual house lots to new communities.
Underpinning the approach to water sensitive urban design is that stormwater is to be managed as a resource and for protection of the environment.
D2 WSUD Best Practice Approach Implementation of WSUD utilises three strategies (1) stormwater quantity management, (2) stormwater quality management, and (3) stormwater as a resource. Stormwater quality and quantity management have been outlined in Appendix B and C respectively.
D3 Stormwater as a Resource Traditionally roof stormwater runoff is directed to the street stormwater drainage system. In response to climate change, particularly where many parts of Australia are experiencing severe and extended periods of drought, such an approach is considered to discourage water conservation.
As a result, a key strategy for WSUD is to capture roof runoff. A direct benefit of this strategy is the reduction of demand on the potable water supply. Typical uses for rainwater for non-potable water supply include:
• Toilet Flushing • Irrigation • Car Washing / Wash down water • Manufacturing processes • Air Conditioner Chillers

Wagga Wagga Planning Studies – Estella West 30
Stormwater re-use facilities can be provided on an individual lot basis or as a community-based scheme. The continuation of variable rainfall patterns is leading to more and more opportunities for stormwater re-use. Stormwater re-use also supports stormwater quantity management, by reducing the volume of stormwater runoff emanating from a site.
D4 WSUD Planning and Design Tools Several planning and design strategies are presented below to assist with the implementation of WSUD initiatives.
D4.1 Open Space Networks WSUD integrates drainage corridors into public open space areas. Furthermore these areas can function as conservation corridors. The alignment of the corridors would typically follow “blue line” watercourses or outer natural depressions in the topography.
Figure D4.1 Open space network (Source: Engineers Australia 2006)
Recreation facilities adjacent to drainage facilities can introduce risks to public health and safety. The risks can be addressed by control measures such as warning signs and safety fencing. Risk assessment during the planning stage of the project should be undertaken to limit all risk to acceptable levels. Figure D4.1 shows a typical open space layout

Wagga Wagga Planning Studies – Estella West 31
D4.2 Lot Layout WSUD encourages a more compact form of development to minimise impervious surfaces. Lot layouts should be designed so that individual properties are integrated with the drainage function of the open space networks.
Figure D4.2 Integration of lots with open space corridors (Source: Engineers Australia 2006)
D4.3 Road Layout
WSUD utilises the natural features of the site to develop the road layout. Roads are generally located beside open space networks / corridors. This serves to (1) enhance recreation amenity, (2) locate detention and pollution treatment facilities close to the discharge point / source.
This approach assists to reduce the surface area of roads. The concept is shown in Figures D4.2 and D4.3.

Wagga Wagga Planning Studies – Estella West 32
D4.4 Streetscape WSUD integrates vehicular and pedestrian requirements with stormwater management facilities. Typical methods include, zero lot lines, reduced frontages and placing stormwater detention and treatment facilities in road reserves.
Figure D4.3 Conventional and WSUD road layouts (Source: Engineers Australia 2006)
Figure D4.4 Conventional and WSUD road cross section (Source: Engineers Australia 2006)
D5 Summary of Water Sensitive Urban Design Elements

Wagga Wagga Planning Studies – Estella West 33
Several of the commonly used WSUD elements are described in this Section. Typically a combination of these elements is used to manage stormwater from developed sites.
D5.1 Sediment Basins Sediment basins are designed to remove coarse sediments from stormwater runoff. A sediment basin removes particles by slowing water velocity to allow sediments time to fall to the bottom of a water column. Sediment basins are provided early in the treatment process and prevent downstream waterways becoming clogged.
Sediments basins require frequent maintenance. Maintenance activities included dewatering of the basin then removal of the collected sediment from the invert of the basin. Sediment basins can be designed to completely drain after a rainfall event or have a permanent pond.
Figure D5.1 Typical sediment basins (Source: Melbourne Water)
D5.2 Bio-retention Swales Bio-retention swales are bio-treatment systems located at the base of a swale. They provide treatment by filtering stormwater through a filter media such as sand. Furthermore, bio-retention swales detain stormwater runoff and act as a conveyance system (instead of pipes).
Bio-retention swales are commonly located in the median strips of roadways. Bio-retention swales offer efficient removal of nitrogen and other contaminants.
Bio-retention systems allow water to permeate through a filter media. The water is then infiltrated into permeable site soil or collected in an underlying perforated pipe / drainage system where impermeable soils are present. This arrangement can make bio-retention swales suitable for areas affected by salinity.
The performance of the bio-retention swale is enhanced by introduction of vegetation by prevent clogging and scouring of the filter material.

Wagga Wagga Planning Studies – Estella West 34
Figure D5.2 Typical bio-retention swales (Source: Melbourne Water)
D5.3 Bio-retention Basins Bio-retention basins operate in a similar manner to bio-retention swales, except that they do not convey stormwater. Bio-retention basins are “off-line” systems - where large flows are diverted away from the basin.
Bio-retention basins can be integrated into landscape areas and constructed in any shape or size to suit the application. Bio-retention basins work effectively by placing them at regular intervals in the roadway to form traffic calming devices or parking bays.

Wagga Wagga Planning Studies – Estella West 35
Figure D5.3 Typical bio-retention basins (Source: Melbourne Water)
D5.4 Swales or Buffer Systems Vegetated swales can be used to transport stormwater in lieu of pipes. The inherent interaction of stormwater with vegetated swales slows runoff and allows coarse sediment to remain within the catchment. In addition, swales can add to the aesthetic character of a development.
Swales are not suited to steep sites, as high velocities can result. Conversely swales constructed at flat grades (i.e. less than 2%) tend to become waterlogged. Trickle drains should be considered where soils have potential to become saturated.
Figure D5.4 Swale and buffer system (Source: Melbourne Water)
D5.5 Wetlands Constructed wetlands are vegetated water bodies that promote removal of pollutants from stormwater. Pollutants are removed by sedimentation, filtration and pollutant uptake by the vegetation.
Wetlands are made up of various zones, each with a different treatment function. Stormwater passes through each of these zones to obtain the desired water quality. Wetlands can provide a habitat for wildlife and can form part of recreation areas. Wetlands can vary in size to suit the site, land-use and level of treatment required.

Wagga Wagga Planning Studies – Estella West 36
Figure D5.5 Wetlands (Source: Melbourne Water)
D5.6 Rainwater Tanks Rainwater tanks provide two benefits to development. Firstly they encourage water conservation, and secondly they reduce the quantity of stormwater discharged to downstream waterways. Rainwater tanks also assist in reducing pollutant loads in stormwater discharge.
Rainwater storage can be provided on a lot by lot basis or as a community storage facility. Community facilities should always be considered in any project, as they offer a cost-effective means of providing rainwater harvesting to a large number of properties.
Generally, roof water is directed directly to rainwater tanks via a first flush flow treatment device. Surface water needs to be substantially treated prior to collection and re-use.
The size of the tank is dictated by the water demand of the services it supplies. If the service is totally reliant on supply from the tank, additional storage provisions need to be provided so that water is available during extended dry weather periods.
D5.7 Aquifer Storage and Recovery Aquifer Storage and Recovery (ASR) is the process where ground water supplies are recharged to counteract the effects of water extraction. ASR can also be adopted as part of a salinity management strategy. Typically excess stormwater from development (or land clearing) can be harvested, treated and injected back into the groundwater supply. The viability of an ASR scheme is dependant on the underlying geology of a development site and in particular the presence of natural aquifers.

Wagga Wagga Planning Studies – Estella West 37
D6.0 References
Engineers Australia (2006), Australian Runoff Quality - A Guide to Water Sensitive Urban Design
Melbourne Water (2005), WSUD Engineering Procedures: Stormwater