Embed Size (px)
Citation preview

Volume 6, Issue 8(2), August 2017 International Journal of Multidisciplinary
Educational Research
Published by Sucharitha Publications 8-43-7/1, Chinna Waltair Visakhapatnam – 530 017 Andhra Pradesh – India Email: [email protected] Website: www.ijmer.in


Editorial Board Editor-in-Chief Dr.K. Victor Babu Faculty, Department of Philosophy Andhra University – Visakhapatnam - 530 003 Andhra Pradesh – India
EDITORIAL BOARD MEMBERS Prof. S.Mahendra Dev Vice Chancellor Indira Gandhi Institute of Development Research Mumbai Prof.Y.C. Simhadri Vice Chancellor, Patna University Former Director Institute of Constitutional and Parliamentary Studies, New Delhi & Formerly Vice Chancellor of Benaras Hindu University, Andhra University Nagarjuna University, Patna University Prof. (Dr.) Sohan Raj Tater Former Vice Chancellor Singhania University, Rajasthan Prof.K.Sreerama Murty Department of Economics Andhra University - Visakhapatnam Dr.V.Venkateswarlu Assistant Professor Dept. of Sociology & Social Work Acharya Nagarjuna University, Guntur Prof. P.D.Satya Paul Department of Anthropology Andhra University – Visakhapatnam Prof. Josef HÖCHTL Department of Political Economy University of Vienna, Vienna & Ex. Member of the Austrian Parliament Austria Prof. Alexander Chumakov Chair of Philosophy Russian Philosophical Society Moscow, Russia
Prof. Fidel Gutierrez Vivanco Founder and President Escuela Virtual de Asesoría Filosófica Lima Peru Prof. Igor Kondrashin The Member of The Russian Philosophical Society The Russian Humanist Society and Expert of The UNESCO, Moscow, Russia Dr. Zoran Vujisiæ Rector St. Gregory Nazianzen Orthodox Institute Universidad Rural de Guatemala, GT, U.S.A Prof.U.Shameem Department of Zoology Andhra University Visakhapatnam Dr. N.V.S.Suryanarayana Dept. of Education, A.U. Campus Vizianagaram Dr. Kameswara Sharma YVR Asst. Professor Dept. of Zoology Sri. Venkateswara College, Delhi University, Delhi I Ketut Donder Depasar State Institute of Hindu Dharma Indonesia Prof. Roger Wiemers Professor of Education Lipscomb University, Nashville, USA Dr. N.S. Dhanam Department of Philosophy Andhra University Visakhapatnam

Dr.B.S.N.Murthy Department of Mechanical Engineering GITAM University Visakhapatnam
Dr.S.V Lakshmana Rao Coordinator A.P State Resource Center Visakhapatnam
Dr.S.Kannan Department of History Annamalai University Annamalai Nagar, Chidambaram
Dr. B. Venkataswamy H.O.D., & Associate Professor Dept. of Telugu, P.A.S. College Pedanandipadu, Guntur, India Dr.E. Ashok Kumar Department of Education North- Eastern Hill University, Shillong
Dr.K.Chaitanya Department of Chemistry Nanjing University of Science and Technology People’s Republic of China
Dr.Merina Islam Department of Philosophy Cachar College, Assam
Dr. Bipasha Sinha S. S. Jalan Girls’ College University of Calcutta, Calcutta Prof. N Kanakaratnam Dept. of History, Archaeology & Culture Dravidian University, Kuppam Andhra Pradesh
Dr. K. John Babu Department of Journalism & Mass Comm Central University of Kashmir, Kashmir
Dr.T.V.Ramana Department of Economics, Andhra University Campus, Kakinada
Dr.Ton Quang Cuong Dean of Faculty of Teacher Education University of Education, VNU, Hanoi
Prof. Chanakya Kumar Department of Computer Science University of Pune,Pune
Prof. Djordje Branko Vukelic Department for Production Engineering University of Novi Sad, Serbia Prof. Shobha V Huilgol Department of Pharmacology Off- Al- Ameen Medical College, Bijapur Prof.Joseph R.Jayakar Department of English GITAM University Hyderabad Prof.Francesco Massoni Department of Public Health Sciences University of Sapienza, Rome Prof.Mehsin Jabel Atteya Al-Mustansiriyah University College of Education Department of Mathematics, Iraq Prof. Ronato Sabalza Ballado Department of Mathematics University of Eastern Philippines, Philippines Dr.Senthur Velmurugan .V Librarian Kalasalingam University Krishnankovil Tamilnadu Dr.J.B.Chakravarthi Assistant Professor Department of Sahitya Rasthritya Sanskrit Vidyapeetha, Tirupati Prof. R. Siva Prasadh Institute of Advanced Studies in Education Andhra University, Visakhapatnam
© Editor-in-Chief, IJMER®
Typeset and Printed in India
www.ijmer.in IJMER, Journal of Multidisciplinary Educational Research, concentrates on critical and creative research in multidisciplinary traditions. This journal seeks to promote original research and cultivate a fruitful dialogue between old and new thought.

Proceedings of the International Conference on
RECENT ADVANCES IN AQUACULTURE (RAA-2016) 16th & 17th December, 2016
Chief Editor Dr. Kondamudi Ramesh Babu, M.Sc. B.Ed. Ph.D.
Converner-RAA-2016 Department of Marine Living Resources
College of Science and Technology Andhra University, Visakhapatnam - 530 003
Andhra Pradesh, India
Editors Dr. Md. Akhtar Hossain
Professor, Department of Fisheries University of Rajshahi, Rajshahi-6205, Bangladesh
Prof. P. Sasi Bhushana Rao, Ph.D., F.A.E.B., F.En.R.A.
Former Head, P.G. Dept. of Life Sc., SKCG (Auton) College, Govt. of Odisha
Dr. R. Ananda Raja, MVSc, Ph.D, ARS., Scientist,
ICAR-Central Institute of Brackish water Aquaculture, Ministry of Agriculture, Govt. of India,75, Chennai-600028, India.
Prof. Lakshman Nayak
Department of Marine Science, Berhampur University, Odisha
Prof. Sumit Homechaudhuri Department of Zoology, University of Calcutta, West Bengal
Dr. Jayasree Loka, Scientist
Karwar Research Centre of CMFRI, North Karnataka - 581301, Karnataka, India.
Dr. Dr. S. Kandan, Director, MPEDA
Dr. Pradyut Biswas, Assistant Professor College of Fisheries, Lembucherra, Agartala, Tripura
Technical Assistant for Proceedings of the International Conference on RAA-2016
Dr. Joseph Uday Ranjan, T Dr. K. V. Siva Reddy Dr. V. Govind Rao
Dr. G. Vijaya Pratap Mr. K. Pavan Kumar
Mr. M. Naresh Dr. N.M. Krishna
Mrs. Ch. Prasanthi Ms. G. Prasanna Lakshmi
Technical assistance for conference
Dr. Gopal Anand Mrs. Archana Ayyagari
Dr. M. Mohan Rao Mr. M. Srinivasa Rao Dr. M. Murali Mohan Dr. N. Ram Sai Reddy
Mr. Appala Raju Urap Nanaji

FOREWORD
India is one of the leading countries in production & supply of protein rich aquatic food in the form fish & prawn for the growing Global population. The Indian sub-continent is covered with sea on 3 sides offering greater capture potential for marine products. But due to over exploitation in the coastal areas, the marine productivity is affected markedly and the production trend reveals a plateau or even declining. The resources from the Deep Sea/off shore waters are not yet fully exploited. Water covers 2/3rd of the Globe and rest with land. But the potentiality has not been reaped optimally. The latest innovative technologies, namely, PFZ-Remote Sensing, GIS, GPRS, onboard processing, new designs in Fishing gear & crafts are essential at this juncture for tapping the untouched areas in Exclusive Economic Zone .In addition, Biodiversity is to be protected & maintained by adopting environmental friendly fishing operations.
The Andhra Pradesh, the Rising State, is Ranked 1st in Fish & Prawn production in India, 3rd in Global shrimp production, 6th in Global Aquaculture Production and contributing 1.19 % Global & 20.77 % National Production.
The Continental shelf area of AP is 33,227 Sq. Km offers greater scope for introduction of Coastal & Offshore cage Culture systems for culture of some important marine & Brackish water species whose seed production & culture practices have been standardised by ICAR institutes, MPEDA-RGCA, include, Cobia, Silver Pampano, Groupers, Seabass, P.monodon, L vannamei, Mud Crab, P. semisulcatus etc., to meet the demand both in Domestic & International market. The Countries like, China, Australia, Japan, Thailand, Vietnam have progressed tremendously in Offshore Cage Culture practices. India is about to kick start the technology.

Aquaculture is one of the growing subsector in fisheries which is also facing leaps and bounds in recent years. The Government of Andhra Pradesh has taken a proactive role in the further expansion of the aquaculture sector as a means to increase production, as an important tool for development and income generation in rural areas and as source of foreign exchange earnings through trade. There is a greater need to monitor the Aquaculture system by introducing Surveillance & Monitoring technologies in hatchery operations, grow out culture systems, Pond Automation and also to strengthen the Aqua lab services through Networking and to link all the Aqua Labs to National & International Research Institutes, Universities etc., to mitigate the Disease & water quality problems
In addition, the Skill & knowledge development programmes are also essential to equip State with Man Power to handle the issues more effectively to achieve sustainability.
In this context, the efforts made by the Andhra University through its branches dealing with Marine Biology, Fisheries, Aquaculture etc., are highly appreciable in contributing Man Power, Technologies, Research & Education. I have a strong belief that the proceedings of “International Conference on Recent Advances in Aquaculture (RAA-2016)”, being Organised by the Department of Marine Living Resources, Andhra University, Visakhapatnam would identify the issues and bring implementable solutions that are needed for Development of Fisheries Sector in India and particularly in AP. I wish a Great Success.
Rama Sankar Naik

Acknowledgements
It is our pleasure to present this volume consisting of selected papers from the International conference on Recent Advances in Aquaculture (RAA-2016), held 16th & 17th December 2016 at the Andhra University, Visakhapatnam, India. We would like to address a particular warm thank to the members of the scientific committee, for their participation and expertise in the preparation of the conference. We thank also all the people who agreed to deliver a key‐note speech or to play the role of moderator and chair of sessions. Then our greetings go to all the participants who proposed a paper and came to Visakhapatnam to present it. We would also like to extend our gratitude to the following reviewers of the original abstracts and the papers submitted for consideration in this volume for having so generously shared their time and expertise. Along with these individuals, faculty members of the Marine living Resources Department have been very kind enough to extend their help at various phases of this conference, we wish to thank our local colleagues and students who contributed greatly to the organization and success of the conference. Finally, I would like to thank our sponsors for their very important financial support for which we are extremely grateful to National Fisheries Development Board (NFDB), University Grants Commission (UGC), Andhra Pradesh State Council of Higher Education (APSCHE) and Avanti feeds Limited. Last but not least the Conference Convener would like to express their gratitude towards a Research Scholars who have devoted their time and endless patience to the organization of this conference. Many thanks given for all persons who help and support this conference.
Convener (RAA-2016)
Dr. Kondamudi Ramesh Babu

RECOMMENDATIONS
The following recommendations have been made by the committee to improve aquaculture sector;
1 To take up marine algal aquaculture in large scale along the coast
i) To enable absorb atmospheric CO2 and abate global warming;
ii) To produce a diversity of bioactive compounds of medicinal
value, micro nutrients and feed of animals;
iii) To generate 7,500-19,000 liters of biofuel per acre and
iv) To generate employment for a large number of people.
2. To establish a National Institute of Aquaculture Engineering to take up research and offer courses to design craft and gear, tools and lab equipment related to aquaculture and products of aquaculture.
3. To promote Mariculture aggressively to augment the fish production from coastal waters. Cage culture and sea weed culture areas to identify and has to promote mariculture.
4. To entrust an organization to collate the entire data base generated on marine aqua farming and the resource value of marine aquatic flora and fauna so that the data will be always available for application and efficient management practices.
5. To develop hatcheries and manage the same free from the
impact of pollution and prevent possible genetic aberrations if any.
6. To ensure constant biological and chemical monitoring of the marine waters
7. To decrease the diseases in shrimp aquaculture the Committee has recommended to minimize stocking densities in order to reduce the risk of disease outbreaks and transmission.

8. Support and promote initiatives to minimize fish discards and post-harvest losses and waste at all steps of the fish value chain. Strengthen national statistics and support research to improve knowledge on the impact of the production and consumption of fish on nutrition.
9. To educate and empower the local fishing community who
should form an integral part of all decision making to ensure sustainable management of socio-economic issues and biological resources of the locality.
10. Committee has recommended Aquaculture industries and farmers not to result in negative environmental impacts in terms of discharges and effluents to the surrounding areas, for example, drinking water supplies and mangrove forests. They also suggested Aquaculture has to support the long-term economic and social well-being of local communities.
11. Encourage greater focus, wider collaboration and synergy amongst Andhra University and Research and Development providers on key Aquaculture topics, with science agencies such as CMFRI, CIFT, NIFPHAT, CIBA and NBFGR taking a leading role in development of disease resistant/specific
pathogen free seed.
12. Raise awareness of the importance of fisheries and aquaculture for food security and nutrition, in particular at the National Seminars, Conferences, Workshops, Publications in News Papers etc.


Invited Lecture-1
AQUACULTURE IN BANGLADESH: ADVANCES AND STRATEGIES
Hossain, M.A.
Professor, Department of Fisheries University of Rajshahi, Rajshahi-6205, Bangladesh Corresponding author E-mail: [email protected]
Abstract: Aquaculture in Bangladesh is a proven technique to increase the fish production, income and employment generation. It is playing a vital role to improve the livelihood especially of poor, marginal and disadvantaged groups. Aquaculture is also contributing well for the development of enterprises with the involvement of series of actors. Due to research, extension and development initiatives, aquaculture is already found to be diversified in terms of ecosystem, culture type, adaption level, species and intensification. Now aquaculture in the country is moving towards safe food production rather than increase in only food production. In spite of having tremendous potentials there are also some challenges for its further promotion. Therefore, based on the national policy and development goals, present effort analyzes the resources, shows the production trend, describes the advances in aquaculture including research and extension activities; identifies problems and recommends strategies for sustainable growth.

Invited Lecture-2
INCORPORATION OF WATER HYACINTH ( EICHHORNIA CRASSIPES ) IN FEED FOR DEVELOPING ECO-FRIENDLY LOW
COST FEED OF MIRROR CARP, CYPRINUS CARPIO VAR. SPECULARIS (LINNAEUS, 1758)
Md. Al-Amin Sarker* and Ifti Aziz,
Laboratory of Aquaculture, Department of Fisheries, University of Rajshahi, Rajshahi-6205, Bangladesh
Corresponding author: E-mail: [email protected] Abstract: This study was conducted to develop low cost eco-friendly feed incorporation with water hyacinth, Eichhornia crassipes meal, and to evaluate the effects on growth performance and production economy of mirror carp, Cyprinus carpio var. specularis aquaculture. Mirror carp at average weight of 21.34±0.17g were fed with three different experimental diets (Meat and bone meal, Mastered oil cake, Maize bran, Rice bran, NaCl, Vitamin premix and Vitamin-E) with 0% water hyacinth meal (WH0 diet), 15% (WH15 diet) and 25% (WH25 diet) for 12 weeks in six different experimental ponds. Fish were fed two times daily at a rate of 4% of their body weight during the entire experimental period. The water quality parameters of the experimental ponds were monitored every 2 weeks interval. The water quality parameters were found at acceptable limit. . The result indicated that growth performance tended to decrease with increase in inclusion level of water hyacinth meal. The weight gain and specific growth rate (SGR %,bwd/day) were significantly higher (P<0.05) in fish groups fed WH0 and WH15 diets than WH25 group. Also, the feed conversion ratio (FCR) was significantly higher in fish group fed WH25 diet than fish groups fed WH0 and WH15 diets. The fish groups fed WH0 and WH15 diets had no significant difference in weight gain (WG), SGR and FCR. The production was found significantly higher in WH0 fish group than other groups. However, the cost benefit ratio (CBR) was found significantly higher in WH15 (15% water hyacinths meal based diet) fish group than other groups. Analysis of proximate composition of the whole fish fed with different diets did not show any significant difference (P>0.05). The cost of feed production decreased as the incorporation level of water hyacinth increased. Result indicated that incorporation of 15% water hyacinth meal in a diet was the best as a practical diet of mirror carp for reducing feed cost and increasing profit. Key words: water hyacinth, growth, economics, mirror carp

Invited Lecture-3 MPEDA’S ROLE IN BLUE ECONOMY OF INDIA- WAYS AND
MEANS
Dr. S. Kandan Deputy Director (Aqua), The Marine Products Export Development
Authority, (Ministry of Commerce & Industry, Govt. of India)
Regional Centre (Aqua), 33-25-35, 2nd Floor, Bellapusobhanadri Street, Suryaraopet, Vijayawada-520 002. Ph: 0866-2433050; Fax: 0866-2432122 E-mail: [email protected]; [email protected];
Government of India established The Marine Products Export Development Authority (MPEDA) on 20th April 1972 by an Act of the Parliament. MPEDA was given the mandate to promote the export of seafood from the country. It was also envisaged that this organisation would take all actions to develop and augment the resources required for promoting the exports of all varieties of fishery products known commercially as Shrimp, Prawn, Lobster, Crab, Fish, Shell-fish, other aquatic animals or plants or part thereof and any other products which the authority may, by notification in the Gazette of India, declare to be marine products. Further, MPEDA took all measures required for ensuring sustained, quality seafood exports from the country. Anticipating increased raw material requirements, the Act has given MPEDA the responsibility of not only developing deep sea fishing but also aquaculture. MPEDA was also given the authority to prescribe for itself any matters which the future might require for protecting and augmenting the seafood exports from the country. It was also empowered to carry out inspection of marine products, its raw material, fixing standards and specifications, training, regulating as well as take all necessary steps for marketing the seafood overseas.
During 43 years of glorious service to the marine sectors, MPEDA has brought lot of innovation technologies in aquaculture mainly shrimp culture which leads to almost 3.30 lakh MT of shrimp production in our country and ranks second among the Shrimp producing countries. Also, developed technology for diversified species such as Seabass, Mud Crab, Tilapia, Cobia, Artemia, etc. The present topic will deliver the message

how MPEDA has emerged as a National pride in the Aquaculture sector mainly for Blue Economy.
Brief Note on Dr. S Kandan, Dy Director, MPEDA, Vijayawda, Andhra Pradesh
Dr. S. Kandan has done his Ph.D. in Marine Science in CMFRI, Cochin under the senior research fellow of Indian Council of Agricultural Research (ICAR). He is serving in MPEDA for the past 21 years in various capacities in various states of our country to promote aquaculture and allied activities. He was also Head of the Research wing of Seabass and Mud Crab Seed Productions and Growout programme at Rajiv Gandhi Centre for Aquaculture (RGCA) of MPEDA. At present he is the regional Deputy Director of Andhra Pradesh closely associating with the Dept. of Fisheries, Govt. of A.P for implementing various aquaculture schemes in Andhra Pradesh. He has visited USA, Canada, Hungary, Singapore, Malaysia, Hong Kong, China in connection with aquaculture research and marine products exports promotion.

C O N T E N T S
Volume 6 Issue 8(2) August 2017
S. No
Pg. No
1. Live Feed-Importance, constrains and Future prospects in Aquaculture Production System
Mamta M. Barad, A. J. Bhatt, Veerendra Singh and Vagh Sarman
1
2. Role of Probiotics as Bio-controlling agents in Aquaculture-A Review
K. Manikya Kumari
17
3. Ichthyofaunal Biodiversity in the Sunamudi Gedda a tributary of Mahendratanaya, Eastren Ghats at Venkatavarada Rajapuram, Mandasa, Srikakulam Dt. Andhra Pradesh, India
Rama Rao. K and Vinod Kumar Mudumala
35
4. Periodic Variations In The Occurrence Of Marine Ornamental Fishes In The By-Catch Of Visakhapatnam Fishing Harbour,Andhra Pradesh, East Coast Of India
Krishna, N.M, Velamala, GovindaRao, Ramesh Babu, K and D.Venu
62
5. Proximate Composition and Heavy Metal Accumulation in some selected Deep Sea Fishes along the continental slope (200m to 1200m Depth) of Indian EEZ (Exclusive Economic Zone)
K. Rushinadha Rao and U. Sreedhar
77
6. Heavy Metals Accumulation In The Selected Food Fishes From Nizampatnam Coast, Andhra Pradesh, India K. Prabhavathi, P.V Krishna and V. Panchakshari
93
7. Length weight relationship of ten commercially important marine fishes from Visakhapatnam, coast of Andhra, India
Govinda Rao. V, N.M.Krishna, K.V. Siva Reddy and K. Ramesh Babu
110

8. Review On Tilapia: Nutrition, Feeds, And Feed Management
S. S. Rathore, S. I. Yusufzai, A. Chandravanshi, P. Chandravanshi and K. Jaiswal
115
9. The Variations in the Distribution of Mineral Elements in some Intertidal marine macro algae of Visakhapatnam, East Coast of India
Y. Sarojini1, B. Sujatha
137
10. Mission Kakatiya to Boost Fish Production in Telangana State
B.Srishylam, Dr. S. Ramesh Babu G. Srinivas Reddy and M. Shiva Kumar
152
11. Socio-Economic Condition of Fishermen and Its Impact on Environment: A Case Study of Aryapalli of Ganjam District, Odisha
Ritanjali Swain and Lakshman Nayak
159
12. Seasonal Variation of the Physicochemical Properties of Nagavali Estuary, Northeast Coast of India
Ramesh Babu, K. and Kurma Rao. R.
171
13. Aquaculture Nutrition, Physico-Chemical Parameters of Nizam Sagar Dam with respect to Fish Production
Dr. H. L. Tamlurkar, A. Bhaskar and Rafiya Yasmeen
182
14. Biofloc Technology An Innovative Aquaculture System For Sustainable Growth
K. Kavitha, K. Suneetha and Darwin.Ch
189
15. Length-Weight Relationship and Relative Condition Factor of Lates Calcarifer (Bloch, 1790) from Sarada and Varaha Estuarine Confluence Point, Visakhapatnam, East Coast of India
G. Vijay Pratap and K. Ramesh Babu
200
16. Nutritional Aspect For Freshwater Prawn (Macrobrachium Rosenbergii) Farming
K. Jaiswal, K.H. Vadher, M. Pal, K. Manusha
and V. Sarman
217

17. Fish Production Implies To Economic Growth& Stainable Development
Y. Suryasowjanya and Luke Steeven Babu
228
18. Bio Statistical Values, Importance, Threats and Conservation Measures of Fresh and Brackish Water Wetland Icthyiofaunal Diversity of Srikakulam District, Andhra Pradesh, India
Dr. S. Mukunda Rao, R. Ramachandra Rao and Prof. B. Bharatha Lakshmi
237

Dr. K. VICTOR BABU M.A.,M.A.,M.Phil.,Ph.D.,PDF, (D.Lit)
Faculty of Philosophy and Religious Studies & Editor-in-Chief International Journal of Multidisciplinary Educational Research (IJMER) & Sucharitha: A Journal of Philosophy and Religion Andhra University, Visakhapatnam Pin - 530 003 , Andhra Pradesh – India
ISSN : 2277 – 7881 Impact Factor :4.527(2016)
Index Copernicus Value: 5.16
Editorial……
It is heartening to note that our journal is able to sustain the enthusiasm and covering various facets of knowledge. It is our hope that IJMER would continue to live up to its fullest expectations savoring the thoughts of the intellectuals associated with its functioning .Our progress is steady and we are in a position now to receive evaluate and publish as many articles as we can. The response from the academicians and scholars is excellent and we are proud to acknowledge this stimulating aspect.
The writers with their rich research experience in the academic fields are contributing excellently and making IJMER march to progress as envisaged. The interdisciplinary topics bring in a spirit of immense participation enabling us to understand the relations in the growing competitive world. Our endeavour will be to keep IJMER as a perfect tool in making all its participants to work to unity with their thoughts and action.
The Editor thanks one and all for their input towards the growth of the Knowledge Based Society. All of us together are making continues efforts to make our predictions true in making IJMER, a Journal of Repute
Dr.K.Victor Babu
Editor-in-Chief
SOCIAL SCIENCES, HUMANITIES, COMMERCE & MANAGEMENT, ENGINEERING & TECHNOLOGY, MEDICINE, SCIENCES, ART & DEVELOPMENT STUDIES, LAW
www.ijmer.in
INTERNATIONAL JOURNAL OF MULTIDISCIPLINARY EDUCATIONAL RESEARCH
ISSN : 2277-7881; IMPACT FACTOR – 4.527; IC VALUE:5.16; ISI VALUE:2.286 VOLUME 6, ISSUE 8(2), AUGUST 2017
Live Feed- Importance, constrains and Future prospects
in Aquaculture production system
Mamta M. Barad College of fisheries, Junagadh
Agricultural University, Veraval, Gujarat
A. J. Bhatt College of fisheries, Junagadh
Agricultural University, Veraval, Gujarat
Veerendra Singh College of fisheries, Junagadh
Agricultural University, Veraval, Gujarat
Vagh Sarman College of fisheries, Junagadh
Agricultural University, Veraval, Gujarat
Abstract
Live feeds are the important key factors for the enhancement and sustainable aquaculture production system. These feeds are nutrient and protein enrichment which are as a supplement feed and don’t have
negative impact to aquatic flora and founa. Almost all aquaculture facilities rely heavily on live feeds as part of the diet for their fish, crustaceans or even abalone. The most important features of live feeds, the diet may not be complete / perfect for the species being farmed and long term or inappropriate storage can result in feed quality deterioration. We therefore need to use live feeds to fill the full set of requirements of an aquaculture diet by overcoming the shortcomings of artificial feeds.This is possible because live feeds offer a number of distinct advantages, such as suitable first feed for many species of larvae and nauplii, bringing brood stock into spawning condition, domestication of wild fish in aquaculture, administering minerals, vitamins and medication, providing a balanced diet. Examples of live feeds that are often used include: Microbes, microalgae, infusoria, rotifers, artemia, copepods, and cladocerans. We therefore need to use live feeds to fill the full set of requirements of an aquaculture diet by
overcoming the shortcomings of artificial feeds.This is possible because
www.ijmer.in 1

INTERNATIONAL JOURNAL OF MULTIDISCIPLINARY EDUCATIONAL RESEARCH
ISSN : 2277-7881; IMPACT FACTOR – 4.527; IC VALUE:5.16; ISI VALUE:2.286 VOLUME 6, ISSUE 8(2), AUGUST 2017
live feeds offer a number of distinct advantages, such as: suitable first feed for many species of larvae and nauplii, bringing brood stock into spawning condition, domestication of wild fish in aquaculture, administering minerals, vitamins and medication, providing a balanced diet.
Key words: Live feed, Phytoplankton, Zooplankton
Introduction:
Live food organisms include all plants (phytoplankton) and animal (zooplankton) lives grazed upon by economically important fishes. Phytoplanktons are generally eaten by zooplankton. Thus,
phytoplankton forms the basis of the food chain. Live foods are able to swim in water column and are constantly available to fish and shellfish larvae are likely to stimulate larval feeding response [1] (David, 2003). In an aquatic ecosystem, these live food organisms constitute the most valuable resource for aquaculture. Most of the fish and shellfish larvae in nature feed on small phytoplanktonic and zooplanktonic organisms. However, natural fish food organisms are usually not abundant in clear pond water, but are abundant in ponds having greenish water. The green colour indicates the presence of phytoplankton and other natural food organisms. In the natural food web, zooplankton constitutes a major part of the diet for marine fish larvae and it is generally believed that copepods can meet the nutritional requirements of fish larvae (Evjemo et al., 2003).
Artificial larval feeds are no match to live food organisms in terms of acceptance, nutritional and other factors. Feeding habit of fishes in
natural water bodies is different among the species but all the fishes require protein rich live food for their better growth, efficient breeding and survival (Mandal et al., 2009). Advances in live food enrichment technique have helped to boost the importance and potential of live food organisms in the raising of larval aquatic species. The success in
www.ijmer.in 2

INTERNATIONAL JOURNAL OF MULTIDISCIPLINARY EDUCATIONAL RESEARCH
ISSN : 2277-7881; IMPACT FACTOR – 4.527; IC VALUE:5.16; ISI VALUE:2.286 VOLUME 6, ISSUE 8(2), AUGUST 2017
the hatchery production of fish fingerlings for stocking in the grow-out production system is largely dependent on the availability of suitable live food for feeding fish larvae, fry and fingerlings (Lim et al., 2003). The availability of large quantities of live foods organisms such as marine rotifer (Brachionus plicatilis and Brachionus rotundiformis) and Artemia nauplii to meet the different 5 70 Frontiers in
Aquaculture stages of fry production has contributed to the successful fry production of at least 60 marine finfish species and 18 species of crustaceans (Dhert, 1996). A common procedure during the culture of both larvae of fish and prawns is to add microalgae (i.e. “green water”) to intensive culture systems together with the zooplankton prey (Tamaru et al., 1994), has become popular practice these days.
Live food organisms contain all the nutrients such as essential proteins, lipids, carbohydrates, vitamins, minerals, amino acids and fatty acids (New, 1998) and hence are commonly known as “living capsules of nutrition”. Providing appropriate live food at proper time play a major role in achieving maximum growth and survival of the young ones of finfish and shellfish. To achieve maximum production and profitability, the nutritional components of natural foods must be identified and quantified. Nutritional status of live food organisms can improve through various techniques of enrichment and bioencapsulation. It is
obviously agreed that the production of live food organisms continues to be a very important first step in intensification of aquaculture, both horizontally as well as vertically.
Importance of live food organisms in aquaculture:
Success of aquaculture depends on healthy cultured stock. A disease free healthy stock can be maintained by feeding live food to the cultured stock along with supplemented artificial feed. Supplemented artificial feed can not meet all the elements required for the growth of fish. So, fish and shellfish must be fed with live food. For getting good
www.ijmer.in 3
INTERNATIONAL JOURNAL OF MULTIDISCIPLINARY EDUCATIONAL RESEARCH
ISSN : 2277-7881; IMPACT FACTOR – 4.527; IC VALUE:5.16; ISI VALUE:2.286 VOLUME 6, ISSUE 8(2), AUGUST 2017
return from rearing of larvae of fish and shellfish they should be fed with nutrient rich diet. Larval rearing is one of the riskiest phases of aquaculture, but it could be one of the most profitable venture. Special planning and strategies are required to overcome the risk of high mortality during this phase of culture. Zooplankton is required as a first food for many cultured fish; for others it contributes to faster
growth and higher survival. Larvae of fish and shellfish cannot feed artificial supplemented feed. They require small size live foods for their nutrition. Live foods are easily digestible protein rich diet for fish and shellfish. These live foods can be purchased from the market, which is costly and may not be available as and when required. It will also increase the production cost. But these live foods can be cultured easily and economically. Live foods include both phytoplanktonic as well as zooplanktonic organisms. Phytoplankton consist of chlorophyll bearing organisms e.g. Microcystis, Volvox, Eudorina, Oscillatoria, etc. and non photosynthetic plants or saproplankton e.g. bacteria and fungi, where as zooplankton comprise plankters of animal origin. In the tropical areas it mainly comprises protozoans (e.g. Arcella sp., Difflugia sp., Actinophrys sp., Vorticella sp. etc.), rotifers (e.g. Brachionus spp., Keratella sp., Asplanchna brightwelli, Polyarthra vulgaris, Filinia opoliensis etc.) and the planktonic forms of crustaceans (Artemia spp.,),
cladoceran (Moina spp., Daphnia spp., Ceriodaphnia sp. etc.), ostracoda (Cypris, Stenocypris, Eucypris etc.) and copepods (Mesocyclpos leuckarti, M. hyalinus, Microcyclops varicans, Heliodiaptomus viduus, etc.) and their larvae.The larvae and fry of many fish species, especially marine fish, are too small to eat artificial feed and would starve without live feeds. Furthermore, live feeds provide the essential digestive microbes that certain species require to activate their digestive tracts when they first start feeding. Broodstock that have plenty of appropriate live feeds in their diet are most likely to spawn successfully, have larger batches of eggs and the eggs result in larger
www.ijmer.in 4

INTERNATIONAL JOURNAL OF MULTIDISCIPLINARY EDUCATIONAL RESEARCH
ISSN : 2277-7881; IMPACT FACTOR – 4.527; IC VALUE:5.16; ISI VALUE:2.286 VOLUME 6, ISSUE 8(2), AUGUST 2017
fry when compared to broodfish that are fed exclusively on artificial feeds. Live feeds are essentially any feed that is not processed to a significant degree. It is usually fed alive or whole, but may be chopped up, blanched, cooked or frozen.
Some valuable Live Feeds:
1. Microbes
Yeast can be directly used as a primary food source for many larvae but it is mainly used as a feed for zooplankton which is grown for use in larviculture. It is an important ingredient in artificial larval diets. Yeast has also been evaluated as supplement or replacement for algae in the
feeding of post larval penaeid shrimps.
2. Micro algae
Algae are chlorophyll bearing unicellular or multi-cellular plants. When multi-cellular, they may be colonial or filamentous. Most of them are aquatic. Besides chlorophyll, they also show various carotenoid pigments which impart different colours to them. According to the nature of photosynthetic pigments, algae are further classified into three divisions such as Chlorophyta (green algae), Phaeophyta (brown algae) and Rhodophyta (red algae). Brown and red algae are mostly marine forms while green algae i.e. Chlorophyta is mostly freshwater and free floating type. Brown algae contain iodine and algin. Some red algae are the source of agar jelly, used in the preparation of ice creams and culture media. Chlorophyta (green algae) serve as initial food producers and the first link in the aquatic food chain, both in freshwater and marine ecosystems.
The use of micro algae as a possible source of protein food was
recognized by the researchers in mid-20th century. In the beginning, the main attention had been given on the production of single cell protein for human consumption. Later on, however, many new applications
www.ijmer.in 5

INTERNATIONAL JOURNAL OF MULTIDISCIPLINARY EDUCATIONAL RESEARCH
ISSN : 2277-7881; IMPACT FACTOR – 4.527; IC VALUE:5.16; ISI VALUE:2.286 VOLUME 6, ISSUE 8(2), AUGUST 2017
came to be recognized viz. wastewater treatment, nutrient recycling, bioconservation of solar energy, etc. In recent years, mass culture of unicellular algae such as diatoms (viz. Chaetoceros and Skeletonema) and small phytoplankters (viz. Isochrysis, Tetraselmis and Chlorella) is becoming quite popular for feeding larvae of fishes, prawns, shrimps and molluscs in aqua hatcheries.
Fig. 1. Photomicrographs of two popular species of microalgae
commonly cultured in bivalve hatcheries. A) Isochrysis sp. (4–6 μm x 3–5 μm, and B) Tetraselmis sp. (14–20 μm x 8–12 μm) (Helm et al., 2004).
3. Infusoria:
Infusoria refers to microscopic single celled animalcules belonging to the class - Ciliata of phylum - Protozoa. Besides being small in size, they are soft bodied and nutritionally very rich and therefore, serve ideally as starter diet for early stages of fish larvae. In the early development stages of fish larvae, infusoria or small live organisms are
indispensable (Zableckis, 1998). Paramoecium and Stylonychia are the most common forms of freshwater infusoria while Fabrea and Euplotes are of marine ones.
www.ijmer.in 6

INTERNATIONAL JOURNAL OF MULTIDISCIPLINARY EDUCATIONAL RESEARCH
ISSN : 2277-7881; IMPACT FACTOR – 4.527; IC VALUE:5.16; ISI VALUE:2.286 VOLUME 6, ISSUE 8(2), AUGUST 2017
Fig. 2. Infusoria (Marine Water)
4. Rotifers:
Rotifers are popularly called as wheel animalcules. They are an important group of live food organisms for use in aqua hatcheries. Brachionus, which is the most known form of all rotifers, serve as an ideal starter diet for early larval stages of many fish and prawn species in marine as well as freshwater. Species of the genus Brachionus
(Brachionidae: Rotifera) are well represented in different water bodies worldwide (Pejler, 1977). Depending on the mouth size of the cultured organisms, small (50 to 110 micron length) or large (100 to 200 micron length) rotifers are used. There are about 2,500 species of rotifers have been known from global freshwater, brackish water, and seawater. B. plicatilis is the species used most commonly to feed fish larvae in hatcheries around the world. It is a euryhaline species, small and slow swimming, with good nutritional value. It is well suited to mass culture because it is prolific and tolerates a wide variety of environmental
conditions. The rotifer, B. plicatilis and B. rotundiformis, have been indispensable as a live food for mass larval rearing of many aquatic organisms (Maruyama et al., 1997). By way of significant developments in larval rearing technology of fishes, demand for the rotifer is further increasing.
www.ijmer.in 7

INTERNATIONAL JOURNAL OF MULTIDISCIPLINARY EDUCATIONAL RESEARCH
ISSN : 2277-7881; IMPACT FACTOR – 4.527; IC VALUE:5.16; ISI VALUE:2.286 VOLUME 6, ISSUE 8(2), AUGUST 2017
Fig. 3.Anatomy of B.plicatilis
5. Artemia:
Artemia commonly known as brine shrimp are zooplankton, like
copepods and Daphnia,which are used as live food in the aquarium trade and for marine finfish and crustacean larval culture. There are more than 50 geographical strains of Artemia has been identified. Many commercial harvesters and distributors sell brands of various qualities. Approximately 90 % of the world’s commercial harvest of brine shrimp cysts (the dormant stage) comes from the Great Salt Lake in Utah. Normally 2,00,000 to 3,00,000 nauplii are hatched fromeach gram of high quality cysts (Treece, 2000).
Fig. 4. Life cycle of artemia
www.ijmer.in 8
INTERNATIONAL JOURNAL OF MULTIDISCIPLINARY EDUCATIONAL RESEARCH
ISSN : 2277-7881; IMPACT FACTOR – 4.527; IC VALUE:5.16; ISI VALUE:2.286 VOLUME 6, ISSUE 8(2), AUGUST 2017
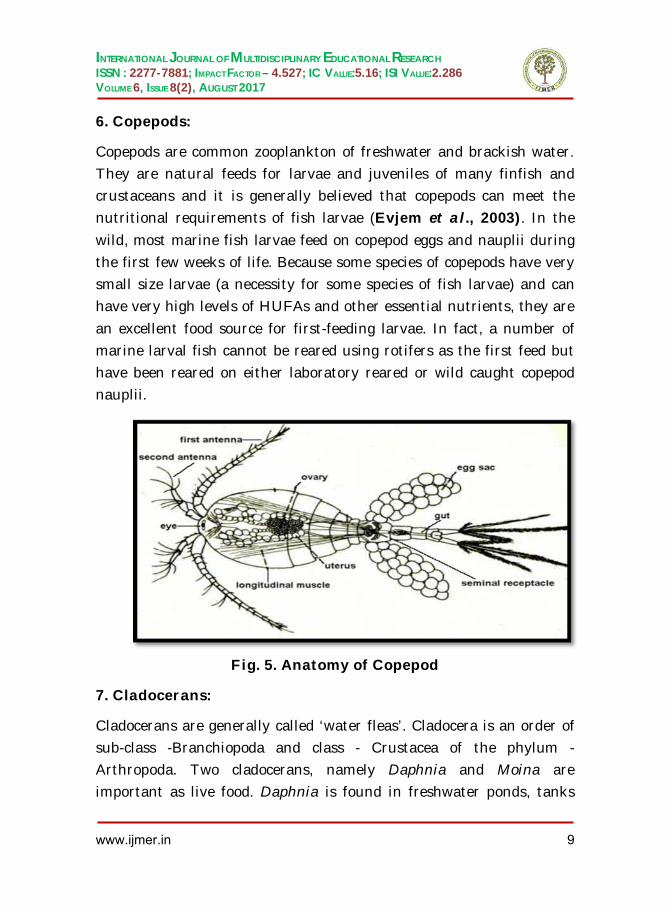
6. Copepods:
Copepods are common zooplankton of freshwater and brackish water. They are natural feeds for larvae and juveniles of many finfish and crustaceans and it is generally believed that copepods can meet the nutritional requirements of fish larvae (Evjem et al., 2003). In the
wild, most marine fish larvae feed on copepod eggs and nauplii during the first few weeks of life. Because some species of copepods have very small size larvae (a necessity for some species of fish larvae) and can have very high levels of HUFAs and other essential nutrients, they are
an excellent food source for first-feeding larvae. In fact, a number of marine larval fish cannot be reared using rotifers as the first feed but have been reared on either laboratory reared or wild caught copepod nauplii.
Fig. 5. Anatomy of Copepod
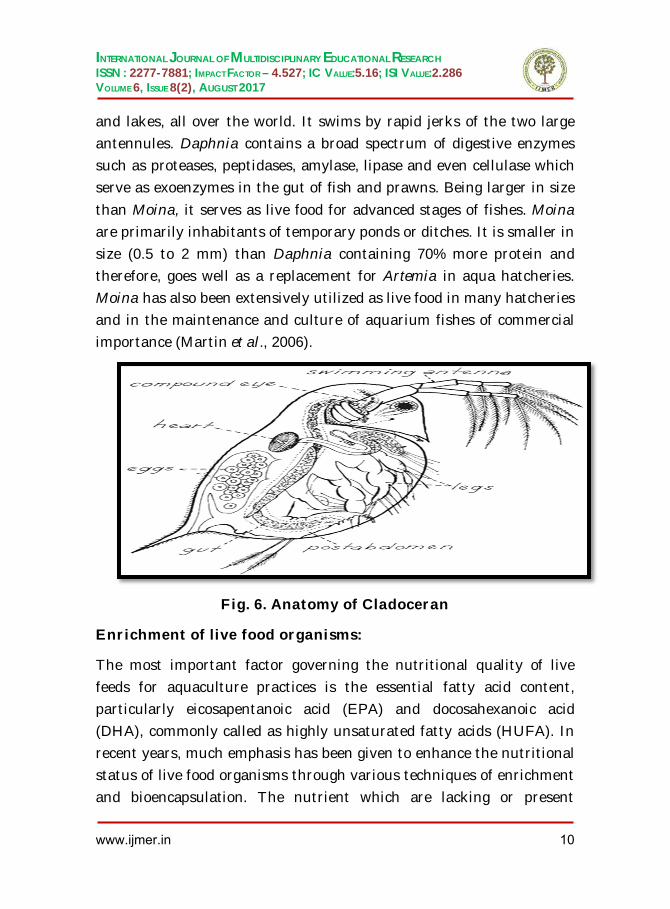
7. Cladocerans:
Cladocerans are generally called ‘water fleas’. Cladocera is an order of sub-class -Branchiopoda and class - Crustacea of the phylum - Arthropoda. Two cladocerans, namely Daphnia and Moina are important as live food. Daphnia is found in freshwater ponds, tanks
www.ijmer.in 9
INTERNATIONAL JOURNAL OF MULTIDISCIPLINARY EDUCATIONAL RESEARCH
ISSN : 2277-7881; IMPACT FACTOR – 4.527; IC VALUE:5.16; ISI VALUE:2.286 VOLUME 6, ISSUE 8(2), AUGUST 2017
and lakes, all over the world. It swims by rapid jerks of the two large antennules. Daphnia contains a broad spectrum of digestive enzymes such as proteases, peptidases, amylase, lipase and even cellulase which serve as exoenzymes in the gut of fish and prawns. Being larger in size
than Moina, it serves as live food for advanced stages of fishes. Moina are primarily inhabitants of temporary ponds or ditches. It is smaller in size (0.5 to 2 mm) than Daphnia containing 70% more protein and therefore, goes well as a replacement for Artemia in aqua hatcheries. Moina has also been extensively utilized as live food in many hatcheries and in the maintenance and culture of aquarium fishes of commercial importance (Martin et al., 2006).
Fig. 6. Anatomy of Cladoceran
Enrichment of live food organisms:
The most important factor governing the nutritional quality of live feeds for aquaculture practices is the essential fatty acid content, particularly eicosapentanoic acid (EPA) and docosahexanoic acid (DHA), commonly called as highly unsaturated fatty acids (HUFA). In recent years, much emphasis has been given to enhance the nutritional status of live food organisms through various techniques of enrichment and bioencapsulation. The nutrient which are lacking or present
www.ijmer.in 10

INTERNATIONAL JOURNAL OF MULTIDISCIPLINARY EDUCATIONAL RESEARCH
ISSN : 2277-7881; IMPACT FACTOR – 4.527; IC VALUE:5.16; ISI VALUE:2.286 VOLUME 6, ISSUE 8(2), AUGUST 2017
insufficiently in food organisms can be made available by allowing them to grow for a defined period in a medium containing appropriate quantities of the required nutrients. Today, various kinds of micro particulate and emulsified formulations are used for boosting these live foods with essential fatty acids and other crucial components, including pigment and vitamins.
Major constrains in live feed culture:
Considering several factors, live feed remains the most practical
solution for larval rearing for aquaculture species. However, it is not easy to maintain a steady supply of adequate quantities of live feed at appropriate times in intensive culture systems. Among the constraints of micro algae production the primary one is its cost of production, especially in smaller hatcheries. Difficulties in getting pure strain, lack of infrastructure facility like controlled environmental laboratory for culture maintenance etc. are some other prime areas of concern. Live feed also act as a carrier of diseases to the larvae of fish and shellfish, therefore, maintenance of hygiene is very important during their production. The new technology of enrichment process is a costly affair for poor and medium level farmers. Similarly, the high infrastructure and labour requirement along with the variable cost for live feed production illustrates the need to develop suitable modified culture technology. Although several strains of artemia are available in India, selection and suitabilityof the available strains are of major concern
and hence the aqua hatcheries are moredependent on imported cysts. Nutritional status of the live feed organisms needs to be summarised for feeding different larval stages of fish and shellfish. Therefore, more research thrust should be given on suitability of many of the available live food organisms.
www.ijmer.in 11

INTERNATIONAL JOURNAL OF MULTIDISCIPLINARY EDUCATIONAL RESEARCH
ISSN : 2277-7881; IMPACT FACTOR – 4.527; IC VALUE:5.16; ISI VALUE:2.286 VOLUME 6, ISSUE 8(2), AUGUST 2017
Future prospects:
A good selection of micro algal species is available to support the aquaculture industry. However for some particular applications for industry sectors, new species with improved nutritional quality or growth characteristics could improve hatchery efficiency. The use of microalgae either as a full or partial enrichment should be considered for improving the nutritional quality of zooplankton.
Conclusion:
The high cost of Artemia cysts has increased fish production costs and
cheaper alternative diets with similar nutritional quality needed to be maintain the cost competitiveness of the fish in the global market. The industrial development of aquaculture has been hampered by the lack of suitable live feeds for feeding the fish at their various production stages. Here an attempt has been made to make aware about the recent developments in the applications of several live food organisms in intensive culture of fish and shellfish. The availability of on-grown live food would not only offer farmers and exporters a better alternative option for feeding to their fish, but more importantly, the possibility of enhancing the fish performance and quality through bio encapsulation.
References
Barreiro R, Picado L, Real C (2002). Biomonitoring of heavy metals in estuaries: a field comparison of two brown algae species inhabiting upper estuarine reaches. Environ. Monit. Assess. 75, 121 - 134.
Bocanegra A, Bastida S, Benedi J, Rodenas S, Sanchez F. J. – Muniz (2009). Characteristics nutritional and cardiovascular health properties of seaweeds. J Med Food. 12, 236 – 256.
Bowen B.J.M. Environmental chemistry of the elements. Academic press, London (14979) pp 333.
Burtin P (2003). Nutritional value of seaweeds. Electron J environ Agric Food Chem. 2,
www.ijmer.in 12
INTERNATIONAL JOURNAL OF MULTIDISCIPLINARY EDUCATIONAL RESEARCH
ISSN : 2277-7881; IMPACT FACTOR – 4.527; IC VALUE:5.16; ISI VALUE:2.286 VOLUME 6, ISSUE 8(2), AUGUST 2017
498– 503
Dave H, Rao M.V.S, Tipnis U.K (1969). Iodine content of marine algae from Saurashtra coast. Phykos. 8, 68 - 70.
Dawczynski C, Schafer U, Leituer M, Jahreis G (2007) . Nutritional toxicological importance of macro trace and ultra trace elements in algal food products. J Agric Food chem. 55, 10470– 10475.
Devi G.K, Thirumaran G, Manivasan K., P. Anantharaman K (2009). Elemental composition of certain seaweeds from Gulf of Mannar Marine biosphere reserve, southeast coast of India. World J Dairy Food Sci. 4, 46 – 55.
Dhargalkar V.K (2014). Uses of seaweed in the Indian diet for sustenance and wellbeing. Science and Culture. 80, 192 – 202.
El-din N.G.S, El- Sherif Z.M (2012). Nutritional value of some algae from north western Mediterranean coast of Egypt. J Appl Phycol. 24, 613 – 626.
Ensminger A.H, Ensminger M.E, Konlande J.E, Robson J.R.K (1995). The concise encyclopedia of foods and nutrition, CRC Press Boca Raton, Florida.
Eppley R.W, Major cations. In: Physiology and biochemistry of algae. R. A Lewin (ed.) (1962). Academic press, New York, pp 255 – 278.
Ganesan M, Kannan L (1995). Iron and manganese concentrations in seawater, sediment and marine algae of Tuticorin coast, southeast coast of India. Indian J. Mar. Sci. 24, 236 - 237.
Home R.A (1969). Marine Chemistry, John Wiley and sons Inc., New York, USA pp. 568.
Ito K, Hori K (1989). Seaweed chemical composition and potential uses. Food Review International 5, 101 – 144.
Kaliaperumal N, Chennubhotla V.S.K, Kalimuthu S, Ramlingam J.R, Selvaraj M, Najmudd M (1987). Chemical composition of seaweeds. CMFRI Bulletin 41, 31 – 51.
Karez C.S, Magadhaes V. F, Pfeiffer W. C and Filho G.M.A(1994). Trace metal accumulation by algae in Sepetiba Bay, Brazil. Environ. Pallut. 83, 351 - 356.
www.ijmer.in 13

INTERNATIONAL JOURNAL OF MULTIDISCIPLINARY EDUCATIONAL RESEARCH
ISSN : 2277-7881; IMPACT FACTOR – 4.527; IC VALUE:5.16; ISI VALUE:2.286 VOLUME 6, ISSUE 8(2), AUGUST 2017
Kesava Rao Ch, Singbal S Y S (1996). Seasonal variations in Na, K, Mg
and Ca and charge balance in marine brown algae from Saurashtra coast (NW coast of India). Indian J Mar Sci. 25, 41 – 45.
Kesava Rao Ch, Singbal S Y. S (1995). Seasonal variations in halides in marine brown algae from Porbandar and Okha coasts (NW coast of India). Indian J. Mar. Sci. 24,
137 – 141.
Kitagishi K, Obata H (1981). Accumulation of heavy metals in rice grains. In: Kitagishi K, Yamane I. (eds) Heavy metal pollution in soils of Japan. Japan Sci. Soc. Press, Tokyo pp 95–104
Mabeau S, Fleurence J (1993). Seaweed in food products: Biochemical and nutritional aspects. Trends Food Sci technol. 4, 103- 107.
Matanjun P, Mohmed S, Mustafa N.M, Muhammad K, Cheng H.W (2008).Antioxidant activities and phenolic content of eight species of seaweeds from north Borneo. J Appl Phycol., 20, 367- 373.
Mineral composition of edible seaweed Porphyra vietnamensis. Food Chemistry 102 (2007) 215–218..
Nazni P, Renuga (2014). Mineral composition of selected brown seaweed from Mandapam, Gulf of Mannar region,Tamil Nadu. Int J Res Mar Sci., 4, 1 -5.
Rao I. M, Murty M V, Satyanarayana D (1995). Trace metal distribution in marine algae of Visakhapatnam, east coast of India. Indian J. Mar. Sci. 24, 142 - 146.
Rizvi M A, Shameel M (2001). Distribution of elements in marine algae of Karachi coast. Pak J Bot., 33, 357- 363.
Ruperez P (2002). Mineral content of edible marine seaweed. Food chem., 79, 23- 26.
Saenko G N, Y Y. Kravtsova, V. V. Ivanenk, S I. Sheludko (1978). Concentration of iodine and bromine by plants in the Seas of Japan and Okhotsk. Mar. Biol. 47, 243 - 250.
Sarojini Y, Lakshmiinarayan K (2012).High performance liquid chromatographic determination of B-complex
www.ijmer.in 14

INTERNATIONAL JOURNAL OF MULTIDISCIPLINARY EDUCATIONAL RESEARCH
ISSN : 2277-7881; IMPACT FACTOR – 4.527; IC VALUE:5.16; ISI VALUE:2.286 VOLUME 6, ISSUE 8(2), AUGUST 2017
vitamins in some seaweeds of Visakhapatnam coast. Seaweed Res Utiln. 34, 52 – 59.
Sarojini Y, Lakshminarayana K (2011a). Distribution of vitamin A content in some seaweeds of Visakhapatnam coast. Seaweed Res Utiln. 33, 35 – 37.
Sarojini Y, Lakshminarayana K (2011b). High performance liquid chromatographic determination of vitamin - D and E from seaweeds of Visakhapatnam coast, Andhra Pradesh. Seaweed Res Utiln. 39, 39 – 44.
Sarojini Y, Lakshminarayana K (2009). Mineral contents in some green seaweeds of Visakhapatnam coast. Seaweed Res Utiln. 31, 145-150.
Sarojini Y, Sarma N.S (1999). Vitamin C content of macroalgae of Visakhapatnam, east coast of India. Indian J Mar Sci. 28, 408-412.
Sarojini Y, Sujatha B, Lakshm P (2016). The distribution and seasonal variations in vitamin - E content among the three species of marine macroalgae of Visakhapatnam, east coast of India. Int J Curr Sci. 19, E 29-38.
Sarojini Y, Uma Devi K (2014) .The marine macro algae as potential source of nutritionally important polyunsaturated fatty acids. Der Pharmacia Lettre 6, 348 – 351.
Subba Rao P.V, Mantri V.A, Ganesan M (2006). Mineral composition of edible seaweed Porphyra vietnamensis. Food Chem. 102, 215 -218.
Teas J, Pino S, Critchlev A, Braverman L. E (2004). Variability of iodine content in common commercially available seaweeds. Thyroid, 14, 836 -841.
Umamaheswara Rao M, Sree Ramulu T (1970). An annotated list of marine algae Visakhapatnam (India).. Bot J Linn Soc., 3, 23-45.
Venkateshwarlu P, Raman D, Vijay M (2014).Atomic absorption spectroscopic determination and comparison of trace elements in the seaweeds. International Journal of Modern Chemistry and Applied Science 1, 5 – 10.
www.ijmer.in 15

INTERNATIONAL JOURNAL OF MULTIDISCIPLINARY EDUCATIONAL RESEARCH
ISSN : 2277-7881; IMPACT FACTOR – 4.527; IC VALUE:5.16; ISI VALUE:2.286 VOLUME 6, ISSUE 8(2), AUGUST 2017
Vijayan P U H, George G, Mathew I (2016). Phytochemical estimation
and mineral analysis of selected brown seaweeds from Mulloor coast, Kerala. Seaweed Res Utiln. 389, 29 – 34.
Vinogradov A.P (1953). The elementary chemical composition of marine organisms, Sears Foundation for Marine Research, Yale University, New Haven , pp. 68.
Yamamoto T, Otsuka Y, Aoyama K, Okamoto K (1984). Character of each element in its distribution in seaweeds. Hydrobiologia 116/117, 510 – 512.
www.ijmer.in 16

INTERNATIONAL JOURNAL OF MULTIDISCIPLINARY EDUCATIONAL RESEARCH
ISSN : 2277-7881; IMPACT FACTOR – 4.527; IC VALUE:5.16; ISI VALUE:2.286 VOLUME 6, ISSUE 8(2), AUGUST 2017
ROLE OF PROBIOTICS AS BIO-CONTROLLING
AGENTS IN AQUACULTURE-A REVIEW
K. Manikya Kumari Head, Department of Botany & Biotechnology
St. Joseph’s College for Women (A) Visakhapatnam
ABSTRACT
Probiotics are harmless bacteria and other microorganisms which improve the water quality of aquaculture, and inhibit the pathogens in water thereby increase production. In addition, the use of probiotics can increase the population of food organisms, improve the nutrition level of aqua-cultural animals and improve their immunity to
pathogenic microorganisms. Disease outbreaks are being increasingly recognized as a significant constraint on aquaculture production and trade, affecting the economic development of the sector in many countries. There is an urgent need in aquaculture to develop microbial control strategies, since the development of antibiotic resistance has become a matter of growing concern. One of the alternatives to antimicrobials in disease control could be the use of probiotic bacteria as microbial control agents, an environment – friendly sustainable aquaculture practice. Recently, the biocontrolling in aquaculture is utilizing many probiotics to regulate the micro flora, control pathogenic microorganisms, to enhance decomposition of the undesirable organic substances in aquaculture water, and improve its ecological environment. In addition, the use of antibiotics and chemicals can be reduced and frequent outbreaks of diseases can be prevented. They
enhance the ability of stress resistance and health of the larvae. The studies show that the use of probiotics in aquaculture facilities can be an effective method to prevent disease outbreaks caused by pathogens in hatcheries. This review focuses on the advantages of probiotics in different aquaculture products and live food and their possible modes of
www.ijmer.in 17

INTERNATIONAL JOURNAL OF MULTIDISCIPLINARY EDUCATIONAL RESEARCH
ISSN : 2277-7881; IMPACT FACTOR – 4.527; IC VALUE:5.16; ISI VALUE:2.286 VOLUME 6, ISSUE 8(2), AUGUST 2017
action. The benefits of such supplements include improved feed value, enzymatic contribution to digestion, production of compounds that are inhibitory toward pathogens, competition with harmful microorganisms for nutrients and energy, competition with deleterious species for adhesion sites, enhancement of the immune response of the animal,
improvement of water quality, and interaction with phytoplankton.
Keywords: Aquaculture, Probiotics, Disease, Bio-control, Water
quality, Immunity
1. Introduction
Aquaculture is the farming of aquatic organisms to enhance production. Compared to fishing, this activity allows a selective increase in the production of species used for human consumption and industry. Aquaculture's contribution to world food production, raw materials for industrial and pharmaceutical use, and aquatic organisms for stocking or ornamental trade has increased dramatically in recent decades. The report World Aquaculture 2012 found that global production of fish from aquaculture grew more than 30 percent between 2006 and 2011, from 47.3 million tons to 63.6 million tons. It also forecasts that in future more than 50 percent of the world's food fish consumption will come from aquaculture
Outbreaks of viral, bacterial, and fungal infections have caused devastating economic losses in aquaculture worldwide. Added to this, significant stock mortality has been reported due to poor
environmental conditions on farms, unbalanced nutrition, generation of toxins, and genetic factors (Kautsky et al., 2000). In recent decades, prevention and control of animal diseases has focused on the use of chemical additives, especially antibiotics, which generate significant risks to public health by promoting the selection, propagation, and persistence of bacterial-resistant strains (OIE/WHO FAO, 2006). It was suggested that bacteria would be found to be useful not only as food but
www.ijmer.in 18

INTERNATIONAL JOURNAL OF MULTIDISCIPLINARY EDUCATIONAL RESEARCH
ISSN : 2277-7881; IMPACT FACTOR – 4.527; IC VALUE:5.16; ISI VALUE:2.286 VOLUME 6, ISSUE 8(2), AUGUST 2017
also as biological controllers of fish disease and activators of nutrient regeneration.
2. Probiotics as Biocontroling agents
Probiotics are harmless bacteria and other microorganisms which improve the water quality of aquaculture, and inhibit the pathogens in water thereby increase production. In addition, the use of probiotics can increase the population of food organisms, improve the nutrition
level of aqua-cultural animals and improve their immunity to pathogenic microorganisms. Disease outbreaks are being increasingly recognized as a significant constraint on aquaculture production and trade, affecting the economic development of the sector in many countries. There is an urgent need in aquaculture to develop microbial control strategies, since the development of antibiotic resistance has become a matter of growing concern. One of the alternatives to antimicrobials in disease control could be the use of probiotic bacteria as microbial control agents, an environment – friendly sustainable aquaculture practice. Recently, the biocontrolling in aquaculture is utilizing many probiotics to regulate the micro flora, control pathogenic microorganisms, to enhance decomposition of the undesirable organic substances in aquaculture water, and improve its ecological environment. In addition, the use of antibiotics and chemicals can be
reduced and frequent outbreaks of diseases can be prevented. They enhance the ability of stress resistance and health of the larvae. The studies show that the use of probiotics in aquaculture facilities can be an effective method to prevent disease outbreaks caused by pathogens in hatcheries.
Probiotic is a relatively new term which is used to name microorganisms that are associated with the beneficial effects for the host. Certain probiotics have the ability to inhibit the growth of pathogenic bacteria. Generally, probiotics are applied in the feed or
www.ijmer.in 19

INTERNATIONAL JOURNAL OF MULTIDISCIPLINARY EDUCATIONAL RESEARCH
ISSN : 2277-7881; IMPACT FACTOR – 4.527; IC VALUE:5.16; ISI VALUE:2.286 VOLUME 6, ISSUE 8(2), AUGUST 2017
added to the culture tank or pond as preventive agents against infection by pathogenic bacteria, although nutritional effects are also often attributed to probiotics, especially for filter feeders. Most probiotics proposed as biological control agents in aquaculture belong to the lactic acid bacteria (Lactobacillus, Carnobacterium, etc.), to the genus Vibrio
(Vibrio alginolyticus, etc.), to the genus Bacillus, or to the genus Pseudomonas, although other genera or species have also been mentioned. Probiotics ability to stimulate appetite, improve absorption of nutrients, and strengthen the host immune system was determined (Wang et al., 2008). Following are some of the biocontroling methods against aquaculture pathogens using probiotics.
2. 1. Probiotic Inhibition of Pathogens
Antibiotics were used for a long time in aquaculture to prevent
diseases in the crop. However, this caused various problems such as the presence of antibiotic residues in animal tissues, the generation of bacterial resistance mechanisms, as well as an imbalance in the gastrointestinal microbiota of aquatic species, which affected their health. Today, consumers demand natural products, free of additives such as antibiotics; moreover, there is a tendency for preventing diseases rather than treating them. Thus, the use of probiotics is a viable alternative for the inhibition of pathogens and disease control in aquaculture species (Nakano, 2007). Probiotics have been used in aquaculture to increase the growth of cultivated species. Probiotic microorganisms have the ability to release chemical substances with bactericidal or bacteriostatic effect on pathogenic bacteria that are in the intestine of the host, thus constituting a barrier against the proliferation of opportunistic pathogens. In general, the antibacterial effect is due to one or more of the following factors: production of
antibiotics, bacteriocins, siderophores, enzymes (lysozymes, proteases) and/or hydrogen peroxide, as well as alteration of the intestinal pH due to the generation of organic acids (Verschuere et al., 2000).
www.ijmer.in 20

INTERNATIONAL JOURNAL OF MULTIDISCIPLINARY EDUCATIONAL RESEARCH
ISSN : 2277-7881; IMPACT FACTOR – 4.527; IC VALUE:5.16; ISI VALUE:2.286 VOLUME 6, ISSUE 8(2), AUGUST 2017
Viable probiotics administered to tilapia Oreochromis niloticus,
increased non-specific immune response, determined by parameters such as lysozyme activity, neutrophile migration, and bactericidal
activity, which improved the resistance of fish to infection by Edwardsiella tarda (Taoka et al., 2006). In turn, isolated a strain of Carnobacterium sp. from salmon bowel and administered alive to rainbow trout and Atlantic salmon, demonstrating in vitro antagonism against known fish pathogens: Aeromonas hydrophila, A. salmonicida, Flavobacterium psychrophilum, Photobacterium damselae, and Vibrio
species ( Robertson, et al., 2000). There is also evidence on the effect of dead probiotic cultures consisting on a mixture of Vibrio fluvialis A3-47S, Aeromonas hydrophila A3-51, and Carnobacterium BA211, in the control of furunculosis in rainbow trout improving the cellular immunity (Irianto and Austin, 2003). In the case of shrimp, studies have focused on the evaluation of probiotics such as Bacillus cereus,
Paenibacillus polymyxa, and Pseudomonas sp. PS-102 as biocontrol agents against pathogens of various Vibrio species (Ravi et al., 2007).
Probiotic strains isolated from the gastrointestinal tract of clownfish (Amphiprion percula) have been used to inactivate several pathogens such as Aeromonas hydrophila and Vibrio alginolyticus
among others. It has been observed that probiotics in vivo generate a density such that allow the production of antimicrobial metabolites therefore, the bacteria isolated from adult clownfish have the potential to colonize the intestinal mucus and therefore can be used as prophylactic agent and/or therapeutic (Vine et al., 2005). Furthermore, probiotics promote the development of healthy microbiota in the gastrointestinal tract of ornamental fishes from the genera Poecilia and Xiphophorus (Ghosh et al., 2008).
www.ijmer.in 21

INTERNATIONAL JOURNAL OF MULTIDISCIPLINARY EDUCATIONAL RESEARCH
ISSN : 2277-7881; IMPACT FACTOR – 4.527; IC VALUE:5.16; ISI VALUE:2.286 VOLUME 6, ISSUE 8(2), AUGUST 2017
2. Controlling the microbiota of Fish Eggs and Larvae
Uncontrolled development of the microbial communities in hatcheries is one of the major reasons for the unpredictable and often variable results. There is an urgent need to control the microbiota in hatching incubators by alternative means, since the use of antibiotics has to be minimal. The introduction of microbial control practices by means of probiotics may have a beneficial effect on the cultures in
hatcheries. The screening and pre-selection of potential or putative probiotics should be based on extensive experimental work performed in vivo. The establishment of a normal gut microbiota may be regarded as complementary to the establishment of the digestive system, and under normal conditions it serves as a barrier against invading pathogens. Larvae may ingest substantial amounts of bacteria by grazing on suspended particles and egg debris (Beveridge et al., 1987). It is therefore obvious that the egg microbiota will affect the primary colonization of the fish larvae.
It has been observed that survival of halibut (Hippoglossus
hippoglossus) larvae in the first 2 weeks after hatching is affected by incubation with indigenous bacteria isolated from fish (Olafsen, 1998). Larval survival in the presence of Vibrio salmonicida-like strains and Lactobacillus plantarum amounted to 95%, as compared to the control group (81%).The hypothesis was that the lactic acid bacteria would act as a microbial barrier against the pathogenic Vibrio and might curb the invasion of turbot larvae by the pathogen. Similarly, (García de la
Banda et al.,1992) added lactic acid bacteria (Streptococcus lactis and Lactobacillus bulgaricus) to Brachionus and Artemia used in turbot larva feeding. In a single experiment without replicates, 55% survival was found on day 17 when living lactic acid bacteria had been added and 66% survival was found with disabled ones, as opposed to 34% in the control group. Apparently, the bacterial cells, alive or disabled, provoked improved survival of the turbot larvae.
www.ijmer.in 22

INTERNATIONAL JOURNAL OF MULTIDISCIPLINARY EDUCATIONAL RESEARCH
ISSN : 2277-7881; IMPACT FACTOR – 4.527; IC VALUE:5.16; ISI VALUE:2.286 VOLUME 6, ISSUE 8(2), AUGUST 2017
2.3. Biocontroling in Fish through probiotic feed
In experiments on Atlantic salmon (Salmo salar) fry given a diet supplemented with a lactic acid bacterium related to Lactobacillus
plantarum was challenged with cohabitant fishes infected with Aeromonas salmonicida through intraperitoneal injection. Mortality was recorded during the next 4 weeks. It was shown that lactic acid bacteria given as supplements in the dry feed could colonize the intestine, but no protection against A. salmonicida infection could be detected. Contrary to the expectations, the highest mortality was recorded with fish given the diet containing lactic acid bacteria.Atlantic cod fry fed on dry feed containing lactic acid bacteria (Carnobacterium
divergens) was exposed to a virulent strain of Vibrio anguillarum. An improved disease resistance was obtained, and 3 weeks after the challenge lactic acid bacteria dominated the intestinal microbiota of the surviving fish given feed supplemented with C. divergens (Gildberg et al., 1997).
2.4. Siderophore-producing Probiotics
Attention has also been focused on siderophore production and the probiotic effect of Vibrio type E on turbot larvae. The main effect of
rotifer enrichment with this strain was to improve the survival of the larval turbot after a 48-h challenge with the pathogenic Vibrio type P.
Several strains of siderophore-producing Pseudomonas fluorescens have been successfully applied as biological control agents. They were able to exclude a pathogenic A. salmonicida strain from
Atlantic salmon presmolts with stress-inducible furunculosis infection and to limit the mortality of rainbow trout (40 g) infected with V. anguillarum. Short-term bathing of the fishes in a bacterial suspension of the probiotic, long-term exposure in the rearing water or a combination of the two treatments (Gram et al., 1999). led to a significant decrease in the mortality after the challenge trial. In both
www.ijmer.in 23

INTERNATIONAL JOURNAL OF MULTIDISCIPLINARY EDUCATIONAL RESEARCH
ISSN : 2277-7881; IMPACT FACTOR – 4.527; IC VALUE:5.16; ISI VALUE:2.286 VOLUME 6, ISSUE 8(2), AUGUST 2017
studies, a good correlation was found between the production of siderophores and the protective action of P. fluorescens, suggesting that competition for free iron is involved in the mode of action.
2.5. Biocontroling in shrimps.
The use of a soil bacterial strain, PM-4, that promoted the
growth of Penaeus monodon nauplii, probably acting as a food source. This strain also showed an in vitro inhibitory effect against a V. anguillarum strain. When added to tanks inoculated with diatoms and rotifers, the strain resulted in 57% survival of the larvae after 13 days, while without the bacterium all the larvae had died after 5 days (Maeda, 1994).
A V. alginolyticus strain, which was selected based on its
apparent lack of pathogenicity, was inoculated daily into 25- and 60-ton larval rearing tanks containing Litopenaeus vannamei postlarvae. The average survival and wet weight were higher in the tanks containing shrimps that had undergone bacterial inoculation compared to shrimps receiving prophylactic doses of oxytetracycline and the control group. The use of Bacillus strain S11 as a probiotic administered in enriched Artemia to larvae of the black tiger shrimp (Penaeus monodon). It was found that the P. monodon larvae fed the Bacillus-fortified Artemia had
significantly shorter development times and fewer disease problems than did larvae reared without the Bacillus strain (Garriques and Arevalo, 1995).
2.6. Probiotic biocontrol of pathogens in Crabs & Bivalves
After an inoculation of diatoms and rotifers, the bacterial strain PM-4 was daily introduced for 7 days in 200-m3 tanks containing crab (Portunus trituberculatus) larvae and was also inoculated with diatoms and rotifers. There was a negative correlation between the presence of PM-4 and the densities of Vibrio spp. In seven trials, the average
survival of the crab larvae was 27.2% with strain PM-4. In six of nine
www.ijmer.in 24

INTERNATIONAL JOURNAL OF MULTIDISCIPLINARY EDUCATIONAL RESEARCH
ISSN : 2277-7881; IMPACT FACTOR – 4.527; IC VALUE:5.16; ISI VALUE:2.286 VOLUME 6, ISSUE 8(2), AUGUST 2017
trials without PM-4, no larvae grew into adults, resulting in an average survival of only 6.8%. These results were reported in three independent experiments (Maeda, 1994).
Several studies have focused on the nutritional contribution of probiotics to mollusk larvae; however, no indication was given of their
potential biological control abilities. A bacterial strain isolated from the gonads of Chilean scallop (Argopecten purpuratus) broodstock and characterized as Alteromonas haloplanktis displayed in vitro inhibitory activity against the known pathogens V. ordalii, V. parahaemolyticus, V. anguillarum, V. alginolyticus, and Aeromonas hydrophila (Riquelme et al., 1996). This A. haloplanktis and a Vibrio strain 11 that showed in
vitro inhibition of a V. anguillarum-related pathogen protected the scallop larvae against the V. anguillarum-related pathogen in an experimental infection (Riquelme et al., 1997). Aeromonas media A199 was found to be inhibitory in vitro to 89 strains of aeromonads and Vibrio and could prevent the death of oyster (Crassostrea gigas) larvae
when they were challenged in vivo with Vibrio tubiashii (Gibson et al., 1998). Administration of the probiotic strain to the larvae fed with algae caused a spectacular decrease of the pathogen densities in the larvae compared to those in the larvae treated with V. tubiashii only.
2.7. Unicellular algae as probiotic feed.
Unicellular algae are often given as a first food or are included in the culture system as a food for rotifers and Artemia. Bacteria increase the growth rate and yield of algae. However, since bacteria may also inhibit algal growth careful screening may be necessary when bacteria are to be used as probiotics in larval rearing or in the green-
water technique. Strain SK-05 inoculated it into a Skeletonema costatum culture prevented the proliferation of V. alginolyticus, although it exerted no in vitro inhibitory action against V. alginolyticus. It was suggested that the protective effect was due to
www.ijmer.in 25

INTERNATIONAL JOURNAL OF MULTIDISCIPLINARY EDUCATIONAL RESEARCH
ISSN : 2277-7881; IMPACT FACTOR – 4.527; IC VALUE:5.16; ISI VALUE:2.286 VOLUME 6, ISSUE 8(2), AUGUST 2017
competitive exclusion, since only strain SK-05 was able to utilize the exudates of S. Costatum (Rico-Mora et al., 1998).
2.8. Optimization of probiotic content of Water
Although it is not strictly a probiotic treatment, attempts have been made to optimize the rearing water for larvae of several marine
species by so-called microbial maturation. Microbial maturation of seawater prepared by transient maintenance in a maturation tank with a biofilter led to a significantly higher initial growth rate of turbot larvae than in membrane-filtered water. Proliferation of opportunistic bacteria was observed in the rearing water after hatching of the turbot eggs, but it occurred to a lesser extent in the microbially matured water. Also, clear differences in survival of halibut yolk sac larvae were observed. The experiments supported the hypothesis that microbial maturation selects for nonopportunistic bacteria that protect the marine larvae from the proliferation of detrimental opportunistic bacteria (Skjermo et al., 1997).
2.9. Improvement in Nutrient Digestion
Studies have suggested that probiotics have a beneficial effect on the digestive processes of aquatic animals because probiotic strains
synthesize extracellular enzymes such as proteases, amylases, and lipases as well as provide growth factors such as vitamins, fatty acids, and amino acids Therefore, nutrients are absorbed more efficiently when the feed is supplemented with probiotics (Balcázar et al., 2006). In white shrimp Litopenaeus vannamei Boone and Fenneropenaeus indicus, various strains of Bacillus have been used as probiotics to increase apparent digestibility of dry matter, crude protein, and phosphorus (Rico-Mora et al., 1998).
In guppies (Poecilia reticulata, P. sphenops), and swordtail (Xiphophorus helleri, X. maculatus), the effect of incorporating Bacillus subtilis, isolated from the intestine of Cirrhinus mrigala into their diet
www.ijmer.in 26

INTERNATIONAL JOURNAL OF MULTIDISCIPLINARY EDUCATIONAL RESEARCH
ISSN : 2277-7881; IMPACT FACTOR – 4.527; IC VALUE:5.16; ISI VALUE:2.286 VOLUME 6, ISSUE 8(2), AUGUST 2017
has been evaluated. The results show an increase in the length and weight of the ornamental fishes as well as the specific activity of proteases and amylases in the digestive tract (Ghosh et al., 2008).
Bacillus secretes a wide range of exoenzymes that complement the activities of the fish and increases enzymatic digestion(Ringø and Gatesoupe, 1998). Addition of bacteria to the rearing water of filter feeders such as rotifers, bivalve larvae or adults, and crustacean larvae may result in massive uptake of these bacteria, possibly acting as a food source or contributing to the digestion of the food, even if the main goal of the probiotic application was, e.g., suppression of a pathogen in the culture water.
3. Possible modes of action
The exact modes of action of the probiotics were rarely completely elucidated. Considering the possible probiotic effect in vivo, one has to make a distinction between the intrinsic ability of the strain to positively influence the host and its ability to reach and maintain itself in the location where the effect is to be exerted. For instance, the
production of siderophores or inhibitory compounds in sufficient amounts and even under the conditions prevailing in the gut is of no relevance if the strain is not ingested by the host. This is important, since Prieur (Prieur, 1981) has demonstrated both selective ingestion and digestion of microbes by the bivalve Mytilus edulis. Hence, the possible modes of action require implicitely that the candidate probiotics be able to reach the location where their probiotic effect is required. Those modes are as follows: production of inhibitory compounds; competition for chemicals or available energy; competition for adhesion sites; enhancement of the immune response; improvement of water quality; interaction with phytoplankton; source of macro- and micronutrients; and enzymatic contribution to digestion.
www.ijmer.in 27
INTERNATIONAL JOURNAL OF MULTIDISCIPLINARY EDUCATIONAL RESEARCH
ISSN : 2277-7881; IMPACT FACTOR – 4.527; IC VALUE:5.16; ISI VALUE:2.286 VOLUME 6, ISSUE 8(2), AUGUST 2017
3.1. Production of Inhibitory Compounds
Many studies have demonstrated the presence of bacterial strains showing in vitro inhibition toward pathogens known to occur in aquaculture. Microbial populations may release chemical substances that have a bactericidal or bacteriostatic effect on other microbial populations, and become a barrier against the proliferation of
pathogens.
Lactic acid bacteria are known to produce compounds such as bacteriocins that inhibit the growth of other microorganisms. A large proportion of marine bacteria produced bacteriolytic enzymes against V. parahaemolyticus (Vandenbergh, 1993). Alteromonas sps produces an alkaline protease inhibitor called monastatin. In an in vitro assay, the purified and concentrated monastatin showed inhibitory activity against a protease from Aeromonas hydrophila and a thiol protease from V. anguillarum, both pathogenic to fish.
3.2. Competition for iron
Virtually all microorganisms require iron for growth. Siderophores are low-molecular-weight (<1,500), ferric ion-specific chelating agents which can dissolve precipitated iron and make it available for microbial growth. The ecological significance of siderophores resides in their capacity to scavenge an essential nutrient from the environment and deprive competitors of it. Successful bacterial pathogens are able to compete successfully for iron in the highly iron-stressed environment of the tissues and body fluids of the host (Wooldridge and Williams, 1993). Harmless bacteria which can produce siderophores could be used as probiotics to compete with pathogens whose pathogenicity is known to be due to siderophore production and competition for iron or to outcompete all kind of organisms requiring ferric iron from solution.
www.ijmer.in 28

INTERNATIONAL JOURNAL OF MULTIDISCIPLINARY EDUCATIONAL RESEARCH
ISSN : 2277-7881; IMPACT FACTOR – 4.527; IC VALUE:5.16; ISI VALUE:2.286 VOLUME 6, ISSUE 8(2), AUGUST 2017
3.3. Competition for Adhesion Sites
One possible mechanism for preventing colonization by pathogens is competition for adhesion sites on gut or other tissue surfaces. Adhesion can be nonspecific, based on physicochemical factors, or specific, involving adhesin molecules on the surface of adherent bacteria and receptor molecules on epithelial cells. Probiotics
such as Carnobacterium strain K1 and several isolates are inhibitory to V. anguillarum (Olsson et al., 1992). It is conceivable that bacteria are able to colonize, for example, the intestinal gut wall of a fish and exert their protective action against a pathogen by excreting inhibitory compounds.
3.4. Enhancement of the Immune Response
Immunostimulants are chemical compounds that activate the immune systems of animals and render them more resistant to infections by viruses, bacteria, fungi, and parasites. Fish larvae, shrimps, and other invertebrates have immune systems that are less well developed than adult fish and are dependent primarily on nonspecific immune responses for their resistance to infection.
Bacterial compounds act as an immunostimulant in fish and shrimp. It has also been suggested that ingestion of bacteria and subsequent endocytosis in cod and herring larvae are involved in stimulation of the developing immune system (Olafsen, 1998).
3.5. Improvement of Water Quality
Addition of the probiotics, especially gram-positive Bacillus spp. are generally more efficient in converting organic matter back to CO2 than are gram-negative bacteria, which would convert a greater percentage of organic carbon to bacterial biomass or slime (Stanier et al., 1963). By maintaining higher levels of these gram-positive bacteria
in the production pond, farmers can minimize the buildup of dissolved and particulate organic carbon during the culture cycle while
www.ijmer.in 29

INTERNATIONAL JOURNAL OF MULTIDISCIPLINARY EDUCATIONAL RESEARCH
ISSN : 2277-7881; IMPACT FACTOR – 4.527; IC VALUE:5.16; ISI VALUE:2.286 VOLUME 6, ISSUE 8(2), AUGUST 2017
promoting more stable phytoplankton blooms through the increased production of CO2. A lot of bacterial cultures containing nitrifying bacteria to control the ammonia level in culture water are available commercially. Nitrifiers are responsible for the oxidation of ammonia to nitrite and subsequently to nitrate.
3.6. Interaction with Phytoplankton
Recent reports demonstrate that many bacterial strains may have a significant algicidal effect on many species of microalgae, particularly of red tide plankton. Of 41 bacterial strains tested, 23 inhibited the growth of the unicellular alga Pavlova lutheri to various degrees (Munro et al., 1995). Bacteria antagonistic toward algae would be undesirable in larval rearing where unicellular algae are added (e.g., the green-water technique) but would be advantageous when undesired algal species such as cyanobacteria develop in the culture pond.
4. Conclusions
The health and performances of cultured aquatic species can be improved by the prophylactic use of probiotics. Progress has been made in the culture of live food, crustacea, mollusks, and fish. The use of
probiotics as biological control agents should be considered to be very helpful if infectious diseases break out. There is still a lack of knowledge about the exact modes of action involved in probiotic effects. Also, the interaction between the cultured aquatic species and its associated microbiota deserves further research into possible immunostimulative effects. It stands to reason that probiotics based on a single strain are less effective than mixed-culture probiotics when microbial control is desired. The probability that a beneficial bacterium will dominate the associated microbiota is higher when several bacteria are administered than when only one probiotic strain is involved. Techniques to indicate probiotic strains, such as the use of green fluorescent protein or immunoassay procedure or 16S rDNA probes
www.ijmer.in 30
INTERNATIONAL JOURNAL OF MULTIDISCIPLINARY EDUCATIONAL RESEARCH
ISSN : 2277-7881; IMPACT FACTOR – 4.527; IC VALUE:5.16; ISI VALUE:2.286 VOLUME 6, ISSUE 8(2), AUGUST 2017
(Martinez-Picado et al., 1994), may also be useful in distinguishing an exogenous probiotc strain in a mixed microbial community, in order to better locate and quantify the probiotic strain. Much effort obviously
still has to be invested in terms of the production of such multispecies inocula and the methods needed to preserve them, validate their quality and activity as biocontroling agents against pathogens in aquaculture.
References
Balcázar JL, Blas ID, Ruiz-Z I, Cunningham D, Vendrell D, Múzquiz JL (2006). The role of probiotics in aquaculture. Veterinary Microbiology. 114(3-4):173–186.
Beveridge M C M, Begum M, Frerichs G N, Millar S (1989). The ingestion of bacteria in suspension by the tilapia Oreochromis niloticus. Aquaculture. 81:373–378.
García de la Banda I, Chereguini O, Rasines I (1992). Influencia de la adición de bacteria lácticas en el cultivo larvario del rodaballo (Scophthalmus maximus L.) Bol Inst Esp Oceanogr. 8:247–254.
Garriques D, Arevalo G (1995). An evaluation of the production and use of a live bacterial isolate to manipulate the microbial flora in the commercial production of Penaeus vannamei postlarvae in Ecuador. In: Browdy C L, Hopkins J S, editors. Swimming through troubled water. Proceedings of the Special Session on Shrimp Farming, Aquaculture '95. Baton Rouge, La: World Aquaculture Society; pp. 53–59.
Ghosh S, Sinha A, Sahu C (2008). Dietary probiotic supplementation on growth and health of live-bearing ornamental fishes. Aquaculture Nutrition. 14(4):289–299.
Gibson L, Woodworth J, George A (1998). Probiotic activity of Aeromonas media on the Pacific oyster, Crassostrea gigas, when challenged with Vibrio tubiashii. Aquaculture. 169:111–120.
Gildberg A, Mikkelsen H, Sandaker E, Ringø E (1997). Probiotic effect of lactic acid bacteria in the feed on growth and survival of fry of Atlantic cod (Gadus morhua) Hydrobiologia. 352:279–285.
www.ijmer.in 31
INTERNATIONAL JOURNAL OF MULTIDISCIPLINARY EDUCATIONAL RESEARCH
ISSN : 2277-7881; IMPACT FACTOR – 4.527; IC VALUE:5.16; ISI VALUE:2.286 VOLUME 6, ISSUE 8(2), AUGUST 2017
Gram L, Melchiorsen J, Spanggaard B, Huber I, Nielsen T (1999).
Inhibition of Vibrio anguillarum by Pseudomonas fluorescens strain AH2—a possible probiotic treatment of fish. Appl Environ Microbiol. 65:969–973.
Irianto A, Austin B (2003). Use of dead probiotic cells to control furunculosis in rainbow trout, Oncorhynchus mykiss (Walbaum) Journal of Fish Diseases. 26(1):59–62. Kautsky N, Rönnbäck P, Tedengren M, Troell M (2000).Ecosystem perspectives on management of disease in shrimp pond farming. Aquaculture. 191(1–3):145–161.
Maeda M (1994). Biocontrol of the larvae rearing biotope in aquaculture. Bull Natl Res Inst Aquacult. 1:71–74.
Martinez-Picado J, Blanch A R, Jofre J (1994). Rapid detection and identification of Vibrio anguillarum by using a specific oligonucleotide probe complementary to 16S rRNA. Appl Environ Microbiol. 60:732–737.
Munro P D, Barbour A, Birkbeck T H (1995).Comparison of the growth and survival of larval turbot in the absence of culturable bacteria with those in the presence of Vibrio anguillarum, Vibrio alginolyticus, or a marine Aeromonas sp. Appl Environ Microbiol. 61:4425–4428.
Nakano T (2007). Microorganism. En dietary supplements for the health and quality of cultured fish. London, UK: CAB International.
OIE/WHO FAO (2006). Antimicrobial use in aquaculture and antimicrobial resistance. Report of a Joint. Expert Consultation on Antimicrobial Use in Aquaculture And Antimicrobial Resistance.
Olafsen J A (1998). Proceedings from the US-EC Workshop on Marine Microorganisms: Research Issues for Biotechnology. Brussels, Belgium: European Commission; Interactions between hosts and bacteria in aquaculture; pp. 127–145.
Olsson J C, Westerdahl A, Conway P, Kjelleberg S (1992). Intestinal colonization potential of turbot(Scophthalmus maximus)- and dab (Limanda limanda)-associated bacteria with inhibitory effects against Vibrio anguillarum. Appl Environ Microbiol. 58:551–556.
www.ijmer.in 32
INTERNATIONAL JOURNAL OF MULTIDISCIPLINARY EDUCATIONAL RESEARCH
ISSN : 2277-7881; IMPACT FACTOR – 4.527; IC VALUE:5.16; ISI VALUE:2.286 VOLUME 6, ISSUE 8(2), AUGUST 2017
Prieur D (1981). Experimental studies of trophic relationships between
bacteria and bivalve molluscs. Kiel Meeresforsch Sonderh. 5:376–383.
Ravi AV, Musthafa KS, Jegathammbal G, Kathiresan K, Pandian SK (2007). Screening and evaluation of probiotics as a biocontrol agent against pathogenic Vibrios in marine aquaculture. Letters in Applied Microbiology. 45(2):219–223.
Rico-Mora R, Voltolina D, Villaescusa-Celaya J A (1998). Biological control of Vibrio alginolyticus in Skeletonema costatum (Bacillariophyceae) cultures. Aquacult Eng. 19:1–6.
Ringø E, Gatesoupe F J (1998). Lactic acid bacteria in fish: a review. Aquaculture. 160:177–203.
Riquelme C, Araya R, Vergara N, Rojas A, Guaita M, Candia M (1997). Potential probiotic strains in the culture of the Chilean scallop Argopecten purpuratus (Lamarck, 1819) Aquaculture;154:17–26.
Riquelme C, Hayashida G, Araya R, Uchida A, Satomi M, Ishida Y (1996). Isolation of a native bacterial strain from the scallop Argopecten purpuratus with inhibitory effects against pathogenic Vibrios. J Shellfish Res. 15:369–374.
Robertson PAW, O’Dowd C, Burrells C, Williams P, Austin B( 2000). Use of Carnobacterium sp. as a probiotic for Atlantic salmon (Salmo salar L.) and rainbow trout (Oncorhynchus mykiss, Walbaum) Aquaculture. 185(3-4):235–243.
Skjermo J, Salvesen I, Oie G, Olsen Y, Vadstein O (1997). Microbially matured water: a technique for selection of a non-opportunistic bacterial flora in water that may improve performance of marine larvae. Aquacult Int. 5:13–28.
Stanier R Y, Doudoroff M, Adelberg E A (1963). The microbial world. Englewood Cliffs, N.J: Prentice-Hall Inc.
Taoka Y, Maeda H, Jo JY, et al., (2006). Growth, stress tolerance and non-specific immune response of Japanese flounder Paralichthys olivaceus to probiotics in a closed recirculating system. Fisheries Science. 72(2):310–321.
www.ijmer.in 33
INTERNATIONAL JOURNAL OF MULTIDISCIPLINARY EDUCATIONAL RESEARCH
ISSN : 2277-7881; IMPACT FACTOR – 4.527; IC VALUE:5.16; ISI VALUE:2.286 VOLUME 6, ISSUE 8(2), AUGUST 2017
Vandenbergh P (1993). Lactic acid bacteria, their metabolic products
and interference with microbial growth. FEMS Microbiol Rev. 12:221–238.
Verschuere L, Rombaut G, Sorgeloos P, Verstraete W (2000).Probiotic bacteria as biological control agents in aquaculture. Microbiology and Molecular Biology Reviews. 64(4):655–671.
Vine NG, Leukes WD, Kaiser H (2004). In vitro growth characteristics of five candidate aquaculture probiotics and two fish pathogens grown in fish intestinal mucus. FEMS Microbiology Letters. 231(1):145–152.
Wang YB, Li JR, Lin J (2008). Probiotics in aquaculture: challenges and outlook. Aquaculture. 281(1–4):1–4.
Wooldridge K G, Williams P H (1993). Iron uptake mechanisms of pathogenic bacteria. FEMS Microbiol Rev. 12:325–348.
www.ijmer.in 34

INTERNATIONAL JOURNAL OF MULTIDISCIPLINARY EDUCATIONAL RESEARCH
ISSN : 2277-7881; IMPACT FACTOR – 4.527; IC VALUE:5.16; ISI VALUE:2.286 VOLUME 6, ISSUE 8(2), AUGUST 2017
ICHTHYOFAUNAL BIODIVERSITY IN THE SUNAMUDI
GEDDA A TRIBUTARY OF MAHENDRATANAYA, EASTREN GHATS AT VENKATAVARADA RAJAPURAM, MANDASA,
SRIKAKULAM DT. ANDHRA PRADESH, INDIA
Rama Rao. K and * Vinod Kumar Mudumala Asst. Professor, Department of Zoology, Govt. Degree College,
Satavahana University, Jammikunta, Karimnagar, Dt. Telangana State, India
*Senior Fisheries Scientist, Fishery Survey of India, Ministry of Agriculture and Farmers Welfare, Department of Animal Husbandry,
Dairying & Fisheries New Fishing Jetty, Sassoon Dock, Colaba, Mumbai, Maharashtra, India
Abstract
Ichthyofaunal diversity in the Sunamudi Gedda was recorded from July-2016 to June-2017. A total of 39 species of fishes belonging to 15 families, 7 orders and 25 genera such as Cypriniformes 20 species, Perciformes 7 species, Siluriformes 6species, Channiformes 3 species, Cyprinodontiformes, Angulliformes and Osteoglossiformes each with one species. The number and percentage composition of families, genera and species, order cypriniformes was dominant with 51.28% of the total species followed by Perciformes 17.95%, Siluriformes 15.39%, Channiformes 7.69%, Cyprinodontiformes, Osteoglossiformes and Anguilliformes each 2.56%. Recorded families out of 15, Perciformes 46.67%, followed by Siluriformes 26.67%, Cypiniformies 13.30%, Osteoglossiformes, Cyprinodontiformes, Anguilliformes and
Channiformes each with 06.67%. Recorded genera out of 25, Cypiniformies contributed 11 (44.00%) species followed by Perciformes 06 (24.00%), Siluriformes 04 (16.00%), Osteoglossiformes, Cyprinodontiformes, Anguilliformes and Channiformes each with 01 (4.00%). The number and Percentage composition of Population Status, IUCN (2017.1), CAMP (1998) status and Shannon-Weiner diversity for different months were calculated.
www.ijmer.in 35
INTERNATIONAL JOURNAL OF MULTIDISCIPLINARY EDUCATIONAL RESEARCH
ISSN : 2277-7881; IMPACT FACTOR – 4.527; IC VALUE:5.16; ISI VALUE:2.286 VOLUME 6, ISSUE 8(2), AUGUST 2017
Key words: Pisces diversity, Population Status, Shannon-Weiner
diversity (H-), Evenness (E) and species richness (S), Hmax = ln(S) Maximum diversity possible.
1. Introduction
Sunamudi Gedda is origin at the Mahendra Mountains is associated with east direction which clearly says that it is none other than Eastern Ghats. Sunamudi Gedda is a naturally formed one of the tributary of West South canal of Mahendra Reservoir and it was flows down streams towards Bay of Bengal. It is located at 18°52' N latitude and 84°
30' E longitude in Venkatavarada Rajapuram, Mandasa mandalam, srikakulam dt. Andhra PradeshState. (Fig: 1). Mahendragiri hills and its surrounding areas are recognized as a biodiversity hot spot due to numerous medicinal plants and other species that are found here. This is a large naturally formed canal into decade’s back which is the waters were utilised for agriculture. The number of check dams were constructed the entire tributary which is the excess rain water flows in the Mahendratanaya River ever year and finally flooded into Bay of Bengal.
Studies have been made on Ichthyofaunal diversity of various freshwater bodies in India during the last few decades (Jairam 1981; Jhingram 1983; Mishra et al 2003; Cemil Kara et al 2010). However,
scanty information is available from this region of India Murthy (2002) was studied fish and fisheries of Derala Tank, Dist. Nanded, Maharashtra. The various scientists have been reported 23,000 fish species in the world out of these 2546 species are dwell in India (Chakraborty 2004). The studies carried out by various researchers in concern of fish community. Hora et al (1941); Vyas et al (1989); Singh (1995); Anon (1967-1971); Bakawale and Kanhere (2006); Shrivastava et al (1970) given an account about fish fauna of Ken River. Therefore, in the present investigation preliminary observations of the fishes were
www.ijmer.in 36

INTERNATIONAL JOURNAL OF MULTIDISCIPLINARY EDUCATIONAL RESEARCH
ISSN : 2277-7881; IMPACT FACTOR – 4.527; IC VALUE:5.16; ISI VALUE:2.286 VOLUME 6, ISSUE 8(2), AUGUST 2017
carried out in the Benisagar Dam, Turki, Satna District (M.P.). Fish biodiversity of river essentially represents the fish faunal diversity and their abundance. River conserves a rich variety of fish species which support to the commercial fisheries. Kumar Varun and Kumar Kamad (2013) studied Icthyofaunal Diversity of Dhaura Reservoir, Kichha.
Menon (1999) reported Check list - freshwater fishes of India, Records of the Zoological Survey of India.
Around the world, 80-90 million people feed annually on fish which is serves as the most reliable source of protein. The number of people dependent on fisheries as an income has been estimated to be 200 million worldwide. Fish also contributes to the economies of most developing countries through tourism and recreation. With the growing appreciation that fish is a healthy source of protein, calcium and essential source of fatty acids, fish is increasingly at the mercy of pollutants from human activities. Other human activities such as modification of the environment, harvesting and culture and effects of modernization have contributed to the pollution of water bodies which serve as habitat for fishes (Tiwari 2011; Zhang et al 2011). Available
evidence indicates that human activities are eroding biological resources and the biotic components of ecosystems. Habitat changes, reduction of the planets’ biodiversity and associated losses of biodiversity are the inevitable prices we pay for over-exploitation of natures resources. Anthropogenic activities have resulted in damage to the genetic resources of aquatic organisms. That includes modification of environment, harvesting and culturing of aquatic resources for food or other uses.
The two most common measures of species diversity index are Simpson index and Shannon-Weiner index. The Simpson index is the measure of diversity which takes into account both the number of species and the evenness of occurrence of individuals in the various species. It is an expression of the number of times one would have to take pairs of
www.ijmer.in 37

INTERNATIONAL JOURNAL OF MULTIDISCIPLINARY EDUCATIONAL RESEARCH
ISSN : 2277-7881; IMPACT FACTOR – 4.527; IC VALUE:5.16; ISI VALUE:2.286 VOLUME 6, ISSUE 8(2), AUGUST 2017
individuals at random from the entire aggregation to find a pair from the species. Shannon- Weiner Index is a widely employed index. The Shannon index is also an expression of how many equally abundant species would have diversity equal to that in the observed collection. It measures the degree of uncertainty in a sampling event. That is if
diversity is low, then the certainty of picking a particular species is high. If diversity is high, then it is difficult to predict the identity of a randomly picked individual. There are no reports on fishery in this area along with tributary. This study was carried out to identify the fish composition, relative abundance and species diversity of resource of the Sunamudi Gedda.
Fig: 1. Sunamudi Gedda (Google courtesy)
2. Materials and Methods
Fish samples were collected from different corners of Sunamudi Gedda surrounding areas mainly by fishermen, fish collectors. Different types
www.ijmer.in 38

INTERNATIONAL JOURNAL OF MULTIDISCIPLINARY EDUCATIONAL RESEARCH
ISSN : 2277-7881; IMPACT FACTOR – 4.527; IC VALUE:5.16; ISI VALUE:2.286 VOLUME 6, ISSUE 8(2), AUGUST 2017
of nets (Drag nets, Push nets, Cast nets Stationary gill nets) were used for collection of fishes (Rama Rao 2014). The photographs of the collected fishes were taken at fresh condition immediately and preserve in 10% formalin without any post-mortem changes and recorded vernacular name (Hamilton- Buchanan 1822; Mishra 1962; Munro
2000). Fish samples were brought to the laboratory and fixed in 10% formalin solution in separate glass jars according to size. Identification was done based on keys and mainly on the morphometric and meristematic characters for fishes of the Indian subcontinent reported by Day. F (1889; 1958; 1878), Jairam (1999; 1961; 2011), Talwar and Jhingran,(1991) and classification was carried out on lines of Day.F (1889) , Jairam (1999), Nelson (1976) .
2.1 Data analysis
The mathematical expression of Shannon - Wiener Diversity Index is
Shannon-Wiener Index denoted by H = -SUM [(pi) × ln(pi)] SUM = summation
pi = proportion of total sample represented by species i
Divide no. of individuals of species i by total number of samples S = number of species, = species richness
Hmax = ln(S) Maximum diversity possible
E = Evenness = H/Hmax
3. Results
The results of the present study revealed that the occurrence of thirty nine fish species belong to seven orders, 15 families and 25 genera. List of Sunamudi Gedda fish including their order, family, genus, species, common name, vernacular name, IUCN and CAMP status were recorded in the present investigation was given in Table 1. The listed species are Notopterus notopterus, Catla catla, Labeo ariza, Labeo bata, Labeo rohita, Cirrhnus mrigala, Cirrhnus reba, *Ctenopharyngodon
idella, Puntius chola, Puntius ticto, Puntius sarana sarana, Puntius
www.ijmer.in 39
INTERNATIONAL JOURNAL OF MULTIDISCIPLINARY EDUCATIONAL RESEARCH
ISSN : 2277-7881; IMPACT FACTOR – 4.527; IC VALUE:5.16; ISI VALUE:2.286 VOLUME 6, ISSUE 8(2), AUGUST 2017
sophore, Rasbora daniconius, Rasbora elanga, Salmostoma bacaila, Salmostoma phulo, Amblypharyngodon microlepis, Amblypharyngodon
mola, Lepidocephalicthys guntea, Schistura cirica, Aplocheilus panchax Mystus bleeker, Mystus tengra, Mystus vittatus, Ompok bimaculatus, Wallago attu, Clarias batrachus, Heteropneustes fossilis, Anguilla bengalensis bengalensis, Channa orienalis, Channa panctatus, Channa striatus, Glosogobius giuris, Mastacembelus armatus, Mastacembelus
pancalus, Anabas testudineus, Chanda nama, Ambassis ranga and Badis sps, Out of 39 species five are exotic species are available in Sunamudi Gedda. (* indicates exotic fish species).
In the present investigation the number and percentage composition of families, genera and species under different orders are shown in Table 2 and Fig 2. Order cypriniformes was dominant with 20 species which contributed to 51.28% of the total 39 species followed by
Perciformes with 07 (17.95%), Siluriformes 06 (15.39%), Channiformes 03 (7.69%), Cyprinodontiformes, Osteoglossiformes and Anguilliformes each 01 (2.56%). Recorded families out of 15, Perciformes contributed 05 (46.67%) families followed by Siluriformes 04 (26.67%), Cypiniformies 02 (13.30%), Osteoglossiformes, Cyprinodontiformes, Anguilliformes and Channiformes each with 01 (06.67%). Recorded genera out of 25, Cypiniformies contributed 11 (44.00%) species followed by Perciformes 06 (24.00%), Siluriformes 04 (16.00%), Osteoglossiformes, Cyprinodontiformes, Anguilliformes and Channiformes each with 01 (4.00%).
In the present study the number and percent composition of genera and species under various families were represented in Table-3. Fig.3. The generic composition of fishes belonging to different families shows that nine genera under Cyprinidae contributed to 37.50%, two genera under
Cobitidae contributed to 08.33%, Notopteridae, Aplocheiidae, Bagridae, Siluridae, Clariidae, Heteropneustidae, Anguillidae, Channidae and Gobiidae contributed to 04.17% each. The species composition of fishes
www.ijmer.in 40

INTERNATIONAL JOURNAL OF MULTIDISCIPLINARY EDUCATIONAL RESEARCH
ISSN : 2277-7881; IMPACT FACTOR – 4.527; IC VALUE:5.16; ISI VALUE:2.286 VOLUME 6, ISSUE 8(2), AUGUST 2017
belonging to different families has revealed that 18 species belong to family Cyprinidae that made up to 46.15%, 3 species to family Bagridae and Channidae contributed to 7.69%, 2 species each to families Cobitidae and Mastacembelidae contributed to 05.13%, one species to families Notopteridae, Aplocheiidae, Siluridae, Clariidae,
Heteropneustidae, Anguillidae, Gobiidae, Anabantidae and Badide contributed 02.56 each of total fish species.
The number and Percentage composition of Population Status is 14 species were common which contributed to 35.90%, 11 species abundant which contributed to 28.20%, 08 species moderate which contributed to 20.51% and 06 species rare which contributed to 15.39% in the total catch (Table. 4. Fig. 4). According to IUCN (2017) thirty four species contributed to % are least concern (LC), two species contributed to 5.13% are not evaluated (NE), one species each with contributed to 2.56% are endangered (EN), near threatened and data deficient (DD) (Table. 5. Fig. 5). According to CAMP (1998) status twelve species of fish are Low risk near threatened (LR nt) contributed to 31.58%, 12 species are not evaluated (NE) contributed to 31.58%, eight species of fish are vulnerable (VU) contributed to 21.05%, three
species (07.89%) data deficient (DD), two species of fish is endangered (EN) contributed to 5.26% and one species of fish (2.63%) low risk least concern (LRlc) (Table. 5, Fig. 6).
Shannon-Wiener Index diversity indices of fish species in Sunamudi Gedda represented in Table-6. The richness of fish species was highest in June 2016 and June 2017, lowest in November and December 2016 (Fig: 7), the fish species diversity (H) ranged from 1.92 to 2.32. The highest diversity was recorded in July 2016 and the lowest in November and December 2016. These results indicated that good diversity index having in the Sunamudi Gedda (Fig. 8). Rama Rao (2014) (2016); Tirupathaiah et al (2013) found variation that highest diversity was recorded in June 2011 and the lowest in January 2011.
www.ijmer.in 41
INTERNATIONAL JOURNAL OF MULTIDISCIPLINARY EDUCATIONAL RESEARCH
ISSN : 2277-7881; IMPACT FACTOR – 4.527; IC VALUE:5.16; ISI VALUE:2.286 VOLUME 6, ISSUE 8(2), AUGUST 2017
Barthem (1981) found variation in the Shannon-Weiner index of from 2.2 to 3.2. According to Wilhm and Dorris (1966) Shannon index (H-) values ranged from >3 indicates clean water. 1.00 to 3.00 indicates moderate water and <1.00 indicates heavily polluted water. The results indicated that the maximum diversity possible ln(S) ranged from 2.75
to 3.58 (Fig: 8).The fish species diversity evenness (E) is 0.55 to 0.81 (Fig: 8). It is clearly indicated that there is evenly distribution of the fish fauna. Nunoo et al (2012) studied the species diversity of 1.67 indicates a highly complex community, for a greater variety of species allows for a lager array of species interactions.
www.ijmer.in 42

INTERNATIONAL JOURNAL OF MULTIDISCIPLINARY EDUCATIONAL RESEARCH
ISSN : 2277-7881; IMPACT FACTOR – 4.527; IC VALUE:5.16; ISI VALUE:2.286 VOLUME 6, ISSUE 8(2), AUGUST 2017
Table: 1. List of fishes and their order, family, genus, species, common name, vernacular name, feeding
habitat, population status, IUCN and CAMP status at Sunamudi Gedda
Order No. Scientific Name
Common Name
Vernacular Name
Feeding Habitat Population Status
IUCN Status (2017.1)
CAMP Status
I Family: Osteoglossiformes 1. Notopteridae (1)
1 Notopterus notopterus
Grey feather back
Yellenka
Demersal, insects, fish crustaceans roots of aquatic plants
C LC LRnt
II Family: Cypriniformies 2. Cyprinidae (18)
2 Catla catla Catla Botchea Surface layer and zooplankton
C LC LRnt
3 Labeo ariza Reba carp Bonta Benthopelagic, Feeds on diatoms, algae, insects and detritus
R LC NE
4 Labeo bata Bata labeo Yerrakallu chepa
Bottom dwellers, Crustaceous and insect larvae at early stages
R LC LRnt
5 Labeo rohita Rohit Reyyachepa
Middle layer/ plant matters
C LC LRnt
6 Cirrhinus mrigala
Mrigal Pedda bonta
Bottom dweller & detritus eater
C LC LRnt
www.ijmer.in 43

INTERNATIONAL JOURNAL OF MULTIDISCIPLINARY EDUCATIONAL RESEARCH
ISSN : 2277-7881; IMPACT FACTOR – 4.527; IC VALUE:5.16; ISI VALUE:2.286 VOLUME 6, ISSUE 8(2), AUGUST 2017
7 Cirrhinus reba Reba carp China
Bonta Demersal, feed on vegetables, crustaceans and insect larvae
R LC VU
8* Ctenopharyngodon idella
grass carp
Gaddi chepa
All substratum’s, feed on vegetables, crustaceans and insect larvae
R LC NE
9 Puntius chola Swamp barb
Pitta pariga
Benthopelagic, feed on crustaceans, insects and plant matter
A LC VU
10 Puntius ticto Ticto barb Pitta pariga
Surface feeder, feed onDiatom, Algae, Crustaceans, Rotifer, insects
A LC LRnt
11 Puntius sarana sarana
Olive barb Kanusu Surface habitat & Ominivorous
A LC VU
12 Puntius sophore Spot-fin swamp barb
Pitta pariga
Benthopelagic, feed on Surface phytoplankton and zooplankton
A LC LRnt
13 Rasbora daniconius
Slender rasbora
Charala chepa
Surface, feed on algae, aquatic insects
M LC LRnt
14 Rasbora elanga Bengala barb
Rangu chepa
Demersal, feeds on Aqutic insects, algae and protozoans
M LC NE
15 Salmostoma Large Yedurak Surface feeder & a A LC DD
www.ijmer.in 44

INTERNATIONAL JOURNAL OF MULTIDISCIPLINARY EDUCATIONAL RESEARCH
ISSN : 2277-7881; IMPACT FACTOR – 4.527; IC VALUE:5.16; ISI VALUE:2.286 VOLUME 6, ISSUE 8(2), AUGUST 2017
bacaila razorbelly
minnow u useful larvivorous
fish 16 Salmostoma
phulo Fine scale razor belly minnow
Yeduraku
Surface feeder & a useful larvivorous fish
C NE NE
17 Amblypharyngodon microlepis
Indian carplet
Tella chepa
Surface feeder & a useful larvivorous fish
A LC NE
18 Amblypharyngodon mola
Mola carplet
Tella chepa
Surface feeder, Phyto and zooplankton
A LC LRlc
19 Danio devario Devario danio, Dind Danio
Rangu chepa
Benthopelagic feeds on Worms, crustaceans and insects
C EN NE
3. Cobitidae (2)
20 Lepidocephalus guntea
Guntea Loach
Seekubammidi
Demersale M LC NE
21 Schistura corica Polka Dotted Loach
Seekubammidi
Benthopelagic feeds on Worms, crustaceans and insects
M LC NE
III Family: Cyprinodontiformes 4. Aplocheiidae (1)
22 Aplocheilus panchax
Blue Panchax
Guddichepa
Benthopelagic, Surface, feed on algae, aquatic insects
C LC DD
IV Family: Siluriformes 5. Bagridae 23 Mystus bleeker Day’s Jella Demersal, feed on A LC VU
www.ijmer.in 45
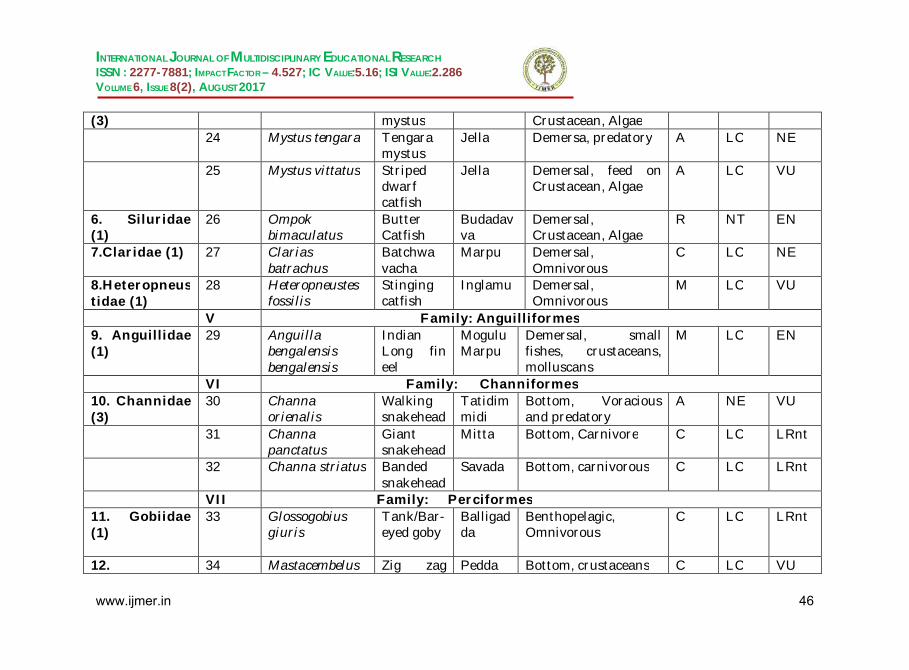
INTERNATIONAL JOURNAL OF MULTIDISCIPLINARY EDUCATIONAL RESEARCH
ISSN : 2277-7881; IMPACT FACTOR – 4.527; IC VALUE:5.16; ISI VALUE:2.286 VOLUME 6, ISSUE 8(2), AUGUST 2017
(3) mystus Crustacean, Algae 24 Mystus tengara Tengara
mystus Jella Demersa, predatory A LC NE
25 Mystus vittatus Striped dwarf catfish
Jella Demersal, feed on Crustacean, Algae
A LC VU
6. Siluridae (1)
26 Ompok bimaculatus
Butter Catfish
Budadavva
Demersal, Crustacean, Algae
R NT EN
7.Claridae (1) 27 Clarias batrachus
Batchwa vacha
Marpu Demersal, Omnivorous
C LC NE
8.Heteropneustidae (1)
28 Heteropneustes fossilis
Stinging catfish
Inglamu Demersal, Omnivorous
M LC VU
V Family: Anguilliformes 9. Anguillidae (1)
29 Anguilla bengalensis bengalensis
Indian Long fin eel
Mogulu Marpu
Demersal, small fishes, crustaceans, molluscans
M LC EN
VI Family: Channiformes 10. Channidae (3)
30 Channa orienalis
Walking snakehead
Tatidimmidi
Bottom, Voracious and predatory
A NE VU
31 Channa panctatus
Giant snakehead
Mitta Bottom, Carnivore C LC LRnt
32 Channa striatus Banded snakehead
Savada Bottom, carnivorous C LC LRnt
VII Family: Perciformes 11. Gobiidae (1)
33 Glossogobius giuris
Tank/Bar-eyed goby
Balligadda
Benthopelagic, Omnivorous
C LC LRnt
12. 34 Mastacembelus Zig zag Pedda Bottom, crustaceans C LC VU
www.ijmer.in 46

INTERNATIONAL JOURNAL OF MULTIDISCIPLINARY EDUCATIONAL RESEARCH
ISSN : 2277-7881; IMPACT FACTOR – 4.527; IC VALUE:5.16; ISI VALUE:2.286 VOLUME 6, ISSUE 8(2), AUGUST 2017
Mastacembelidae (2)
armatus spiny eel Bammidi
35 Mastacembelus pancalus
Barred spiny eel
Chinna Bammidi
Benthopelagic, insect larvae
C LC LRnt
13. Anabantidae (1)
36 Anabas testudineus
Climbing perch
Gorasa Demersal Feed on macrophytic, shrimps and fish fry
M DD DD
14. Ambassidae (2)
37 Chanda nama Elongate glass perchlet
Kara chepa
All substratum’s of water, checks mosquito breeding
C LC NE
38 Ambassis ranga Indian glassy fish
Kara chepa
All substratum’s of water, checks mosquito breeding, Oarnivorous
M LC NE
15. Badide (1) 39 Badis sps. Dwarf Chameleon Fish
Mala pitta pariga
Bottom, crustaceans R LC -
A= Abundant (76-100%); C = Common (51-75%); M = Moderate (26-50%); R = Rare (1-25%) of the total catch.
EN- Endangered; VU- Vulnerable: LRnt- Lower risk near threatened; LRlc- Lower risk least concern; LC- Least concern; DD- Data Deficient; NE- Not evaluated, NT: Near threaten. *Exotic fishes No: 8
www.ijmer.in 47

INTERNATIONAL JOURNAL OF MULTIDISCIPLINARY EDUCATIONAL RESEARCH
ISSN : 2277-7881; IMPACT FACTOR – 4.527; IC VALUE:5.16; ISI VALUE:2.286 VOLUME 6, ISSUE 8(2), AUGUST 2017
Table: 2. Number and percent composition of families, genera and species of fishes under various orders
S.No Orders Families genus Species % of families in an order
% of genera in an order
% of species in an order
1 Osteoglossiformes 1 1 1 6.67 4.00 2.56 2 Cypriniformies 2 11 20 13.3 44.00 51.28 3 Cyprinodontiformes 1 1 1 6.67 4.00 2.56 4 Siluriformes 4 4 6 26.67 16.00 15.39 5 Anguilliformes 1 1 1 6.67 4.00 2.56 6 Channiformes 1 1 3 6.67 4.00 7.69 7 Perciformes 5 6 7 46.67 24.00 17.95 Total 15 25 39
Table: 3. Number and percentage composition of genera and species under various families
S.No Families Genera % of genera in a family Species % of species in a family 1 Notopteridae 01 4.17 01 2.56 2 Cyprinidae 09 37.5 18 46.15 3 Cobitidae 02 8.33 2 5.13 4 Aplocheiidae 01 4.17 01 2.56 5 Bagridae 01 4.17 03 7.69 6 Siluridae 01 4.17 01 2.56 7 Claridae 01 4.17 01 2.56 8 Heteropneustidae 01 4.17 01 2.56 9 Anguillidae 01 4.17 01 2.56 10 Channidae 01 4.17 03 7.69
www.ijmer.in 48
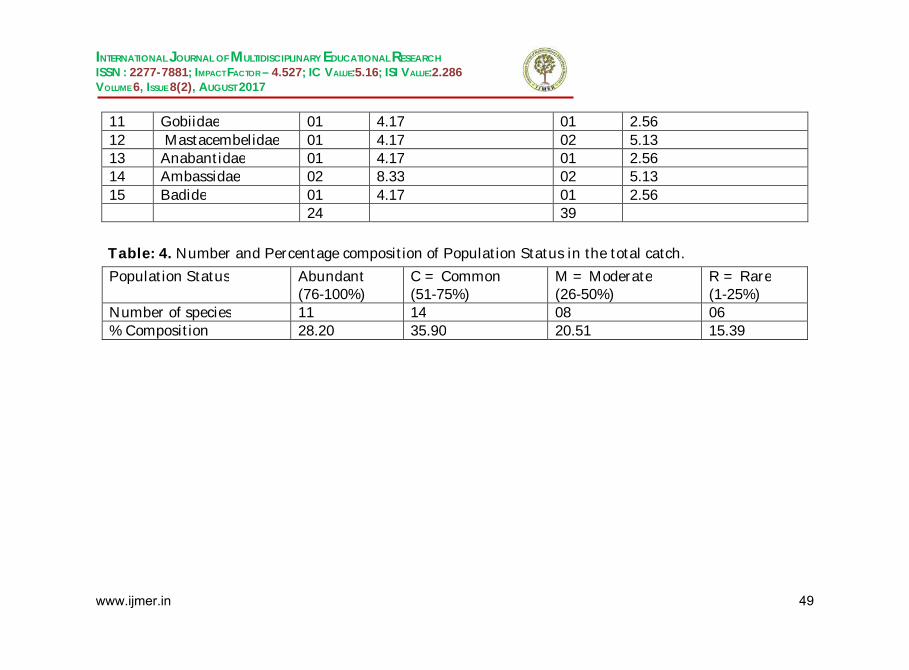
INTERNATIONAL JOURNAL OF MULTIDISCIPLINARY EDUCATIONAL RESEARCH
ISSN : 2277-7881; IMPACT FACTOR – 4.527; IC VALUE:5.16; ISI VALUE:2.286 VOLUME 6, ISSUE 8(2), AUGUST 2017
11 Gobiidae 01 4.17 01 2.56 12 Mastacembelidae 01 4.17 02 5.13 13 Anabantidae 01 4.17 01 2.56 14 Ambassidae 02 8.33 02 5.13 15 Badide 01 4.17 01 2.56 24 39 Table: 4. Number and Percentage composition of Population Status in the total catch.
Population Status Abundant (76-100%)
C = Common (51-75%)
M = Moderate (26-50%)
R = Rare (1-25%)
Number of species 11 14 08 06 % Composition 28.20 35.90 20.51 15.39
www.ijmer.in 49

INTERNATIONAL JOURNAL OF MULTIDISCIPLINARY EDUCATIONAL RESEARCH
ISSN : 2277-7881; IMPACT FACTOR – 4.527; IC VALUE:5.16; ISI VALUE:2.286 VOLUME 6, ISSUE 8(2), AUGUST 2017
05
101520253035
Fig: 2. Number and percentage contribution of families, genera and species
Species
genus
Families
05
1015202530
Fig: 3. Number and percentage composition of genera and species under various families
Genera Species
www.ijmer.in 50

INTERNATIONAL JOURNAL OF MULTIDISCIPLINARY EDUCATIONAL RESEARCH
ISSN : 2277-7881; IMPACT FACTOR – 4.527; IC VALUE:5.16; ISI VALUE:2.286 VOLUME 6, ISSUE 8(2), AUGUST 2017
Table: 5. Percentage occurrence of fish species in Sunaudi Gedda
under the conservation status IUCN (2017.1) and CAMP (1998)
Category EN VU NT LRnt LRlc LC DD NE IUCN (2017.1)
No. of species
01 - 01 - - 34 01 02
% contribution
2.56 - 2.56 - - 87.18 2.56 5.13
CAMP (1998)
No. of species
02 08 - 12 01 - 03 12
% contribution
5.26 21.05 - 31.58 2.63 - 7.89 31.58
28%
36%
21%
15%
Fig: 4. Population Status Abundant
Common
Moderate
Rare
www.ijmer.in 51

INTERNATIONAL JOURNAL OF MULTIDISCIPLINARY EDUCATIONAL RESEARCH
ISSN : 2277-7881; IMPACT FACTOR – 4.527; IC VALUE:5.16; ISI VALUE:2.286 VOLUME 6, ISSUE 8(2), AUGUST 2017
2% 3%
87%
3% 5%
Fig: 5. IUCN Red list Status(2017.1)
EN NT LC DD NE
5%
21%
31%
3% 8%
32%
Fig: 6. CAMP status (1998)
EN VU LRnt LRlc DD NE
www.ijmer.in 52
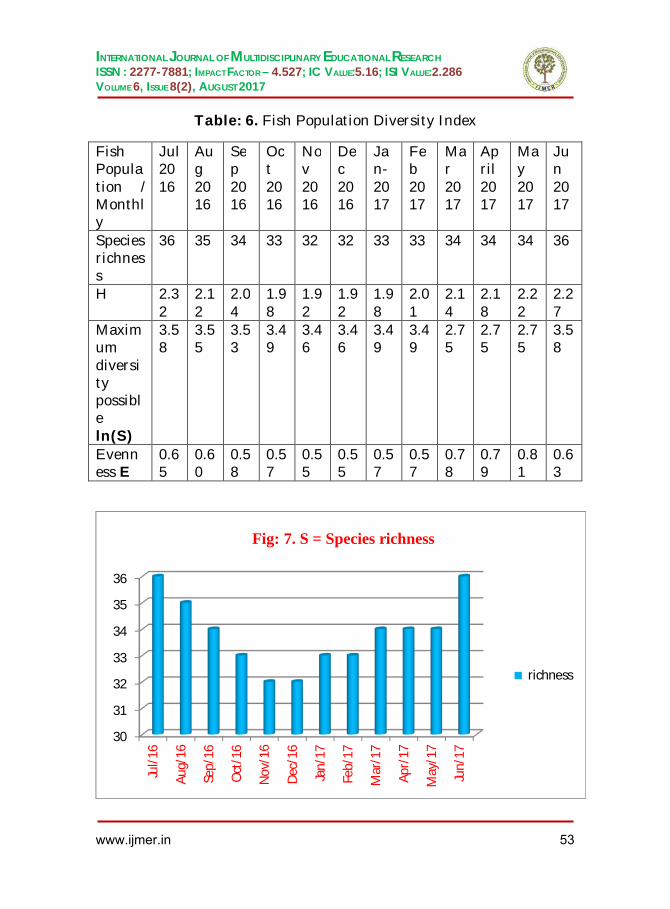
INTERNATIONAL JOURNAL OF MULTIDISCIPLINARY EDUCATIONAL RESEARCH
ISSN : 2277-7881; IMPACT FACTOR – 4.527; IC VALUE:5.16; ISI VALUE:2.286 VOLUME 6, ISSUE 8(2), AUGUST 2017
Table: 6. Fish Population Diversity Index
Fish Population / Monthly
Jul 2016
Aug 2016
Sep 2016
Oct 2016
Nov 2016
Dec 2016
Jan-2017
Feb 2017
Mar 2017
April 2017
May 2017
Jun 2017
Species richness
36 35 34 33 32 32 33 33 34 34 34 36
H 2.32
2.12
2.04
1.98
1.92
1.92
1.98
2.01
2.14
2.18
2.22
2.27
Maximum diversity possible ln(S)
3.58
3.55
3.53
3.49
3.46
3.46
3.49
3.49
2.75
2.75
2.75
3.58
Evenness E
0.65
0.60
0.58
0.57
0.55
0.55
0.57
0.57
0.78
0.79
0.81
0.63
30
31
32
33
34
35
36
Jul/1
6
Aug/
16
Sep/
16
Oct
/16
Nov
/16
Dec/
16
Jan/
17
Feb/
17
Mar
/17
Apr/
17
May
/17
Jun/
17
Fig: 7. S = Species richness
richness
www.ijmer.in 53

INTERNATIONAL JOURNAL OF MULTIDISCIPLINARY EDUCATIONAL RESEARCH
ISSN : 2277-7881; IMPACT FACTOR – 4.527; IC VALUE:5.16; ISI VALUE:2.286 VOLUME 6, ISSUE 8(2), AUGUST 2017
4. Discussion
Gunasekar and Suthakar Isaac (2017) documented and described 25 freshwater fish species of Indrapuri dam that were belonging to the 5 orders and 12 families and 21 genera. Among them, three species were belonging to the family Bagridae, five species were belonging to Schilbeidae, two species were belonging to Siluridae and Cichlidae, six species were belonging to Cyprinidae while the remaining other families. Mahesh et al (2015), The order Cypriniformes was dominant
with 9 fish species followed by order Perciformes with 4 species and the order Beloniformes and Siluriformes with 2 species each; and Synbrachiformes and Osteoglossiformes each Mahapatra (2003); Mookappa Naik and Hina Kousar., (2012); Sakhare and Joshi (2004); Pisca Ravi Shankar, et al (2000); Sugunan and Yadava (1992); with 1 species. Biju Kumar (2000) was studied exotic fishes and Freshwater fish diversity in 2000. Rama Rao (2014) reported 53 ornamental and 58
0
2
4
6
8
Fig: 8. Shannon - Wiener Diversity Index, Maximum Diversity Possible and Evenness
H ln(S) Evenness E
www.ijmer.in 54
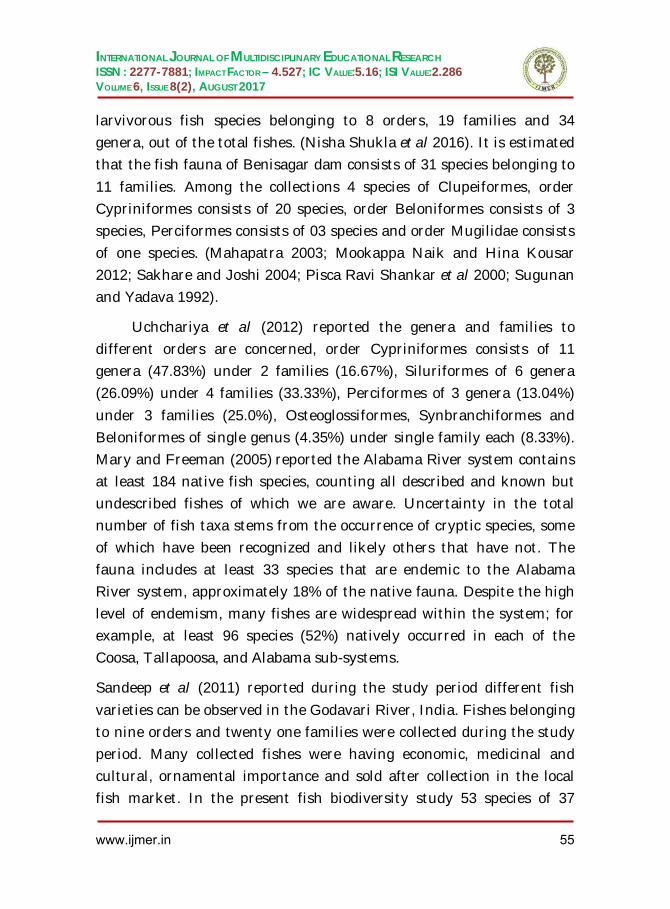
INTERNATIONAL JOURNAL OF MULTIDISCIPLINARY EDUCATIONAL RESEARCH
ISSN : 2277-7881; IMPACT FACTOR – 4.527; IC VALUE:5.16; ISI VALUE:2.286 VOLUME 6, ISSUE 8(2), AUGUST 2017
larvivorous fish species belonging to 8 orders, 19 families and 34 genera, out of the total fishes. (Nisha Shukla et al 2016). It is estimated that the fish fauna of Benisagar dam consists of 31 species belonging to
11 families. Among the collections 4 species of Clupeiformes, order Cypriniformes consists of 20 species, order Beloniformes consists of 3 species, Perciformes consists of 03 species and order Mugilidae consists of one species. (Mahapatra 2003; Mookappa Naik and Hina Kousar 2012; Sakhare and Joshi 2004; Pisca Ravi Shankar et al 2000; Sugunan and Yadava 1992).
Uchchariya et al (2012) reported the genera and families to different orders are concerned, order Cypriniformes consists of 11 genera (47.83%) under 2 families (16.67%), Siluriformes of 6 genera (26.09%) under 4 families (33.33%), Perciformes of 3 genera (13.04%)
under 3 families (25.0%), Osteoglossiformes, Synbranchiformes and Beloniformes of single genus (4.35%) under single family each (8.33%). Mary and Freeman (2005) reported the Alabama River system contains at least 184 native fish species, counting all described and known but undescribed fishes of which we are aware. Uncertainty in the total number of fish taxa stems from the occurrence of cryptic species, some of which have been recognized and likely others that have not. The fauna includes at least 33 species that are endemic to the Alabama River system, approximately 18% of the native fauna. Despite the high level of endemism, many fishes are widespread within the system; for example, at least 96 species (52%) natively occurred in each of the Coosa, Tallapoosa, and Alabama sub-systems.
Sandeep et al (2011) reported during the study period different fish
varieties can be observed in the Godavari River, India. Fishes belonging to nine orders and twenty one families were collected during the study period. Many collected fishes were having economic, medicinal and cultural, ornamental importance and sold after collection in the local fish market. In the present fish biodiversity study 53 species of 37
www.ijmer.in 55
INTERNATIONAL JOURNAL OF MULTIDISCIPLINARY EDUCATIONAL RESEARCH
ISSN : 2277-7881; IMPACT FACTOR – 4.527; IC VALUE:5.16; ISI VALUE:2.286 VOLUME 6, ISSUE 8(2), AUGUST 2017
different genera 21 families and 9 orders were recorded from the Godavari River during January 2008- December 2009. The members of Order Cypriniformes were dominated with 40 species followed by Perciformes with 7 species, Siluriformes with 6 species, Beloniformes with five species each, Osteoglossiformes with 2 species and
Synbranchiformes with 1 species. In Rajahmundry Dam there found nine orders representing by 47 fish species, order Cypriniformes was dominant group with 16 species in the assemblage composition in which Osteobrama vigorsii were found most abundant. Ahirrao (2000) recorded 32 fish species belonging to 25 genera and 8 families from Parbhani district of Maharashtra. Joshi (2002) reported the ichthyofauna of Bori reservoir in Maharashtra. Krishna and Ravi Shankar (2006) reported 31 ichthyo fauna in secrete lake, Durgamcheru, Ranga Reddy District. Hiware and Pawar (2006) recorded 43 fish species from Nath Sagar Dam Paithan in Aurangabad district. Battul et al (2007) recorded 18 fish species in Ekrukh Lake
near Solapur, Maharashtra. Jayabhaye et al (2008) recorded 25 fish species belonging to 7 orders in Jawalgaon reservoir in Solapur district of Maharashtra. Rama Rao, (2014) the similar study of generic composition of fishes belonging to different families in Lower Manair Dam.
The studies on Ichthyofaunal diversity from different fresh water bodies of India have been carried out during the last few decades Talwar and Jhingran, (1991); Archana et al (2004);
Pathak, and Mudgal (2005); Sharma et al (2007); reported 29 species of fishes belonging to six orders from Krishnapura lake,
Indore and stated that Cypriniformes was dominant with 15 species followed by Siluriformes with 6 species. Due to more fecundity of major carps and suitable environmental condition relatively higher population density of Cypriniformes was evident in the tank.
www.ijmer.in 56

INTERNATIONAL JOURNAL OF MULTIDISCIPLINARY EDUCATIONAL RESEARCH
ISSN : 2277-7881; IMPACT FACTOR – 4.527; IC VALUE:5.16; ISI VALUE:2.286 VOLUME 6, ISSUE 8(2), AUGUST 2017
5. Conclusion
The conservation of Icthyo faunal biodiversity is one of the major environmental challenges in Sunamudi Gedda. Most of the agricultural discharges with nitrates and potassium fertilisers were dissolved in the tributary at the time of rainy seasons. Anthropogenic stress also impacts a negative impression on fish species as well as on entire water body ecology. There are no fish biodiversity reports earlier in these
tributaries. The biotic indices of Shannon-Weiner, Evenness and richness were fairly significant in during study period and the diversity of fish fauna is more in Sunamudi Gedda. According to local information about five decades back Wallago attu was disappeared and now the present study was reviledthat the Ompok bimaculatus population is gradually decreases in these waters.
6. Acknowledgements
The authors would like to thank Commissioner Collegiate Education Telangana, Govt. Degree and PG College, Jammikunta, for providing necessary facilities.
7. References
1. Jairam, K. C. The freshwater fishes of India, Pakistan, Bangladesh, Burma and Sri Lanka- A Handbook. Zoological Survey of India, Culcutta, 1981; 475pp. 2. Jhingram, V.G. Fish and Fisheries of India, Hindustan Publisning Corporation(India), Delhi. 1983. 3. Mishra, S., Pradham, P., Kar, S. and Chakraborthy, S.K. Ichthyofauna diversity of Midnapore, Bankura and Hooghly districts of South West Bengal. Rec. Zool. Surv. India. Occ. Paper 2220: 1-66. 2003. 4. Cemil Kara, Ahmet Alp , Mustafa Şimşekli., 2010. Distribution of Fish Fauna on the Upper and Middle Basin of Ceyhan River, Turkey. Turkish Journal of Fisheries and Aquatic Sciences 2010; 10: 111-122 , 2010.
www.ijmer.in 57

INTERNATIONAL JOURNAL OF MULTIDISCIPLINARY EDUCATIONAL RESEARCH
ISSN : 2277-7881; IMPACT FACTOR – 4.527; IC VALUE:5.16; ISI VALUE:2.286 VOLUME 6, ISSUE 8(2), AUGUST 2017
5. Murthy, D.S. Highlights of fisheries development in Andhra Pradesh. Fishing Chimes. 2002; 22 (1): 64 - 70. 6. Chakraborty S. Biodiversity, The Diamond Printing Press, Jaipur, India;2004; 136. 7. Hora, S. L., Nair, K. K. Notes in the Indian Museum .XLI .New record of Fresh water fish from Travancore, Record of Indian museum (Culcutta ). 1941; V 43 (pt 3), pp 387-393. 8. Vyas. Vipin, Vivek Parashar and Dinesh Damde. Fish Biodiversity and Preferential Habitats of Fishes in selected stretch of Narmada River. Nat. Environ. and. Pollu. Tech. 2009; Vol.8. No.1. 81-89. 9. Singh, S.N. Studies on fish conservation in Narmada Sagar, Sardar Sarovar and its downstream. Narmada Control Authority, Indore, India. 1995; 85. 10. Anon. MP Fisheries Survey in Narmada River. Fisheries Department, 1967-1971. 11. Bakawale S and Kanhere R R. Fish fauna of River Narmada in West Nimar MP. Res. Hun. 2006; 1; 46-51. 12. Shrivastava, G.B., Chandra, R. and Visharad, S.K. Record Zoological Survey of India. 1970; 64(1-4);131-134. 13. Kumar Varun and Kumar Kamad. Icthyofaunal Diversity of Dhaura Reservoir, Kichha, Uttarakhand, India. Research Journal of Animal, Veterinary and Fishery Sciences. 2013; Vol. 1(5), 1-4. 14. Menon A.G.K., Check list - freshwater fishes of India, Records of the Zoological Survey of India, Occasional. 1999; 175, 366. 15. Tiwari RN. Assessment of groundwater quality and pollution potential of Jawa Block Rewa District, Madhya Pradesh, India. Proceedings of the International Academy of Ecology and Environmental Sciences 2011; 1(3-4): 202-212. 16. Zhang WJ, Jiang FB, Ou JF. Global pesticide consumption and pollution: with China as a focus. Proceedings of the International Academy of Ecology and Environmental Sciences. 2011; 1(2): 125-144 17. Rama Rao. K., A Study On Fishing Craft And Gear In Lower Manair Dam, Karimnagar Dt. Andhra Pradesh, India. International Journal of Multidisciplinary Educational Research. 2014; Vol 3, Issue 5(2). 18. Hamilton- Buchanan, F. An account of the fishes of river Ganges and its branches. Edinburgh and London. 1822; vii + 450p 19. Mishra, K. S. An aid to the identification of the common commercial fishes of India and Pakistan. Rec. Ind. 1. Mus. 1962; 57: 1 – 320.
www.ijmer.in 58

INTERNATIONAL JOURNAL OF MULTIDISCIPLINARY EDUCATIONAL RESEARCH
ISSN : 2277-7881; IMPACT FACTOR – 4.527; IC VALUE:5.16; ISI VALUE:2.286 VOLUME 6, ISSUE 8(2), AUGUST 2017
20. Munro, I. S. R.., The Marine and Freshwater Fishes of Ceylon. Biotech Books, Delhi, 2000 21. Day, F. The fauna of British India including Ceylon and Burma. Fishes.1889; 1: 548: 2: 509. The London, Taylor and Francis.. 22. Day, F., The fishes of India, being a natural history of the fishes known to inhabit the seas and freshwater of India, Burma and Ceylon, text and atlas, London, William Dawson and Sons Ltd., 1958; pp. 195-198. 23. Day F., The Fishes of India, Being a Natural History of The Fishes Known to Inhabit the Seas and Freshwaters of India, Burma and Ceylon, Bernard Quaritch, 15 Piccadilly, London, Vol. I and II, 1878. 24. Jairam, K. C. The freshwater fishes of the Indian region. Narendra Publicatin New Delhi, India. 1999; 551 pp. 25. Jairam, K. C., The proper generic names for some common Indian fishes of commercial importance. J. Zoo. Soc. India. 1961; 12(2): 239 – 242. 26. Jayaram K.C. The Freshwater Fishes of Indian Region Narendra Publication House, New Delhi, 2nd Edition, 2011. 27. Talwar P.K. and Jhingran A.G., Inland fishes of India and Adjacent Countries, Balkemra, Rotterdam, Vol. A. 1991 28. Nelson., Fishes of the World. 3rd Edn. John Wiley and Sons, New York. 1976; p. 416. 29. Gunasekar.A and S Suthakar Isaac. The Biodiversity of fish fauna in Indrapuri Dam Rohtas district, Bihar (India). International Journal of Fisheries and Aquatic Studies. 2017; 5(2): 416-419 30. Mahesh S. Aher and Prajakta A. Sonawane. Fish Fauna of Mula River at Mula Dam Reservoir, Rahuri (M.S.), India. Journal of Basic Sciences. 2015; Special Issue on BioIPPF, 41-44. 31. Biju Kumar., Exotic fishes and Freshwater fish diversity. Zoos Print Journal. 2000; Vol XV, No.11, RNI 2:2. 32. Rama Rao. K. Diversity of Ornamental Fishes in Lower Manair Dam at Karimnagar Dt. ndhra Pradesh. IOSR Journal of Pharmacy and Biological Sciences 2014; 2319- 7676. Vol 9, Issue 1 Ver. I, PP 20-24. 33. Rama Rao K. A study on larvivorous fish species efficacy of lower Manair dam at Karimnagar, Andhra Pradesh, India. Pelagia Research Library. Advances in Applied Science Research. 2014; 5(2):133-143. 34. Nisha Shukla , Dr. N.P. Tripathi and Dr. A.K. Tiwari. Fish Species Diversity of Benisagar Dam, Turki, Satna (M.P.) India. International
www.ijmer.in 59

INTERNATIONAL JOURNAL OF MULTIDISCIPLINARY EDUCATIONAL RESEARCH
ISSN : 2277-7881; IMPACT FACTOR – 4.527; IC VALUE:5.16; ISI VALUE:2.286 VOLUME 6, ISSUE 8(2), AUGUST 2017
Journal for Research in Applied Science & Engineering Technology (IJRASET). 2016; Volume 4 Issue III. 35. Mahapatra D K., Present status of fisheries of Hirakund reservoirs, Orissa. Fishing chimes. 2003; 22 (10&11):76-79. 36. Mookappa Naik C. K. And Hina Kousar., Study On Fish Diversity Status Of Talaguppa Tank, Sagara Taluk, Karnataka. The Ecoscan. 2012; 6(3&4): 149-151. 37. Sakhare VB and Joshi PK., Present status of reservoir fishery in Maharashtra. Fishing Chimes. 2004; 24(8):56-60. 38. Pisca Ravi Shankar, Saraladevi B and Divakara Chary K., The present status of Ibrahimbagh, a minor reservoir of Hyderabad, Fishing Chimes. 2000; 20(2):41-43. 39. Sugunan VV and Yadava YS. Hirakhud reservoir strategies for fisheries development. Bulletin CIFRI, Barrackpore, India. 1992; pp 66. 40. Uchchariya D.K., Meenakshi Saxena And Saksena D.N. Fish Biodiversity Of Tighra Reservoir Of Gwalior, Madhya Pradesh, India Journal Of Fisheries And Aquaculture. 2012; Volume 3, Issue 1, Pp.-37-43. 41. Mary C. Freeman. Status and Conservation of the Fish Fauna of the Alabama River System. American Fisheries Society Symposium. 2005; 45:557–585, 2005 42. Sandeep R. Rathod and Gulab D. Khedkar. Impact of elevation, latitude and longitude on fish diversity in Godavari River Journal of Research in Biology. 2011; 269-275 | JRB | Vol 1 | No 4/2011 43. Ahirrao, S.D. and A.S. Mane., The diversity of ichtyofauna, taxonomy and fisheries from freshwater of Parbhani, Dist. Maharashtra State, J. Aqua. Biol.2000; 15(1&2): 40-43. 44. Joshi, P.K. and Sakhare, V.B., Ecology and Icthyofauna of Bori reservoir in Maharashta. Fishing Chimes. 2002; 22(4): 40– 41. 45. Krishna S.M. & Ravi Shankar Piska., Ichithgofaunal biodiversity in secret lake Durgamcheruvu, Ranga Reddy Dist., Andhra Pradesh, India, J. Aqua. Bio. 2006; Vol.21(1), 77-79. 46. Hiware, C.J. and Pawar, R.T. Ichthyofauna of Paithan Reservoir (Nath Sagar Dam) in Aurangabad Dist. Of Marathwada region Maharashtra, Ecology and Environment, APH Publishing Corporation, New Delhi, 2006 47. Battul, P.N., Rao, K.R., Navale, R.A., Bagale, M.D., Shah, N.V., Fish diversity from Ekrukh lake near Solapur,Maharashtra, J. of Aquatic Biology. 2007; Vol.22(2).
www.ijmer.in 60

INTERNATIONAL JOURNAL OF MULTIDISCIPLINARY EDUCATIONAL RESEARCH
ISSN : 2277-7881; IMPACT FACTOR – 4.527; IC VALUE:5.16; ISI VALUE:2.286 VOLUME 6, ISSUE 8(2), AUGUST 2017
48. Jayabhaye U.M. and G.D. Khedkar., Fish diversity of Sawana dam in Hingoli dist. of Maharashtra, J. Aqua. Biol.2008; Vol.23(1): 26-28. 49. Rama Rao. K. Ichthyo faunal bio diversity in the lower Manair Dam at Karimnagar district; Telangana State: India. Pelagia Research Library; Advances in Applied Science Research, 2014; 5(5):237-248. 50. IUCN Red List of threatened species, version 2017.1. www.iucnredlist.org down loaded on July 2017. 51. CAMP., Conservation and Management Plan for Freshwater Fishes of India”. Organized by Zoo Outreach Organisation, NBFGR, Lucknow 1998. 52. Rama Rao. K and Leela, B. Ichthyo fauna and hydrophyte floral diversity in the Lower Manair Dam at Karimnagar district, (Telangana State) India: International Journal of Fisheries and Aquatic Studies, 2016; 4(3): 109-118. 53. Thirupathaiah, M. Ch. Samatha and Ch. Sammaiah., Diversity of fish fauna in lower Manair reservoir of Karimnagar district (A.P.), India Pelagia Research Library Advances in Applied Science Research. 2013; 4(2):203-211. 54. Barthem R. B., Consideracoes sobre a Pesca experimental com rede de espera em lagos da Amaxonia Central. Dissertacao de Mestrado, INPA/FUA, Manaus, 1981 55. Wilhm, J.L. and T.C. Doris., Species diversity of benthic macroinvertebrates in a stream receiving domestic and oil refinery effluents. Amer. Midl. Nat. 1966; 76:427-449. 56. Nunoo, J. N. Agbo, M. Ackah Fish fauna of the Owabi Dam Reservoir in Ghana Proceedings of the International Academy of Ecology and Environmental Sciences 2012; 2(1): 21-26. 57. Talwar P.K. and Jhingran A.G., Inland fishes of India and Adjacent Countries, Balkemra, Rotterdam, Vol. A. 1991. 58. Archana, Mudgal, L.K.Sharma, Anjana and Sharma Shailendra. Fish diversity of Yashwant Sagar reservoir, Indore, (M.P.). Him. J.Env. Zool., 2004; 18(2). 59. Pathak, S.K. and Mudgal L.K. Limnology and biodiversity of fish fauna in Viral reservoir, M.P.J. Comp Toxical physico-checmical. 2005; 2 (1 and II): 86-90. 60. Sharma, K.K., Nitasha and Sarbiet Kour. Some limnological investigations in Banganga stream Koba. Jammu and Kashmir State. J. Aqua. Biol. 2007; Vol. 22(1) : 105-109.
www.ijmer.in 61
INTERNATIONAL JOURNAL OF MULTIDISCIPLINARY EDUCATIONAL RESEARCH
ISSN : 2277-7881; IMPACT FACTOR – 4.527; IC VALUE:5.16; ISI VALUE:2.286 VOLUME 6, ISSUE 8(2), AUGUST 2017
Periodic variations in the occurrence of marine ornamental
fishes in the By-catch of Visakhapatnam fishing harbour,Andhra Pradesh, East Coast of India
Krishna, N.M and Velamala, GovindaRao, Ramesh Babu, K and D.Venu
Department of Marine Living Resources,Andhra University, Visakhapatnam- 530003, Andhra Pradesh, India
ABSTRACT:
Aquatic ecosystem has a rich biodiversity and fisheries resources of ornamental fishes. At present, more than 575 fish species have been reported worldwide from different aquatic ecosystems. In Indian waters possess a rich biodiversity although very low levels of ornamental fishes were reported. In recent scenario the ornamental fishes popularly and
trade in India is dominated by the exotic species that is bred in captivity. Visakhapatnam coast is known for its rocky habitats and their associated fish species, most of the fishes derive food from the rocky environments of the region although many of them herbivorous. A study was made to identify the potential marine ornamental fishes in the trawl by-catch of the Visakhapatnam fishing harbour, Andhra Pradesh coast, India in order to assess its temporal and spatial availability. A total of 55 species of ornamental fishes belonging to 20 families were collected during the present study period (2014-2016). These fishes were discarded due to low consumer acceptance and small size. With simple infrastructure, these fishes could be kept alive on board on brought to the harbour. The objective is to feature exactly how utmost of the species of marine ornamental fishes landed in live condition without any part of body damages, can be used for aquarium purpose by careful condition.
Key words: Seasonal changes, by-catches, marine ornamental fishes, Visakhapatnam
www.ijmer.in 62

INTERNATIONAL JOURNAL OF MULTIDISCIPLINARY EDUCATIONAL RESEARCH
ISSN : 2277-7881; IMPACT FACTOR – 4.527; IC VALUE:5.16; ISI VALUE:2.286 VOLUME 6, ISSUE 8(2), AUGUST 2017
1. Introduction:
Aquatic animals comprising fish species with potential ornamental importance are being discarded through trawl by-catches all over the world. These discards have received excessive deals of systematic consideration and their minimization actuality a goal of marine fisheries management the annual landing of the by-catch in the country is estimated to be around 1.3 meters (Chandrapal, 2005).These living jewels (ornamental fishes) cultured in the aquarium are of high commercial value due to aesthetic pleasure. Indigenous ornamental fish export and import from India is from two biodiversity hot spots the east and south coast of India. In less than a decade, the ornamental fishes
have rapidly spread throughout the Indian Ocean. To improve understanding of the ornamental fish invasion, there is a pressing need for comparative knowledge on ornamental fish’s form their native ranges. Indian waters possess a rich diversity of ornamental fishes, with over 300 varieties of indigenous species. Ornamental fish keeping is becoming popular as an easy and stress relieving hobby. Asia is the major exporting region accounting for 56% of the global exports. India has joined the led 10 Asian exporting countries recently, contributing only 2% of the Asian export (Kutty, 2008). In India is one of the hot spots of ornamental fish biodiversity in the world. Valuable information of ornamental fishes, which includes associated fish species, from the rocky grounds off East and West coast of India. While regional works on the ornamental fishes from Indian waters (Murty, 2002; Murty et
al.,1989; Munro, 1955; Prabhakaran et al., 2013) specimens recorded from Lakshadweep Island. Several taxonomists and experts reported various marine ornamental fish species from this region. (Pramod et al.,2010)Recently estimated the by-catch of Indian trawlers as 1.2 mt (Kumar, Deepthi, 2009) reported on the fish diversity and mean trophic index of fish fauna associated with trawl by-catch of Kerala coast( Sajeevan and Somvanshi, 2013) collected 66 species of marine
www.ijmer.in 63

INTERNATIONAL JOURNAL OF MULTIDISCIPLINARY EDUCATIONAL RESEARCH
ISSN : 2277-7881; IMPACT FACTOR – 4.527; IC VALUE:5.16; ISI VALUE:2.286 VOLUME 6, ISSUE 8(2), AUGUST 2017
ornamental fish from the trawl fishery of west coast of India.(Muddula Krishna et al., 2015, Muddula Krishna et al., 2015, GovindaRao,2015) studied diversity and length weight relationship studies of marine ornamental fish species from Visakhapatnam coastal waters. This paper record the marine ornamental fish diversity associated with the by-catch of trawlers operating from Visakhapatnam Fishing harbour, Andhra Pradesh, Middle East coast of India.
2. Materials and Methods:
Marine ornamental fishes were collected fromthe trawl by-catch
landingsoff Visakhapatnam fishing harbor during 2015-2016. The fresh specimens were collected cleaned, washed and preserved in 10% formaldehyde after noting the coloration and measuring the length and weight. Specimens were identified by using standard taxonomic keys such as(Day, 1878, Smith and Heemstra, 1986, Nelson, 2006, Froese, 2014, Ajithkumar et al., 2006).
www.ijmer.in 64

INTERNATIONAL JOURNAL OF MULTIDISCIPLINARY EDUCATIONAL RESEARCH
ISSN : 2277-7881; IMPACT FACTOR – 4.527; IC VALUE:5.16; ISI VALUE:2.286 VOLUME 6, ISSUE 8(2), AUGUST 2017
Fig :1:Map showing Visakhapatnam fish landing centre
3. Results and Discussion:
The results of the present study show a rich marine ornamental fish diversity off Visakhapatnam coast. One important observation made during the study was that out of the 54 species encountered. Most of the fishes comes under the order Perciformes (34 species), followed by Scorpaeniformes (8 species), Beryciformes (4 species), Lophiformes (4 species), Tetradontiformes (3 species) and Syngnathiformes (1 species) (Figure 2). The Scorpionfishes and cardinal fishes, groupers, snappers under the genera Apogon, Pterois, Epinephelusand Lutjanus were
represented in the most diverse group of ornamental fish species. The highest diversity of ornamental fishes in trawl by-catch reveals that the coastal areas along Visakhapatnam, east coast of India high diversity of ornamental fishes. Apogonidae family species of A.taeniatus and Family Scorpaenidae species of Pteroisrusselliishowed predominance and it’s collected throughout the year except in the month of May.O.acanthorhinus, H.kuda and A. lineatus species were rarely
represented in the catches (Table-1).L.cornuta, T.biaculatus, A.immaculata, O.fleuriea, A.multitaeniatus, O.aureusspeices were commonly represented in the catches. D.bifasciatus, E.latifasciatusspecies were rarely represented in the catches (Table-1). Most of the fish species were represented in the months of March, April, June and July. Most of the marine ornamental fishes collected during the survey of period were caught along with the commercially
important fish species. They were said to have occurred as by-catch and landed alongside with the trash fish species. Most of these resources are not at present utilized for the purpose of aquarium keeping. A variety of ornamental fishes caught during trawling discarded due to lack of infrastructure for keeping them alive on board and lack of awareness among the fisherman about their potential and absence of marketing system for these ornamental fishes at fish landing centers
www.ijmer.in 65
INTERNATIONAL JOURNAL OF MULTIDISCIPLINARY EDUCATIONAL RESEARCH
ISSN : 2277-7881; IMPACT FACTOR – 4.527; IC VALUE:5.16; ISI VALUE:2.286 VOLUME 6, ISSUE 8(2), AUGUST 2017
(Ahilan and Walkhom, 2007). The high demand for these resources increased the pressure on fragile coral reef ecosystems which support most of the marine ornamental species. On the other hand, most of the taxonomic studies on marine ornamental fishes in India are from coral reef ecosystems (Rao et al., 2004, Chogale and Bhatkar 2006, Sivaprasad et al., 2007, Sureshkumar et al., 2004). The only effort has
so far been made to explore the potential of marine ornamental fishes encountered in the trawl by-catch was by Suresh kumar et al., (2004).
5. References:
Ahilan B, Walkhom G (2007). Some prime marine ornamental fishes of India. Fishing Chimes. 27(7):50-2.
Ajithkumar TT, Thangaradjou T, Kannan L (2007). J Mar. Biol. Ass. India, 48:(2006) 131—138. 10] Asha PS, Diwakar. J. Mar. Biol. Ass. India. 49:7-1.
Chandrapal GD (2005). Status of trash fish utilization and fish feed requirements in aquaculture–India. In Regional Workshop on Low Value and ‘Trash Fish ’in the Asia-Pacific Region” Hanoi, Viet-Nam (pp. 7-9).
Chogale ND, Bhatkar VR (2006). Some important marine ornamental
fishes of Ratnagiri coast. Fishing chimes. 25(12):34-6.
Day, F. (1878). The Fishes of India, Being a Natural History of the Fishes Known toInhabit the Seas and Fresh waters of India, Burma, and Ceylon. Part 1-4. William Dawson & Sons Ltd., London: 778 pp.
Froese, R. and Pauly, D (2014). Eds. FishBase. World Wide Web Electronic Publication, Versio 04/2014]. (Retrieved from http://www.fishbase.org.
GovindaRao, V., Krishna, N.M, Padmavathi, P, Reddy, N.R.S, Venu.D
and K.R. Babu (2015). Length weight relationship of some
www.ijmer.in 66
INTERNATIONAL JOURNAL OF MULTIDISCIPLINARY EDUCATIONAL RESEARCH
ISSN : 2277-7881; IMPACT FACTOR – 4.527; IC VALUE:5.16; ISI VALUE:2.286 VOLUME 6, ISSUE 8(2), AUGUST 2017
marine ornamental fish species of Visakhapatnam, east coast of India. J. Exp. Zool. India. 18(2): 857-861.
Kumar AB, Deepthi GR (2009). Diversity of flatfishes (Order: Pleuronectiformes) along the Kerala coast of India, with notes on two rare species. Indian Journal of Fisheries. Jul 1;56(3):211-4.
Kutty, M.N., (2008). Development of sustainable capture, Farming and
Trade of ornamental fishes.Kurup, B. M., Boopenranath, M. R., Ravindran, K.,Saira Banu and Nair, A. G. (Eds),2008. Ornamental fishBreeding, Farming and Trade, Dept. of Fisheries, Govt of Kerala, India: v¡ ¡ ¡ + 280pp.
Muddula Krishna, N, V. GovindaRao, N. Ram Sai Reddy, D. Venu and K. Ramesh Babu (2015). Diversity of some marine ornamental fish species along Visakhapatnam, East coast of India. Life Sciences International Research Journal. 2(1):479 -475.
Muddula Krishna, N., GovindaRao, V and Venu. D (2015). Taxonomic diversity, species composition, distribution, conservation and
abundance of rocky shore intertidal fishes in the Visakhapatnam, east coast of India. J. Exp. Zool. India. 19(1): 277- 283.
Munro, I. S. R. (1955). The Marine and Freshwater Fishes of the Ceylon. Dept. External Affairs, Canberra, 351 pp., 56 pls.
Murty VS. (2002). Marine ornamental fish resources of Lakshadweep.CMFRI special publication. 72:1-34.
Murty, VS., M. Kumaran and R.S.Lalmohan (1989). Re- sources of ornamental fishes.In: Marine Living Resources of the Union Territory of Lakshadweep-all indicative survey with suggestions for development. Bill.Cent.mar. Fish. Res. I11St., 43: 46-64.
www.ijmer.in 67

INTERNATIONAL JOURNAL OF MULTIDISCIPLINARY EDUCATIONAL RESEARCH
ISSN : 2277-7881; IMPACT FACTOR – 4.527; IC VALUE:5.16; ISI VALUE:2.286 VOLUME 6, ISSUE 8(2), AUGUST 2017
Nelson, J. S. (2006). Fishes of the world.Fourth Edition.John Wiley and
Sons Inc., New York, pp; 601.
Prabhakaran MP, S. BijoyNandan, PR. Jayachandran and NGK Pillai (2013). Species diversity and community structure of ichthyofauna in the seagrass ecosystem of Minicoy Atoll, Lakshadweep, India. Indian Journal of Geo Marine Sciences ; 349-359.
Pramod PK, Ramachandran A, Sajeevan TP, Thampy S, Pai SS (2010). Comparative efficacy of MS 222 and benzocaine as
anaesthetics under simulated transport conditions of a tropical ornamental fish Puntiusfilamentosus (Valenciennes). Aquaculture Research. Jan 1;41(2):309-14.
Rao PY, Damodar G, Rao DS (2004). On the occurrence of marine ornamental fishes at Visakhapatnam. Indian Journal of Fisheries. 51(2):229-32.
Sajeevan, M. K., and V. S. Somvanshi (2013). "Collection and rearing of marine ornamental fishes from coastal trawl fishery."
Sivaprasad PS, Paul CE, Natarajan P, Jayaprakas V (2007). Studies on Long-Term Storage of Sperm of a Marine Ornamental Fish, Istiblenniusedentulus (Perciformes: Blennidae). Fishery Technology. 44(1).
Smith, M.M. and Heemstra, P.C (1986). Smith’s Sea Fishes. Springer-
Verlag Publication: 572 - 579.
Sureshkumar S, Babu KK, Sakeer PP, Maqbool TK (2004). Seasonal Variations in the Occurrence of Marine Ornamental Fishes in the trawl by-catch of Ponnani Fishing Harbour, Kerala. Indian Journal of Fisheries. 51(1):69-73.
www.ijmer.in 68

INTERNATIONAL JOURNAL OF MULTIDISCIPLINARY EDUCATIONAL RESEARCH
ISSN : 2277-7881; IMPACT FACTOR – 4.527; IC VALUE:5.16; ISI VALUE:2.286 VOLUME 6, ISSUE 8(2), AUGUST 2017
www.ijmer.in 69
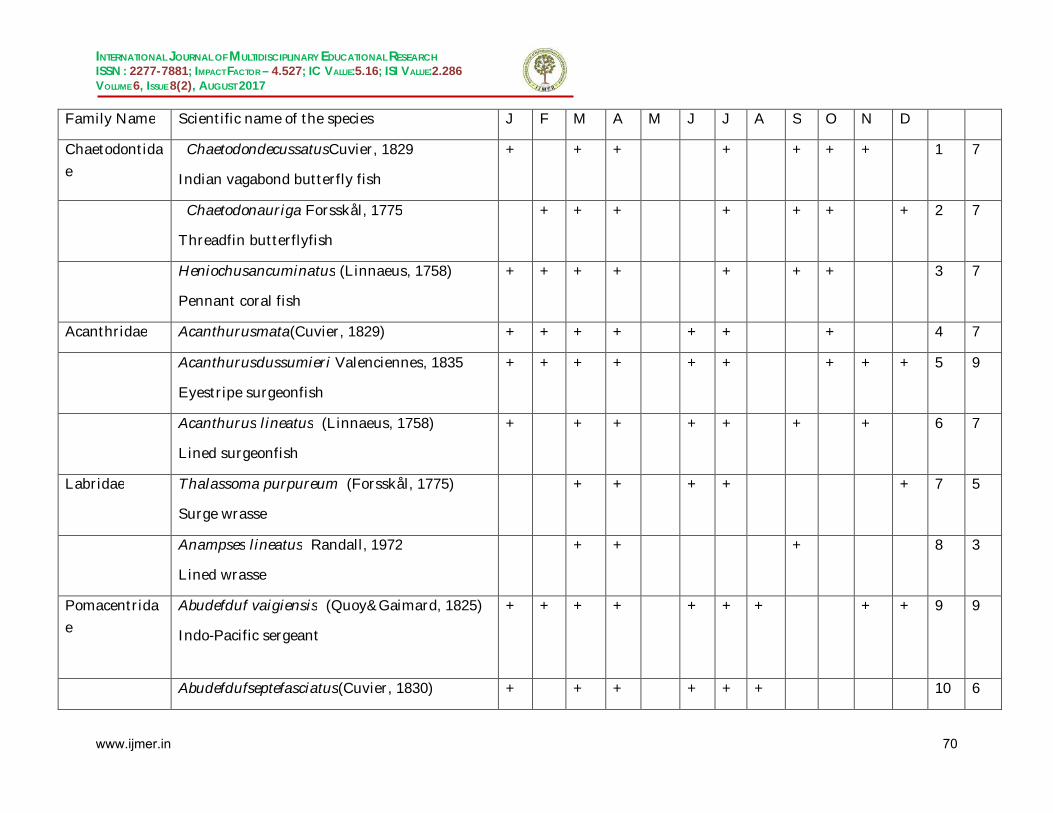
INTERNATIONAL JOURNAL OF MULTIDISCIPLINARY EDUCATIONAL RESEARCH
ISSN : 2277-7881; IMPACT FACTOR – 4.527; IC VALUE:5.16; ISI VALUE:2.286 VOLUME 6, ISSUE 8(2), AUGUST 2017
Family Name Scientific name of the species J F M A M J J A S O N D
Chaetodontidae
ChaetodondecussatusCuvier, 1829
Indian vagabond butterfly fish
+ + + + + + + 1 7
Chaetodonauriga Forsskål, 1775
Threadfin butterflyfish
+ + + + + + + 2 7
Heniochusancuminatus (Linnaeus, 1758)
Pennant coral fish
+ + + + + + + 3 7
Acanthridae Acanthurusmata(Cuvier, 1829) + + + + + + + 4 7
Acanthurusdussumieri Valenciennes, 1835
Eyestripe surgeonfish
+ + + + + + + + + 5 9
Acanthurus lineatus (Linnaeus, 1758)
Lined surgeonfish
+ + + + + + + 6 7
Labridae
Thalassoma purpureum (Forsskål, 1775)
Surge wrasse
+ + + + + 7 5
Anampses lineatus Randall, 1972
Lined wrasse
+ + + 8 3
Pomacentridae
Abudefduf vaigiensis (Quoy&Gaimard, 1825)
Indo-Pacific sergeant
+ + + + + + + + + 9 9
Abudefdufseptefasciatus(Cuvier, 1830) + + + + + + 10 6
www.ijmer.in 70

INTERNATIONAL JOURNAL OF MULTIDISCIPLINARY EDUCATIONAL RESEARCH
ISSN : 2277-7881; IMPACT FACTOR – 4.527; IC VALUE:5.16; ISI VALUE:2.286 VOLUME 6, ISSUE 8(2), AUGUST 2017
Banded sergeant
Pempheridae
Pempherisvanicolensis Cuvier, 1831
Vanikoro sweeper
+ + + + + + + 11 7
Pempherismangula (Cuvier, 1829) + + + + + + + + 12 8
Pomacanthidae
Pomacanthusannularis (Bloch, 1787) Blue ring angelfish
+ + + + + + + + 13 8
Pomacanthis imperator (Bloch, 1787)
Emperor angelfish
+ + + + + + + + 14 8
Pomacanthissemicircularis (Cuvier, 1831)
Semicircle angelfish
+ + + + + + + + 15 8
Apogonodiae
Ostorhinchusaureus (Lacepede, 1802)
Ring-tailed cardinalfish
+ + + + + + + + + 16 9
Apogonichthyoidestaeniatus (Cuvier, 1828) Two-belt cardinal
+ + + + + + + + + + + 17 11
Lepidamiamultitaeniatus Cuvier, 1828 + + + + + + + + + 18 9
Jaydia queketti (Gilchrist, 1903)- Spotfin cardinal
+ + + + + + + 19 7
Ostorhinchus fasciatus (White, 1790)
Broadbandedcardinalfish
+ + + + + 20 5
Ostorhinchus fleurieu Lacepède, 1802 + + + + + + + + + 21 9
www.ijmer.in 71

INTERNATIONAL JOURNAL OF MULTIDISCIPLINARY EDUCATIONAL RESEARCH
ISSN : 2277-7881; IMPACT FACTOR – 4.527; IC VALUE:5.16; ISI VALUE:2.286 VOLUME 6, ISSUE 8(2), AUGUST 2017
Flower cardinalfish
Jaydia poecilopterus (Cuvier, 1828)- Pearly-finned cardinalfis
+ + + + + + + 22 7
Priacanthidae
Cookeolus japonicus (Cuvier, 1829)
Longfinnedbullseye
+ + + + + + + 23 7
Lutjanidae Lutjanus lutjanus Bloch, 1790) -Bigeye snapper
+ + + + + + + 24 7
Lutjanus malabaricus (Bloch & Schneider, 1801) Malabar blood snapper
+ + + + + + + + 25 8
Lutjanus erythropterus Bloch, 1790
Crimson snapper
+ + + + + + + 26 7
Serranidae Epinephelus areolatus (Forsskål, 1775)
Areolate grouper
+ + + + + 27 5
Epinephelus latifasciatus
(Temminck&Schlegel, 1842)
Striped grouper
+ + + + 28 4
Diploprion bifasciatum Cuvier, 1828
Barred soapfish
+ + + 29 3
Uranoscopidae Uranoscopus cognatus Cantor, 1849
Two-spined yellow-tail stargazer
+ + + + + + + + 30 8
Uranoscopus bicinctus Temminck & Schlegel, + + + + + + 31 6
www.ijmer.in 72
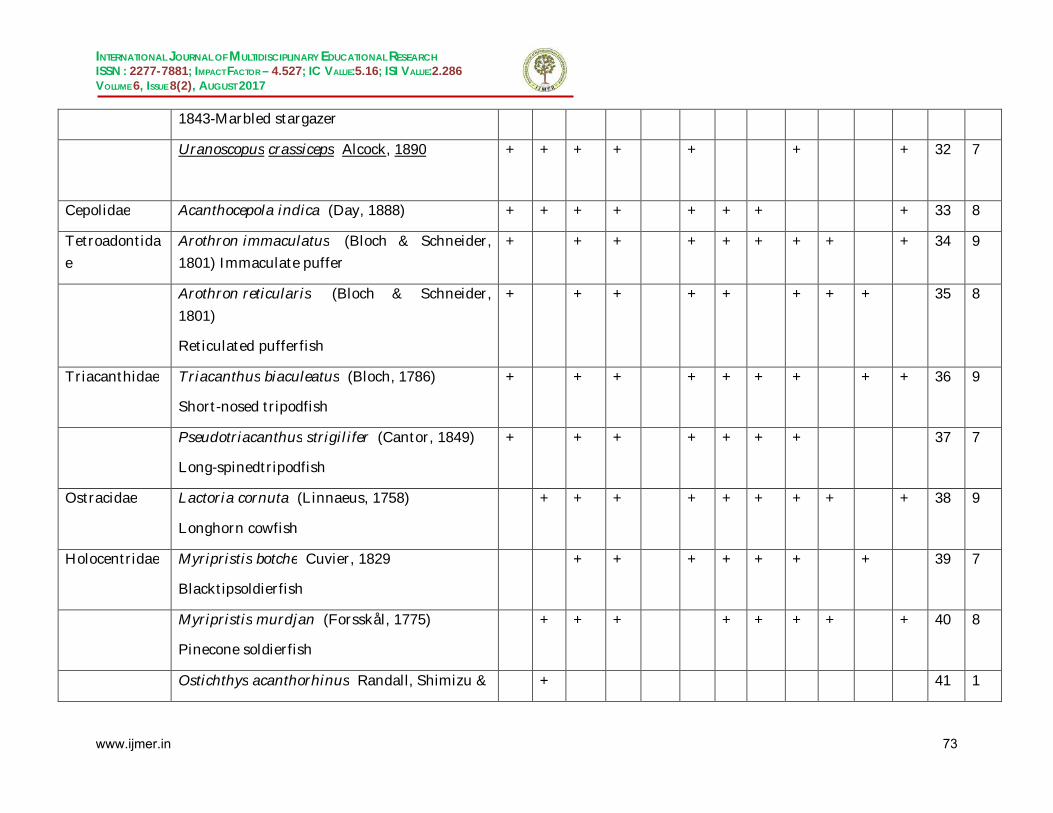
INTERNATIONAL JOURNAL OF MULTIDISCIPLINARY EDUCATIONAL RESEARCH
ISSN : 2277-7881; IMPACT FACTOR – 4.527; IC VALUE:5.16; ISI VALUE:2.286 VOLUME 6, ISSUE 8(2), AUGUST 2017
1843-Marbled stargazer
Uranoscopus crassiceps Alcock, 1890
+ + + + + + + 32 7
Cepolidae Acanthocepola indica (Day, 1888) + + + + + + + + 33 8
Tetroadontidae
Arothron immaculatus (Bloch & Schneider, 1801) Immaculate puffer
+ + + + + + + + + 34 9
Arothron reticularis (Bloch & Schneider,
1801)
Reticulated pufferfish
+ + + + + + + + 35 8
Triacanthidae Triacanthus biaculeatus (Bloch, 1786)
Short-nosed tripodfish
+ + + + + + + + + 36 9
Pseudotriacanthus strigilifer (Cantor, 1849)
Long-spinedtripodfish
+ + + + + + + 37 7
Ostracidae Lactoria cornuta (Linnaeus, 1758)
Longhorn cowfish
+ + + + + + + + + 38 9
Holocentridae Myripristis botche Cuvier, 1829
Blacktipsoldierfish
+ + + + + + + 39 7
Myripristis murdjan (Forsskål, 1775)
Pinecone soldierfish
+ + + + + + + + 40 8
Ostichthys acanthorhinus Randall, Shimizu & + 41 1
www.ijmer.in 73
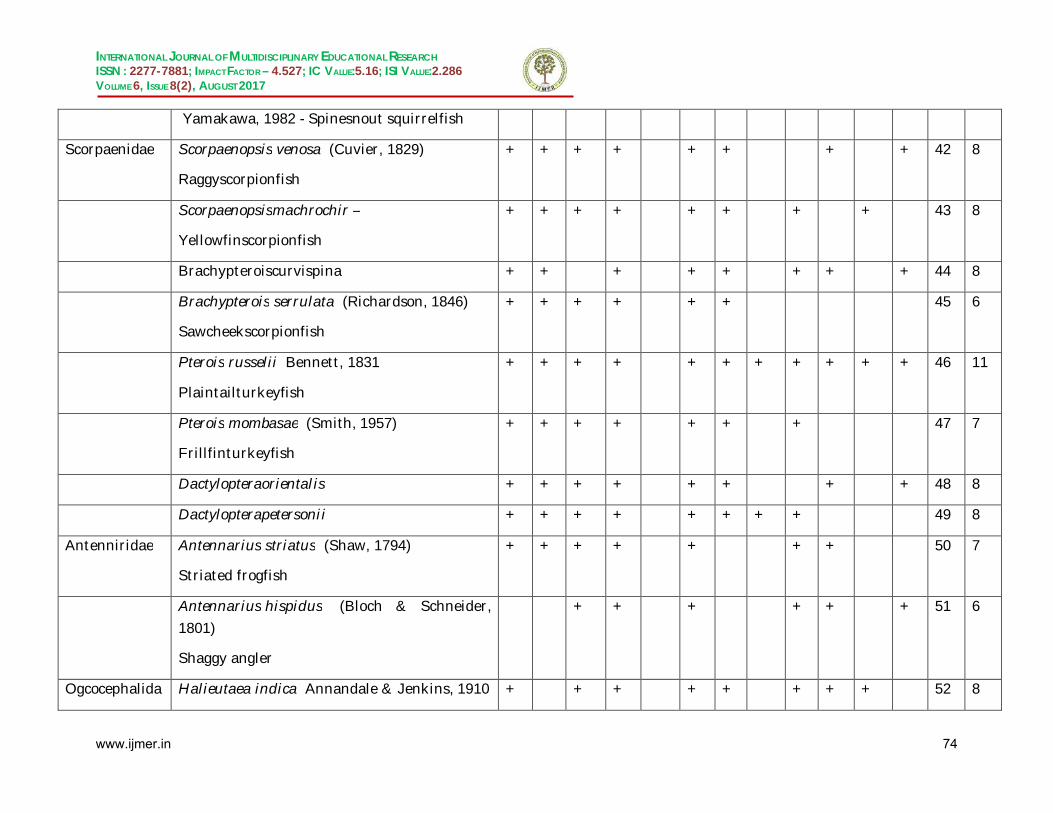
INTERNATIONAL JOURNAL OF MULTIDISCIPLINARY EDUCATIONAL RESEARCH
ISSN : 2277-7881; IMPACT FACTOR – 4.527; IC VALUE:5.16; ISI VALUE:2.286 VOLUME 6, ISSUE 8(2), AUGUST 2017
Yamakawa, 1982 - Spinesnout squirrelfish
Scorpaenidae
Scorpaenopsis venosa (Cuvier, 1829)
Raggyscorpionfish
+ + + + + + + + 42 8
Scorpaenopsismachrochir –
Yellowfinscorpionfish
+ + + + + + + + 43 8
Brachypteroiscurvispina + + + + + + + + 44 8
Brachypterois serrulata (Richardson, 1846)
Sawcheekscorpionfish
+ + + + + + 45 6
Pterois russelii Bennett, 1831
Plaintailturkeyfish
+ + + + + + + + + + + 46 11
Pterois mombasae (Smith, 1957)
Frillfinturkeyfish
+ + + + + + + 47 7
Dactylopteraorientalis + + + + + + + + 48 8
Dactylopterapetersonii + + + + + + + + 49 8
Antenniridae Antennarius striatus (Shaw, 1794)
Striated frogfish
+ + + + + + + 50 7
Antennarius hispidus (Bloch & Schneider, 1801)
Shaggy angler
+ + + + + + 51 6
Ogcocephalida Halieutaea indica Annandale & Jenkins, 1910 + + + + + + + + 52 8
www.ijmer.in 74

INTERNATIONAL JOURNAL OF MULTIDISCIPLINARY EDUCATIONAL RESEARCH
ISSN : 2277-7881; IMPACT FACTOR – 4.527; IC VALUE:5.16; ISI VALUE:2.286 VOLUME 6, ISSUE 8(2), AUGUST 2017
e Indian hand fish
Halieutaea stellata (Vahl, 1797)
+ + + + + + + + 53 8
Syngnathidae
Hippocampus kuda Bleeker, 1852Spotted seahorse
+ + + + 54 4
www.ijmer.in 75

INTERNATIONAL JOURNAL OF MULTIDISCIPLINARY EDUCATIONAL RESEARCH
ISSN : 2277-7881; IMPACT FACTOR – 4.527; IC VALUE:5.16; ISI VALUE:2.286 VOLUME 6, ISSUE 8(2), AUGUST 2017
www.ijmer.in 76
INTERNATIONAL JOURNAL OF MULTIDISCIPLINARY EDUCATIONAL RESEARCH
ISSN : 2277-7881; IMPACT FACTOR – 4.527; IC VALUE:5.16; ISI VALUE:2.286 VOLUME 6, ISSUE 8(2), AUGUST 2017
PROXIMATE COMPOSITION AND HEAVY METAL
ACCUMULATION IN SOME SELECTED DEEP SEA FISHES ALONG THE CONTINENTAL SLOPE (200M TO 1200M DEPTH)
OF INDIAN EEZ (EXCLUSIVE ECONOMIC ZONE)
K. Rushinadha Rao* and U. Sreedhar Visakhapatnam Research Centre of Central Institute of Fisheries
Technology, Oceanview layout, Pandurangapuram, A.U. PO., Visakhapatnam-530003, Andhra Pradesh, India.
* Corresponding author Senior Research Fellow, Visakhapatnam Research Centre of Central
Institute of Fisheries Technology, Oceanview layout, Pandurangapuram, A.U.PO., Visakhapatnam-530003
Email id: [email protected]
Abstract
The proximate composition and heavy metal accumulation of the edible part of seven demersal deep-sea fish species were studied. The species were caught from the region of Lat 11o03 - 11o21 N; Long. 74o49 - 74o54 E and Lat. 17o12 - 19o55 N; Long. 83o21 - 87o03 at the depth of 200 m – 1200 m of the Indian EEZ (Exclusive Economic Zone). The protein content varies from 14.10±0.46 to 18.91±0.68, whereas the moisture percentage was accumulated in between 77.61±0.60 and 81.10±0.22, while the concentration of fat was observed from 2.30±0.57 to 3.45±0.16 and the ash content was found in between 1.47±0.25 and 2.04±0.25 respectively. Heavy metals were done by using flame atomic absorption spectrophotometer and the
mean values of each component of thirteen species were examined. In overall metal accumulation, iron content found more followed by zinc, copper cobalt and cadmium, whereas lead was in below detectable level in all the given seven fish species.
www.ijmer.in 77

INTERNATIONAL JOURNAL OF MULTIDISCIPLINARY EDUCATIONAL RESEARCH
ISSN : 2277-7881; IMPACT FACTOR – 4.527; IC VALUE:5.16; ISI VALUE:2.286 VOLUME 6, ISSUE 8(2), AUGUST 2017
Keywords: Proximate composition, heavy metals, deep-sea fish, EEZ (Exclusive Economic Zone)
Introduction:
1. Seafood is an excellent source of nutritional value related to the presence of proteins, fats, vitamins and minerals. As the world population is increasing, the per capita consumption of seafood is also
increasing rapidly. The modern day human is interested in taking seafood more in view of its nutritional superiority than all other sources of food accessible. Fishes plays a significant role in the diet of human beings since it is a good source of animal protein. Marine fish muscle contains easily digestible protein and valuable essential amino acids (Venugopal et al 1996; Yanez, 1976). Man lives on land, which occupies a quarter of the surface of the planet and takes most of his food from the land. Approximately 14% of the animal protein consumed by human beings comes from marine fisheries ( Pigott and Tucker 1990). Biochemical assays and nutrients play a vital role on physical growth and development, maintenance of normal body function physical activity and health. The knowledge of the biochemical composition of any edible organisms is extremely important since its nutritive value is reflected in biochemical contents (Nagabhushanam and Mane 1978). Generally water content increased and lipid and
protein contents declined with increasing depth of occurrence (Bailey and Robison 1986; Childress and Nygaard 1973; Stickney and Torres 1989). Depth and productivity both affect food availability and thus influence chemical composition. In particular, lipid and protein content (% wet weight) both decline and as a result water concentration increases with increasing depth of occurrence (Childress 1990). It is worth noting that these physiological and biochemical changes have been attributed to factors correlated to depth, aside from the possible influence of temperature (Childress 1971; Torres 1979) or hydrostatic pressure (Teal 1971; Meek 1973). (Childress et al. 1990a) also found
www.ijmer.in 78

INTERNATIONAL JOURNAL OF MULTIDISCIPLINARY EDUCATIONAL RESEARCH
ISSN : 2277-7881; IMPACT FACTOR – 4.527; IC VALUE:5.16; ISI VALUE:2.286 VOLUME 6, ISSUE 8(2), AUGUST 2017
that the reduction in the metabolic rate with depth was also related to reduction in mobility.
Fish have been considered good indicators for heavy metals contamination in aquatic systems. Fish are widely consumed in many parts of the world by humans and polluted fish may endanger human health (Zhang 2007). Earlier studies (Mormede and Davies 2001) have
shown that heavy metals such as cadmium, lead, cobalt, iron, copper and zinc were found in moderately more concentrations in some deep-sea fish samples. Metals are non-biodegradable and consider as major environmental pollutants causing cytotoxic, mutagenic and carcinogenic effects in animals (More 2003). It is important to examine the toxic effects of metals on fish since they constitute an important link in food chain and their contamination by metal causes imbalances in aquatic system (Firat and Kargm 2010). Aquatic organisms have ability to accumulate heavy metals from various sources including sediments, soil erosion and runoff, air depositions of dust and aerosol, and discharge of waste water (Goodwin et al 2003). Many factors including season, physicochemical properties of water, habitat, age and physiological conditions of fish play a vital role in accumulation of
metals by fish (Kargin 1996). Gills are directly in contact with water; therefore the concentration of metals in gills reflects metal concentration in water where the fish lives. The accumulation of heavy metals within the fish varies depending on route of metal uptake, type of heavy metal, and fish species (Begum et al 2009). The occurrence of more amount of heavy metal concentration in any part of the body will provoke the changes in biochemical metabolisms. Therefore the studies on the accumulation of heavy metals in various organs of the fish were very much important.
Deep sea area is located under the immaculate depth area in the open ocean and is deeper than the continental shelf (>200 m). The habitat, rarely inhabited by organisms, is the widest in the world, with
www.ijmer.in 79

INTERNATIONAL JOURNAL OF MULTIDISCIPLINARY EDUCATIONAL RESEARCH
ISSN : 2277-7881; IMPACT FACTOR – 4.527; IC VALUE:5.16; ISI VALUE:2.286 VOLUME 6, ISSUE 8(2), AUGUST 2017
its water volume amounting to 85% of 70% world surface (Nybakken 1992). The rare fishes however, are important food source and often looked for by some people in the markets. In Europe, deep-sea fish (Lunglip) is marketed as cusk eel. In New Zealand it is known as Hung, South America, Cangrio and in Japan, Kingu. This fish is marketed by retail and rarely appears in restaurants, because of the good quality
and unique meat texture (Suseno 2010). Gold, red and black kinglip are marketed internationally, but the gold and red kinglip are preferred in the USA (Perkins 1992). In Australia, deep sea fish (Beryx splendens) was exploited, to the extent of over fishing (Anonymous 2004). In addition Soselia and Rustam (1993) reported that Cubiceps whiteleggi is one of economically important fish in the future. The food consumption and metabolism of deep sea fishery species have rarely been studied. Information on the proximate composition and heavy metal accumulation is important when utilization of new species of deep-sea fish is considered. This is because deep-sea fishes are considered to be not only food with good source of quality protein but also food with healthy components. The objective of the present study was to investigate the proximate composition and heavy metal
accumulation of deep-sea fishes along the continental slope of Indian EEZ (Exclusive Economic Zone).
Materials and methods:
Fish materials used in this work consisted of seven species of deep-sea fishes (Neobyticus, Basogigus, Chelidoperca investigatoris, Tricurus, Alepocephalus, Beryx splendens and Bembrops caudimacula) caught using a HSDT (High Speed Demersal Trawling) and HOT (High Opening Trawl) trawler by using Fisheries Oceanography Research Vessel of the Department of Ocean Development, FORV Sagar Sampada at depths of 200 to 1200 m in the continental slope of Indian
EEZ (Exclusive Economic Zone). The fish samples were kept frozen at -200C until analyzed.
www.ijmer.in 80

INTERNATIONAL JOURNAL OF MULTIDISCIPLINARY EDUCATIONAL RESEARCH
ISSN : 2277-7881; IMPACT FACTOR – 4.527; IC VALUE:5.16; ISI VALUE:2.286 VOLUME 6, ISSUE 8(2), AUGUST 2017
Chemical analysis
Chemical analysis Moisture content was determined by drying samples in an air circulation oven for 8 h at 100°C. Samples for ash determination were heated in a furnace at 550°C for 6 h to constant
weight as described in the AOAC manual(1990). Crude protein was determined on the edible portions of fish from Kjeldahl nitrogen using a 6.25 conversion factor AOAC (1990). Lipids were extracted by using chloroform/methanol (2:1, v/v) and were gravimetrically determined as described previously (Bligh and Dyer 1959).
Table 1. Working condition for analysis by atomic absorption spectrophotometer
Heavy metals
Wave length (nm)
Slit width (nm)
Flame type (Support-Gas)
Sensitivity (μg g-1)
Cadmium
228.8 0.5 Air-Acetylene 0.009
Cobalt 240.7 0.2 Air-Acetylene 0.07 Lead 217.0 1.0 Air-Acetylene 0.06
Copper 324.7 0.5 Air-Acetylene 0.025 Iron 248.3 0.2 Air-Acetylene 0.05 Zinc 213.9 1.0 Air-Acetylene 0.008
Samples for heavy metals were digested in teflon containers using a microwave digester (Ethos plus High Performance Microwave
Labstation, Milestone, USA). Three grams of sample was weighed in to 100 ml teflon vials and digested overnight with 7ml of pure nitric acid (AR grade, specific gravity: 1.38, Qualigens, India) and 3 ml of hydrogen peroxide. The microwave parameters were 700 W power for 1 h (40 min heating and 20 min ventilation) were shown in table 1. The digested contents were transferred to acid washed polypropylene bottles and made up to 100 ml with double distilled water and subjected to various metal analyses in Atomic Absorption Spectrophotometer (GBC 932AA, GBC Scientific Instruments, Australia) following the AOAC method AOAC (2000).
www.ijmer.in 81

INTERNATIONAL JOURNAL OF MULTIDISCIPLINARY EDUCATIONAL RESEARCH
ISSN : 2277-7881; IMPACT FACTOR – 4.527; IC VALUE:5.16; ISI VALUE:2.286 VOLUME 6, ISSUE 8(2), AUGUST 2017
Statistical analyses
Basic statistics (mean, standard deviation, 95 % confidence limit and range) were used to describe the data. An ANOVA (Sokal and Rohlf 1981) was used to compare the level of proximal composition and heavy
metal accumulation among the four sites. A Scheffe F-test (Sokal and Rohlf 1981) was used to compare two sampling sites when a significant difference was found for a given nutrient among the four sites to determine where the differences occurred. All statistical analyses were tested at 0.05 level of probability.
Results:
The mean value of each component of proximate composition (moisture, protein, fat and ash) and heavy metals i.e., Cu, Zn, Fe, Co, Cd and Pb of seven deep-sea fish species viz., Neobyticus, Basogigus, Chelidoperca investigatoris, Tricurus, Alepocephalus, Beryx splendens and Bembrops caudimacula were caught from the region of Lat 11o03 -
11o21 N; Long. 74o49 - 74o54 E and Lat. 17o12 - 19o55 N; Long. 83o21 - 87o03 at the depth of 200 m – 1200 m of Indian EEZ (Exclusive Economic Zone).
Proximate composition of deep-sea fish muscle
Among the species examined, table 2 represents the moisture content accumulated more in Alepocephalus followed by C. investigatoris and Neobyticus whereas the less concentration of
moisture was found in Basogigus. The highest protein percentage was found in Basogigus followed by B. caudimacula and Tricurus and lowest content of protein was found in Alepocephalus. Fat content was found high in B. caudimacula followed by B. splendens and C. investigatoris and lowest percentage of fat was observed in Neobyticus.
Ash percentage found more in Basogigus followed by Alepocephalus and Tricurus whereas less amount of ash was accumulated in C. investigatoris. A significant (p<0.05) value was observed within the
www.ijmer.in 82

INTERNATIONAL JOURNAL OF MULTIDISCIPLINARY EDUCATIONAL RESEARCH
ISSN : 2277-7881; IMPACT FACTOR – 4.527; IC VALUE:5.16; ISI VALUE:2.286 VOLUME 6, ISSUE 8(2), AUGUST 2017
species and significant difference was observed in between the deep-sea species respectively.
Table 2: Proximate composition of deep-sea fishes along the Indian EEZ
S.No Species name Moisture Protein Fat Ash
1 Neobyticus 79.74±0.57 16.50±0.59 2.30±0.57 1.85±0.35
2 Basogigus 77.61±0.60 18.91±0.68 3.01±0.18 2.04±0.25
3 Chelidoperca investigatoris 81.07±0.44 15.91±0.40 3.13±0.27 1.47±0.25
4 Tricurus 79.57±0.60 16.77±0.41 2.65±0.19 1.90±0.35
5 Alepocephalus 81.10±0.22 14.10±0.46 3.08±0.22 1.92±0.27
6 Beryx splendens 78.05±0.44 16.42±0.26 3.13±0.23 1.90±0.23
7 Bembrops caudimacula 77.99±0.52 16.82±0.41 3.45±0.16 1.57±0.16
Note: n=5, mean±SE
Heavy metal accumulation of deep-sea fish muscle
Among the six metals in the current study, copper content was found more in Neobyticus followed by C. investigates and Basogigus whereas less amount of copper was found in B. splendens. Zinc was found more in B. splendens followed by A. bicolor and B. caudimacula
while less content of zinc was observed in Basogigus. More amount of iron was accumulated in B. splendens followed by B. caudimacula and Tricurus whereas lowest iron concentration was observed in C. investigatoris.
www.ijmer.in 83

INTERNATIONAL JOURNAL OF MULTIDISCIPLINARY EDUCATIONAL RESEARCH
ISSN : 2277-7881; IMPACT FACTOR – 4.527; IC VALUE:5.16; ISI VALUE:2.286 VOLUME 6, ISSUE 8(2), AUGUST 2017
Table 3: Heavy metal accumulation in deep-sea fishes Species name Cu Zn Fe Co Cd Pb Neobyticus 24.38±0.
86 17.73±0.
48 31.39±1.
38 0.25±0.
09 0.03±0.
01 BDL
Basogigus 21.55±0.62
17.35±1.62
31.85±0.96
2.66±0.19
BDL BDL
Chelidoperca investigatoris
23.76±0.69
18.34±0.95
30.47±1.70
0.60±0.30
BDL BDL
Tricurus 18.15±1.13
22.96±0.58
33.58±1.11
0.19±0.03
BDL BDL
Alepocephalus bicolor 19.03±0.95
24.81±0.91
30.88±2.40
2.87±0.54
BDL BDL
Beryx splendens 15.54±0.69
28.31±0.32
49.80±0.84
BDL BDL BDL
Bembrops caudimacula
19.23±2.05
23.14±4.09
37.03±0.96
0.97±0.20
BDL BDL
Note: n=5, mean±SE
Cobalt was accumulated more in A. bicolor followed by Basogigus and B. caudimacula, while less amount of iron takes place in Tricurus and cobalt was in below detectable level in the species of B.
splendens. Cadmium was found only in Neobyticus and in remaining all six deep-sea fish species, this metal was in below detectable level. Lead was the metal which observed in below detectable level in all the given seven deep-sea fish species. In overall metal accumulation, iron content found more followed by zinc, copper cobalt and cadmium, whereas lead was in below detectable level in all the given seven fish species. In overall species wise, B. splendens accumulated more percentage of metals followed by B. caudimacula and A. bicolor (table 3). A
significant (p<0.05) value was observed within the species and significant difference was observed in between the deep-sea species respectively.
Discussion
Seafood are an significant fraction of a healthy diet where they have high quality protein and other indispensable nutrients can be low in saturated fatty acids and may contain omega-3 fatty acids (Geetha
www.ijmer.in 84
INTERNATIONAL JOURNAL OF MULTIDISCIPLINARY EDUCATIONAL RESEARCH
ISSN : 2277-7881; IMPACT FACTOR – 4.527; IC VALUE:5.16; ISI VALUE:2.286 VOLUME 6, ISSUE 8(2), AUGUST 2017
2016). Proximal chemical composition in crustacean muscle were governed by many factors, including species, growth stage, feed and season (Yanar et al 2004; Rao 2016). The moisture content was between 77.61% and 81.10%, protein content was between 14.10% and 18.91%,
fat content ranged from 2.30% to 3.45% and ash was from 1.47to 2.04%. This result is similar to the proximate test results for deep-sea fish species reported previously (Okland et al 2005). The protein contents of the deep-sea fishes examined were similar to commercially important fish species from the Black Sea previously reported by Guner et al. (1998), as well as to that reported by Okland et al. (2005). Protein is the most important constituent in seafood from the nutritional point of view. However, compared to finfish species, shell fish falls under lower protein category, the range being 5-14% (Balachandran 2001). Fats are
the primary energy storage material in fish (Tocher 2003).
Lipid content is a good index of future survival in some species (Simpkins 2003) and a strong indicator of reproductive potential in some fish stocks (Marshall 1999). In the present study, the given seven deep-sea fish species recorded high protein content and contained considerable levels of fat. The higher fat content in some species of fish is of nutritional value as that support protective effect against coronary heart disease due to the presence of marine omega-3 fatty acids (Alonso 2003). The fat content in the species Alepocephalus bicolor was higher than reported previously by Ozagul and Ozagul (2007) but was lower than that reported by Guner et al. (1998). Lipid levels and fatty acid composition vary with species, sex, age, season of the year, food
availability, salinity and water temperature (Stansby 1981). Ash is a measure of the mineral content of any food including fish (Omotosho et al 2011). The ash content changes with the time of storage due to absorbance of moisture and loss of protein (Hassan 2013). Smaller sized fish species show higher ash content due to the higher bone to flesh ratio (Daramola 2007).
www.ijmer.in 85

INTERNATIONAL JOURNAL OF MULTIDISCIPLINARY EDUCATIONAL RESEARCH
ISSN : 2277-7881; IMPACT FACTOR – 4.527; IC VALUE:5.16; ISI VALUE:2.286 VOLUME 6, ISSUE 8(2), AUGUST 2017
The results of heavy metal analysis indicated that heavy metal accumulation varied among the fish species. Deep-sea fish species were collected from the west coast waters contained significantly higher in B. splendens, B. caudimacula and A. bicolor than the other species. The
levels of heavy metal accumulation in fish depend on the growth rate, metabolism, feeding pattern and ecological requirements of a given fish species (Yilmaz et al 2005; Yilmaz et al 2010). Another factor is the differences in life history patterns among species (including trophic levels and geographical distribution of life stages), which influence their exposure to heavy metals (Allen-Gil and Martynov 1995). Copper is an essential element, it is very toxic and, the Maximum permissible limit of Cu is 100 g/g (Mokhtar 2009). However, a high intake of Cu has been recognized to cause adverse health problems (Gorell et al 1997).
Copper level in the present study indicates much lower mean value in muscle. Nickel can cause respiratory problems and it is carcinogenic, its acute toxicity arises from competitive interaction with five major essential elements namely: cadmium, cobalt, copper, iron and zinc (Moore and Ramamoorthy, 1985).
Cadmium level in the present study indicates lower mean value in muscle. The Maximum permissible limit of Fe in fish muscle is 333.33 g/g (Mokhtar 2009), our results indicate much lower values for Fe. Cobalt is beneficial for humans because it is part of vitamin B12. Exposure to high levels of cobalt can result in lung and heart effects and dermatitis, cobalt concentrations in the literature have been reported in the range of 0.02 - 0.67 mg/kg for muscles of fish from the fish markets in India (Dalman et al 2006). The muscle concentration of
nonessential element Pb in all fish samples was below the detection limit. Turkish Food Codex (Anonymous 2008) and Commission Regulation (EC) (Anonymous 2006) indicate that maximum level is 0.30 mg/kg wet wt. for Pb. The nominal differences noticed in the accumulation of metals between the deep-sea fishes could be attributed
www.ijmer.in 86

INTERNATIONAL JOURNAL OF MULTIDISCIPLINARY EDUCATIONAL RESEARCH
ISSN : 2277-7881; IMPACT FACTOR – 4.527; IC VALUE:5.16; ISI VALUE:2.286 VOLUME 6, ISSUE 8(2), AUGUST 2017
to the variability of feeding habits (Romeo et al 1999), ecological needs, metabolism (Canli and Furness 1993), age and size of the species (Linde et al 1998) and their habitats (Tuzen and Soylak 2007).
The current study provides information on proximal chemical composition and heavy metal accumulation of some selected deep-sea fish species. The results indicated that the given deep-sea fishes analysed contain significant protein percentage and hence can be exploited commercially for meeting nutritional necessities. Heavy metal concentrations determined were within the regulatory limits representing that the fishes off deeper waters does not pose any threat to consumers. The findings of the study are important in the perspective of exploring deep sea resources as edible seafood.
Acknowledgements
The financial assistance from the Ministry of Earth Sciences (MoES), Govt. of India is gratefully acknowledged. The authors are indebted to The Director, ICAR - Central Institute of Fisheries Technology and Director, CMLRE for giving an opportunity to work in this project. Thanks are also due to the Chief Scientists, fellow participants, fishing masters and fishing hands of the cruise no. 322
and 328 of FORV Sagar Sampada.
References
2. Venugopal V, Chawla SP, Nair PM. Spray dried protein powder from threadfin beam: preparation, properties and comparison with FPC type-B. J. Muscle Foods. 1996; 7: 55-71.
3. Yanez E, Ballester D, Monckeberg F. Enzymatic fish protein hydrolyzate: Chemical composition, nutritive value and use as a supplement to cereal protein. J. Food Sci. 1976; 41: 1289-1292.
4. Pigott GM, Tucker BW. Seafood: Effects of Technology on nutrition, Marcel Dekker, Inc., New York and Basel, 1990; 362 pp.
5. Nagabhushanam R, Mane VH. Seasonal variation in the biochemical composition of Perna viridis at Ratnagiri on the West Coast of India. Hydrobiologia. 1978; 57(3): 69-72.
www.ijmer.in 87
INTERNATIONAL JOURNAL OF MULTIDISCIPLINARY EDUCATIONAL RESEARCH
ISSN : 2277-7881; IMPACT FACTOR – 4.527; IC VALUE:5.16; ISI VALUE:2.286 VOLUME 6, ISSUE 8(2), AUGUST 2017
6. Bailey TG, Robison BH. Food availability as a selective factor on the
chemical compositions of midwater fishes in the eastern North Pacific. Mar Bio. 1986; 91 (1), 131–141.
7. Childress JJ, Nygaard MH. The chemical composition of midwater fishes as a function of depth of occurrence off southern California. Deep-Sea Res. 1973; 20 (12), 1093–1109.
8. Stickney DG, Torres JJ. Proximate composition and energy content of mesopelagic fishes from the eastern Gulf of Mexico. Mar Bio. 1989; 103 (1), 13–24.
9. Childress JJ, Price MH, Favuzzi JA, Cowles DL. Chemical composition of midwater fishes as a function of depth occurrence off the Hawaiian Islands: food availability as a selective factor. Mar Bio. 1990b; 105, 235–246.
10. Childress JJ. Respiratory rate and depth of occurrence of midwater animals. Limnol Oceanogr. 1971; 16, 104–106.
11. Torres JJ, Belman BW, Childress JJ. Oxygen consumption rates of midwater fishes as a function of depth of occurrence. Deep-Sea Res. 1979; 26, 185–197.
12. Teal J. Pressure effects on the respiration of vertically migrating decapod crustacea. American Zoologist. 1971; 11, 571–576.
13. Meek RP, Childress JJ. Respiration and the effect of pressure in the mesopelagic fish Anoplogaster cornuta (Beryciformes). Deep-Sea Res. 1973; 20, 1111–1118.
14. Childress JJ, Cowles DL, Favuzzi J, Mickel TJ. Metabolic rates of benthic deep-sea decapod crustaceans decline with increasing depth primarily due to the decline in temperature. Deep-sea Res. 1990a; 37 (6), 929–949.
15. Zhang Z, He L, Li J, Wu ZB. Analysis of heavy metals of muscle and intestine tissue in fish in Banan section of Chongqing from three Gorges reservoir, China.. Polish J. Environ. Stud. 2007; 16, 949–958.
16. Mormede S, Davies IM. Trace elements in deep-water fish species from the Rockall Trough. ref. 2001; FISH 1200.
17. More TG, Rajput RA, Bandela NN. Impact of heavy metals on DNA content in the whole body of freshwater bivalve, Lamelleiden marginalis. Environ. Sci. Pollut. Res., 2003; 22: 605- 616.
18. Firat O, Kargm F. Biochemical alterations induced by Zn and Cd individually or in combination in the serum of Oreochroms niloticu. Fish Physiol. Biochem. 2010; 36: 647-653.
www.ijmer.in 88

INTERNATIONAL JOURNAL OF MULTIDISCIPLINARY EDUCATIONAL RESEARCH
ISSN : 2277-7881; IMPACT FACTOR – 4.527; IC VALUE:5.16; ISI VALUE:2.286 VOLUME 6, ISSUE 8(2), AUGUST 2017
19. Goodwin TH, Young AR, Holmes MGR, Old GH, Hewitt N, Leeks
GJL, Packman JC, Smith BPG. The temporal and spatial variability of sediment transport and yields within the Bradford Beck catchment, West Yorkshire. Sci. Total Environ. 2003; 314-316: 475–494.
20. Kargin F. Seasonal changes in levels of heavy metals in tissues of Mullus barbatus and Sparus aurata collected from Iskenderum Gulf (Turkey). Water Air Soil Poll. 1996; 90: 557-562.
21. Begum A, Harikrishna S, Khan I. Analysis of heavy metals, sediments and fish samples of madivala lakes of Bangalore, Karnataka. Int. J. Chem. Tech. Res. 2009; 1(2): 245-249.
22. Nybakken JW. Marine Biology. An Ecological Approch. Jakarta: Publisher Gramedia. 1992.
23. Suseno SH, Tajul AY, Nadiah WA, Hamidah A, Ali S. Proximate, fatty acid and mineral composition of selected deep sea fish species from Southern Java Ocean and Western Sumatra Ocean, Indonesia. Int Food Res J. 2010; 17: 905-914.
24. Perkins, C (Ed). Seafood Handbook, The Advanced, Selling The Benefit; Taste, Nutrition and Safety. Rockland, Maine, USA. 1992.
25. Anonymous. The Secret of Deep Sea. http:// desslosqualene.tripod.com/. [8 December 2004]. 2004.
26. Soselia J, Rustam R. The Research of deep-sea fish in Tanimbar Ocean. J Mar Fish Res. 1993; 80: 57-62.
27. AOAC. Official Methods of Analysis, 15th edn., Association of Official Analytical Chemists, Washington, DC, USA. 1990.
28. Bligh EG, Dyer WJ. A rapid method of total lipid extraction and purification. Can. J. Biochem. Physiol. 37: 911-917, 1959.
29. AOAC. Official methods of analysis of the Association of Analytical Chemists. (17th edn). AOAC International USA. 2000.
30. Sokal RR, Rohlf FJ. Biometry. Second edition. W. H. Freeman, San Francisco, California, USA. 1981.
31. Geetha S, Muddula Krishna N, Rushinadha Rao Kakara, Govinda Rao V, Ramesh Babu K. Microbial assessment of commercially important crabs from Visakhapatnam fishing harbour, east coast of India. Eur J Exp Biol. 2016; 6(4):57-61.
32. Yanar Y, Celik M, Yanar M. Seasonal changes in total carotenoid contents of wild marine shrimps (Penaeus semisulcatus and Metapenaeus monoceros) inhabitating the Eastern Mediterranean. Food Chem. 2004; 88: 267-269.
www.ijmer.in 89

INTERNATIONAL JOURNAL OF MULTIDISCIPLINARY EDUCATIONAL RESEARCH
ISSN : 2277-7881; IMPACT FACTOR – 4.527; IC VALUE:5.16; ISI VALUE:2.286 VOLUME 6, ISSUE 8(2), AUGUST 2017
33. Rao KR, Viji P, Sreeramulu K, Sreedhar U. Proximate Composition
and Heavy Metal Accumulation in Deep-Sea Crustaceans from Selected Stations in the Indian Exclusive Economic Zone (EEZ). Fish. Tech. 2016; 53 (2): 155-161.
34. Okland HMW, Stoknes IS, Remne JF, Kjerstad M, Synnes M. Proximate composition, fatty acid and lipid class composition of the muscle from deep-sea teleosts and elasmobranches. Comp. Biochemistry and Physiology Part B. 2005; 140: 437-443.
35. Guner S, Dincer B, Alemdag N, Colak A, Tufekci M. Proximate composition and selected mineral content of commercially important fish species from the Black Sea. J Sci Food Agric. 1998; 78: 337-342.
36. Balachandran KK. Post-harvest technology of fish and fish products. Daya Publishing House, Delhi. 2001; 77-103.
37. Tocher D. Metabolism and functions of lipids and fatty acids in teleost fish. Rev Fish Sci. 2003; 11(1):107-184.
38. Simpkins DG, Hubert WA, Del Rio CM, Rule DC. Physiological responses of juvenile rainbow trout to fasting and swimming activity: effects on body composition and condition indices. T Am Fish Soc. 2003; 132:576-589.
39. Marshall WL, Cripps E, Anderson D, Cortoni F. Selfesteem and coping strategies in child molesters. J Interpers. Violence. 1999; 14(9):955-962.
40. Alonso A, Martinez-Gonzalez MA, Serrano-Martinez M. Fish omega-3 fatty acids and risk of coronary heart disease. Medicina Clínica, 2003; 121(1):28-35.
41. Ozagul, Y. Ozagul, H. Fatty acid profiles of commercially important fish species from the Mediterranean, Aegean and Black Seas. Food Chem. 2007; 100: 1634-1638.
42. Stansby ME. Reliability of fatty acids purporting to represent composition of oil from different species of fish. J. Am. Oil Chem. Soc. 1981; 58: 13-16.
43. Omotosho OE, Oboh G, Jweala EEJ. Comparative effects of local coagulants on the nutritive value, in vitro multi enzyme protein digestibility and sensory properties of Wara cheese. Int. J Dairy Sci. 2011; 6:58-65.
44. Hassan MN, Rahman M, Hossain MM. Nowsad, A.A.K.M. and Hossain, M.B., Post-Harvest Loss and Shelf Life of Traditionally
www.ijmer.in 90

INTERNATIONAL JOURNAL OF MULTIDISCIPLINARY EDUCATIONAL RESEARCH
ISSN : 2277-7881; IMPACT FACTOR – 4.527; IC VALUE:5.16; ISI VALUE:2.286 VOLUME 6, ISSUE 8(2), AUGUST 2017
Smoked Shrimp Products Produced in Bangladesh. World J of Fish. Marine Sci. 2013; 5(1):14-19.
45. Daramola JA, Fasakin EO, Adeparusi EO. (Changes in physicochemical and sensory characteristics of smokedried fish species stored at ambient temperature. African J Food and Agri., Nutri. and Devel. 2007; 7(6):169-18.
46. Yilmaz F, Nozdemir N, Demirak A, Tuna AL. Heavy metal levels in two fish species Leuciscus cephalus and Lepomis gibbosus. Food Chem. 2005; 100(2007): 830–835.
47. Yilmaz AB, Sangün MK, Yaglıoglu D, Turan C. Metals (major, essential to non-essential) composition of the different tissues of three demersal fish species from İskenderun Bay, Turkey. Food Chem. 2010; 123(2): 410–415.
48. Allen-Gil SM, Martynov VG. Heavy metal burdens in nine species of freshwater and anadromous fish from the Pechora River, northern Russia. Sci Total Environ. 1995; 160/161: 653–659.
49. Mokhtar M. Assessment Level of Heavy Metals in Penaeus monodon and Oreochromis spp. in Selected Aquaculture Ponds of High Densities Development Area. European Journal of Scientific Research. 2009; 30: 348-360.
50. Gorell JM, Johnson CC, Rybicki BA, Peterson EL, Kortsha GX, Brown GG. Occupational Exposures to Metals as Risk Factors for Parkinson’s Disease. Neurology. 1997; 48, 650-658. http://dx.doi.org/10.1212/WNL.48.3.650
51. Moore JW, Ramamoorthy S. Heavy Metals in Natural Waters. Springer-Verlag, New York. 1985.
52. Dalman O, Demirak A, Balci A. Determination of Heavy Metals (Cd, Pb) and Trace Elements (Cu, Zn) in Sediments and Fish of the Southeastern Aegean Sea (Turkey) by Atomic Absortion Spectrometry. Food Chem. 2006; 95, 157-162. http://dx.doi.org/10.1016/j.foodchem.2005.02.009
53. Anonymous. Official Gazette of Republic of Turkey. Notifications about maximum levels for certain contaminants in foodstuffs (in Turkish). Turkish Food Codex No 2008 / 26, Issue: 26879. 2008.
54. Anonymous. Official Journal of the European Union. Setting maximum levels for certain contaminants in foodstuffs. Commission Regulation (EC) No 1881/2006: 364: 5-24. 2006.
www.ijmer.in 91

INTERNATIONAL JOURNAL OF MULTIDISCIPLINARY EDUCATIONAL RESEARCH
ISSN : 2277-7881; IMPACT FACTOR – 4.527; IC VALUE:5.16; ISI VALUE:2.286 VOLUME 6, ISSUE 8(2), AUGUST 2017
55. Romeo M, Siau Y, Sidoumou Z, Gnassia-Barelli M. Heavy metal
distribution in different fish species from the Mauritania coast. Sci. Total Environ. 1999; 232: 169-175
56. Canli M, Furness RW. Toxicity of heavy metals dissolved in seawater and influences of sex and size on metal accumulation and tissue distribution in the Norway lobster Nephrops norvegicus. Mar. Environ. Res. 1993; 36: 217-236.
57. Linde AR, Sanchez-Galan S, Izquierdo JI, Arribas P, Maranon E, Garcya-Vazquez E. Brown Trout as biomonitor of heavy metal pollution: effect of age on the reliability of the assessment. Ecotox. Environ. Safe. 1998; 40: 120-125.
58. Tuzen M, Soylak M. Determination of trace metals in canned fish marketed in Turkey. Food Chem. 2007; 101: 1378-1382.
www.ijmer.in 92

INTERNATIONAL JOURNAL OF MULTIDISCIPLINARY EDUCATIONAL RESEARCH
ISSN : 2277-7881; IMPACT FACTOR – 4.527; IC VALUE:5.16; ISI VALUE:2.286 VOLUME 6, ISSUE 8(2), AUGUST 2017
HEAVY METALS ACCUMULATION IN THE SELECTED FOOD FISHES FROM NIZAMPATNAM COAST, ANDHRAPRADESH,
INDIA
K. Prabhavathi, P.V Krishna* and V. Panchakshari. Department of Zoology & Aquaculture, Acharya Nagarjuna University,
Nagarjuna Nagar – 522 510, Andhra Pradesh., India. *Email: [email protected]
ABSTRACT
Environmental pollution is currently major concern due to unorganized and increased industrial and anthropogenic activities. The release of heavy metals as byproducts of industrialization and consequent contamination of water waste into which the effluents are released and created great health hazards in aquatic organisms particularly fishes. A study was conducted between June, 2014 to May, 2015 to assess the concentration of Cu, Cr, Pb, Zn and Mn in muscle, liver, and gill tissue of selected food fishes Mugil cephalus and Sillago sihama from Nizampatnam coast, Andhra Pradesh. Heavy metals
disposed anthropogenic activities find their way into the oceans through the creeks, canals and rivers are through direct fallout from industrial effluents. These heavy metals resuspend back into water column along with the sediments and are known to effect on the marine organisms. In the present study to evaluate the metal concentrations in gut contents, gills and muscle of selected food fishes. The concentration of metals in the gut contents was significantly higher than that of the gills (p<0.05) and followed by muscles. The highest metal concentrations found in the organisms of the fishes which leads to the oxidative stress shorten the life span of the fishes are postulated primary result of anthropogenic activities. Shrimp effluents, sewage water, and pollutants from local industries and shipping activities in this area. Among the species Sillago sihama represented the lowest
level of heavy metals.
Key words: Heavy metals, food fishes, Nizampatnam coast.
www.ijmer.in 93

INTERNATIONAL JOURNAL OF MULTIDISCIPLINARY EDUCATIONAL RESEARCH
ISSN : 2277-7881; IMPACT FACTOR – 4.527; IC VALUE:5.16; ISI VALUE:2.286 VOLUME 6, ISSUE 8(2), AUGUST 2017
Introduction
Heavy metals are considered as critical toxic contaminants of aquatic ecosystems, due to their high potential to enter and accumulate in food chain. They occur in the environment both as a result of natural processes and as pollutants from human activates ( Jorda et al 2002). Some metals like Zn and Cu, which are required for metabolic activity in organisms, lie in the narrow window between their essentiality and toxicity, other heavy metals like Cd and Pb, may exhibit extreme
toxicity even at low levels under certain conditions, thus necessitating regular monitoring of sensitive aquatic environment. From an environmental point of view, coastal zones can be considered as the geographic space of interaction between terrestrial and marine ecosystems that is of great importance for the survival of a large variety of plants, animals, and marine species (Castro et al., 1999). The coastal zone receives a large amount of metal pollution from agricultural and industrial activity (Usero et al., 2005). Adverse anthropogenic effects on the coastal environment include eutrophication, heavy metals, organic and microbial pollution, and oil spills (Boudouresque and Verlaque 2002). The discharge of these wastes without adequate treatment often contaminate the estuarine and coastal water with conservative pollutants (like heavy metals), many of which accumulate in the tissues of resident organisms like fishes, oysters, crabs, shrimps, seaweeds etc. In many parts of the world, especially in coastal areas and on smaller
islands, shellfish is a major part of food, which supplies all essential elements required for life processes in a balanced manner. Hence, it is important to investigate the levels of heavy metals in these organisms to assess whether the concentration is within the permissible level and will not pose any hazard to the consumers (Krishnamurti and Nair 1999). The lower stretch of the River Krishna (known as Krishna estuary) sustains several species of finfish and is the breeding ground of commercially important fin and shellfish.
www.ijmer.in 94

INTERNATIONAL JOURNAL OF MULTIDISCIPLINARY EDUCATIONAL RESEARCH
ISSN : 2277-7881; IMPACT FACTOR – 4.527; IC VALUE:5.16; ISI VALUE:2.286 VOLUME 6, ISSUE 8(2), AUGUST 2017
The main sources of heavy metal pollution of the agriculture, industry and metropolitan cities, the bioaccumulation of toxic heavy metals in fish species from different aquatic systems is dependent on their foreign polluted substances. The distribution of heavy metals in water, sediments and fish play a key role in detecting sources of heavy metal pollution in aquatic ecosystem. According to World Health
Organization (1991), metal occur inless than 1% of the earths crust, with trace amounts generally found in the environment and when these concentrations exceed a stipulated limit, they may become toxic to the surrounding environment and when these concentrations exceed a stipulated limit, they may become toxic to the surrounding environment (WHO,1991). From an environmental point of view, coastal zones can be considered as the geographic space of interaction between terrestrial and marine species. The coastal zones are received a large amount of metal pollution from agricultural runoff, aquaculture chemicals, and other industrial activities. Adverse anthropogenic effects on the coastal environment include eutrophrication, heavy metals, organic and microbial pollution, and port activities. The discharge of these wastes without adequate treatment often contaminate the estuarine and coastal waters with conservative pollutants (like heavy metals), many of which accumulate in the tissues of the resident
organisms like fishes and other aquatic organisms.
Fish, as human food, are considered source of protein, polyunsaturated fatty acids particularly omega-3 fatty acids, Calcium, Zinc and Iron (Chan et al ., 1999). And it is considered one of the high nutrient sources for humans that contribute the lower the blood cholesterol and reduce the risk of stroke and heart diseases (Storelli 2008.,Al.Busaidi et al.,2011). Among the aquatic fauna, fish is most susceptible to heavy metal contamination than any other aquatic fauna. It is well known that fish are good indicator of chemical pollution and as a result they long been used to monitor metal pollution in coastal
www.ijmer.in 95

INTERNATIONAL JOURNAL OF MULTIDISCIPLINARY EDUCATIONAL RESEARCH
ISSN : 2277-7881; IMPACT FACTOR – 4.527; IC VALUE:5.16; ISI VALUE:2.286 VOLUME 6, ISSUE 8(2), AUGUST 2017
and marine environment. So, fishes were considered as better specimens for use in the investigation of pollution load than the water sample because of the significant levels of metals they bioaccumulate. The aquatic systems deposition of contaminants, including heavy metals, can lead to elevated sediment concentrations that cause potential toxicity of the aquatic biota (Yang and Rose 2003). Hence,
harmful substances like heavy metals, released by anthropogenic activities will be accumulated in marine organisms through the food chain; as result, human health can be at risk because of consumption of fish contaminated by toxic chemicals.
Keeping in view of the potential toxicity, persistent nature, as well as the environmental pollution, it is deemed necessary to have the base line environmental data on potential metal contamination so that pollutants can be judged in the environment. This paper presents the data on heavy metal (Zn, Pb, Mn, Cu, Cr) concentration in fish, Mugil cephalus and Sillago sihama from Nizampatnam coast.
Materials and Methods
Water and fish samples collected from fish landing centre, at Nizampatnam. The fish samples transported to the laboratory in ice
boxes and stored at -10°C until subjected for future analysis. The fishes were dissected and care was taken to avoid external contaminated to the samples. Rust free stainless steel kit was sterilized to dissect the fishes. Double distilled water was used for making up the sample and for analysis in the Atomic Absorption Spectrophotometer (ASS). The gut content, gill and muscles were separated and dried to constant weight and both wet and dry weight recorded. 25% was used as blank samples accompanied every run of the analysis. Each sample was analyzed in triple to ensure accuracy and precession for the analytical procedure.
www.ijmer.in 96
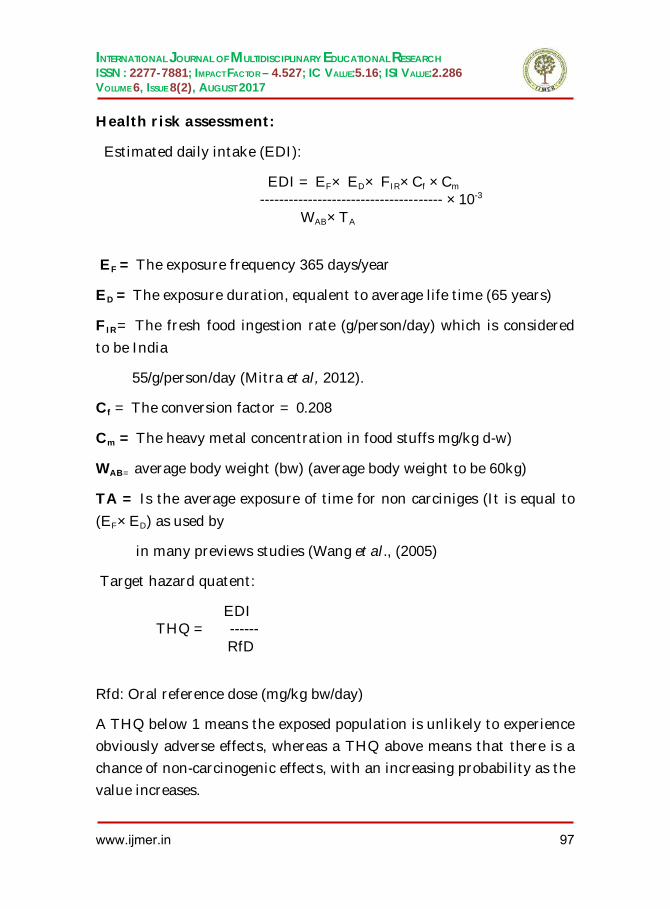
INTERNATIONAL JOURNAL OF MULTIDISCIPLINARY EDUCATIONAL RESEARCH
ISSN : 2277-7881; IMPACT FACTOR – 4.527; IC VALUE:5.16; ISI VALUE:2.286 VOLUME 6, ISSUE 8(2), AUGUST 2017
Health risk assessment:
Estimated daily intake (EDI):
EDI = EF× ED× FIR×Cf ×Cm
-------------------------------------- ×10-3
WAB×TA
EF = The exposure frequency 365 days/year
ED = The exposure duration, equalent to average life time (65 years)
FIR= The fresh food ingestion rate (g/person/day) which is considered
to be India
55/g/person/day (Mitra et al, 2012).
Cf = The conversion factor = 0.208
Cm = The heavy metal concentration in food stuffs mg/kg d-w)
WAB= average body weight (bw) (average body weight to be 60kg)
TA = Is the average exposure of time for non carciniges (It is equal to
(EF×ED) as used by
in many previews studies (Wang et al., (2005)
Target hazard quatent:
EDI THQ = ------ RfD
Rfd: Oral reference dose (mg/kg bw/day)
A THQ below 1 means the exposed population is unlikely to experience obviously adverse effects, whereas a THQ above means that there is a chance of non-carcinogenic effects, with an increasing probability as the value increases.
www.ijmer.in 97

INTERNATIONAL JOURNAL OF MULTIDISCIPLINARY EDUCATIONAL RESEARCH
ISSN : 2277-7881; IMPACT FACTOR – 4.527; IC VALUE:5.16; ISI VALUE:2.286 VOLUME 6, ISSUE 8(2), AUGUST 2017
Results and Discussion:
The purpose of this work to determined the presence of a particular group of metals in the water ecosystem of the Nizampatnam harbor area. Heaving record to the possibility of bioaccumulation of these metals in tissues of living organisms, including fish it was necessary to find out whether the metals determined in the water samples were to be accumulated in the fish fillet (Edible parts), the risk imposed on a local population was evaluated. The research presented herein had been
conducted in the determination heavy metals concentration in fish fillet (Muscle) sample.
Heavy metals in fishes:
The mean concentrations of heavy metal in fishes Mugil cephalus and Sillago sihama are presented in Fig1 to 3. The order of heavy metal concentration was Zn>Pb> Cu>Cr>Mn. This data indicated Zinc accumulated.
Zinc (Zn):
Zinc is an essential element in animals’ diet but it is regarded as potential hazard for both animals and human health (Amundsen et al., 1997). Insignificant seasonal variation is observed with slight higher concentration during monsoon season. Zinc is present in natural water only as a miner consultant because lack of solubility of free metal and its oxides (David et al., 1970). It is a very high concentration only it may
causes some toxic effects. A normal human body contains 1.4 to 2.3 g of Zinc. Recommend daily dietary intake of Zin is about 15mg for adults and 100mg for children over a year old. The average diary intake of zinc is India is about 16.1mg (Krishnan, 1995). It is relatively non toxic and concentrations of zinc up to 25mg/l have shown few adverse effects (Mc Neely et al., 1979). Zinc may be toxic aquatic organisms but the degree of toxicity varies greatly, depending on water quality characteristics as well as species being considered (Datar and Vashshtha, 1990). The
www.ijmer.in 98

INTERNATIONAL JOURNAL OF MULTIDISCIPLINARY EDUCATIONAL RESEARCH
ISSN : 2277-7881; IMPACT FACTOR – 4.527; IC VALUE:5.16; ISI VALUE:2.286 VOLUME 6, ISSUE 8(2), AUGUST 2017
present study shows that the average concentration 32mg/kg of Zn much higher than standards of WHO (1985).
Lead (Pb):
Pb is considered as a toxic but non-essential metal implying that it has no known function in the biochemical processes (Adeyeye et al., 1996). Lead enters the aquatic environment through soil erosion and leaching
gasoline combustion, municipal and industrial wastes and runoff. Pregnant women exposed to lead were found to have high rates of still births and miscarriages (WHO, 1973). Lead has caused mental retardation among children. Hyper tension caused by Pb exposure has also been reported (Beevens et al 1976). Lead poising is a accompanied by symptoms of intestinal cramps, peripheral nerve paralysis anemia, and fatiage (Umar et al., 2001). The concentration of lead in natural water increases mainly through anthropogenic activities (Goel, 1997).
In the present study Pb concentration goes to 8.5 to 9.5/kg in the muscle of both fishes, liver goes to in between 9.5 to 10.6 mg/kg body weight of the fishes. According to WHO (1985) the maximum accepted
limit is 2mg/kg for food fish. The present results indicated That concentration levels of Pb was mostly higher than the permissible limits set for human consumption by various regulatory agencies and therefore indicated possible health risks associated with consumption of these fish. At high levels of Pb exposure these is damaged to almost all organ systems. Most importantly the central nervous system Kidneys, and blood, culminating in death, if levels are excessive. At low levels, haeme synthesis and other biochemical processes are affected and psychological and neurobehavioral functions are impaired (Gold stein, 1992; WHO, 1995).
Manganese (Mn): Manganese is an essential micro nutrient, as it
functions as a co factor for many enzyme activities (Suresh et al., 1999). High Mn concentration interferes with central nervous system of
www.ijmer.in 99

INTERNATIONAL JOURNAL OF MULTIDISCIPLINARY EDUCATIONAL RESEARCH
ISSN : 2277-7881; IMPACT FACTOR – 4.527; IC VALUE:5.16; ISI VALUE:2.286 VOLUME 6, ISSUE 8(2), AUGUST 2017
vertebrates by inhibiting dopamine formation as well as interfere ring with other metabolic pathways such as Na regulation which ultimately can cause death. High Mn levels are a matter of concern as the consumption of Mn contaminated fish could result in the Mn related disorders in the consumers. In the present study manganese goes to 2.5 to 2.9 mg/kg in the fish muscle which is higher than the permissible
limits set by WHO, (1985).
Copper (Cu): Copper in aqueous systems received attention mostly
because of its toxic effects on biota. Excess of Cu in human body is toxic and hypertension and causes some disorders. Cu also produces pathological changes in brain tissues (Kudesia, 1990). The average concentration of cu in the present study goes to 5.1 to 5.5mg/kg in fish muscle who is above permissible limits.
Chromium (Cr):Chromium concentration is natural waters is usually
very small. Elevated concentration can result from industrial and mining processes (Datar and Vashishtha, 1990) .Fish are usually more resistant to Cr than other aquatic organisms, but they can be affected sub-lethally where exposed to concentration increases. In the present study Cr also above permissible levels set by WHO (1985).
The increasing demand of food safety has accelerated researching regarding the risk associated with food consumption contaminated by heavy metal (Mansour et al., 2009).. Lon term intake of contaminated sea food could lead to toxicity of heavy metals in human beings. There
are reports of high levels of heavy metals are natural components of food stuffs but also because of environmental contamination and contamination during processing(Kalay et al., 1999). Indudustrial effluents agriculture runoff, Aquaculture chemicals and drugs, animal and human excretion, and geological weathering and domestic waste contribute to the heavy metal in the water bodies (Erdogrul and Erbilir, 2007) .With the exception of occupational exposure, fish are
www.ijmer.in 100

INTERNATIONAL JOURNAL OF MULTIDISCIPLINARY EDUCATIONAL RESEARCH
ISSN : 2277-7881; IMPACT FACTOR – 4.527; IC VALUE:5.16; ISI VALUE:2.286 VOLUME 6, ISSUE 8(2), AUGUST 2017
acknowledge to be single largest source of mercury and other heavy metals (lead and chromium) affecting human beings. Lead poisoning in children causes neurological damage leading to reduced intelligence, loss of short-term memory, learning disabilities and coordination problems. The threat of heavy metal to human and animal health is aggravated by their long-term persistence in the environment (Girbert
et al., 2000) .Further, the heavy metals causing concern is that they may be transferred and accumulated in the bodies of animals or human beings through food chain, which will probably cause DNA damage and carcinogenic effects due to their mutagenic ability (Knasmuller et al., 1998) .Heavy metal exposure of the population may cause neurobehavioral disorders. Such as fatigue insomnia decreased concentration, depression, irritability, sensory and motor symptoms (Hanninen and Lindstrom, 1979). Exposure to heavy metals has been
linked to developmental retardation, various types of cancer, kidney damage, autoimmunity and even death in some instances of exposure to very high concentrations (Rai, 2009). In some cases fish catches were
banned for human consumption because their heavy metal concentrations exceeded the maximum limits recommended by the Food and Agriculture organization (FAO) and world health
organization (WHO). Among sea foods, fish are commonly consumed and hence, are a connecting link for the transfer of toxic heavy metals in human beings. Bhuvaneshwari et al., (2012). Concluded that the metals are an inherent component of the environment that pose a potential hazard to human beings and animals. The consumption of fish from the polluted site may result in accumulation of persistent pollutants in ultimate recent of food web. The effluents from the textile factory, the tannery, and the floriculture farm probably contain harmful contaminants such as dye stuffs, bonzothiozole, sulphonated polyphenols and pesticides. These compounds could bioaccumulate and affect the health of aquatic organisms and subsequently, the health of
www.ijmer.in 101

INTERNATIONAL JOURNAL OF MULTIDISCIPLINARY EDUCATIONAL RESEARCH
ISSN : 2277-7881; IMPACT FACTOR – 4.527; IC VALUE:5.16; ISI VALUE:2.286 VOLUME 6, ISSUE 8(2), AUGUST 2017
humans, as consumers of these fish (Dsikozsitzky et al.,2013). In the present study Machilipatnam coast also effected also effected pollutants particularly dyes factory, agriculture, and aquaculture chemicals. Kularatne et al., (2017) discussed bioaccumulation and temporal variation of heavy metals in three edible lagoon fish species with references to gender. Cd and as were undetected in the three fish
species. Generally, gills are a major route of metal ion exchange or adsorption from the water as they have very large surface areas to facilitate rapid diffusion of toxic metals. Therefore, in gills having higher surface areas, it is expected that there will be more effective facilitation of metal entry (irrespective of the heavy metal provided, it is available in the most bioavailable form) due to the availability of more metal ion exchange or adsorption sites in the gills.
All heavy metals exist in surface waters in colloidal, particulate and dissolved phases, although dissolved concentrations are generally low (Kennish 1992). The solubility of heavy metals in surface waters is predominately controlled by the water pH, the type, and concentration of ligands on which the metal could adsorb, and the oxidation state of the mineral components and the redox environment of the system (Connell et al., 1984). Any differences between the metal levels and the two fish species may have been due to differences in metabolic
activities of the two species as suggested in previous studies ( Mortazavi and Sharifian 2012). The fish, we analyzed revel some metals concentrations potentially toxic if they enter the food chain. However, THQs values of M.cephalus goes to Mn-0.6; Pb-1.9; Cu-1.1; Zn-6.1; Cr-0.6; and S.sihama goes to Mn-0.5; Pb-1.7; Cu-1.0; Zn-5.2; and Cr-0.6; that indicated the contractions we found in the sample of fish represent a risk for human health because some metals (Zn, Pb, Cu) THQ is higher than one. Of course, it is just a Primary step; fish contamination levels should be carefully monitored on a regular basis, to detect any change in their patterns that could become a hazard on
www.ijmer.in 102

INTERNATIONAL JOURNAL OF MULTIDISCIPLINARY EDUCATIONAL RESEARCH
ISSN : 2277-7881; IMPACT FACTOR – 4.527; IC VALUE:5.16; ISI VALUE:2.286 VOLUME 6, ISSUE 8(2), AUGUST 2017
human safety. Similar results observed by Ambedkar and Maniyan, (2011) They concluded that the heavy metal concentrations were above the maximum levels recommended by regulatory agencies and, depending on daily intake by consumers, might represent a risk for human health.
Every water body receives the effluents containing heavy metals either
from point or from nonpoint sources. Worst thing about heavy metals is their persistence in environment due to their
unbiodegradable nature. It is the reason that aquatic fauna particularly fish bioaccumulate them, and thus, they remain in the tissues of the fish for long time. Fishes are the important source of protein and PUFA; therefore, American Heart Association (AHA) recommended fish twice a week to the human adults. Unfortunately, fishes are now becoming the major source of heavy metals due to the pollution caused by industries. These metals generally cause two types of health effects. One iscarcinogenic and other is non-carcinogenic effects. Both these effects can be measured in terms of target hazard quotients (THQ) and they worked on the amount and frequency of fish consumed.
Conclusions
The international official regulatory agencies like WHO have set limits for heavy metal contaminations above Permissible limits which the fish and fishery products. Production unsuitable for human consumption. However, in the Indian subcontinent there is no safety levels of heavy
metal in fish tissues although the Indian population is the major fish consumers in the tropics with a weekly annual rate 55kg/person.
Finally; we recommended that a long-term continuous monitoring to check metals pollution, in order to control of metal in water and fish, control and assessment of the metal content in water of Nizampatnam area which are supplied by water used agriculture, aquaculture, industries (dies and factories), quality of water farmlands. And also
www.ijmer.in 103

INTERNATIONAL JOURNAL OF MULTIDISCIPLINARY EDUCATIONAL RESEARCH
ISSN : 2277-7881; IMPACT FACTOR – 4.527; IC VALUE:5.16; ISI VALUE:2.286 VOLUME 6, ISSUE 8(2), AUGUST 2017
quality control of input and output water into coastal zones in Nizampatnam area has widely importance. In addition, guidance of people and farmers of both agriculture and aquaculture, about the instruction for use of pesticides, chemicals, drugs and control of house wastewater spreading in rivers and crops are necessary. These heavy metals will enter the food web through water and food, to cause the
adverse health effects like that in indicator organisms. There is no denying that industries are necessary for development, but on the other hand they are also creating heavy loss to the livelihood of human beings
Fig 1. Average concentrations of heavy metals in muscle of M.cephalus
and S.sihama (mg/kg, dry weight)
Fig.2. Average concentrations of heavy metals in Liver of M.cephalus
and S.sihama
(mg/kg, dry weight)
0
5
10
15
20
25
30
Cu Cr Pb Zn Mn
M.cephalus
S.sihama
www.ijmer.in 104

INTERNATIONAL JOURNAL OF MULTIDISCIPLINARY EDUCATIONAL RESEARCH
ISSN : 2277-7881; IMPACT FACTOR – 4.527; IC VALUE:5.16; ISI VALUE:2.286 VOLUME 6, ISSUE 8(2), AUGUST 2017
Fig. 3 Average concentrations of heavy metals in Gill tissue of
M.cephalus and S.sihama
(mg/kg, dry weight)
0
5
10
15
20
25
30
35
Cu Cr Pb Zn Mn
M.cephalus
S.sihama
0
5
10
15
20
25
30
Cu Cr Pb Zn Mn
M.cephalus
S.sihama
www.ijmer.in 105

INTERNATIONAL JOURNAL OF MULTIDISCIPLINARY EDUCATIONAL RESEARCH
ISSN : 2277-7881; IMPACT FACTOR – 4.527; IC VALUE:5.16; ISI VALUE:2.286 VOLUME 6, ISSUE 8(2), AUGUST 2017
References Adeyeye, E.I., Akinyugha, N.J.. Fesobi, M.E and Tenabe V.O (1996).
Determination of some metals in freshwater pond and their environment. Aquaculture, 47, 205-214.
Al-Busaidi, M., Yesudhan, P., Al. Mughairi, S., Al-Rabdi, W.A.K., Al. Harthy, K.S., Al- Mazrooei, N.A & A.L.Habsi, S.H (2011). Toxic metals in commercial marine fish in oman with reference of national and international standards. Chemosphere, 85. 67-73.
Altindag, A and Yigit, S. (2006). Assessment of heavy metal concentrations in the food web of lake Beysehir, Turkey. Chemosphere.60 (4), 552-556.
Ambedkar, G and Muniyan, M. (2011). Bioaccumulation of some heavy metals in the selected five freshwater fish from kollidam River, Tamilnadu. India. Advances in Applied Science Research, 2(5):221-225.
Amundsen, P.A., Staldvilk, F.J., Lukin, A., Kashulin, N., Popova, O., & Restetnikov. Y (1997).Heavy metals contaminations in fresh water fish form the border region between Norway and Russia. Science of the total environment. 201. 211-214. and temporal variation of heavy metals in different sexes of three species of edible
Beevens, D.G., Erskine, E., Robertson, M., Beattle, A.D., Campbell, B.C., Goldberg, A. (1976). Blood lead to hypertension. Lancet2. 1-3..
Bhuvaneshwari, R. Mamtha, N. Paneerselvan and Babu Rajendran, R (2012). Bioaccumulation of metals in muscle, Liver and Gills of sex commercial fish species at anaikaraidam of River Kaveri, south India. Internal Journal of Applied Biology and Pharmaceutical Technology. 3:18-10.
Boudouresque, C. F., and Verlaque, M (2002). Biological pollution in theMediterranean Sea: brackish water fish. Environ Sci Pollut Res.DOI 10.1007/s11356-017-9407-5. Castro, H., Aguilera, P. A., Martinez, J. L., & Carrique, E. L. (1999).
Differentiation of clams from fishing areas an approximation to coastal quality assessment. Environmental Monitoring and Assessment, 54, 229– 237.
Chan, H.M., Tritonopoules, M; Img. A., Receeveur. O and Johnson. E (1999). Consumption of fresh water fish in Kahn awake: risks and benefits. Environ. Res.sec. 80(2) 213-222.
www.ijmer.in 106

INTERNATIONAL JOURNAL OF MULTIDISCIPLINARY EDUCATIONAL RESEARCH
ISSN : 2277-7881; IMPACT FACTOR – 4.527; IC VALUE:5.16; ISI VALUE:2.286 VOLUME 6, ISSUE 8(2), AUGUST 2017
Connell BS, Cox M, Singer I (1984). Nickel and Chromium. In: Brunner F, Coburn JW (eds) Datar, A and R.P. Vashishtha (1990). Investigation of heavy metals in
water and silt sediments of Bitwa River. Indian journal of environmental protection. 10(9): 66-672.
David, E., Irvin, G and B. Knights. Pollution and the use of chemicals in agriculture, London: Butter worth. Disorders of minerals metabolism. Academic Press, New York, pp 472–532
Dsikowitzky, L, Mengesha, M, Dadebo. E, Decarvalho, C.E.V, Sindern.S and Dsikowitzky, L (2013). Assessment of heavy metals in water samples and tissues of edible fish species from Awassa and koka Rift valley lakes, Ethiopia. Environ-monit. Assess. 185:3117-3131.
DWAF (Department of water Affains and Forestry) (1996). South African water quality guidelines, aquatic ecosystems. 2nd Ed. 7..159.
Erdogrul, O and Erbilir, F (2007). Heavy metal and trace elements in various fish samples from Sir Dam Lake, Kahramanamras, Turkey. Environmental Monitoring and Assessment, 130, 373-379.
Gisbert, C., Ros, R., De, H.A., Walker, D.J., Bernal, M.P., Serrano, R (2000). A plant genetically modified that accumulates Pb is especially promising for phytoremediation. Bio chemical and Biophysical Research Communications, 303, 440-445.
Goel, P.K (1997). water pollution causes effects and control. New Delhi.
Goldstein, G.W (1992). Neurological concept of lead poisoning in children. Pediatr. Ann-21:384-388.Gulf, in relation to body length and sex. Bull Environ Contam Toxicol 89:450–454
Hanninen, H., & Lindstrom, H (1979). Behaviour test battery for toxic psychological studies used at the institute of occupational health in Helsinki. Helsinki: Institute of Occupational Health. Invasive versus introduced macrophytes. Marine Pollution Bulletin, 44, 32–38.
Jordao, C.P., Pereira, M.G., Bellato, C.R., Pereira, J.L and Matos. A.T (2002). Assessment of water system for contaminates from domestic and industrial sewages, Environment monitoring and assessment.79, 75-100.
www.ijmer.in 107
INTERNATIONAL JOURNAL OF MULTIDISCIPLINARY EDUCATIONAL RESEARCH
ISSN : 2277-7881; IMPACT FACTOR – 4.527; IC VALUE:5.16; ISI VALUE:2.286 VOLUME 6, ISSUE 8(2), AUGUST 2017
Kalay, M., Aly, O., & Canil, M (1999). Heavy metal concentration in
fish tissues from the Northeast Mediterranean Sea. Bulletin of Environmental contamination and Toxicology, 63, 673-681.
Kennish, L (1992). Toxicity of heavy metals: effects of Cr and Se on humans health. J Indian Knasmuller, S., Gottmann, E., Steinkellner, H., Fomin, A., Pickl, C.,
Paschke, A (1998). Detection of genotoxic effects of heavy metal contaminated soils with plant bioassay. Mutation Research, 420, 37-48. Krishnan, K. Fundamentals of environmental pollution (p-366). Chand.Ltd.
Krishnamurti, J. A., & Nair, R. V (1999). Concentration of metals in shrimps and crabs from Thane-Bassein creek system, Maharastra. Indian Journal of Marine Science, 28, 92–95.
Kudesia, V.P (1990). Water pollution. Merrut. Pragati Prakasam. Kularatne RKA, J M Harris, P Vinobaba, and C E Kankanamge (2017). Bio-transfer factors Mansour, S.A., Belal, M.H., Abou-Arab, A.A.K and Gad, M.F (2009).
Monitoring of pesticides and heavy metals in cucumber fruits produced from different farming systems. Chemosphere.75. 601-609.
Mc Neely, R.N., Neimanis, V.P and Dwyer, L (1979).Water quality source book. A guide to water quality parameter, Inland water directorate (pp.1-65). Water quality Branch, Ohawa. Canada.
Mitra, A, R. Chowdhury and Benerjee, K (2012). Concentration of some heavy metal in commercially important fin fish and shell fish of the River Ganga. Environ. Monit. Assess. 184:2219-2230.
Mortazavi MS and Sharifian S (2012). Metal concentrations in two commercial fish from Persian Public Health Educ 2:36–64 Rai, P.K (2009). Heavy metal phytoremediation from aquatic
ecosystems with special reference to macrophytes. Critical Reviews in Environmental Science and Technology, 39 (9), 697-753..
Salonen, J.T., Seppanen, K, Nyyssonen, K, Korpela, H, Kauhanen, J, Kantola, M; Tuomilento, J; Esterbauer, H, Tatzber, F, and Salonen R (1995). Intake of mercury from fish, lipid peroxidation, and the risk of myocardial infarction and coronary, cardiovascular, and any death in eastern Finnish men. Circulation. 91:645-655.
www.ijmer.in 108

INTERNATIONAL JOURNAL OF MULTIDISCIPLINARY EDUCATIONAL RESEARCH
ISSN : 2277-7881; IMPACT FACTOR – 4.527; IC VALUE:5.16; ISI VALUE:2.286 VOLUME 6, ISSUE 8(2), AUGUST 2017
Storelli, M.M (2008). Potential human health risk from metal (Hg, Cd
and Pb) and polychlorinated biphenyl’s (PCBC) via sea food consumption: Estimation of target hazard quotients (THQs) and toxic equivalent (TEOs). Food and chemical Toxicology. 46:2782-2788.
Suresh, B. Steiner, W., Rydlo, M and Taraschewski, H (1999) Concentration of 17 elements in zebra mussel (Dreissena polymorpha). Environmental Toxicology and chemist, 18: 2574-2579.Total Environ; 304:391-404.
Umar, A., Ahmad, M.S (2001). Hydrogeological and Hydrochemical frame works of regional aquter system in Kali-Ganga sub-basin, India. Environmental Geology. 40 (4-5), 6-2-611.
Usero, J., Morillo, J., & Graccia, I (2005). Heavy metal concentrations in molluscs from the Atlantic coast of southern Spain. Chemosphere, 59, 1175–1181.
Wang, X., Santo, T., Xing, B and Tao. S. (2005). Health risk of heavy metals to the general public in tianjin, china via consumption of vegetable and fish. Science of the total environment. 350. 28-37.
Waqar, A (2006).Levels of selected heavy metals in tuna fish. The Arabian Journal for Science and Engineering, 31, 89-92.
WHO (1973). Technical report series: Trace elements in human nutrition. Report of a WHO expert committee. No.532. Geneva.
WHO (1985). Guidelines for drinking water quality (Vol.1 p-130). Recommendation WHO. Geneva.
WHO (1991) Inorganic mercury Environmental Health Criteria. Vol. 118. Geneva World Health Organization..
WHO (1995). Inorganic lead, Environmental Health Criteria. No.165. World Health Organization, Geneva, Switzerland.
Yang H and Rose NL (2003)Distribution of Hg in the lake sediments across the U. K Sci.
www.ijmer.in 109

INTERNATIONAL JOURNAL OF MULTIDISCIPLINARY EDUCATIONAL RESEARCH
ISSN : 2277-7881; IMPACT FACTOR – 4.527; IC VALUE:5.16; ISI VALUE:2.286 VOLUME 6, ISSUE 8(2), AUGUST 2017
LENGTH WEIGHT RELATIONSHIP OF TEN COMMERCIALLY
IMPORTANT MARINE FISHES FROM VISAKHAPATNAM, COAST OF ANDHRA, INDIA
Govinda Rao, V, N.M.Krishna, K.V. Siva Reddy and
K. Ramesh Babu Department of Marine Living Resources, College of Science and
Technology, Visakhapatnam-530003, Andhra Pradesh, India Abstract
Estimated length-weight relationships are presented for 10 commercially important marine fish species representing seven families, found in the Visakhapatnam coast, India. Total 8,804 fish specimens were collected from Visakhapatnam fisheries harbour during
the period June 2015 to May 2016. The ‘b’ value ranged between 2.929 to 3.311 and a coefficient of determination (r²) varying from 0.862 to 0.984. Six species exhibited negative allometric growth (-) pattern while four species showed positive allometric growth (+). Information pertaining to length-weight relationships should lead to a better understanding of management of fish communities in the Coast of Visakhapatnam, India.
Key words:
Length weight relationship, length-weight relations, coast of Andhra Pradesh, India
1. Introduction:
Length-weight relationship studies is crucial role for proper exploitation and management of species of fish population, because the changes in weight in relation to length are generally not on the basis of species gravity but due to changes in the form of volume because the density in the marine organism and that of nearby surrounding water. The length-weight relationship (LWR) is a significant aspect in the biological revision of fishes and their stock assessments. The LWR is
www.ijmer.in 110
INTERNATIONAL JOURNAL OF MULTIDISCIPLINARY EDUCATIONAL RESEARCH
ISSN : 2277-7881; IMPACT FACTOR – 4.527; IC VALUE:5.16; ISI VALUE:2.286 VOLUME 6, ISSUE 8(2), AUGUST 2017
particularly important in parameterizing yield equations and in estimations of stock size. This relationship is helpful for estimating the weight of a fish of a given length and can be used in studies of gonad development, rate of feeding, metamorphosis, maturity and condition
(Le Cren, 1951). Methods to estimate the length-weight relationship of fishes are described by(Pauly, 1977). There are a very few studies on
the LWR of commercially important fishes from the Visakhapatnam coastal region(Govinda Rao et al., 2014, Govinda Rao et al., 2015, Muddula Krishna et al., 2015) was studied length weight relationship done from this region.
2. Material methods:
The commercially important fish samples were collected from Visakhapatnam, Middle East Coast of India. Samples were collected and total length was taken from tip of snout to caudal fin end (TL) measured to the nearest millimeter and weighed to the nearest grams. In the laboratory, fishes were identified to species level, based on following authors(Smith and Heemstra, Froese, 1998, Fischer and Bianchi, 1984). A total of 8,804 specimens were collected during the period 2015-2016. The length weight relationship was studied following(Le Cren, 1951). The relationship between the length and weight of a fish is usually expressed by the equation, W= aLb
Where W – body weight (g): L- total length (mm); a – coefficient related to body form and b- exponent; values of the exponent b provide information on fish growth. According to (Pauly, 1997) ‘b’ values may range from 2.5 to 3.5. When b =3, increase in weight is isometric. When the value of b is other than 3, weight increase is allometric, (positively allometric if b>3) ( Sangun, 2007).
3. Results and Discussion:
The length-weight relationships of 10 species of fish representing 10 families are presented in this study. The family name,
www.ijmer.in 111
INTERNATIONAL JOURNAL OF MULTIDISCIPLINARY EDUCATIONAL RESEARCH
ISSN : 2277-7881; IMPACT FACTOR – 4.527; IC VALUE:5.16; ISI VALUE:2.286 VOLUME 6, ISSUE 8(2), AUGUST 2017
species name, sample size (n), size range (minimum and maximum), length-weight parameters a and b, coefficient of determination (r2), and standard error of slope (b) are given in Table (1). The parameters of the
length–weight relationship estimated for 10 species belonging to 7 families comprising a total of 8,804 individuals are presented in Table 1. The estimated values of b ranged between 2.929 (Carnax heberi) and Rastrelliger kanagurta (3.311) (Table 1). The sample length ranged from 10 individuals for utjanus fulvus to Katsuvonus pelamis (160-900 mm, TL). The parameters as shown in Table 1 can be used for studying growth for any of the 10 fish species of fish exploited from this coast. In the world many workers have reported both isometric and allometric
growth for different types of species from various water bodies(King, 1996). Parameters of length weight relationships are effected by several factors such as season, sample size, habitat, gonad maturity, sex, diet and stomach fullness, health, fish activities, seasonal growth (Bagenal, 1978). This study provided the basic information on the length-weight relationships of 10 fish species from the Visakhapatnam coastal waters that will be useful for the management of fishery resources.
4. Acknowledgments:
The authors would like to express sincere thanks to Head, department of Marine Living Resources, Andhra University for providing facilities for carrying out the research work.
References Bagenal TB, Tesch FW (1978). Age and Growth. In: Bagenal, T (Ed.),
Methods for Assessment of fish production in freshwater. IBP Handbook 3. Blackwell Scientific Publication, Oxford, UK, 101-136
Fischer W, Bianchi (1984). FAO species Identification sheets for fishery purposes. Western Indian Ocean: Fishing area 51.
www.ijmer.in 112

INTERNATIONAL JOURNAL OF MULTIDISCIPLINARY EDUCATIONAL RESEARCH
ISSN : 2277-7881; IMPACT FACTOR – 4.527; IC VALUE:5.16; ISI VALUE:2.286 VOLUME 6, ISSUE 8(2), AUGUST 2017
Froese R (1998). Length-weight relationships for 18 less-studied fish
species. Journal of Applied Ichthyology 14:117-118. Govinda Rao V, Krishna NM, Sujatha K (2014). Length-weight
relationship and length groups of two species of snappers (Pisces: Lutjanidae) represented in the catches of Visakhapatnam, Middle East coast of India. Journal of
Experimental Zoology, India, 17(1). Govinda Rao V, N Muddula Krishna, P Padmavathi, N Ram Sai Reddy,
D Venu K. Ramesh Babu (2015). Length weight relationship studies on some marine ornamental fish species off Visakhapatnam, east coast of India. Journal of Experimental Zoology, India.
King RP (1996). Length-Weight relationship of Nigerian Coastal water fishes. Fish byte 19(4):53-58.
Le Cren ED (1951). Length weight relationship and seasonal cycle in gonad weight and condition in the perch (Perca fluviatilis). Journal of Animal Ecology 20:201-219
Muddula Krishna, N, V. Govindarao and D. Venu (2015). Length weight relationship of some rock pool fishes off Visakhapatnam, East Coast of India. International
Journal of Fisheries and Aquatic Studies ; 2(3):5-6. Pauly D, Gayanilo Jr, Albee FC (1997). An alternative approach to
estimating the parameters of a length-weight relationship from length-frequency sample and their bulk weights. Naga Manila : 22(1):15-26.
Sangun L, Akamer E, Akar M (2007). Weight-Length relationship for 39 fish species from the North-Eastern Mediterranean Coast of Turkey. Turkey Journal of Fisheries and Aquatic Science ; 7:37-40
Smith, M.M. P.C. Heemstra. Smith’s Sea Fishes. Macmillon, South Africa, Johnannesburg, XX+1047p.
www.ijmer.in 113

INTERNATIONAL JOURNAL OF MULTIDISCIPLINARY EDUCATIONAL RESEARCH
ISSN : 2277-7881; IMPACT FACTOR – 4.527; IC VALUE:5.16; ISI VALUE:2.286 VOLUME 6, ISSUE 8(2), AUGUST 2017
Table-1 length-weight relationship of commercially important marine fish species from Visakhapatnam coast, India
Family- species N Length range (mm) TL
a b r2 Growth type
Cephalopholis formosa (Shaw, 1812)
42 220-310 0.0125 2.963 0.980 Allometric (-)
Lutjanus fulvus (Forster, 1801) 452 160-310 0.00512 3.125 0.982 Allometric (+) Scomberomorus commersonii (Lacepede, 1800)
1244 180-490 0.00821 2.950 0.952 Allometric (-)
Pampus argenteus (Eupharasen, 1788)
421 210-400 0.04820 2.940 0.927 Allometric (-)
Katsuwonus pelamis (Linnaeus,1758)
258 390-900 0.00645 3.229 0.983 Allometric (+)
Carnax heberi (Bennett,1830) 194 290-750 0.04312 2.929 0.894 Allometric (-) Sphyraena obtusata Cuvier, 1829 1435 240-480 0.00621 2.394 0.935 Allometric (-) Saurida tumbil (Bloch, 1795) 1753 250-430 0.00402 3.290 0.925 Allometric (+) Rastrelliger kanagurta (Cuvier,1816)
2865 250-360 0.00061 3.311 0.946 Allometric (+)
Lobotes surinamensis (Bloch, 1890) 140 450-600 0.00438 2.970 0.865 Allometric (-)
www.ijmer.in 114

INTERNATIONAL JOURNAL OF MULTIDISCIPLINARY EDUCATIONAL RESEARCH
ISSN : 2277-7881; IMPACT FACTOR – 4.527; IC VALUE:5.16; ISI VALUE:2.286 VOLUME 6, ISSUE 8(2), AUGUST 2017
REVIEW ON TILAPIA: NUTRITION, FEEDS, AND FEED
MANAGEMENT
S. S. Rathore*1, S. I. Yusufzai2, A. Chandravanshi1, P.
Chandravanshi1 and K. Jaiswal2 1 College of Fisheries, Karnataka Veterinary, Animal and Fisheries
Science University, Mangalore, Karnataka, India
2College of Fisheries Science, Junagadh Agricultural University, Veraval, Gujarat, India
ABSTRACT
Tilapia are the third most important cultured fish group in the world, after carps andSalmonids.The most important species have been Oreochromisniloticus (Nile tilapia), O. mossambius(Java tilapia), O. aureus, (blue tilapia), and O. hornorum (Zanzibar tilapia). However, hybrids of themajor culture species, O. hybrids (red tilapia), are becoming important for export. Tilapias are native toAfrica and the Middle East, but they have been introduced into most tropical and
subtropical countries.Tilapias also have been introduced as aquaculture species in temperate nations, but geothermal water,waste heat or other sources of providing warm water in winter are necessary. Tilapias have traditionallybeen important in capture fisheries, but the culture of these species has increased and now exceeds thewild catch.Tilapias originally were promoted as a pond fish for culture to aidpoor, rural families in developing, tropical nations. However, tilapias have attracted the attention ofconsumers, and there is now a large market for tilapias in Japan, United States, European Union, andother developed countries.Because tilapia have wide feedinghabits and are highly evolved with advancedprogeny care, their nutrient requirementsare different from those ofother fishes. Various researchers havestudied the qualitative and quantitativenutrient requirements of tilapiafry/fingerlings, growout and broodfish.Their
results provide useful perspectivefor managers of current
www.ijmer.in 115

INTERNATIONAL JOURNAL OF MULTIDISCIPLINARY EDUCATIONAL RESEARCH
ISSN : 2277-7881; IMPACT FACTOR – 4.527; IC VALUE:5.16; ISI VALUE:2.286 VOLUME 6, ISSUE 8(2), AUGUST 2017
tilapiaoperations.The purpose of this study was to evaluate nutritional requirement of tilapia in different life stages.
Key words: Tilapia, Nutrition, Feed, Hybrids.
1. INTRODUCTION
Aquaculture is currently the fastest growing food producing sector in the world. In 2014, overall fish production was 167.3 million tonnes (value of US$ 160.4 billion) grown by 5.9 percent from 158.0 million tonnes in 2012 (FAO, 2016). Nile tilapia (Oreochromisniloticus)is the most extensively cultured species among
all tilapia species. Like other large fish, they are a good food source of protein and a popular target for artisanal and commercial fisheries. In recent years, it is now attracting the attention of public and private entities having a great potential for high quality, cheap protein and a good source to obtain foreign exchange (FAO, 2014).
One of the great advantages of tilapia for aquaculture is that they feed on a low trophic level. The members of the genus Oreochromisare all omnivores, feeding on algae, aquatic plants, small invertebrates, detrital material and the associated bacterial films. The individual species may have preferences between these materials and are more or less efficient depending on species and life stages in grazing
on these foods. They are all somewhat opportunistic and will utilize any and all of these feeds when they are available. This provides an advantage to farmers because the fish can be reared in extensive situations that depend upon the natural productivity of a water body or in intensive systems that can be operated with lower cost feeds. The Nile tilapia (O. niloticus) is one of the most commonly farmed tilapia species in the world (Sumi, 2014).Tilapia is the fast growing species among all culturable species. For this reason, culture of tilapia becomes popular day by day. FAO has recorded farmed tilapia production
www.ijmer.in 116

INTERNATIONAL JOURNAL OF MULTIDISCIPLINARY EDUCATIONAL RESEARCH
ISSN : 2277-7881; IMPACT FACTOR – 4.527; IC VALUE:5.16; ISI VALUE:2.286 VOLUME 6, ISSUE 8(2), AUGUST 2017
statistics for 135 countries and territories on all continents (FAO, 2014).
Tilapia plays an important role in food security and poverty alleviation in the developing countries such as Indonesia, the Philippines, Thailand and Taiwan Province of China. Presently, tilapia production from aquaculture accounts for about 2.5 times more than
production from wild capture fisheries, although the reverse was the case before the 1980s (De Silva et al., 2004). Nutrition is the most expensive component in the intensive aquaculture industry, where it represents over 50% of operating costs. Moreover, protein itself represents about 50% of feed cost in intensive culture. Therefore, the selection of proper quantity and quality of dietary protein is a necessary tool for successful tilapia culture practices. The major challenge facing tilapia nutritionists in developing countries is the development of commercial, cost effective tilapia feeds using locally available, cheap and unconventional resources (ADB, 2005). This review throws some light on environmental and nutritional requirements of tilapia.
ENVIRONMENTAL REQUIREMENTS
Tilapia can tolerate a wider range of environmental conditions—including factors such as salinity, dissolved oxygen, temperature, pH, and ammonia levels than most cultured freshwater fishes can. In
general, most tilapia are highly tolerant of saline waters, although salinity tolerance differs among species. Nile tilapia is thought to be the least adaptable to marked changes (direct transfer, 18 parts per thousand in salinity); Mozambique, blue, and redbelly (T. zilli) are the most salt tolerant (El-Sayed, 2006). With the exception of Nile tilapia, other tilapia species can grow and reproduce at salinity concentrations of up to 36 parts per thousand, but optimal performance measures (reproduction and growth) are attained at salinities up to 19 parts per thousand (El-Sayed, 2006).
www.ijmer.in 117

INTERNATIONAL JOURNAL OF MULTIDISCIPLINARY EDUCATIONAL RESEARCH
ISSN : 2277-7881; IMPACT FACTOR – 4.527; IC VALUE:5.16; ISI VALUE:2.286 VOLUME 6, ISSUE 8(2), AUGUST 2017
Tilapia are, in general, highly tolerant of low dissolved oxygen
concentration, even down to 0.1 mg/L (Magid and Babiker, 1975), but optimum growth is obtained at concentrations greater than 3 mg/L (Ross, 2000). Temperature is a major metabolic modifier in these fish. Optimal growing temperatures are typically between 22° C (72° F) and 29° C (84° F); spawning normally occurs at temperatures greater than
22° C (72° F). Most tilapia species are unable to survive at temperatures below 10° C (50° F), and growth is poor below 20° C (68° F). Blue tilapia are the most cold tolerant, surviving at temperatures as low as 8° C (46° F), while other species can tolerate temperatures as high as 42° C (108° F; (Sarig, 1969; Caulton, 1982; Mires, 1995).
Other water quality characteristics relevant to tilapia culture are pH and ammonia. In general, tilapia can tolerate a pH range of 3.7 to 11, but best growth rates are achieved between pH 7 to 9 (Ross, 2000). Ammonia is toxic to tilapia at concentrations of 2.5 and 7.1 mg/L as unionized ammonia, respectively, for blue and Nile tilapia (Redner and Stickney, 1979; El-Sherifet al., 2008) and depresses feed intake and growth at concentrations as low as 0.1 mg/L (El- Sherifet al., 2008).
Optimum concentrations are estimated to be below 0.05 mg/L (El-Sherifet al., 2008).
Table.1: Limits and optimal of water quality parameters for tilapia
(Source: Mjounet al., 2010).
Parameter Range Optimum for growth
Reference
Salinity (parts per thousand)
Up to 36
Up 19 El-Sayed, 2006
Dissolved Oxygen (mg/L)
<0.1
> 3 Magid and Babiker, 1975; Ross, 2000
Temperature (C°) 8–42 22–29 Sarig, 1969; Morgan, 1972; Mires, 1995
pH 3.7–11 7–9 Ross, 2000 Ammonia, mg/L
Up to 7.1
< 0.05
El-Shafey, 2008; Rednerand Stickney, 1979
www.ijmer.in 118
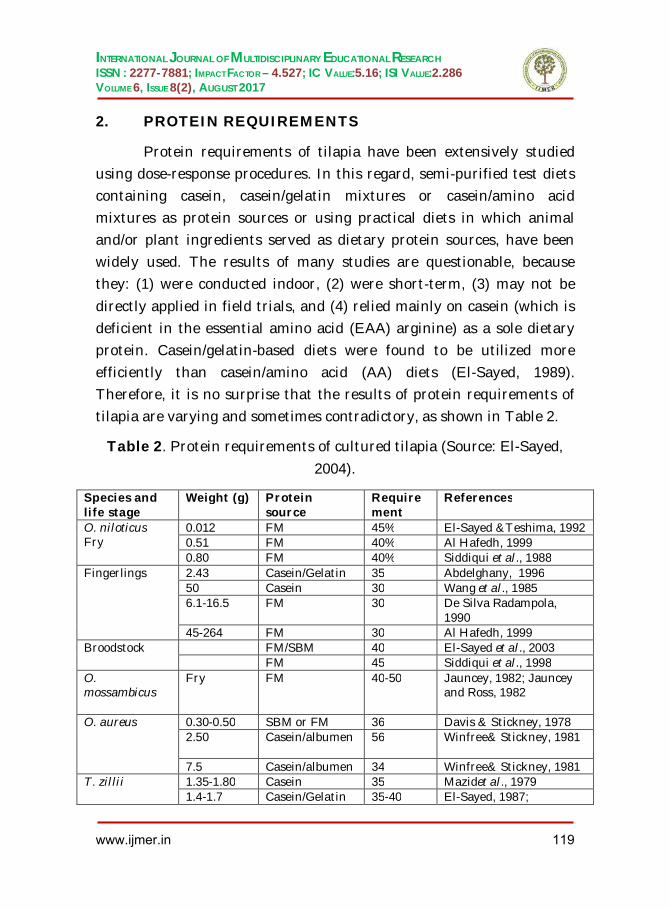
INTERNATIONAL JOURNAL OF MULTIDISCIPLINARY EDUCATIONAL RESEARCH
ISSN : 2277-7881; IMPACT FACTOR – 4.527; IC VALUE:5.16; ISI VALUE:2.286 VOLUME 6, ISSUE 8(2), AUGUST 2017
2. PROTEIN REQUIREMENTS
Protein requirements of tilapia have been extensively studied using dose-response procedures. In this regard, semi-purified test diets containing casein, casein/gelatin mixtures or casein/amino acid mixtures as protein sources or using practical diets in which animal and/or plant ingredients served as dietary protein sources, have been widely used. The results of many studies are questionable, because they: (1) were conducted indoor, (2) were short-term, (3) may not be
directly applied in field trials, and (4) relied mainly on casein (which is deficient in the essential amino acid (EAA) arginine) as a sole dietary protein. Casein/gelatin-based diets were found to be utilized more efficiently than casein/amino acid (AA) diets (El-Sayed, 1989). Therefore, it is no surprise that the results of protein requirements of tilapia are varying and sometimes contradictory, as shown in Table 2.
Table 2. Protein requirements of cultured tilapia (Source: El-Sayed,
2004).
Species and life stage
Weight (g) Protein source
Requirement
References
O. niloticus Fry
0.012 FM 45% El-Sayed &Teshima, 1992 0.51 FM 40% Al Hafedh, 1999 0.80 FM 40% Siddiqui et al., 1988
Fingerlings
2.43 Casein/Gelatin 35 Abdelghany, 1996 50 Casein 30 Wang et al., 1985 6.1-16.5 FM 30 De Silva Radampola,
1990 45-264 FM 30 Al Hafedh, 1999
Broodstock
FM/SBM 40 El-Sayed et al., 2003 FM 45 Siddiqui et al., 1998
O. mossambicus
Fry FM 40-50 Jauncey, 1982; Jauncey and Ross, 1982
O. aureus
0.30-0.50 SBM or FM 36 Davis & Stickney, 1978 2.50
Casein/albumen 56
Winfree& Stickney, 1981
7.5 Casein/albumen 34 Winfree& Stickney, 1981 T. zillii
1.35-1.80 Casein 35 Mazidet al., 1979 1.4-1.7 Casein/Gelatin 35-40 El-Sayed, 1987;
www.ijmer.in 119
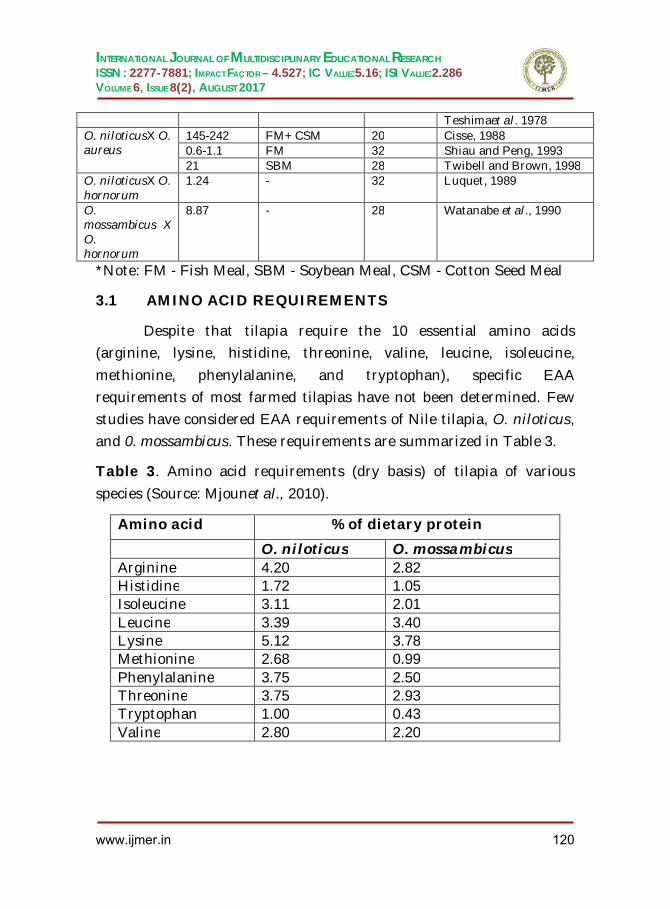
INTERNATIONAL JOURNAL OF MULTIDISCIPLINARY EDUCATIONAL RESEARCH
ISSN : 2277-7881; IMPACT FACTOR – 4.527; IC VALUE:5.16; ISI VALUE:2.286 VOLUME 6, ISSUE 8(2), AUGUST 2017
Teshimaet al. 1978
O. niloticusX O. aureus
145-242 FM+CSM 20 Cisse, 1988 0.6-1.1 FM 32 Shiau and Peng, 1993 21 SBM 28 Twibell and Brown, 1998
O. niloticusX O. hornorum
1.24 - 32 Luquet, 1989
O. mossambicus X O. hornorum
8.87 - 28 Watanabe et al., 1990
*Note: FM - Fish Meal, SBM - Soybean Meal, CSM - Cotton Seed Meal
3.1 AMINO ACID REQUIREMENTS
Despite that tilapia require the 10 essential amino acids (arginine, lysine, histidine, threonine, valine, leucine, isoleucine,
methionine, phenylalanine, and tryptophan), specific EAA requirements of most farmed tilapias have not been determined. Few studies have considered EAA requirements of Nile tilapia, O. niloticus, and 0. mossambicus. These requirements are summarized in Table 3.
Table 3. Amino acid requirements (dry basis) of tilapia of various
species (Source: Mjounet al., 2010).
Amino acid % of dietary protein
O. niloticus O. mossambicus Arginine 4.20 2.82 Histidine 1.72 1.05 Isoleucine 3.11 2.01 Leucine 3.39 3.40 Lysine 5.12 3.78 Methionine 2.68 0.99 Phenylalanine 3.75 2.50 Threonine 3.75 2.93 Tryptophan 1.00 0.43 Valine 2.80 2.20
www.ijmer.in 120

INTERNATIONAL JOURNAL OF MULTIDISCIPLINARY EDUCATIONAL RESEARCH
ISSN : 2277-7881; IMPACT FACTOR – 4.527; IC VALUE:5.16; ISI VALUE:2.286 VOLUME 6, ISSUE 8(2), AUGUST 2017
3. FRY AND FINGERLINGS
4.1 Nutrient Requirements
Based on models developed from available data for 1-5-g tilapia fry, Dr. Sena S. De Silva and his colleagues have found that 34-36% crude protein diets produce the greatest growth. Recently, however, preference has been given to using economic levels of nutrients rather than those that maximize growth. The least-cost dietary protein level is 25-28%. As lipids have protein-sparing effects in tilapia fry, about 6-8% lipid content is suggested. Soybean oil seems to be the best source. For O.niloticusfry, protein:energy ratios of 120 and 75 mg protein/kcal of
digestible energy have been reported as the best for fresh and brackish waters, respectively.
4.2 AMINO ACIDS
Proteins are ultimately degraded into amino acids, which are utilized by tilapia either as an energy source or somatic growth. From the standpoint of amino-acid balance for somatic growth, the first priority is to identify and adjust the most deficient or first-limiting amino acids. Then levels of other amino acids can be adjusted to their optima.
Santiago and Lovell (1988) determined the levels of 10 essential amino acids for Nile tilapia fry of 15 to 87mg stocking size using a purified diet (Table 4). Requirements of Mozambique tilapia for all amino acids are lower than the levels required by Nile tilapia, except for leucine, which is similar for both species. Minerals and vitamins
also play important roles in the growth and development of tilapia fry. Currently known optimum ranges of vitamins and minerals are shown in Table 5, 6.
www.ijmer.in 121

INTERNATIONAL JOURNAL OF MULTIDISCIPLINARY EDUCATIONAL RESEARCH
ISSN : 2277-7881; IMPACT FACTOR – 4.527; IC VALUE:5.16; ISI VALUE:2.286 VOLUME 6, ISSUE 8(2), AUGUST 2017
4.3 FEEDS AND FEEDING MANAGEMENT
As tilapia fry accept feed immediately after absorption of the yolk-sac, the feeding element of their culture is relatively simple and easy. Tilapia fry are fed with fishmeal, rice bran, or oil cakes. The feeds are given separately or in combination, either in powder form or dough. However, feeding practices depend on rearing systems. Some commercial hatchery operators in Thailand who use shallow trays in water recirculation systems feed fine fishmeal with 60% crude protein
to supply nutrients and initiate feeding. Feeding after yolk-sac absorption seems beneficial for the fry, but since accumulated uneaten feed can have negative effects on water quality, some think feeding is unnecessary during this period. The swim-up fry reared in water recirculation systems are transferred to fine-mesh hapas suspended in green water ponds, where they are fed 4-5 times/d with fine fishmeal mixed with vitamin C at 10 g/kg.
Table 4. Optimum levels of amino acids for tilapia fry and adults(
Source: Santiago and Lovell, 1988).
Amino Acids Tilapia Fry Tilapia Adult % Protein % Diet % Protein % Diet Arginine 4.1 1.5 7.5 1.5 Histidine 1.5 0.5 2.3 0.5 Isoleucine 2.6 0.9 4.3 0.9 Leucine 4.3 1.5 7.0 1.5 Lysine 5.1 1.8 5.0 1.6 Methionine 1.3 0.5 1.7 0.5 Phenylalanine 3.2 1.1 4.5 1.5 Threonine 3.3 1.2 3.6 1.0 Tryptophan 0.6 0.2 1.0 0.2 Valine 3.0 1.1 5.8 1.2
www.ijmer.in 122

INTERNATIONAL JOURNAL OF MULTIDISCIPLINARY EDUCATIONAL RESEARCH
ISSN : 2277-7881; IMPACT FACTOR – 4.527; IC VALUE:5.16; ISI VALUE:2.286 VOLUME 6, ISSUE 8(2), AUGUST 2017
Table 5.Vitamin requirements (dry basis) of tilapia of various species
and sizes (Source: Mjounet al., 2010).
Vitamin/Species
Size (g)
Requirement (mg/kg of diet)
Reference
Vitamin B1 (thiamine) O. niloticus – 4 Lim et al.,2000 O. mossambicus× O. urolepsishonorum
– 2.5 Lim and Leamaster, 1991
Vitamin B2 (riboflavin) O. mossambicus× O. niloticus
1.46–42.0
5 Lim et al., 1993
O. aureus 0.71–31.6
6 Soliman and Wilson, 1992
Vitamin B6 (pyridoxine) O. niloticus× O. aureus 0.73–
2.7 1.7–9.5 Shiau and Hsieh,
1997 0.73–3.4
15.0–16.5 Shiau and Hsieh, 1997
Pantothenic acid O. aureus – 6 Roemet al., 1991
0.71–17.4
10 Soliman and Wilson, 1992
Nicotinic acid (niacin) O. niloticus× O. aureus 2.2–
28.8 26–121 Shiau and Suen,
1992 Biotin O. niloticus× O. aureus 0.98–
5.0 0.06 Shiau and Chin,
1999 Folic acid O. niloticus× O. aureus 0.41–
4.1 0.82 Shiau and
Huang, 2001 Biotin O. niloticus× O. aureus ) 0.98–
5.0 0.06 Shiau and Chin,
1999 Folic acid O. niloticus× O. aureus 0.41– 0.82 Shiau and
www.ijmer.in 123

INTERNATIONAL JOURNAL OF MULTIDISCIPLINARY EDUCATIONAL RESEARCH
ISSN : 2277-7881; IMPACT FACTOR – 4.527; IC VALUE:5.16; ISI VALUE:2.286 VOLUME 6, ISSUE 8(2), AUGUST 2017
4.1 Huang, 2001
Vitamin B12 (cyanocobalamin) O. niloticus× O. aureus 1.0–
47.7 NR Shiau and Peng,
1993 Inositol (Myo-inositol) O. niloticus× O. aureus 0.51–
4.8 400 Shiau and
Huang, 2001 Choline O. aureus 2.0–
21.9 NR Roemet al., 1991
O. niloticus× O. aureus 0.62–6.1
1000 Shiau and Chin, 1999
Vitamin C (ascorbic acid) O. niloticus 0.56–
4.5 50 Abdelghany,
1996 1.0–18.0
420 Solimanet al., 1994
Vitamn A (retinol), IU/kg O. niloticus 11.4–
33.1 5000 Saleh et al., 1995
O. niloticus× O. aureus 1.6–9.3
5850–6970 Hu et al., 2006
Vitamin D (cholecalciferol) O. aureus 2.3–
42.0 NR O’Connell and
Gatlin, 1994 O. niloticus× O. aureus 0.79–
27.7 375 Shiau and
Huang, 1993 Vitamin E (tocopherol) O. niloticus 0.49–
7.8 10 Saleh et al., 1995
O. aureus 2–19.7 10–25 Roemet al., 1991 *NR: not required.
Table 6.Mineral requirements (dry basis) of tilapia of various species
and sizes (Source: Mjounet al., 2010).
Mineral/Species Size (g)
Requirement Reference
Major (g/kg of diet)
www.ijmer.in 124

INTERNATIONAL JOURNAL OF MULTIDISCIPLINARY EDUCATIONAL RESEARCH
ISSN : 2277-7881; IMPACT FACTOR – 4.527; IC VALUE:5.16; ISI VALUE:2.286 VOLUME 6, ISSUE 8(2), AUGUST 2017
Calcium O. aureus
2.3–61.3
7–7.5 Robinson et al., 1987; O’Connell and Gatlin, 1994
Phosphorus O. niloticus 6.1–
32.0 < 9 Watanabe et al.,1980
O. aureus – 10 Viola et al., 1986 Potassium O. niloticus× O. aureus
0.77–3.5
2–3 Shiau and Hsieh, 2001
Magnesium O. niloticus 20.0–
54.4 0.59 Dabrowskaet al.,
1989 O. aureus 0.5–9.0 0.5 Reighet al., 1991 Trace (mg/kg of diet) Zinc O. niloticus 3.1–
22.1 20 McClain and Gatlin,
1988 O. aureus 8.5–
23.1 30 Eid and Ghoneim,
1994 Chromium O. niloticus× O. aureus
.23–13.1
12 Shiau and Lin, 1993
0.55–4.0
140 Shiau and Shy, 1998
4. GROWOUT
5.1 NUTRIENT REQUIREMENTS
Wee and Tuan (1988) found that diets with 27-35% crude protein are suitable for Nile tilapia growth in recirculation systems, although tilapia farmers may select a lower level to be more cost-effective. Manipulating feeding rates can also fulfill absolute protein requirement, but the economic effect must be determined for each
www.ijmer.in 125

INTERNATIONAL JOURNAL OF MULTIDISCIPLINARY EDUCATIONAL RESEARCH
ISSN : 2277-7881; IMPACT FACTOR – 4.527; IC VALUE:5.16; ISI VALUE:2.286 VOLUME 6, ISSUE 8(2), AUGUST 2017
culture system. Type of protein also has a significant effect on fish. Adult tilapia can store lipids, but compared to other species, they are more efficient utilizing carbohydrates for energy production. Starch-based diets are better than glucose-based ones. Alpha starch can be a source of shortchain fatty acids, after intestinal fermentation, for O.
niloticus. Unlike other freshwater fishes that require omega-3 fatty acids, tilapia require omega-6 fatty acids. Tilapia can synthesize vitamin B12 in their intestines and do not need dietary sources. If tilapia are reared in marine environments, they do not need any mineral supplements, as they absorb most of the minerals from the water. For freshwater culture, they need calcium, phosphorus, magnesium, and some other minerals. However, information regarding mineral and vitamin requirements is limited.
5.2 FEEDS AND FEEDING MANAGEMENT
Commercial feeds formulated for tilapia are available in several countries, and carp and catfish diets are also used for tilapia production. Commercial feeds are often used in a supplemental fashion in countries where their greater use has limited profits. Alternative cheap feeds for tilapia have been tried, including fruit and vegetable
wastes, crop by-products, leguminous fodders, and aquatic plants. Among them, duckweeds (e.g., Lemna sp.) grown on-site have been found suitable at 3-5% biomass daily feeding rates on a dry weight basis to produce up to 100-g fish. However, a combination of duckweed and pellets would produce larger tilapia at low cost.
5. LARGER FISH
In most countries, large tilapia fetch higher prices for export or domestic consumption. Attempts have been made to produce large-size tilapia in various systems. Diana and his colleagues (1994) found that combinations of feed and fertilizers were more efficient in producing large (500-g) tilapia in ponds than feeding or fertilization alone. In
www.ijmer.in 126

INTERNATIONAL JOURNAL OF MULTIDISCIPLINARY EDUCATIONAL RESEARCH
ISSN : 2277-7881; IMPACT FACTOR – 4.527; IC VALUE:5.16; ISI VALUE:2.286 VOLUME 6, ISSUE 8(2), AUGUST 2017
another study, they also found the most-profitable system for growing large tilapia is the use of greenwater, where a rich plankton bloom has been induced through fertilization,until the fish reach 100 g, then supplementary feed. Recently, Thai farmers have started to grow both black and red tilapias in cages in rivers, lakes, reservoirs, and seas. They feed 25-35% crude protein diets ad libitum to achieve faster
growth. The animals look fat and attractive, and bring high prices (U.S. $1-2/kg), especially in north and northeastern Thailand.
6.1 RESTRICTED FEEDING
Restricted feeding is recommended because availability of gross energy declines with increasing feedinglevels, and utilization of metabolizable energy for growth in tilapia is constant and independent of feeding level. A study at the Asian Institute of Technology in Thailand showed that feeding Nile tilapia at 8 a.m. daily resulted in low net fish yield, and feeding once daily at any time is less productive than two or three feedings a day.
6. BROODFISH 6.1 PROTEIN
Dietary protein intake affects the protein content of eggs, number of eggs per spawning, and spawning interval in tilapia. In a study in tanks, O. niloticus females fed a 35%-protein diet produced more eggs than those fed 10%- and 20%-protein diets. Previously, O.
niloticusfed with 40%-protein diets produced more fry than when fed 20% protein in outdoor tanks. Red tilapia broodfish given a 44%- protein eel feed diet also produced more seed compared to fish fed a low-protein tilapia diet (24% protein) and trash fish (21.7% protein). A more elaborate study in concrete tanks with recirculation showed the total number of eggs and number of eggs/kg were higher in fish fed medium dietary protein (27.6 and 35%) than in those fed with higher protein levels (42.6 and 50.1%). Higher-protein diets produced heavier
www.ijmer.in 127
INTERNATIONAL JOURNAL OF MULTIDISCIPLINARY EDUCATIONAL RESEARCH
ISSN : 2277-7881; IMPACT FACTOR – 4.527; IC VALUE:5.16; ISI VALUE:2.286 VOLUME 6, ISSUE 8(2), AUGUST 2017
and bigger eggs at longer spawning intervals. A study by the Asian Institute of Technology on hapa-in-pond systems showed that diets with 25- 30% crude protein were more productive than a 15.5%-protein diet. Most of the commercial tilapia hatcheries in Thailand use catfish pellets containing 25-27% crude protein for their broodfish reared in hapa-in-pond systems (Bhujel, 2001).
7.2 LIPIDS
Some research has been done on lipids, the importance of which
has only been realized recently. In a 60 days trial, tilapia females fed a diet with squid meal spawned good-quality eggs throughout the spawning season. Groups previously fed without supplementary squid meal spawned better and with improved hatching rates within 10 days, once they were fed the squid meal. Egg quality is affected by a dietary shortage of some fatty acids. A feeding trial with diets containing 5% oils showed higher seed production from fish fed with a soybean oil (a source of 18:2, omega-6 fatty acid) diet when compared to diets with cod liver oil, corn oil, coconut oil, or a combination of cod liver and corn oils. The Asian Institute of Technology is currently trying to find suitable oils or essential fatty acids that will particularly benefit Nile tilapia seed production (Jauncey, 2000).
7.3 VITAMINS
Dietary supplementation of ascorbic acid has positive effects on reproductive performance in various fish species. It has been suggested that ascorbic acid at 1250 mg/kg diet improves the hatchability of eggs, andcondition and survival of fry. Although the condition has not been
properly investigated, Vitamin E deficiency may cause a lack of sexual coloration and reduce reproductive activity in tilapia. If tilapia broodfish are reared in green water system, supplementation of vitamins through diet is not necessary, because the available natural food organisms are rich in vitamins (Mjounet al., 2010).).
www.ijmer.in 128
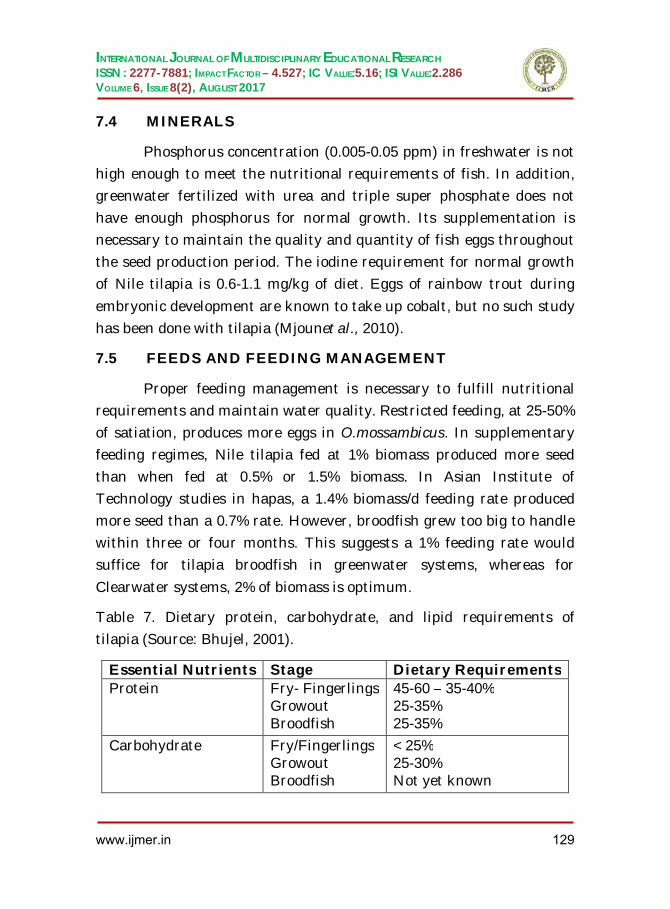
INTERNATIONAL JOURNAL OF MULTIDISCIPLINARY EDUCATIONAL RESEARCH
ISSN : 2277-7881; IMPACT FACTOR – 4.527; IC VALUE:5.16; ISI VALUE:2.286 VOLUME 6, ISSUE 8(2), AUGUST 2017
7.4 MINERALS
Phosphorus concentration (0.005-0.05 ppm) in freshwater is not high enough to meet the nutritional requirements of fish. In addition, greenwater fertilized with urea and triple super phosphate does not have enough phosphorus for normal growth. Its supplementation is necessary to maintain the quality and quantity of fish eggs throughout the seed production period. The iodine requirement for normal growth of Nile tilapia is 0.6-1.1 mg/kg of diet. Eggs of rainbow trout during
embryonic development are known to take up cobalt, but no such study has been done with tilapia (Mjounet al., 2010).
7.5 FEEDS AND FEEDING MANAGEMENT
Proper feeding management is necessary to fulfill nutritional requirements and maintain water quality. Restricted feeding, at 25-50% of satiation, produces more eggs in O.mossambicus. In supplementary feeding regimes, Nile tilapia fed at 1% biomass produced more seed than when fed at 0.5% or 1.5% biomass. In Asian Institute of Technology studies in hapas, a 1.4% biomass/d feeding rate produced more seed than a 0.7% rate. However, broodfish grew too big to handle within three or four months. This suggests a 1% feeding rate would suffice for tilapia broodfish in greenwater systems, whereas for
Clearwater systems, 2% of biomass is optimum.
Table 7. Dietary protein, carbohydrate, and lipid requirements of tilapia (Source: Bhujel, 2001).
Essential Nutrients Stage Dietary Requirements Protein Fry- Fingerlings
Growout Broodfish
45-60 – 35-40% 25-35% 25-35%
Carbohydrate Fry/Fingerlings Growout Broodfish
<25% 25-30% Not yet known
www.ijmer.in 129

INTERNATIONAL JOURNAL OF MULTIDISCIPLINARY EDUCATIONAL RESEARCH
ISSN : 2277-7881; IMPACT FACTOR – 4.527; IC VALUE:5.16; ISI VALUE:2.286 VOLUME 6, ISSUE 8(2), AUGUST 2017
Protein: Energy Ratio Fry/Fingerlings
Growout Broodfish
120-110 mg/kg 103 mg/kg Not yet known
Lipids: Total Omega-6 EFA Omega-3 EFA
Fry Adult All stages
5-8% 8-10% 0.5-1.0% 0.5-1.0%
7. CONCLUSION
Tilapias, especially O. niloticus, have been the focus of much research and promotion around the world. They are cultured in fresh and saline waters, and in extensive to super-intensive systems. While
feeding management differs widely depending on the culture system, nutrient requirements for tilapia are not available for all production systems and species cultured. Considerable efforts have been made seeking alternative, less-expensive diets, but very limited work has been done to determine the levels of lipids, vitamins, and minerals required by tilapia. Further advances in tilapia research should include development of cold tolerance, disease resistance, and improved flesh and fry quality through improvements in feed formulation and management. Determination of optimum nutrient and feeding levels to maximize profits, rather than growth and reproductive performances, could be more relevant tocommercial projects.
REFERENCES
Abdelghany A. E (1996). Growth response of Nile tilapia, Oreochromisniloticus, to dietarL-ascorbic acid, Lascorbyl- 2-sulfate, and L-ascorbyl-2-polyphosphate. J. World Aquacult. Soc. Vol. 27, PP. 449–455.
Abdelghany, A. E (1996). Growth response of Nile tilapia, Oreochromisniloticus, to dietary L-ascorbic acid, Lascorbyl- 2-
www.ijmer.in 130

INTERNATIONAL JOURNAL OF MULTIDISCIPLINARY EDUCATIONAL RESEARCH
ISSN : 2277-7881; IMPACT FACTOR – 4.527; IC VALUE:5.16; ISI VALUE:2.286 VOLUME 6, ISSUE 8(2), AUGUST 2017
sulfate, and L-ascorbyl-2-polyphosphate. J. World Aquacult. Soc. Vol. 27: PP. 449–455.
ADB (2005). An impact evaluation of the development of genetically improved farm tilapia and their dissemination in selected countries. Operations Evaluation Department. Asian Development Bank. Manila, Philippines.
Al Hafedh, Y. S (1999). Effects of dietary protein on growth and body composition of Nile tilapia, OreochromisniloticusL. Aquaculture Research. Vol. 30, PP. 385–393.
Bhujel, R. C (2001). Recent Advances: Tilapia Nutrition, Feed and Management.Asian Institute of Technology. KlongLuangPathumthani, Thailand, PP. 44-47.
Caulton, M. S. (1982). Feeding, metabolism and growth of tilapias- some quantitative considerations. In: Pullin R.S.V. and Lowe-McConnell R.H. (eds), The Biology and Culture of Tilapia. ICLARM, Manila, The Philippines, PP. 157–184.
Cisse, A. (1988). Effects of varying protein levels on spawning frequency and growth of Sarotherodonmelanotheron. In: Pullin, R. S. V., Bhukaswan, T., Tonguthai, K. and Maclean, J. L. (eds.). Proc. 2nd Intl. Symp. on Tilapia in Aquaculture. ICLARM, Manila, Philppines, PP. 329-333.
Dabrowska, H.; Guenther, K. D. and Meyer-Burgdorff, K. (1989). Availability of various magnesium compounds to tilapia (Oreochromisniloticus). Aquaculture. Vol. 76, PP. 269–276.
Davis, A. T. and Stickney, R. R. (1978). Growth responses of Tilapia aureato dietary protein quality and quantity. Trans. Am. Fish. Soc. Vol. 107, PP. 479-483.
De Silva, S. S. and Radampola, K. (1990). Effect of dietary protein level on the reproductive performance of Oreochromisniloticus. In: Hirano, R. and Hanyu, I. (eds.). Proceedings of the Second Asian Fisheries Forum, Asian Fisheries Society, Manila, Philippines, PP. 559-563.
De Silva, S. S.; Subasinghe, R. P.; Bartley, D. M. and Lowther, A. (2004). Tilapias as alien aquatics in Asia and the Pacific: a review. FAO, Fisheries Technical Paper. No. 453. Rome, FAO.
Diana, J. S.; Lin, C. K., and Jaiyen, K. (1994). Supplemental feeding of tilapia in fertilized ponds. Journal of the World Aquaculture Society. Vol. 25, PP. 497-506.
www.ijmer.in 131

INTERNATIONAL JOURNAL OF MULTIDISCIPLINARY EDUCATIONAL RESEARCH
ISSN : 2277-7881; IMPACT FACTOR – 4.527; IC VALUE:5.16; ISI VALUE:2.286 VOLUME 6, ISSUE 8(2), AUGUST 2017
Eid, A. E., and Ghonim, S. I. (1994). Dietary zinc requirement of
fingerling Oreochromisniloticus. Aquaculture. Vol. 119, PP. 259–264.
El-Sayed, A. F. M. (1987). Protein and energy requirements of Tilapia zillii. Ph.D. Thesis, Michigan State University, East Lansing, Michigan, USA, PP. 147.
El-Sayed, A. F. M. and Teshima, S. (1992). Protein and energy requirement of Nile tilapia, Oreochromisniloticus, fry. Aquaculture. Vol. 103, PP. 55-63.
El-Sayed, A. M. (2006). Tilapia culture in salt water: environmental requirements, nutritional implications and economic potentials. Eighth symposium on advances in nutritional aquaculture. November 15-17, Nuevo Leon, Maxico.
El-Sayed, A. M. (2006). Tilapia culture in salt water: environmental requirements, nutritional implications and economic potentials. Eighth symposium on advances in nutritional aquaculture. November 15-17, Nuevo Leon, Maxico.
El-Sayed, A. M., Mansour, C. R. and Ezzat, A. A. (2003). Effects of dietary protein levels on spawning performance of Nile tilapia (Oreochromisniloticus) broodstock reared at different water salinities. Aquaculture. Vol. 220, PP. 619-632.
El-Sayed, A.F.M. (2004). Protein nutrition of farmed Tilapia: Searching for unconventional sources. In: ‘New dimensions on farmed tilapia,’ Proc. Ofthe 6th international symposium on tilapia inaquaculture 12–16 September 2004, edited by R. B. Bolivar, G. C. Mair, and K. Fitzsimmons. Manila, Philippines: ISTA Publications, PP. 364-378.
El-Sayed, A.M. (1989). Evaluation of semipurified test diets for Tilapia zilliifingerlings. J. World Aquacult. Soc. Vol. 20(4), PP. 240-244.
El-Sherif, M. S. and EL-Feky, A. M. (2008). Effect of ammonia on Nile Tilapia (O. niloticus) performance and some hematological and histological measures. Eighth International Symposium on Tilapia in Aquaculture. Cairo, Egypt.
FAO (2014). The State of World Fisheries and Aquaculture. Food and Agricultural Organization. Rome.
FAO (2016). Fisheries and Aquaculture Information and Statistical Branch. Food and Agricultural Organization. United Nations.
www.ijmer.in 132

INTERNATIONAL JOURNAL OF MULTIDISCIPLINARY EDUCATIONAL RESEARCH
ISSN : 2277-7881; IMPACT FACTOR – 4.527; IC VALUE:5.16; ISI VALUE:2.286 VOLUME 6, ISSUE 8(2), AUGUST 2017
Hu, C. J.; Chen, S. M.; Pan, C. H. and Huang, C. H. (2006). Effects of
dietary vitamin A or - carotene concentrations on growth of juvenile hybrid tilapia, Oreochromisniloticus× O. aureus. Aquaculture. Vol. 253, PP. 602–607.
Jauncey, K, and Ross, B. (1982). A Guide to Tilapia Feeds and Feeding. University of Stirling, Scotland, PP. 111.
Jauncey. K. (2000). Nutritional requirements. In: M. C. M. Beveridge and B. J. McAndrew (eds.) Tilapias: Biology and Exploitation, Fish and Fisheries Series 25, Kluwer Academic Publishers, Dordrecht, The Netherlands, PP. 327–375.
Lim, C., and Leamaster, B. (1991). Thiamin requirement of red hybrid tilapia grown in sea water. J. World Aquacult. Soc. Vol. 22, PP. 36.
Lim, C.; Barros, M. M.; Klesius, P. H. and Shoemaker, C. A. (2000). Thiamin requirement of Nile tilapia, Oreochromisniloticus. In: Book of Abstracts. Aquaculture America 2000, New Orleans, Louisiana. Baton Rouge, Louisiana: World Aquaculture Society, PP. 201.
Lim, C.; Leamaster, B. and Brock. J. A. (1993). Riboflavin requirement of fingerling red hybrid tilapia grown in seawater. J. World Aquacult. Soc. Vol. 24, PP. 451–458.
Luquet, P. (1989). Practical consideration on the protein nutrition and feeding of tilapia. Aquat. Liv. Resour. Vol. 2, PP. 99-104.
Magid, A. and Babiker, M. M. (1975). Oxygen consumption and respiratory behaviour of three Nile fishes. Hydrobiologia. Vol. 46, PP. 359–367.
Magid, A., and M. M. Babiker (1975). Oxygen consumption and respiratory behaviour of three Nile fishes. Hydrobiologia. Vol. 46, PP. 359–367.
Mazid, A. M., Tanaka, Y., Katayama, T., Rahman, A. M., Simpson, K. L., and Chichester, C. O.(1979). Growth response of Tilapia zilliifingerlings fed isocaloric diets with variable protein levels. Aquaculture. Vol. 18, PP. 115-122.
McClain, W. R. and Gatlin, D. M. (1988). Dietary zinc requirement of Oreochromis aureus and effects of dietary calcium and phytate on zinc bioavailability. J. World Aquacult. Soc. Vol. 19, PP. 103–108.
www.ijmer.in 133

INTERNATIONAL JOURNAL OF MULTIDISCIPLINARY EDUCATIONAL RESEARCH
ISSN : 2277-7881; IMPACT FACTOR – 4.527; IC VALUE:5.16; ISI VALUE:2.286 VOLUME 6, ISSUE 8(2), AUGUST 2017
Mires, D. (1995). The tilapias. In: Production of Aquatic Animals:
Fishes (eds Nash, C. E., and A. J. Novotony. Elsevier, New York, PP. 133–152.
Mjoun, K.; Rosentrater, K. A. and Brown, M. L. (2010). Tilapia: Environmental Biology and
Nutritional Requirements. South Dakota State University, Vietnam, PP. 1-7.
O’Connel, J. P. and Gatlin D. M. (1994). Effect of calcium and vitamin D3 on weight gain and mineral composition of the blue tilapia (Oreochromis aureus) in lowcalcium water. Aquaculture. Vol. 125, PP. 107–117.
Redner, B. D., and R. R. Stickney. (1979). Acclimation to ammonia by Tilapia aurea. Trans. Am. Fish. Soc. Vol.108, PP. 383–388.
Reigh, R. C.; Robinson, E. H. and Brown, P. B. (1991). Effects of dietary magnesium on growth and tissue magnesium content of blue tilapia (Oreochromis aureus). J. World Aquacult. Soc. Vol. 22, PP. 192–200.
Robinson, E. H.; LaBomascus, D.; Brown, P. B. and Linton, T. L. (1987). Dietary calcium and phosphorus requirements of Oreochromis aureus reared in calcium-free water. Aquaculture. Vol. 64: 267–276.
Roem A. J.; Stickney, R. R. and Kohler, C. C. (1991). Dietary pantothenic acid requirement of the blue tilapia. Prog. Fish-Cult. Vol. 53, PP. 216–219.
Ross, L. G. (2000). Environmental physiology and energetics. In: M. C. M. Beveridge and B. J. McAndrew (eds.) Tilapias: Biology and Exploitation, Fish and Fisheries Series 25, Kluwer Academic Publishers, Dordrecht. The Netherlands, PP. 89–128.
Saleh, G.; Eleraku, W. and Gropp, J. M. (1995). A short note on the effects of vitamin A hypervitaminosis on health and growth of Tilapia nilotica (Oreochromisniloticus). J. Appl. Ichthyol. Vol. 11, PP. 382–385.
Santiago, C. B., and Lovell, R. T. (1988). Amino acid requirement for growth of Nile tilapia. J. Nutr. Vol. 118, PP. 1540–1546.
Sarig, S. (1969). Winter storage of tilapia. FAO Fish Culture Bulletin. Vol. 2, PP. 8–9.
Shiau, S. Y. and Chin, Y. H. (1999). Estimation of the dietary biotin requirement of the juvenile hybrid tilapia
www.ijmer.in 134

INTERNATIONAL JOURNAL OF MULTIDISCIPLINARY EDUCATIONAL RESEARCH
ISSN : 2277-7881; IMPACT FACTOR – 4.527; IC VALUE:5.16; ISI VALUE:2.286 VOLUME 6, ISSUE 8(2), AUGUST 2017
Oreochromisniloticus× O. aureus. Aquaculture. Vol. 170, PP. 71–78.
Shiau, S. Y. and Hsieh, H. L. (1997). Vitamin B6 requirements of tilapia Oreochromisniloticus× O. aureus fed two dietary protein concentrations. Fish. Sci. Vol. 63, PP. 1002–1007.
Shiau, S. Y. and Hsieh, J. F. (2001). Quantifying the dietary potassium requirement of juvenile hybrid tilapia (Oreochromisniloticus × O. aureus). Br. J. Nutr. Vol. 85, PP. 213–218.
Shiau, S. Y. and Hwang, J. Y. (1993). Vitamin D requirements of juvenile hybrid tilapia, Oreochromisniloticus× O.aureus. Bull. Jpn. Soc. Sci. Fish. Vol. 59, PP. 553–558.
Shiau, S. Y. and Peng, C. Y. (1993). Protein sparing effect by carbohydrates in diets for tilapia, Oreochromisniloticusx O. aureus. Aquaculture. Vol. 117, PP. 327-334.
Shiau, S. Y. and Shy, S. M. (1998). Dietary chromic oxide inclusion level required maximize glucose utilization in hybrid tilapia, Oreochromisniloticus HO. aureus. Aquaculture. Vol. 161, PP. 357–364.
Shiau, S. Y. and Suen, G. S. (1992). Estimation of the niacin requirements for tilapia fed diets containing glucose or dextrin. J. Nutr. Vol. 122, PP. 2030–2036.
Shiau, S. Y., and Huang, S. Y. (2001). Dietary folic acid requirement for maximum growth of juvenile tilapia Oreochromisniloticus× O. aureus. Fish. Sci. Vol. 67, PP. 655–659.
Shiau, S. Y., and Lin, S. F. (1993). Effects of supplementation dietary chromium and vanadium on the utilization of different carbohydrates in tilapia, OreochromisniloticusHO. aureus. Aquaculture. Vol. 110, PP. 321–330.
Siddiqui, A. Q.; M. S. Howlander, and A. A. Adam. (1988). Effects of dietary protein levels on growth, diet conversion and protein utilization in fry and young Nile tilapia, Oreochromisniloticus. Aquaculture. Vol. 70, PP. 63–70.
Soliman, A. K., and Wilson, R. P. (1992). Water-soluble vitamin requirements of tilapia. Riboflavin requirement of blue tilapia Oreochromis aureus. Aquaculture. Vol. 104, PP. 309–314.
Soliman, A. K.; Jauncey, K. and Roberts, R. J. (1994). Watersoluble vitamin requirements of tilapia: ascorbic acid (vitamin C) requirement of Nile tilapia, Oreochromisniloticus(L.). Aquacult. Fish. Manage. Vol. 25, PP. 269–278.
www.ijmer.in 135
INTERNATIONAL JOURNAL OF MULTIDISCIPLINARY EDUCATIONAL RESEARCH
ISSN : 2277-7881; IMPACT FACTOR – 4.527; IC VALUE:5.16; ISI VALUE:2.286 VOLUME 6, ISSUE 8(2), AUGUST 2017
Sumi, S. M. (2014). Suitability of ARO123 and UNH995 microsatellite
Markers in the sex linkage study of Nile tilapia (oreochromisniloticusL.). Department of fisheries biology and genetics. Bangladesh agricultural university. Mymensingh, PP. 1-4.
Teshima, S., Gonzalez, G. M. O., and Kanazawa, A. (1978). Nutntionalequipments of tilapia: utilization of dietary protein by Tilapia zillii. Mem. Fac. Fish. Kagoshima Univ. Vol. 27(1), PP. 49-57.
Twibell, R. G. and Brown, P. B. (1998). Optimal dietary protein concentration for hybrid tilapia (Oreochromisniloticusx Oreochromis aureus) fed all-plant diets. J. World Aquacult. Soc. Vol. 29(1), PP. 9-16.
Viola, S.; Zohar, G. and Arieli, Y. (1986). Phosphorus requirements and its availability from different sources for intensive pond culture species in Israel. Part I. Tilapia. Bamidgaeh. Vol. 38: 3–12.
Wang, K.; Takeuchi, T. and Watanabe, T. (1985). Effect of dietary protein levels on growth of Tilapia nilotica. Bull. Jpn. Soc. Sci. Fish. Vol. 51(l), PP. 133.
Watanabe, T.; Takeuchi, A.; Murakami, C. and Ogino, C. (1980). The availability to Tilapia niloticus of phosphorus in white fish meal. Bull. Jpn. Soc. Sci. Fish. Vol. 46, PP. 897–899.
Watanabe, W. O.; Clark, J. H.; Dunham, J. B.; Wicklund, R. I. and Olla, B. L. (1990). Culture of Florida red tilapia in marine cages: the effects of stocking and dietary protein on growth. Aquaculture. Vol. 90, PP. 123-134.
Wee, K. L. and Tuan, N. A. (1988). Effects of dietary protein levels on growth and reproduction in Nile tilapia (Oreochromisniloticus). In: R. S. V. Pullin, T. Bhukaswan, K. Tonguthai and J. L. Maclean (eds.). The Second International Symposium on Tilapia in Aquaculture, ICLARM, Manila, Philippines, PP. 401-410.
Winfree, R. A. and Stickney, R. R. (1981). Effects of dietary protein and energy on growth, feed conversion efficiency and body composition of Tilapia aurea. J. Nutr. Vol. 111(6), PP. 1001-1012.
www.ijmer.in 136

INTERNATIONAL JOURNAL OF MULTIDISCIPLINARY EDUCATIONAL RESEARCH
ISSN : 2277-7881; IMPACT FACTOR – 4.527; IC VALUE:5.16; ISI VALUE:2.286 VOLUME 6, ISSUE 8(2), AUGUST 2017
THE VARIATIONS IN THE DISTRIBUTION OF MINERAL
ELEMENTS IN SOME INTERTIDAL MARINE MACRO ALGAE OF VISAKHAPATNAM, EAST COAST OF INDIA
Y. Sarojini Department of Botany, Andhra University, Visakhapatnam 530
003. Andhra Pradesh. India
B. Sujatha Department of Botany, Andhra University, Visakhapatnam 530
003. Andhra Pradesh. India
Abstract :
Eighteen marine macro algae species were collected from the intertidal zone of Visakhapatnam coast and were analysed for the distribution of their mineral elements. Interspecific variations were observed in distribution of minerals among the algae. Of the elements Ca was highest and the descending order was followed by Fe, Na, I, Zn, K, Cu and Mn in macroalgae. Among the individual species Centroceros clavulatum, a red alga accumulated more amount of Na, K, Fe and Zn. Spongomorpha indica accumulated more Ca and Mn, Padina
tetrastromatica had more Mn and I, Grateloupia lithophila and Pterocladia heteroplatos had more Zn and I and Hypnea musciformis had more Cu. Another red alga Gracilaria corticata had less content of K, Ca, Fe, and I. The distribution of minerals was also found with the variations in different classes of algae. The K and Ca was high in Chlorophyceae, Na, Fe, Mn and Iwere high in Phaeophyceae, Fe, Zn was high in Rhodophyceae. The Cu was at undetectable level in
Chlorophyceae. Even though the Pb was analysed, it was found at undetectable level in all the species. The ratios of K/ Na, Mn/ Fe were less than one in all the species and Ca/ K was more in all the species. A significant positive correlation occurred between Mn and Ca at P ≥ 0.05 level. The variations in mineral content in algae may be attributed to susceptibility of confounding environmental factors, accumulation capacity of minerals by algae and growth phases of the plants.
www.ijmer.in 137

INTERNATIONAL JOURNAL OF MULTIDISCIPLINARY EDUCATIONAL RESEARCH
ISSN : 2277-7881; IMPACT FACTOR – 4.527; IC VALUE:5.16; ISI VALUE:2.286 VOLUME 6, ISSUE 8(2), AUGUST 2017
Key words:, Chlorophyceae, Distribution, macroalgae, minerals, Phaeophyceae, Rhodophyceae
1. Introduction
The marine macroalgae are rich in dietary fibre, vitamins, minerals and poly unsaturated fatty acids and other bioactive substances (Ito and Hori 1989, Mabeau and Fleurence 1993, Sarojini and Sarma 1999, Burtin 2003, Dawczynski et al. 2007, Sarojini and Lakshminarayana,
2009, 2011a, 2011b, 2012, Sarojini and Uma Devi 2014, Sarojini et al 2016). The marine algae contain both the macro minerals (Ca, Mg, Na, P, K) and trace metals (Fe, Zn, I, Mn, Cu etc.). They are major coastal resources which are valuable for human consumption, fodder and feed. The marine algae are well known food sources with rich iodine content also. For many decades seaweeds were the primary source of iodine for medicinal purposes. In United States seaweeds have been used to enrich soil as a source of inexpensive minerals, for animal food supplements as natural source of iodine. Seaweed as a staple diet has been used in Japan, Korea and China since prehistoric times. The other countries such as Scotland, Hawaii, Chile, Philippines, Malaysia, Bali, Korea, Singapore, Srilanka consume seaweeds in a variety of
forms. Seaweeds are one of the most important sources of calcium, and phosphorus, since they show higher content of these minerals than those of apples, oranges, carrots and Potatoes (Bocanegra et al., 2009). The most common minerals found in sea food are iodine, magnesium, calcium, phosphorus, iron and potassium (Ensminger et al., 1995). The mineral elements are separate entities from the other essential nutrients like proteins, fats, carbohydrates, and vitamins. The minerals are very important for biochemical reactions in the body as a co- factor of enzymes. For example the Ca, P and Mg can build and maintain bones and teeth whereas, Na and K help to maintain balance
of water, acids and bases in fluids outside the cells and involve in acid base balance and transfer of nutrients in and out of individual cells
www.ijmer.in 138
INTERNATIONAL JOURNAL OF MULTIDISCIPLINARY EDUCATIONAL RESEARCH
ISSN : 2277-7881; IMPACT FACTOR – 4.527; IC VALUE:5.16; ISI VALUE:2.286 VOLUME 6, ISSUE 8(2), AUGUST 2017
respectively (Ensminger et al., 1995). The nutrient elements do not act independently from each other, because, there may be direct chemical interaction between them or they may influence each others uptake, transportation and biological action. They play an important role in
photosynthesis, respiration structural formation, membrane functioning etc. The micronutrient deficiencies which are of greatest public health significance are iron deficiency, causing varying degrees of impairment in cognitive performance, anemia,lowered work capacity, lowered immunity to infections, pregnancy complications. Inadequate iodine may lead to major health conditions such as dysfunction of thyroid gland, enlargement of thyroid gland or adversely affect reproduction. An excess iodine intake may cause hyperthyroidism. Ca malnutrition causes abnormal bone formation namely Osteoporosis. The deficiency in Mg can result in a variety of metabolic abnormalities. The variations in concentration of metals in algae are often taken to reflect the metal concentration in the surrounding sea water. The minerals and salts are fixed in seaweeds in water free space (Eppley, 1962). The marine algae have high content of ash mainly due to the prescence of Na, K, Ca, Mg cations Cl and So4 anions. The
osmoregulation in marine algae is maintained by intrusion and extrusion of Na, K and Cl ions respectively (Kesava Rao and Singbal, 1995). The distribution of some elements of macroalgae was reported earlier from west coast of India (Kesava Rao and singbal, 1995, Subba Rao et al. 2006), from east cost of India (Devi et al., 2009, Sarojini and Lakshminarayana 2009, Venkateswarlu, 2014). It was since two decades, the trace elements were reported in macroalgae of Visakhapatnam coast and the macro minerals like Na, K, Ca and also I were not reported so far from the present studied species. Based on these objectives and also in view of their importance in food, fodder, medicine and cosmetics, the present study was conducted. It is also important to regularly obtain up-to-date information on the minerals
www.ijmer.in 139

INTERNATIONAL JOURNAL OF MULTIDISCIPLINARY EDUCATIONAL RESEARCH
ISSN : 2277-7881; IMPACT FACTOR – 4.527; IC VALUE:5.16; ISI VALUE:2.286 VOLUME 6, ISSUE 8(2), AUGUST 2017
content of variously and commonly consumed plant foods used for human, animal and aquaculture feeds respectively for good health.
2. Materials and methods
2.1. Collection of the algal samples and the samples prepararation for aalysis
Eighteen species of marine macro algae viz., Ulva fasciata Delile, Enteromorpha compressa (Linnaeus)Nees, Caulerpa racemosa (Forsskal) J. Agardh, C. sertularioides (S.G. Gmelin) M. Howe,
Chaetomorpha antennina (Bory)Kutzing, Spongomorpha indica Thivy & V. Visalakshi, Dictyota dichotoma (Hudson) J.V.Lamouroux, Padina tetrastromatica Hauck, Sargassum tenerrimum J. Ahardh, S. vulgare C. Agardh, Sphacelaria sp., Gelidium pusillum (Stackhouse) Le Jolis,
Pterocladia heteroplatos (Borgesan) Umamaheswara Rao, Gracilaria corticata (J.Agardh) J. Agardh, Hypnea musciformis (Wulfen) J.V.Lamouroux, Bryocladia thwaitesii (Harvey ex J. Agardh) De tony, Amphiroa fragilissima (Linnaeus) J. V. Lamouroux, Centroceras clavulatum (C. Agardh) Montagne and Grateloupia lithophila
Borgesaan were collected from November 2012 to January 2013 at the intertidal zone of Visakhapatnam coast during the low tide period. The samples were immediately brought to the laboratory in plastic bags, extraneous matter was removed, and the samples were thoroughly washed with fresh water. The samples were air dried at ambient room temperature, pulverized, labeled and preserved for analysis. The algae samples were identified by using the key published by Umamaheswara Rao and Sree Ramulu (1970) on maroalgae of Visakhapatnam and were authenticated by Dr. G. M. N. Rao, Assistant Professor in Botany and expert on marine algae, Department of Botany, Andhra University, Visakhapatnam, Andhra Pradesh, India.
www.ijmer.in 140

INTERNATIONAL JOURNAL OF MULTIDISCIPLINARY EDUCATIONAL RESEARCH
ISSN : 2277-7881; IMPACT FACTOR – 4.527; IC VALUE:5.16; ISI VALUE:2.286 VOLUME 6, ISSUE 8(2), AUGUST 2017
2.2. Estimation of mineral elements
For estimation of Na, K, Ca, Mn, Fe, Cu, Zn and Pb, ten specie of macroalgae were selected. For analysis of macro minerals such as Na, K, Ca, o.5 g of the powdered sample was made to ash at 550◦ C for 5 h in a muffle furnace. Na, K, Ca were determined on a flame photometer (Systronics, 126 model) by aspirating the standards and samples. For analysis of micro minerals suah as Mn, Fe, Cu, Zn and Pb, 0.5g of powdered sample was taken in to a conical flask, 7 ml of HNO3 was
added to it and then 3 ml of H2O2 was added. The solution was digested on a hot plate at 60 ◦C for ten minutes until the solution turns clear and then allowed to cool at room temperature. It was filtered through Whatman filter paper No 41 and the final volume was made up to 100 ml with distilled water. Then the samples were aspirated on Atomic Absorption Spectrophotometer (Varian, Austalia) for the above mentioned minral elements. The standard stock solution of Mn, Fe, Cu, Zn and Pb (Merck) were used and calibration standards of each element were obtained by appropriate dilution of the stock solution. Eighteen marine algae belonging to the above mentioned three classes of macroalgae were analysed for iodine. The iodine was determined by spectrophotometric method (Saenko et al., 1978). The Potassium iodide was used as standard and the results are expressed as mg/ 100g on dry
weight basis. The chemicals used were analytical grade. The mean, standard error and correlation coefficients were calculated using standard statistical packages.
3. Results and Discussion
3.1. Ash
The percentage of ash content (Table 1) was observed high in Chlorophyceae and low in Rhodophyceae. The ash content of marine macroalgae was occurred with a range of 9.03 to 34.54%. The maximum value for ash was recorded in S. indica, a green alga and
www.ijmer.in 141

INTERNATIONAL JOURNAL OF MULTIDISCIPLINARY EDUCATIONAL RESEARCH
ISSN : 2277-7881; IMPACT FACTOR – 4.527; IC VALUE:5.16; ISI VALUE:2.286 VOLUME 6, ISSUE 8(2), AUGUST 2017
minimum value by G. lithophila a red alga. The mean ash content of Chlorophyceae was 30.8%, Phaeophyceae was 25.4% and Rhodophyceae was 19.13%. In Chlorophyceae the ash content was 34.5% in S. indica
and 27.07% in C. antennina. Among the Phaeophyceae, it was 29.8% in P. tetrastromatica, 24.22% in S. tenerrimum, 22.56% in S. vulgare. Among the Rhodophyceae members, it was 26.74% in C. clavulatum and 9.03% in G. lithophila. In the remaining species like G. corticata, H. musciformis and P. heteroplatos the ash content varied from 17.07 to 22.87%.
Table 1. The variations in percentage of ash
SN The name of the macroalga
% Ash
1. Chaetomorpha antennina 27.07
2. Spongomorpha indica 34.54
3. Padina tetrastromatica 29.65
4. Sargassum tenerrimum 24.22
5. S. vulgare 22.56
6. Gracilaria corticata 19.04
7. Hypnea musciformis 17.97
8. Centroceros clavulatum 26.74
9. Pterocladia heteroplatos 22.87
10. Grateloupia lithophila 9.03
High proportion of ash 21.1 to 39.3% was reported for seaweeds earlier (Ruperez, 2002.). The marine algae contain high content of ash mainly due to the prescence of Na, K, Ca and Mg cations (Vinogradov, 1953). The ash content of algae was accounted by these major cations and anions (Kesava Rao and Singbal, 1996).
www.ijmer.in 142

INTERNATIONAL JOURNAL OF MULTIDISCIPLINARY EDUCATIONAL RESEARCH
ISSN : 2277-7881; IMPACT FACTOR – 4.527; IC VALUE:5.16; ISI VALUE:2.286 VOLUME 6, ISSUE 8(2), AUGUST 2017
3.2. Distribution of minerals
The distribution of minerals displayed interspecific variations among the macro algae studied. Among the minerals analysed Ca was more and the hierarchy followed the descending order of Fe, Na, Zn, I, K, Cu and Mn. In general the mineral elements distribution in the three algal classes are in decreasing order:
Chlorophyceae Ca > Fe > I > Na > K > Zn > Mn
Phaeophyceae Ca > Fe > I > Na > Zn > K > Mn > Cu
Rhodophyceae Fe > Ca > I > Cu > Na > Zn > K > Mn.
The Cu was at undetectable level in Chlorophyceae, it was less in quantity in Phaeophyceae and more in Rhodophyceae. The Fe was accumulated more in red algae than the green and brown algae. The above pattern in distribution of mineral elements is agreed with the earlier reports of Bowen (1979) and Yamamoto et al., (1984). Among the species analysed C. clavulatum have higher content of Na, K, Fe and Zn. S. indica have higher content of Ca, Mn, G. lithophila and P. heteroplatos have higher Zn, I and P. tetrastromatica have higher
content of Mn, I and H. musciformis have higher Cu. The red alga G. corticata was found with lesser content of K, Ca, Fe, and I. The classwise distribution in range and mean content of these elements is presented in Table 2. In Chlorophyceae, the sodium was ranged from 70.8 to 118.5 mg/100g dry weight with a mean of 94.66 mg/100g. In Phaeophyceae it ranged from 94.2 to 117.0 mg/100g with a mean of 106.61 mg/g. In Rhodophyceae it ranged from 85.1 to 119.2 mg/100g with a mean of 102.33 mg/100g. So, the mean values for sodium was
higher in Phaeophyceae than the Rhodophyceae and Chlorophyceae in its distribution. The Potassium in Chlorophyceae ranged from 45.6 to 61.6 mg/100g with a mean of 53.4 mg/100g. In Phaeophyceae it ranged from 29.5 to 54.5 mg/100g with a mean of 39.84 mg/100g. In Rhodophyceae it ranged from 12.6 to 64.2 mg/100g with a mean of
www.ijmer.in 143

INTERNATIONAL JOURNAL OF MULTIDISCIPLINARY EDUCATIONAL RESEARCH
ISSN : 2277-7881; IMPACT FACTOR – 4.527; IC VALUE:5.16; ISI VALUE:2.286 VOLUME 6, ISSUE 8(2), AUGUST 2017
50.85 mg/100g. Therefore the potassium was higher in Chlorophyceae than the Rhodophyceae and Phaeophyceae. The Calcium in Chlorophyceae ranged from 851.5 to 4414.0 mg/100g with a mean of 2633.0 mg/100g. In Phaeophyceae it was ranged from 917.7 to 1048.18 mg/100g with a mean of 920.39 mg/100g. In Rhodophyceae it ranged from 571.4 to 1214.5 mg/100g with a mean of 799.12 mg/100g.
Therefore the calcium was higher in Chlorophyceae than the Paeophyceae and Rhodophyceae.
Table 2. The range and mean values of minerals in the three classes of macroalgae
Element Chlorophyceae Phaeophyceae Rhodophyceae
Range Mean Range Mean (SE)
Range Mean (SE)
Na mg/100g
70.8 – 118.5
94.68 94.2 – 117.0
106.61 ± 9.4
85.1 – 119.2
102.33 ± 11.5
K mg/100g
45.1 – 61.2
53.40 29.5 – 54.5
39.84 ± 7.9
12.6 – 64.2
50.85 ± 21.5
Ca mg/100g
851.5 -4414.0
2633.0 917.7 – 1048.8
970.39 ± 56.5
571.4 – 1214.5
799.1 ± 243.6
Mn/ ppm 8.21 – 19.78
13.74 12.57 -22.3
16.55 ± 5.0
11.68 – 19.0
15.66 ± 3.3
Fe/ ppm 706.0 – 821.0
763.56 478.0 – 1016.3
790.35 ± 279.3
382.90 – 1881.0
768.04 ± 637.3
Cu/ ppm ND 0 817.8 - 9.4 – 355.4
-
Zn/ppm 27.9 – 33.0
30.62 25.3 -66.1
47.14 ± 20.5
63.0 -146.3
94.43 ± 32.0
I mg/g 0.25 -3.0 1.15 2.0 – 2.75
2.4 ± 0.37
0.20 – 6.25
1.92 ± 2.28
www.ijmer.in 144

INTERNATIONAL JOURNAL OF MULTIDISCIPLINARY EDUCATIONAL RESEARCH
ISSN : 2277-7881; IMPACT FACTOR – 4.527; IC VALUE:5.16; ISI VALUE:2.286 VOLUME 6, ISSUE 8(2), AUGUST 2017
Regarding the micro minerals, the manganese in Chlorrophyceae ranged from 8.21 to 19.28 ppm with a mean of 13.74 ppm. In Phaeophyceae it ranged from 12.57 to 22.30 ppm with a mean of 16.56 ppm. In Rhodophyceae it ranged from 11.68 to 19.0 ppm with a mean of 16.55 ppm Therefore, the mean value of manganese was higher in Phaeophyceae than the Rhodophyceae and Chlorophyceae. The ferrous
content in Chlorophyceae ranged from 706.0 to 821.0 ppm with a mean of 765.56 ppm. In Phaeophyceae it was ranged from 478.0 to 1016.3 ppm with a mean of 790.35 ppm. In Rhodophyceae it was ranged from 382.9 to 1881.0 ppm with a mean of 637.35 ppm. Therfore, ferrous was higher in Phaeophyceae than the Rhodophyceae and Chlorophyceae. The copper in Chlorophyceae was at undetectable level and it was detected only in two members of Rhodophyceae and one member of Phaeophyceae. It was in a range from 9.40 to 355.44 ppm among the three species. The zinc in Chlorophyceae ranged from 27.9 to 33.0 with a mean of 30.62 ppm. In Phaeophyceae it was ranged from 25.3 to 66.16 ppm with a mean of 47.14 ppm. In Rhodophyceae it was ranged from 63.09 to 146.30 with a mean of 94.43 ppm. Therefore, the zinc was higher in Rhodophyceae than in the Phaeophyceae and Chlorophyceae. The Pb was at undetectable level in all the ten species analysed. The iodine in Chlorophyceae ranged from 250.0 to 300.0
mg/100g with a mean of 115 mg/100g. In Phaeophyceae it was ranged from 200 to 275 mg/100g with a mean of 240 mg/100g. In Rrhodophyceae it was ranged from 20.0 to 625.0mg/100g with a mean of 192 mg/100g. Therefore the mean value for iodine was higher in Phaeophyceae than in the Rhodophyceae and Chlorophyceae. Iodine levels varied between green and red seaweeds but generally high in brown seaweeds (Dave et al., 1969). Rizvi and Shameel (2001) reported that Ca, and Fe were high in Chlorophyceae. The seaweed form one of the vegetable sources of calcium being as high as 7% of the dry weight (Burtin, 2003). The Ca as found as higher content than the other
www.ijmer.in 145

INTERNATIONAL JOURNAL OF MULTIDISCIPLINARY EDUCATIONAL RESEARCH
ISSN : 2277-7881; IMPACT FACTOR – 4.527; IC VALUE:5.16; ISI VALUE:2.286 VOLUME 6, ISSUE 8(2), AUGUST 2017
metals in marine algae (Vijayan et al. 2016). These reports from other areas agreed with the present study on mineral elements in macro algae of Visakhapatnam.
3.3 Variations in distribution of minerals
The variation in distribution of mineral elements in individual species is plotted in Figures 1 to 3. The Sodium accumulation was high in C.
clavulatum with 119.25 mg/100g dry weight. It was followed by C. antennina with 118.55 mg/100g and S. tenerrimum with 117.04 mg/100g. It was also high in S. vulgare, H. musciformis and P. heteroplatos with 108.60, 106.96, 105.46 mg/100g respectively. This content was 94.9 mg/100g in G. corticata and 94.21g/100g in P.
tetrastromatica. In G. lithophila and S. indica it was low with 85.12, 70.82 mg/100g each. Higher content of Na was also reported in H. musciformis from Karachi coast (Rizvi and Shameel, 2001), S. tenerrimum from Gulf of Mannar (Devi et al., 2009) and S. vulgare
from Mediterrenean coast (Shams El din and El- Sherif, 2012). The accumulation of potassium was also high with 64.24 mg/100g in C. clvulatum, followed by S. Indica with 61.16mg/100g, P. heteroplatos with 61.13 mg/100g and H. musciformis with 60.86 mg/100g. It was also high in G. lithophila with 55.36mg/100g and P. tetrastromatica with 54.61 mg/100g. In C. antennina it was 45.19 mg/100g. In S.
tenerrimum and in S. vulgare it was 29.56 and 35.37mg/100g each. It was very low in G. corticata with 12.69 mg/100g. The potassium was also reported high in S. tenerrimum (Devi et al., 2009), S. vulgare (Shams El Din and El-sherif, 2012) from the other coastal places. The calcium was very high with 4414.58 mg/100g in S. indica. It was also
high in P. heteroplatos with 1214.57 mg/100g, P. tetrastromatica with 1048.82 mg/100g. It was varied from 917.78 to 944.57 mg/100g in Sargassum spp. It was 707.26 to 851.52 mg/ 100g in C. antennina, H. muciformis, C. clavulatum and G. lithophila. The content was low with 571.42 mg/ 100g in G. corticata. The calcium was an abundant
www.ijmer.in 146

INTERNATIONAL JOURNAL OF MULTIDISCIPLINARY EDUCATIONAL RESEARCH
ISSN : 2277-7881; IMPACT FACTOR – 4.527; IC VALUE:5.16; ISI VALUE:2.286 VOLUME 6, ISSUE 8(2), AUGUST 2017
component of seaweeds. The RDI for calcium is 1000 mg/day. So, seaweeds consumed contribute a significant part of calcium (Smith et al., 2010). Similar findings to the present study are also available on S.
vulgare (Shams El Din and El – Sheriff, 2012) and P. tetrastromatica (Rizvi and Shameel, 2001) from other coastal areas . . The Manganese was high with 22.30 ppm in P. tetrastromatica and it also showed higher content in S. indica with 19.28 ppm, C. clavulatum with 19.0 ppm and P. heteroplatos with 18.40 ppm and G.corticata with 16.66
ppm. Among Sargassum spp., H. musciformis and G. lithophila it was varied from 11.68 to 14.80 ppm. It was low in C. antennina with 8.21 ppm. Similar findings were also reported for P. gymnosopra from other coastal places of India (Nazni and Renuga, 2014, Venkateswarlu et al., 2014). Higher content of Mn was also re[ported in P. tetrastromatica
from Mulloor coast, India (vijayan et al., 2016).
0
50
100
150 Sodium mg/100g
020406080 Potassium mg/100mg
www.ijmer.in 147

INTERNATIONAL JOURNAL OF MULTIDISCIPLINARY EDUCATIONAL RESEARCH
ISSN : 2277-7881; IMPACT FACTOR – 4.527; IC VALUE:5.16; ISI VALUE:2.286 VOLUME 6, ISSUE 8(2), AUGUST 2017
Fig. 1. The variations in distribution of Sodium, Potassium and Calcium in macroalgae
The Iron was very high in C. clavulatum with 1881.02 ppm and it was also high in S. vulgare with 1016.36 ppm, P. tetrastromatica with 876.70 ppm, S. indica with 821.07 ppm. It was 706.06 and 722.10 ppm
in H. musciformis and C. antennina respectively. It was varied from 467.0 to 178.0 ppm in P. heteroplatos and S. tenerrimum. It was low in G. corticata and G. lithophila with 382.90, 387.2 ppm each. The seaweeds have higher quantities of Mg and Fe about 15 to 25% (Home, 1969). Higher content of Fe was reported in P. gymnospora (Nazni and
Renuga, 2014, Venkateswarlu et al., 2014) from other coasts of India. The higher accumulation of Iron might be due to their complexes with protein and sulphated carbohydrates (Ganesan and Kannan, 1995). The copper was detected only in three species of macro algae viz., H. musciformis with 355.4 ppm, P. tetrastromatica with 17.80 ppm and G.lithophila with 9.40 ppm. In the remaining seven species it is at undetectable level. The present findings were agreed with the reports
on P. tetrastromatica ( Rizvi and Shameel,2001) and P. gymnospora (Venkateswarlu et al., 2014) from the other coastal areas. This level of accumulation reflects the structural and functional importance of Cu as
010002000300040005000
Calcium mg/ 100g
www.ijmer.in 148
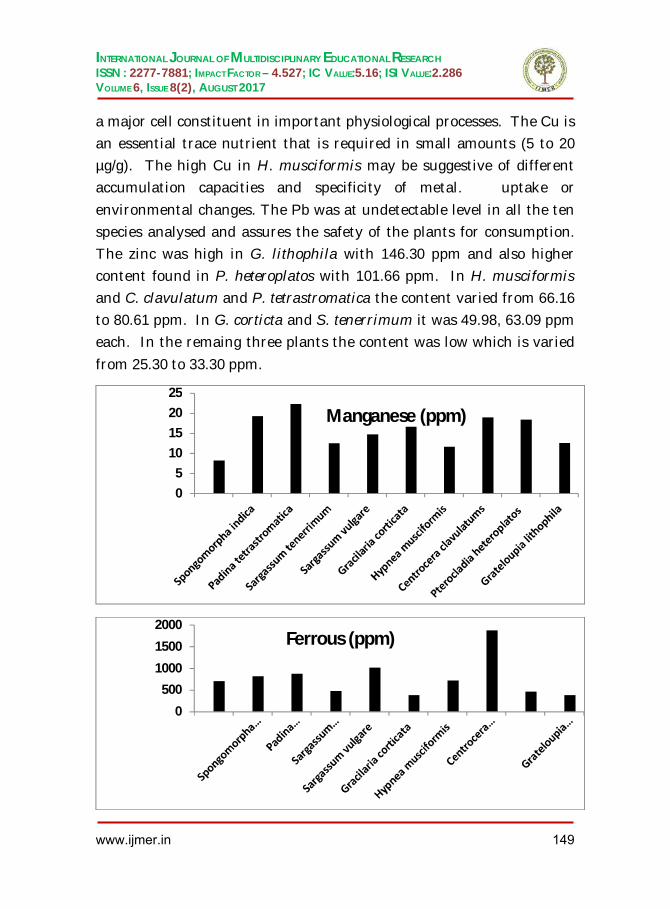
INTERNATIONAL JOURNAL OF MULTIDISCIPLINARY EDUCATIONAL RESEARCH
ISSN : 2277-7881; IMPACT FACTOR – 4.527; IC VALUE:5.16; ISI VALUE:2.286 VOLUME 6, ISSUE 8(2), AUGUST 2017
a major cell constituent in important physiological processes. The Cu is an essential trace nutrient that is required in small amounts (5 to 20 µg/g). The high Cu in H. musciformis may be suggestive of different accumulation capacities and specificity of metal. uptake or
environmental changes. The Pb was at undetectable level in all the ten species analysed and assures the safety of the plants for consumption. The zinc was high in G. lithophila with 146.30 ppm and also higher content found in P. heteroplatos with 101.66 ppm. In H. musciformis and C. clavulatum and P. tetrastromatica the content varied from 66.16 to 80.61 ppm. In G. corticta and S. tenerrimum it was 49.98, 63.09 ppm each. In the remaing three plants the content was low which is varied
from 25.30 to 33.30 ppm.
05
10152025
Manganese (ppm)
0
500
1000
1500
2000Ferrous (ppm)
www.ijmer.in 149

INTERNATIONAL JOURNAL OF MULTIDISCIPLINARY EDUCATIONAL RESEARCH
ISSN : 2277-7881; IMPACT FACTOR – 4.527; IC VALUE:5.16; ISI VALUE:2.286 VOLUME 6, ISSUE 8(2), AUGUST 2017
Fig. 2. The variations in distribution of Manganese, Ferrous and Copper in macroalgae
Similar findings in Gracilaria was reported from Karachi coast (Rizvi znd Shameel, 2001). The iodine content was very high in G. lithophila with 625.0 mg/100g and higher content was also observed in P.
heteroplatos with 325.0 mg/100g and E. compressa with 300.0 mg/g. Among the Phaeophyceae members such as P. tetrastromatica, D. dichotoma, Sphacelaria sp., S. tenerrimum and S. vulgare the content varied from 200.0 to 275.0 mg/100g. In A. fragilissima a Rhodophyceae
member, it was 250mg/100g. In S. indica it was 150 mg/g, in C. sertularioides and H. musciformis it was 75 mg/100g each. Among C. racemosa, U. fasciata, G. corticata and C. clavulatum it was 25 mg/100g. In the remaining four species it was 20 mg/100g of each. Some species of seaweeds especially the red and brown seaweeds have ability to accumulate iodine and thus are more concentrated source of it (Kaliaperumal et al., 1987), Sargassum (Dave et al., 196) from Indian
coastal places. Higher levels of iodine in brown seaweeds was also reported earlier (Teas et al., 2004, Dawczynski et al., 2007), higher levels of iodine was also reported in Enteromorpha (Dhargalkar, 2014), the seaweeds are considered as rich sources of minerals especially the Na and I (Vijayan et al., 2016).
0100200300400
Copper (ppm)
www.ijmer.in 150
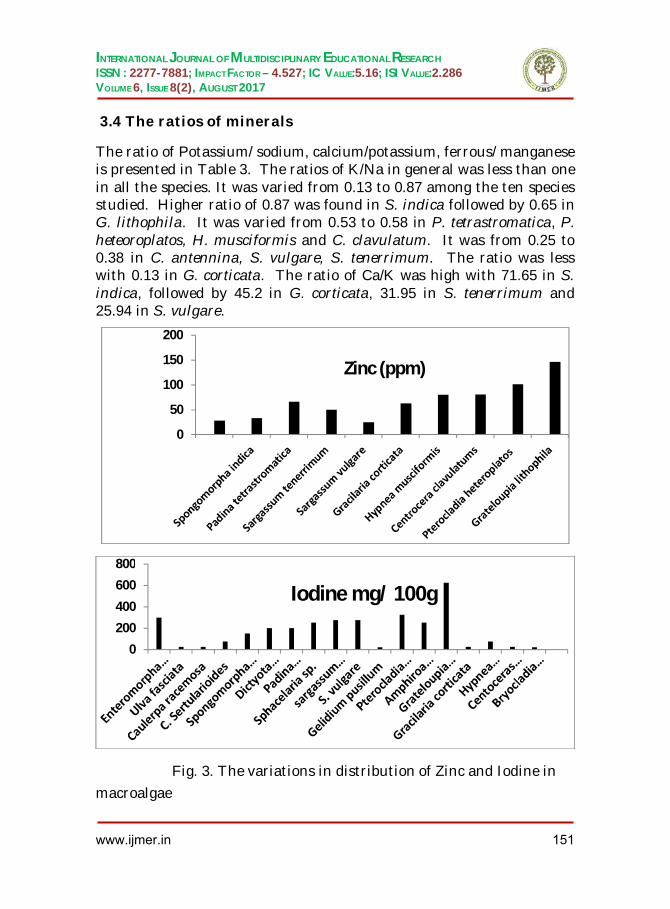
INTERNATIONAL JOURNAL OF MULTIDISCIPLINARY EDUCATIONAL RESEARCH
ISSN : 2277-7881; IMPACT FACTOR – 4.527; IC VALUE:5.16; ISI VALUE:2.286 VOLUME 6, ISSUE 8(2), AUGUST 2017
3.4 The ratios of minerals
The ratio of Potassium/ sodium, calcium/potassium, ferrous/ manganese is presented in Table 3. The ratios of K/Na in general was less than one in all the species. It was varied from 0.13 to 0.87 among the ten species studied. Higher ratio of 0.87 was found in S. indica followed by 0.65 in G. lithophila. It was varied from 0.53 to 0.58 in P. tetrastromatica, P. heteoroplatos, H. musciformis and C. clavulatum. It was from 0.25 to 0.38 in C. antennina, S. vulgare, S. tenerrimum. The ratio was less with 0.13 in G. corticata. The ratio of Ca/K was high with 71.65 in S. indica, followed by 45.2 in G. corticata, 31.95 in S. tenerrimum and 25.94 in S. vulgare.
Fig. 3. The variations in distribution of Zinc and Iodine in macroalgae
0
50
100
150
200
Zinc (ppm)
0
200
400
600
800
Iodine mg/ 100g
www.ijmer.in 151
INTERNATIONAL JOURNAL OF MULTIDISCIPLINARY EDUCATIONAL RESEARCH
ISSN : 2277-7881; IMPACT FACTOR – 4.527; IC VALUE:5.16; ISI VALUE:2.286 VOLUME 6, ISSUE 8(2), AUGUST 2017
MISSION KAKATIYA TO BOOST FISH PRODUCTION IN
TELANGANA STATE
B.Srishylam1 *, Dr.S.Ramesh Babu2* G. Srinivas Reddy3,
M.Shiva Kumar4,
Dept. of P.G. Zoology, Govt. Degree & P.G. College (A), Siddipet,Dist, Telangana
e-mail: [email protected], [email protected]
Telangana state is having vast inland fishery potential under reservoirs, tanks and ponds. There are 78 reservoirs having water spread area of 1089 Lakh Ha, 35031 tanks having water spread area of 4.02 Lakh Ha. and 474 ponds having water spread area of 781 Ha. In addition to this 5573 K.M of rivers and canals the fishermen population of the state is 19.04 lakh and there are 3732 fishermen co-operative societies with a membership of 239365. Due to the drought since many years fish industry in Telangana was undeveloped. But in 2014, the government of the newly carved state of Telangana launched an ambitious project, titled Mission Kakatiya. It was aimed at
the rejuvenating of the 35031tanks and lakes spread over thirty one districts of the State by the year 2020, to bring them back to their past glory, the glory they had when such structures were first built during
the rule of the Kakatiya dynasty, which ruled the region. A notable trend during the dynastic period was the construction of reservoirs for irrigation in the uplands, and around 5,000 of them were built by warrior families', subordinate to the Kakatiya rulers.
To promote the fishery, Telangana government had started free distribution of fingerlings of about 37 crore fingerlings at a cost of Rs. 48 crore in all the districts, This will benefit 19.04 Lakh fishermen in the state
The vision of the Telangana state government and fisheries department is optimal utilization of natural resources for fish
www.ijmer.in 152
INTERNATIONAL JOURNAL OF MULTIDISCIPLINARY EDUCATIONAL RESEARCH
ISSN : 2277-7881; IMPACT FACTOR – 4.527; IC VALUE:5.16; ISI VALUE:2.286 VOLUME 6, ISSUE 8(2), AUGUST 2017
production, promote fresh water aquaculture, supported by infrastructure and trained manpower. And the mission of the fisheries is holistic development of the sector with focus on enhancement of productivity, self sufficiency in fish seed demand, supply of fish at an affordable price in hygienic conditions and render welfare schemes to fishers
Key words: Inland fishery, Rejuvenating, Irrigation.
INTRODUCTION:
IMPORTANCE OF THE TANKS IN THE TELANGANA STATE
Tanks have been the life line of Telangana owing to the state's geographical positioning. The people of the state are highly dependent on the tanks which are spread across all the 10 districts. The
topography and rainfall pattern in Telangana have made tank irrigation an ideal type of irrigation by storing and regulating water flow for agricultural use.
Construction of tanks in Telangana has been an age old activity since pre Satavahana era. During the Kakatiya era, the construction of tanks was carried out with utmost technical expertise. Tanks such as Ramappa, Pakhala, Laknavaram, Ghanapuram, Bayyaram which were built by Kakatiyas resemble seas and they greatly helped agriculture and overall development and prosperity of the Kakatiya kingdom.
This vision and legacy of Kakatiyas were carried forward by Qutubshahis and Asafjahis who ruled this region for centuries. Hundreds of big and small tanks were built in Telangana region during their rule. Government desires to uphold the vision of Kakatiyas which envisages revival and restoration of Minor Irrigation Sources in
Telangana State.
Tank irrigation has huge bearing on generation of rural employment, poverty reduction and agricultural growth. The sheer size
www.ijmer.in 153

INTERNATIONAL JOURNAL OF MULTIDISCIPLINARY EDUCATIONAL RESEARCH
ISSN : 2277-7881; IMPACT FACTOR – 4.527; IC VALUE:5.16; ISI VALUE:2.286 VOLUME 6, ISSUE 8(2), AUGUST 2017
of command area under tank irrigation makes it a large center of agricultural production and provides a critical opportunity for commercial agriculture through market linkages.
IMPORATANCE OF MISSION KAKATIYA IN TELANGANA STATE
The Government of Telangana has taken up a massive programme of Restoration of all Minor Irrigation Tanks numbering 46531, under MISSION KAKATIYA (Mana Ooru – Mana Cheruvu) in a decentralised manner through community involvement. The objective of Mission Kakatiya is to enhance the development of Minor Irrigation
infrastructure, strengthening community based irrigation management, adopting a comprehensive programme for restoration of tanks. While appreciating the initiative, it is advisable for implementing agencies to take note of gathered data from different tank rehabilitation exercises carried out in Karnataka, Pondicherry, Tamilnadu and Sri Lanka.
Fisheries are one of the fast growing sectors contributing to GSDP of the State as well as generating income and employment. The sector aims at exploitation of all the possible resources under capture and culture fishery base for increasing fish production and productivity through sustainable development. The sector is contributing considerably to food security, nutrition and health, livelihood security to the rural population, and welfare of fishers.
IMPORTANT STEPS TAKEN BY THE GOVERNMENT OF TELANGANA
Registration of Fresh Water Aquaculture Strengthening of Fisheries Database and networking Housing scheme for fishermen
Group Accident Insurance Scheme for Fishermen Training and Extension
www.ijmer.in 154

INTERNATIONAL JOURNAL OF MULTIDISCIPLINARY EDUCATIONAL RESEARCH
ISSN : 2277-7881; IMPACT FACTOR – 4.527; IC VALUE:5.16; ISI VALUE:2.286 VOLUME 6, ISSUE 8(2), AUGUST 2017
Assistance to Fisheries societies (Supply of fish seed to
Fishermen Cooperative Societies) Supply of ice-boxes Supply of inputs i.e., fish seed, feed etc., Supply of Boats and nets
OBJECTIVE OF MISSION KAKATIYA:
The objective of Mission Kakatiya is to enhance the development of agriculture based income for small and marginal farmers, by
accelerating the development of minor irrigation infrastructure, strengthening community based irrigation management and adopting a comprehensive programme for restoration of tanks.
The Government has prioritized to take the restoration of minor irrigation tanks to restore them to store their original capacity and to effectively utilize 255 TMC of water allocated for Minor irrigation sector under Godavari & Krishna River basins.
The minimum ayacut that can be irrigated with the above allocated water is about 20 lakh acres.
But as per the statistics the ayacut now being irrigated is only about 9 to 10 lakh acres under Minor Irrigation tanks. Thus, there is a gap ayacut of about 10 lakh acres.
The reasons for this gap ayacut under Minor Irrigation tanks are due to.
1) Loss of water storage capacity of tanks due to accumulation of silt in
tank beds over a long period.
2) Due to dilapidated sluices, weirs and weak bunds
3) Due to defunct of feeder channels.
4) Due to dilapidated condition of Irrigation canals.
www.ijmer.in 155

INTERNATIONAL JOURNAL OF MULTIDISCIPLINARY EDUCATIONAL RESEARCH
ISSN : 2277-7881; IMPACT FACTOR – 4.527; IC VALUE:5.16; ISI VALUE:2.286 VOLUME 6, ISSUE 8(2), AUGUST 2017
OBJECTIVES OF THE STUDY:
1. To study the impact of mission kakatiya on fishery 2. To estimate the fish production after the mission kakatiya 3. Socio economic status of fishermen in Telangana state
RESEARCH METHODOLOGY:
1. Field visit to the different tanks of the Telangana state. 2. Interaction with the fishermen of different regions of the state.
REPORT OF THE STUDY:
Expenditure spent by the government Total cost Rs. in Lakh 2472160
This will benefit 19.04 Lakh fishermen in the Telangana state
FISH PRODUCTION BEFORE MISSION KAKATIYA IN TELANGANA
Year
Freshwater Fish Production in tonn
2006-07 604311 2007-08 688301 2008-09 149049 2009-10 133613 2010-11 133587 2011-12 196708 2012-13 214591 2013-14 243037 2014-15 260010
www.ijmer.in 156

INTERNATIONAL JOURNAL OF MULTIDISCIPLINARY EDUCATIONAL RESEARCH
ISSN : 2277-7881; IMPACT FACTOR – 4.527; IC VALUE:5.16; ISI VALUE:2.286 VOLUME 6, ISSUE 8(2), AUGUST 2017
Estimated Fish production after initiation of mission kaktiya
Year
Estimated Freshwater Fish Production in tonn
2015-16 307354 2016-17 376552
0
50000
100000
150000
200000
250000
300000
2008-09 2009-10 2010-11 2011-12 2012-13 2013-14 2014-15
0
50000
100000
150000
200000
250000
300000
350000
400000
2015-16 2016-17
www.ijmer.in 157
INTERNATIONAL JOURNAL OF MULTIDISCIPLINARY EDUCATIONAL RESEARCH
ISSN : 2277-7881; IMPACT FACTOR – 4.527; IC VALUE:5.16; ISI VALUE:2.286 VOLUME 6, ISSUE 8(2), AUGUST 2017
Results and Discussion:
Mission Kakatiya is a boon for the fishery industry and fishermen in the Telangana State. It increased fish production and improved socio economic status of the fishermen about 19.04 Lakh by the rejuvenation of 35031 tanks of the Telangana State.
References:
Chary KD (2003). Present status, Management and Economics of Fisheries of a minor Reservoir, Durgamcheruvu of Rangareddy District, Ph.D. thesis, Osmania University, Hyderabad
http://missionkakatiya.cgg.gov.in
Suresh, V.R. (2003). Status of Laktak lake fisheries and approach for their sustainable development. Fishing Chimes, 23(3): 40–44.
www.tgnns.com
www.ijmer.in 158

INTERNATIONAL JOURNAL OF MULTIDISCIPLINARY EDUCATIONAL RESEARCH
ISSN : 2277-7881; IMPACT FACTOR – 4.527; IC VALUE:5.16; ISI VALUE:2.286 VOLUME 6, ISSUE 8(2), AUGUST 2017
SOCIO-ECONOMIC CONDITION OF FISHERMEN AND ITS
IMPACT ON ENVIRONMENT: A CASE STUDY OF ARYAPALLI OF GANJAM DISTRICT, ODISHA
Ritanjali Swain and Lakshman Nayak
Post Graduate Department of Marine Sciences, Berhampur University, Berhampur -760007, Odisha.
Email- [email protected]
ABSTRACT
Ganjam district is one of the coastal districts of Odisha. The fishermen of Aryapalli are of two types depending on fishing. Nolias are
fishermen generally depend on sea fishing. Kaibartas are the fishermen depend on inland fishing. There are about1721 household with a total population of 8001. The Kaibarta families are 187 and Nolia families are 1534. Out of the total population 3997 are male and 4004 are female. There are 2080 married male and 2076 married female. 1910 are unmarried male and 1899 are unmarried female. Only 21 widows and 15 divorce cases are present in the village. The literate rate is 30.4% pre-primary, 26.1% primary and upper primary, 19.4% secondary and 7.8% graduate and above. The illiterate person is 16.3%. Among the literate 35 numbers are service holders. Annual income varies from Rs 28,800 to 39,500 only. Out of the total income a lion’s share is claimed for food and a minimum share is claimed for social customs. Road is the way of communication to this village. Peoples are availing loans from nationalized banks. Electricity is available to this village.
There is no pure drinking water supply; however 4 tube wells are there to meet the water requirement for the fishermen. There is no Government medical hospital facility but only two private clinics are available. There is no toilet in every household of this village so they use the open field as their toilet, which pollute the environment.
www.ijmer.in 159

INTERNATIONAL JOURNAL OF MULTIDISCIPLINARY EDUCATIONAL RESEARCH
ISSN : 2277-7881; IMPACT FACTOR – 4.527; IC VALUE:5.16; ISI VALUE:2.286 VOLUME 6, ISSUE 8(2), AUGUST 2017
INTRODUCTION
The fish production has increased in the world since the last decade being 167.2 million tonnes during 2013-2014 (FAO 2016). India ranks 2nd among the fish producing countries of the world whereas China is the first. The fish production of India was 5.68 million tonnes during 2013-2014. The fish production of Odisha was 5.21 metric tonnes during 2015-2016. Fish production plays an important role in Indian
economy. India has also exhibited an increase in fish production in both marine and freshwater. The fish export from India is also increasing from year to year. The fishermen are separated into a different community. The total community can be classified in to two groups. One who depends on inland fishing called “Kaibartas” or “keuta” and the other one who depends on marine fishing are called Nolias”. (Nayak et al., 2008). The marine fishermen of Ganjam district are engaged in sea fishing throughout the year. The fishermen use different types of gear such as shore seine, drift net, gill net to catch sardine and prawns (Jhingran 1982). Gill net, Khanda jal and Hook and line to capture fish and crabs. (Deka 2015). The fishermen are poor because they never get 360 days for fishing, Most of the time the fishing is banned due to turtle
nesting along Odisha Coast.
METHODOLOGY
The study was carried out depending on both primary and secondary data of fishermen of Aryapalli of Ganjam district during 2016. The primary data were collected through a questionnaire envisaging marital
www.ijmer.in 160

INTERNATIONAL JOURNAL OF MULTIDISCIPLINARY EDUCATIONAL RESEARCH
ISSN : 2277-7881; IMPACT FACTOR – 4.527; IC VALUE:5.16; ISI VALUE:2.286 VOLUME 6, ISSUE 8(2), AUGUST 2017
status, educational status, monthly income, type of houses, source of drinking water, Main occupation, source of fuel, health facilities, etc. Whereas secondary data were obtained from block and other offices during months of July to October while visit to the village Aryapalli. This village is about 15 km from Berhampur University. Calculations
were made for percentage of marital status and educational status. The Anganabadi Kendra is located in the Aryapalli Village fig.1 and School fig.2. The fishing was carried out by country boat fig.3.
Fig. 1: Anganabadi Kendra and Gramapachayat Kendra of Aryapalli
Fig 2: School of Aryapalli
www.ijmer.in 161

INTERNATIONAL JOURNAL OF MULTIDISCIPLINARY EDUCATIONAL RESEARCH
ISSN : 2277-7881; IMPACT FACTOR – 4.527; IC VALUE:5.16; ISI VALUE:2.286 VOLUME 6, ISSUE 8(2), AUGUST 2017
Figure 3: Boats and Gears of Aryapalli
RESULTS AND DISCUSSION
The total household of the village is 1721 with population of 8001 people out of which, 505 are schedule caste (SC) and 5 are schedule
tribe (ST). The population consists of 3997 male and 4004 female (Table-1). There are Antyodaya Yojana (AAY) and Priority household (PHH) cards are available in families. The village is inhabited by different communities of people like fishers, Brahmins, Bariks and Milkmen. Males are considered to the chief of the family who earn for the family. In few fishermen families, the female and old age people share their income to the family. The age group 15-45 makes certain contribution to the family income as they go for fishing and allied activities. Children below 14 years don’t play any role in fishing activities.
Table-1: Distribution of fishermen population by age and sex of Aryapalli during 2016.
Sl. No. Age group Male % Female % Total % 1 0-14 1300 49.67 1317 50.32 2617 32.71 2 15-30 1150 50.54 1125 49.45 2275 28.44 3 30-50 980 49.74 990 50.25 1970 24.62 4 Above 50 567 49.78 572 50.21 1139 14.23 Total 3997 49.95 4004 50.04 8001 100
www.ijmer.in 162

INTERNATIONAL JOURNAL OF MULTIDISCIPLINARY EDUCATIONAL RESEARCH
ISSN : 2277-7881; IMPACT FACTOR – 4.527; IC VALUE:5.16; ISI VALUE:2.286 VOLUME 6, ISSUE 8(2), AUGUST 2017
MONTHLY INCOME
Almost all the fishermen families are below poverty line. The main source of their income comes from fishing, sale or dried fishes and trashes. The average monthly income of the fishermen ranges between Rs 28,800 to 39,500. Among dried fishes, prawns provide them a good income. Very small fishes like shrimps are seen dried in whole. These dried fishes are supplied to merchants for sale in our country (Sujatha,
1999). The average number of members in a family has been considered as five, because two children of below 10 years age are equivalent to be one adult person as for as the food consumption is concerned. The highest amount of expenditure was observed towards education which was 19.37% and lowest amount of expenditure was observed in case of social customs which is about 6.87% of the total expenditure (Table-2). A major share is utilised on liquor, which is the habit of the fishermen.
Table-2: Monthly income and expenditure of people of Aryapalli village during 2016.
Sl. No. Sources Amount in Rupees % 1 Food 3900 12.19 2 Health 4250 13.29 3 Education 6200 19.37 4 Maintenance 2750 8.59 5 Social Customs 2200 6.87 6 Repair of Boats and Nets 4500 14.06 7 Liquor 2700 8.44 8 Others 5500 17.19
Total 32000 100
MARITAL STATUS
The fishermen community belong to Hindu social system. In their society, marriage is treated as a sacred bond between man and his wife. They get married by traditional method. The total population is 8001 in
www.ijmer.in 163
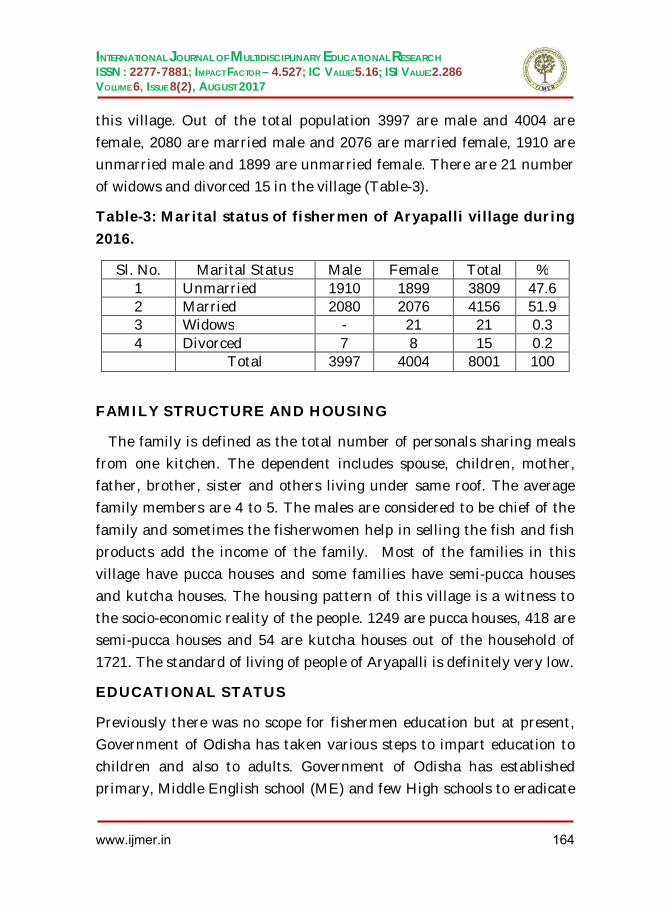
INTERNATIONAL JOURNAL OF MULTIDISCIPLINARY EDUCATIONAL RESEARCH
ISSN : 2277-7881; IMPACT FACTOR – 4.527; IC VALUE:5.16; ISI VALUE:2.286 VOLUME 6, ISSUE 8(2), AUGUST 2017
this village. Out of the total population 3997 are male and 4004 are female, 2080 are married male and 2076 are married female, 1910 are unmarried male and 1899 are unmarried female. There are 21 number of widows and divorced 15 in the village (Table-3).
Table-3: Marital status of fishermen of Aryapalli village during 2016.
Sl. No. Marital Status Male Female Total % 1 Unmarried 1910 1899 3809 47.6 2 Married 2080 2076 4156 51.9 3 Widows - 21 21 0.3 4 Divorced 7 8 15 0.2 Total 3997 4004 8001 100
FAMILY STRUCTURE AND HOUSING
The family is defined as the total number of personals sharing meals from one kitchen. The dependent includes spouse, children, mother, father, brother, sister and others living under same roof. The average family members are 4 to 5. The males are considered to be chief of the
family and sometimes the fisherwomen help in selling the fish and fish products add the income of the family. Most of the families in this village have pucca houses and some families have semi-pucca houses and kutcha houses. The housing pattern of this village is a witness to the socio-economic reality of the people. 1249 are pucca houses, 418 are semi-pucca houses and 54 are kutcha houses out of the household of 1721. The standard of living of people of Aryapalli is definitely very low.
EDUCATIONAL STATUS
Previously there was no scope for fishermen education but at present, Government of Odisha has taken various steps to impart education to children and also to adults. Government of Odisha has established primary, Middle English school (ME) and few High schools to eradicate
www.ijmer.in 164

INTERNATIONAL JOURNAL OF MULTIDISCIPLINARY EDUCATIONAL RESEARCH
ISSN : 2277-7881; IMPACT FACTOR – 4.527; IC VALUE:5.16; ISI VALUE:2.286 VOLUME 6, ISSUE 8(2), AUGUST 2017
illiteracy among fishermen. There is pre-primary, primary, Middle English and secondary/high school present in village. The school is situated in the village Aryapalli and for graduate and above people are going to Chatrapur and Berhampur University for further studies. Literacy among the female is low as compared to male (Table 4).
Table-4: Educational status of fishermen of Aryapalli Village during 2016.
Sl. No.
Educational level
Male Female Total No. % No. % No. %
1 Pre-primary 1200 30.02 1230 30.71
2430
30.4
2 Primary and upper primary
1015 25.39 1074 26.82
2089
26.1
3 Secondary 850 21.26 700 17.48
1550
19.4
4 Graduate and above 430 10.75 200 4.99 630 7.8 5 Illiterate 502 12.55 800 19.9
8 1302
16.3
6 Total 3997 4004 8001
100
SOURCES OF DRINKING WATER
Ganjam district is a coastal area situated near the Bay of Bengal. So there is no problem of water but clean drinking water scarcity is a problem here. The provision of drinking water in the village of the
district seems to be a perennial problem. Government has provided tube-wells for drinking water. Four tube-wells have been provided by Government for drinking water. Three open wells are there in the village for other uses.
SOURCES OF FUEL
Fuel is the most important component of the house. People of Aryapalli use fire-wood, kerosene as their fuel for cooking and some peoples are
www.ijmer.in 165
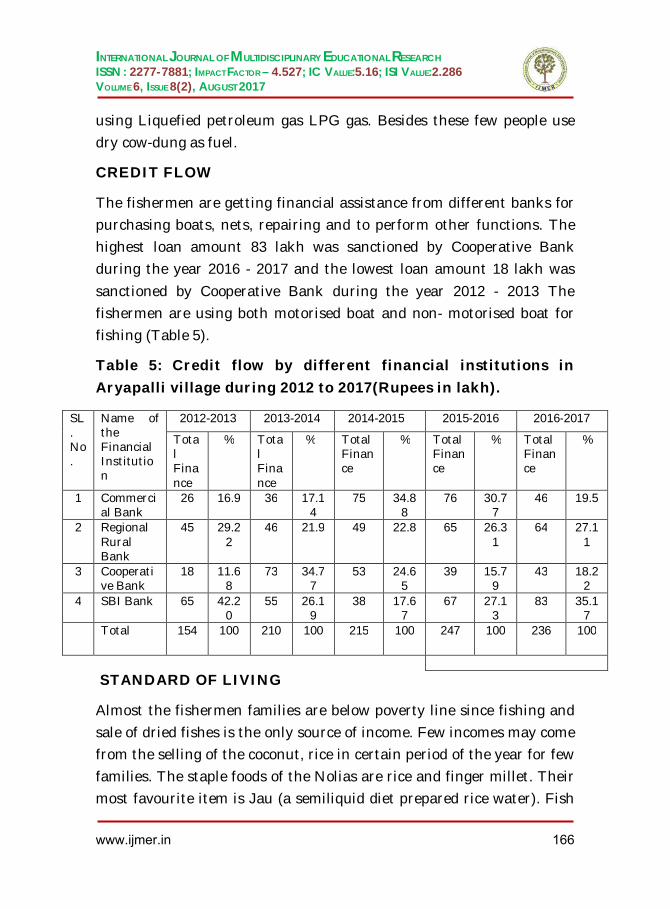
INTERNATIONAL JOURNAL OF MULTIDISCIPLINARY EDUCATIONAL RESEARCH
ISSN : 2277-7881; IMPACT FACTOR – 4.527; IC VALUE:5.16; ISI VALUE:2.286 VOLUME 6, ISSUE 8(2), AUGUST 2017
using Liquefied petroleum gas LPG gas. Besides these few people use dry cow-dung as fuel.
CREDIT FLOW
The fishermen are getting financial assistance from different banks for purchasing boats, nets, repairing and to perform other functions. The highest loan amount 83 lakh was sanctioned by Cooperative Bank during the year 2016 - 2017 and the lowest loan amount 18 lakh was
sanctioned by Cooperative Bank during the year 2012 - 2013 The fishermen are using both motorised boat and non- motorised boat for fishing (Table 5).
Table 5: Credit flow by different financial institutions in Aryapalli village during 2012 to 2017(Rupees in lakh).
STANDARD OF LIVING
Almost the fishermen families are below poverty line since fishing and sale of dried fishes is the only source of income. Few incomes may come from the selling of the coconut, rice in certain period of the year for few families. The staple foods of the Nolias are rice and finger millet. Their most favourite item is Jau (a semiliquid diet prepared rice water). Fish
SL. No.
Name of the Financial Institution
2012-2013 2013-2014 2014-2015 2015-2016 2016-2017
Total Finance
% Total Finance
% Total Finance
% Total Finance
% Total Finance
%
1 Commercial Bank
26 16.9 36 17.14
75 34.88
76 30.77
46 19.5
2 Regional Rural Bank
45 29.22
46 21.9 49 22.8 65 26.31
64 27.11
3 Cooperative Bank
18 11.68
73 34.77
53 24.65
39 15.79
43 18.22
4 SBI Bank 65 42.20
55 26.19
38 17.67
67 27.13
83 35.17
Total 154 100 210 100 215 100 247 100 236 100
www.ijmer.in 166

INTERNATIONAL JOURNAL OF MULTIDISCIPLINARY EDUCATIONAL RESEARCH
ISSN : 2277-7881; IMPACT FACTOR – 4.527; IC VALUE:5.16; ISI VALUE:2.286 VOLUME 6, ISSUE 8(2), AUGUST 2017
curry is their most common item. Seldom have they taken mutton and dal. Almost all Nolias and Kaibarts prefer to take Kanji, an item prepared from leafy vegetables with fermented watery residues of boiled rice (Sahoo et al., 1994).
HEALTH AND SANITATION
Health status is the basic factor to judge one’s status in a family or in the community (Nayak and Mishra, 2008). Saha and Banerjee (1991) have studied the health status of rural fisherman and recommended for providing better facilities to them. There are two private clinics present in village to meet the requirement of the Health check up.
COMMUNICATION
Almost all the villages in the district are connected with road. But this village road condition is not so good. Most of the people are using mobile phones for communication purpose.
MARKETING
Fish and allied fish products are the only source of income for the fishermen. But there is lack of marketing facilities. The main production of the village rice and coconut, some of them sell their products, moving from villages to villages or at best in local market of Chatrapur.
PRESERVATION AND STORAGE FACILITIES
There is facility for the preservation and storage of fishes in the village. Some fishermen after landing of fishes sell their catches to the merchants. The merchants collect a large amount of fishes of different species from various landing centre, preserve them in ice and supply
them to distant places for higher profit. In spite of refrigeration facilities the merchants usually earn good profit because the fishermen are not interested to preserve the fishes. Due to lack of adequate
www.ijmer.in 167

INTERNATIONAL JOURNAL OF MULTIDISCIPLINARY EDUCATIONAL RESEARCH
ISSN : 2277-7881; IMPACT FACTOR – 4.527; IC VALUE:5.16; ISI VALUE:2.286 VOLUME 6, ISSUE 8(2), AUGUST 2017
facilities of export, the traders face a lot of problem in exporting marine fishes to foreign countries.
CRAFT AND GEAR
The Aryapalli fishermen are presently using two types of craft such as: Motorised craft and non-motorised craft. There are 285 motorised craft and 45 non-motorised craft in operation for fishing activities in Aryapalli. They are using Gill net, Khanda jal, Hook and Line to
capture fish and crabs from the sea. There is one Jetty, one landing centre, Godowns and one ice plant in the village (Table-6).
Table-6: Fisheries infrastructure available in the village Aryapalli during 2016.
Nos of Boats Motorised 285 Non Motorised 45
Jetties Nos in village 1 Distance(Km) to nearest jetty
Fish landing centre Nos in village 1 Distance(Km) to nearest landing centre
Fish market Nos in village 1 Distance(Km) to nearest market 12
Godown Nos in village 1 Distance(Km) to nearest Godown 2
Ice plants Nos in village 1 Distance(Km) to nearest Ice plants 2
EFFECT ON ENVIRONMENT
The fishermen are below poverty line. They do not have capacity to construct a low cost latrine. So they use the open field as their toilet. There is every possibility of vulnerable to skin diseases, bacterial infection and protozoal infections due to the open discharge of night soil (Nayak et al., 2006). The main risks to human health arise from the breeding of disease vectors, primary flies and rats. A common
www.ijmer.in 168
INTERNATIONAL JOURNAL OF MULTIDISCIPLINARY EDUCATIONAL RESEARCH
ISSN : 2277-7881; IMPACT FACTOR – 4.527; IC VALUE:5.16; ISI VALUE:2.286 VOLUME 6, ISSUE 8(2), AUGUST 2017
transmission route of bacillary dysentery, amoebic dysentery and diarrhoeal diseases in India is from human faeces by flies to food and water, then to human. It has been estimated that in warm climates, faeces produced by the local community produces as many as 70,000 flies per 0.03m3 in a week. Uncontrolled scattered night soil destroys
beauty of country sides and there is danger of water pollution when leachate from the human faeces enters surface of ground water resources. The research work carried out by the scientists have shown that higher incidence of intestinal parasites have been observed in the coastal fishermen than in any other population as a whole. It has also been observed that the fishermen who are using open field as toilet were found to be astonishingly less immune against infectious diseases and fall ill with toxoplasmosis.
Conclusion
The present study provides as the status of living of the fishermen of Ganjam district in general and the fishermen community the Aryapalli in particular. There is a difficulty in construction and maintenance of sanitary facilities in this village. So Government should develop infrastructure component such as generating energy from the solar system and construction of toilets in each and every household for making the environment clean.
REFERENCES
Deka, Dr. R. M (2015). Kapla beel and its impact on socio-economic
condition of department people. “Asian journal of science and technology”. 6 (4). 1282-1284.
FAO (2016). The state of world fisheries and aquaculture. 1-24.
Jhingran, V. G (1982). Fisheries in Indian Sea. In: Fish and Fisheries of Indian, Hindustan publishing corporation, Delhi. 525-539.
www.ijmer.in 169

INTERNATIONAL JOURNAL OF MULTIDISCIPLINARY EDUCATIONAL RESEARCH
ISSN : 2277-7881; IMPACT FACTOR – 4.527; IC VALUE:5.16; ISI VALUE:2.286 VOLUME 6, ISSUE 8(2), AUGUST 2017
Nayak, L, Mishra, A. K., Samantaraya, S. and Achary, S (2006). Socio-
economic condition of fishermen of Khirisahi of Chilika lagoon, Orissa. Proceeding of Seminar on environment management of Chilika Lake and its importance in tourism. K.B.D.A.V. College, Nirakarpur. 42-47.
Nayak, L. and Mishra, A. K (2008). Socio-economic condition of fishermen and its effect on environment: A case study of Ganjam district, Orissa. “Nature environment and pollution technology”. 7 (1). 111-116.
Nayak, L., Mohapatra, R. and Swain, D (2008). Socio-economic condition of fishermen of Mainsha of Chilika lagoon, Orissa. “Eco-Chronicle”. 3 (3). 215-220.
Saha, A. K. and Banerjee, K (1991). Condition and status of rural
women – A survey. Kurukshetra. 30-31.
Sahoo, H., Misra, M. K. and Nisanka, S. K (1994). Environment and Socio-economic characteristics of the Nolias of Coastal Orissa, India. “Journal of Human ecology”. 5 (2). 77-83.
Sujatha, K (1999). Contribution of fisher women in post harvest handling: Visakhapatnam coast. Fishing Chimes. 28-32.
www.ijmer.in 170
INTERNATIONAL JOURNAL OF MULTIDISCIPLINARY EDUCATIONAL RESEARCH
ISSN : 2277-7881; IMPACT FACTOR – 4.527; IC VALUE:5.16; ISI VALUE:2.286 VOLUME 6, ISSUE 8(2), AUGUST 2017
SEASONAL VARIATION OF THE PHYSICOCHEMICAL
PROPERTIES OF NAGAVALI ESTUARY, NORTHEAST COAST OF INDIA
Ramesh Babu, K. and Kurma Rao, R. Department of Marine Living Resources, College of Science and
Technology, Andhra University, Visakhapatnam-530 003
Corresponding author E-mail: [email protected]
Abstract:
The present study was carried out to determine the physico-chemical characteristics of Nagavali estuary, Northeast coast of India, for a period of one year from January 2009 to December 2010. The study revealed that the physico-chemical parameters like atmospheric temperature, surface water temperature, transparency, hydrogen ion concentration, salinity, dissolved oxygen, rainfall exhibited considerable seasonal variations.
Key words: Seasonal variation, physico-chemical parameters, Nagavali
estuary.
Introduction
Estuarine environmental study has accelerated during the past two decades since estuaries support a rich pelagic, benthic communities and serves as excellent nursery and feeding grounds for many commercially important fishes and shrimps (Ganapati, 1975). The faunal distribution and productivity of estuary depends on various physico-chemical factors such as temperature, pH, salinity, DO and nutrients such as nitrate, phosphate and silicate. Several investigations have been carried out on the physico-chemical features of northeast coast of Indian estuaries viz., Mahanadi estuary (Pravat Ranjan Dixit et al., 2013), Gauthami Godavari estuary (Umamaheswara Rao et al., 2015), Sarada Varaha
estuarine confluence point (Vijaya Pratap and Ramesh Babu, 2015),
www.ijmer.in 171

INTERNATIONAL JOURNAL OF MULTIDISCIPLINARY EDUCATIONAL RESEARCH
ISSN : 2277-7881; IMPACT FACTOR – 4.527; IC VALUE:5.16; ISI VALUE:2.286 VOLUME 6, ISSUE 8(2), AUGUST 2017
Gosthani estuary (Sobha Rani, 2016). Very limited reports are available on the physico-chemical characteristics in Nagavalli estuary. Hence the present study was conducted to study the physico-chemical parameters of water in the Nagavali estuary, northeast coast of India.
Material and Methods
The Nagavali estuary located between 18° 21′ N latitude and 83° 94′ E longitude. It extended an area of 136 hectares, and joins Bay of
Bengal by a river opening which is 485 m wide. The river is Nagavali flows at a distance of 220 km long and originates from Orissa. In its lower part, this river is known as ‘Lungutla’. It flow through Hatipathar, where it zigzags into a deep cut valley leaving huge boulders precariously perched on rocky beds. From there, the Nagavali traverses all the way in the state of Andhra Pradesh for about 115 km. During the period, Nagavali flows through the districts of Vizianagaram and Srikakulam and finally drenches into the Bay of Bengal near Mofaz Bandar. Its chief tributary, the Swarnamukhi also originates from Orissa. The River Nagavali is one of the main rivers of Southern Orissa and North Eastern Andhra Pradesh State in India, between Mahanadi and Godavari basins. The river rise in the eastern slopes of the Eastern Ghats near Lakhbahal in the Kalahandi district of Orissa at an elevation of about 1,300 meters. Sea water enters into this
opening during the rainy seasons. It receives fresh water from north western side through the Ganagalavanipata village at Srikakulam district. Due to poor rain fall during summer the water flow is less from upstream. Fresh water enters estuary over a period of 8 to 9 months in a year. Due to this reason high saline conditions are recorded in the estuary. The catchment area of the basin is 9,510 square kilometers.
The estuary also supported a great varieties of fin and shell fishes are in common peanaeid shrimps Penaeus monodon,,mud crabs Scylla serrata and mullets M. cephalus, L. macrolepis, L.prsia, L.tade V.
www.ijmer.in 172

INTERNATIONAL JOURNAL OF MULTIDISCIPLINARY EDUCATIONAL RESEARCH
ISSN : 2277-7881; IMPACT FACTOR – 4.527; IC VALUE:5.16; ISI VALUE:2.286 VOLUME 6, ISSUE 8(2), AUGUST 2017
cunnesius and V. speigleri, and the cresent perch Terapan jarbua, Garres filamentaosus, indian sand whiting Sillago sihama, milk fish
Chanos chanos and Spotted butter fish Scatophagus argas Asian seabass Lates calcarifer.
Rainfall data were obtained from the office of the meteorological unit of Govt. of India, located at the Andhra University (Visakhapatnam). Temperature was measured using a standard centigrade thermometer. Salinity was estimated with the help of refractometer (ERMA, Hand Refractometer, and Japan) and pH was measured using a ELICO Grip pH meter. Dissolved oxygen was estimated by the modified Winklers method (Strickland and Parsons,
1972).
www.ijmer.in 173
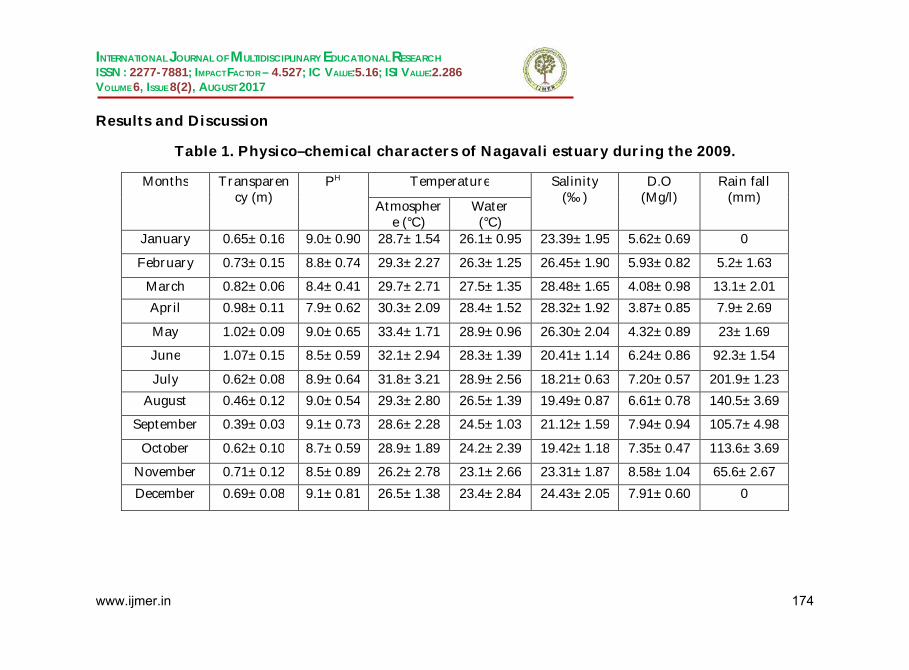
INTERNATIONAL JOURNAL OF MULTIDISCIPLINARY EDUCATIONAL RESEARCH
ISSN : 2277-7881; IMPACT FACTOR – 4.527; IC VALUE:5.16; ISI VALUE:2.286 VOLUME 6, ISSUE 8(2), AUGUST 2017
Results and Discussion
Table 1. Physico–chemical characters of Nagavali estuary during the 2009.
Months Transparency (m)
PH
Temperature Salinity (‰)
D.O (Mg/l)
Rain fall (mm)
Atmosphere (°C)
Water (°C)
January 0.65±0.16 9.0±0.90 28.7±1.54 26.1±0.95 23.39±1.95 5.62±0.69 0
February 0.73±0.15 8.8±0.74 29.3±2.27 26.3±1.25 26.45±1.90 5.93±0.82 5.2±1.63
March 0.82±0.06 8.4±0.41 29.7±2.71 27.5±1.35 28.48±1.65 4.08±0.98 13.1±2.01
April 0.98±0.11 7.9±0.62 30.3±2.09 28.4±1.52 28.32±1.92 3.87±0.85 7.9±2.69
May 1.02±0.09 9.0±0.65 33.4±1.71 28.9±0.96 26.30±2.04 4.32±0.89 23±1.69
June 1.07±0.15 8.5±0.59 32.1±2.94 28.3±1.39 20.41±1.14 6.24±0.86 92.3±1.54
July 0.62±0.08 8.9±0.64 31.8±3.21 28.9±2.56 18.21±0.63 7.20±0.57 201.9±1.23
August 0.46±0.12 9.0±0.54 29.3±2.80 26.5±1.39 19.49±0.87 6.61±0.78 140.5±3.69
September 0.39±0.03 9.1±0.73 28.6±2.28 24.5±1.03 21.12±1.59 7.94±0.94 105.7±4.98
October 0.62±0.10 8.7±0.59 28.9±1.89 24.2±2.39 19.42±1.18 7.35±0.47 113.6±3.69
November 0.71±0.12 8.5±0.89 26.2±2.78 23.1±2.66 23.31±1.87 8.58±1.04 65.6±2.67
December 0.69±0.08 9.1±0.81 26.5±1.38 23.4±2.84 24.43±2.05 7.91±0.60 0
www.ijmer.in 174

INTERNATIONAL JOURNAL OF MULTIDISCIPLINARY EDUCATIONAL RESEARCH
ISSN : 2277-7881; IMPACT FACTOR – 4.527; IC VALUE:5.16; ISI VALUE:2.286 VOLUME 6, ISSUE 8(2), AUGUST 2017
Table 2. Physico–chemical characters of Nagavali estuary during the 2010.
Months Transparency (m)
PH
Temperature Salinity (‰)
D.O (Mg/l)
Rain fall (mm) Atmospher
e (°C) Water (°C)
January 0.48±0.13 8.5±0.68 27.1±1.54 26.4±1.48 24.16±2.33 6.30±0.75 6.0±1.39 February 0.55±0.15 8.9±0.57 28.2±2.27 26.8±1.05 27.41±2.89 6.89±1.59 14.3±0.68
March 0.72±0.19 9.0±0.60 30.1±2.71 27.9±1.35 29.50±2.33 4.97±0.87 14.9±1.34 April 0.80±0.16 8.0±0.64 32.2±2.18 28.1±1.52 30.61±2.26 5.89±1.07 5.6±2.69 May 1.17±0.36 9.0±0.65 34.3±1.52 29.8±1.06 30.31±1.92 5.62±0.54 162.1±1.35 June 0.95±0.14 8.9±0.57 32.5±3.00 29.1±1.48 22.53±1.07 6.52±0.95 131.2±1.67 July 0.70±0.18 9.0±0.62 32.6±3.41 28.2±2.69 18.65±0.82 6.24±0.55 215.7±0.94
August 0.53±0.15 9.1±0.67 29.5±2.82 27.0±2.32 17.57±0.91 7.02±1.55 232.0±1.34 September 0.41±0.12 9.1±0.95 28.2±2.39 25.1±0.76 18.23±1.17 8.41±1.06 192.4±3.29
October 0.52±0.10 8.7±0.55 28.5±1.88 26.2±1.60 18.52±1.42 7.89±0.90 291.2±2.65 November 0.63±0.20 8.2±0.61 26.8±2.65 23.2±2.16 20.88±1.86 5.31±1.13 268.3±2.45 December 0.68±0.25 9.0±0.70 26.6±1.35 22.1±2.69 23.61±1.89 6.05±0.76 110.3±2.11
www.ijmer.in 175

INTERNATIONAL JOURNAL OF MULTIDISCIPLINARY EDUCATIONAL RESEARCH
ISSN : 2277-7881; IMPACT FACTOR – 4.527; IC VALUE:5.16; ISI VALUE:2.286 VOLUME 6, ISSUE 8(2), AUGUST 2017
Table 3. Correlation coefficient matrix of physico-chemical parameters of Nagavali estuary during the year 2009-2010
1 -.284 .665** .551** .535** -.584** -.258.178 .000 .005 .007 .003 .224
-.284 1 .022 -.063 -.335 .393 .194.178 .919 .771 .109 .057 .363.665** .022 1 .890** .213 -.412* .059.000 .919 .000 .317 .046 .785.551** -.063 .890** 1 .289 -.469* -.063.005 .771 .000 .171 .021 .769.535** -.335 .213 .289 1 -.601** -.719**.007 .109 .317 .171 .002 .000
-.584** .393 -.412* -.469* -.601** 1 .368.003 .057 .046 .021 .002 .077
-.258 .194 .059 -.063 -.719** .368 1.224 .363 .785 .769 .000 .077
Transparency
pH
Atmosphere
Water
Salinity
D.O
Rainfall
Transparency pH Atmosphere Water Salinity D.O Rainfall
Correlation is significant at the 0.01 level (2-tailed).**.
Correlation is significant at the 0.05 level (2-tailed).*.
At Nagavali estuary during the year 2009 transparency fluctuated between 0.39±0.03 to 1.07±0.15. Where as in the year 2010, the lowest value of 0.41±0.12 and highest value of transparency 1.17±0.36 was recorded (Table 1& 2). Suspended particles absorb heat, which causes water temperature to increase and it holds less oxygen than cold water (Voluntary estuary monitoring manual chapter 15,
2012). Similar trend in transparency values were recorded in Sarada and Varaha Estuarine confluent point by Vijaya Pratap and Ramesh Babu, 2015 (Table 1, 2 and 3).
The pH of water may influence many biological and chemical processes in natural waters (Saad, 1978). Higher pH observed during post monsoon can be ascribed to increase in temperatures and subsequent evaporation of water coupled with increase of salinity (Upadhaya, 1988). This can also be due to the removal of Co2 by photosynthesis through bicarbonate degradation, dilution of seawater by freshwater influx, reduction of salinity and temperature and decomposition of organic matter as stated by Ragothaman and Patil (1995) In the
www.ijmer.in 176
INTERNATIONAL JOURNAL OF MULTIDISCIPLINARY EDUCATIONAL RESEARCH
ISSN : 2277-7881; IMPACT FACTOR – 4.527; IC VALUE:5.16; ISI VALUE:2.286 VOLUME 6, ISSUE 8(2), AUGUST 2017
present study, the pH ranged from 7.9±0.62 to 9.1 ±0.95 in the estuary of Nagavali. But in the mangroves at Pitchavaram, an acidic pH (with a pH range of 4.9 to 7.2) is reported by Govindasamy and Kannan (1991). Further, the pH of water in present study is reported low during monsoon season that may be due to the freshwater inflow
and decomposition of organic matter, as suggested by Murugan and Ayyakkannu (1991) (Table 1, 2 and 3)
The atmospheric temperature fluctuated between 26.2±2.78 °C (November 2009) and 34.3±1.52°C (May 2010). The surface water temperature varied from 22.1±2.69°C (December 2010) to 29.8±1.06°C (May 2010) during the study period. The highest value of surface water temperature (29.8°C) is recorded in May (Summer Season) and the lowest (22.1°C) in December (winter season). In the present study, summer peaks and monsoonal troughs in air and water temperature are noticed, it also observed earlier by several workers like Ragothaman and Ramachandra Reddy (1982), 20 and 38°C in Tapi estuary; Balakrishna Nair and Abdul Azis (1987), 17 to 36°C in Ashtamudi estuary; Desai (1992), 17 to 38°C in Gulf of Kachchh; Patra et al.,
(1990), 18 to 32°C in Mandarmani Canal mangroves in West Bengal; Selvam et al., (1992), 26.9 to 31.2°C (Water temperature) in mangroves along Kakinada coasts and Kesavan et al., (2007), 19 to 37 and 17 to 35°C (atmospheric and water temperature) in Godavari mangroves. Generally, the surface water temperature is influenced by the intensity of solar radiation, evaporation, insulation, freshwater influx and cooling and mix up with ebb and flow from adjoining neritic waters. Qasim (1969) has also supplemented this fact by suggesting that the freshwater discharge alone is not responsible for the changes in temperature (Table 1, 2 and 3).
Salinity fluctuated between 18.21±0.63 to 28.48±1.65 ppt during 2009 where as in the year 2010 it was 17.57±0.91 to 30.61±2.26 ppt. Evaporation and dilution alter the salinity values and it act as
www.ijmer.in 177

INTERNATIONAL JOURNAL OF MULTIDISCIPLINARY EDUCATIONAL RESEARCH
ISSN : 2277-7881; IMPACT FACTOR – 4.527; IC VALUE:5.16; ISI VALUE:2.286 VOLUME 6, ISSUE 8(2), AUGUST 2017
limiting factor in distribution of flora and fauna of the ecosystem (Sridhar et al., 2006). The findings of the present study in agreement with the previous worker reported earlier by Santhosh Kumar and
Ashok Prabu, 2014) (Table 1, 2 and 3).
Dissolved oxygen fluctuated between 3.87±0.85 to 8.58±1.04 mg l-1 during 2009 where as in the year 2010 it was 4.97±0.87 to 8.41±1.06 mg l-1 . Higher wind velocity which is coupled with the heavy rainfall during mansoon season and possible fresh water mixing may lead to increase the dissolved oxygen content as suggested earlier by Das et al., 1997 and Arumugam et al., 2014 (Table 1, 2 and 3).
Rainfall is the most important cyclic phenomenon in tropical countries as it brings about important changes in the hydrographical characteristics of the marine and estuarine environments. The rainfall in India is largely influenced by two monsoons viz., southwest monsoon on the west coast, northern and Northeastern India and by the
northeast monsoon on the southeast coast (Govindasamy and Kannan, 1991). The rainfall during the present study period (January to December 2009 and 2010) is reported to be ranging between 5.2±1.63 and 291.2±2.65 mm. The highest rainfall (291.2±2.65 mm) is recorded in the month of October and lowest (5.2±1.63 mm) in the month of February 2009. No rainfall was recorded in the months of January, December 2009 for the Nagavali estuary (Table 1, 2 and 3).
Acknowledgement
The authors express their gratitude to the Head, Department of Marine Living Resources, College of Science and Technology, Andhra University for providing laboratory facilities to carry out this work.
References
Arumugam and Sugirtha, P. Kumar (2014). Evaluation of physico-chemical parameters and nutrients in the Mangrove ecosystem of manakudy Estuary, southwest coast of India.
www.ijmer.in 178

INTERNATIONAL JOURNAL OF MULTIDISCIPLINARY EDUCATIONAL RESEARCH
ISSN : 2277-7881; IMPACT FACTOR – 4.527; IC VALUE:5.16; ISI VALUE:2.286 VOLUME 6, ISSUE 8(2), AUGUST 2017
International Journal of Latest Research in Science and Technology., 3 (6): 205-209.
Balakrishnan Nair N, Abdul Azis PK (1987). Hydrobiology of the Ashtamudi estuary – a tropical backwater system in Kerala. Proc. Natn. Sem. Estuarine Management. Trivandrum, pp268-208.
Das, J., Das, S.N. and Sahoo, R.K (1997). Semidiurnal variation of some physic chemical parameters in the Mahanadi estuary, East coast of India. Indian J. Mar. Sci., 26: 323- 326.
Desai P (1992). Coastal environment of Gujarat: Special reference to the Gulf of Kachchh. (Remote sensing application mission). Coastal Environment, Space Application Centre (ISRO), Ahmedabad., pp. 129-146.
Ganapati, P.N (1975). Estuarine pollution. Bull. Dept. Mar. Sci., Univ. Cochin:VI, I:1-9.
Govindasamy C and Kannan L (1991). Rotifers of the Pitchavaram mangroves (Southeast coast of India): A hydrobiological approach. Mahasagar., 24(1): 39-45.
Kesavan K, Palpandi C, Amalraj T, Vairamani S, Raveendran S, Shanmugam A (2007). Population density and distribution pattern of malacofauna in the mangroves along Coringi river (Godavari mangroves, Andhra Pradesh). National Conference Emerging Scenario in Zoology, 27th September, 70–76.
Murugan A Ayyakkannu K (1991). Ecology of Uppanar backwaters, Cuddalore 1. Physico– chemical parameters. Mahasagar – Bull. Nattl. Oceanogr., 24(1): 31–38.
Patra KC Bhunia AB Mitra A (1990). Ecology of macrobenthos in a tidal creek and adjoining mangroves in West Bengal, India. Environ. Ecol., 8(2): 539-547.
Pravat Ranjan Dixit, Biswabandita Kar1, Partha Chattopadhyay, Chitta Ranjan Panda (2013). Seasonal Variation of the Physicochemical Properties of Water Samples in Mahanadi Estuary, East Coast of India. Journal of Environmental Protection. 4:843-848.
www.ijmer.in 179
INTERNATIONAL JOURNAL OF MULTIDISCIPLINARY EDUCATIONAL RESEARCH
ISSN : 2277-7881; IMPACT FACTOR – 4.527; IC VALUE:5.16; ISI VALUE:2.286 VOLUME 6, ISSUE 8(2), AUGUST 2017
Qasim SZ (1969). Some problems related to the food chain in a tropical
estuary; in Marine Food Chains. ed. J H Steele (Edinburgh: Oliver & Boyd), pp. 45-51.
Ragothaman, G. and T.S.Patil (1995). Studies on the physic – chemical parameters and phytoplankton of Narmada estuary. Poll. Res., 14(2):221-226.
Ragothaman, G. and V.Ramachandra Reddy (1982). Hydrobiology of Tapi Estuary Surat: Ind. Jour. Mar. Sci., vol. 11, pp. 256– 258.
Saad MAH (1978). Seasonal variations of some physico-chemical conditions of Shatt-al– Arab estuary, Iran. Estuar. Coast. Mar. Sci. 6: 503-513.
Santhosh Kumar, C. and Ashok Prabu, V (2014). Physico-chemical parameters in Parangipettai coastal waters and Vellar estuary, Southeast coast of India. Int. J. Curr. Microbiol. App. Sci ., 3(9) 85-93.
Selvam V, Azariah J, Azariah H (1992). Diurnal variation in physical-chemical properties and primary production in the interconnected marine, mangrove and freshwater biotopes of Kakinada coast, Andhra Pradesh, India. Hydrobiology, 247: 181- 186.
Sobha Rani (2016). Seasonal Changes in Physico-Chemical Characteristics of the Water of Gosthani Estuary in Visakhapatnam District-Andhra Pradesh, India. European Academic Research. 3(6): 12805-12814.
Sridhar, R., Thangaradjou, T., Senthil Kumar, S., Kannan, L (2006). Water quality and phytoplankton characteristics in the Palk Bay, Southeast coast of India. J. Environ. Biol., 27: 561 566.
Strickland JDH, Parsons TR (1972). A practical hand book of the sea water analysis. Bull. kish. Res. Bd. Canada 167: 310.
Umamaheswara Rao, T. I. Nageswara Rao and Sunakar Panda (2015). Seasonal Variability and Behavior of Hydrographic and Nutrient Parameters in the Estuarine Waters of Gauthami Godavari, East Coast of India. IOSR Journal of Environmental Science, Toxicology and Food Technology. 9 (11): 10-19.
www.ijmer.in 180

INTERNATIONAL JOURNAL OF MULTIDISCIPLINARY EDUCATIONAL RESEARCH
ISSN : 2277-7881; IMPACT FACTOR – 4.527; IC VALUE:5.16; ISI VALUE:2.286 VOLUME 6, ISSUE 8(2), AUGUST 2017
Vijaya Pratap, G. and K. Ramesh Babu (2015). Seasonal Variations of
the Physico-Chemical Characteristics of Water Samples in Sarada and Varaha Estuarine Complex, East Coast of India. European Academic Research. 3(1) : 472-486.
Voluntary estuary monitoring manual chapter 15, 2012. Turbidity and total solids available at http://www .epa.gov/owow/estuary ies/mo nitor/ access ed during November 2012.
www.ijmer.in 181

INTERNATIONAL JOURNAL OF MULTIDISCIPLINARY EDUCATIONAL RESEARCH
ISSN : 2277-7881; IMPACT FACTOR – 4.527; IC VALUE:5.16; ISI VALUE:2.286 VOLUME 6, ISSUE 8(2), AUGUST 2017
AQUARCULTURE NUTRITION, PHYSICO-CHEMICAL
PARAMETERS OF NIZAM SAGAR DAM WITH RESPECT TO FISH PRODUCTION
Dr.H.L.Tamlurkar, A.Bhaskar, Rafiya Yasmeen P.G. Dept. of Zoology
Yeshwant Mahavidhylay, Nanded
Abstract :
The main purpose of Nizam sagar dam is fish culture, irrigation, drinking, agriculture and also for domestic purpose. The present
investigation deals with the physica-chemical parameters of Nizam sagar dam for fisheries management and culture of fish. The study was carried out for a period of twelve months during the academic year 2014. The parameters such as water temperature. pH, total alkalinity, dissolved oxygen and carbon dioxide were estimated. The pH shows alkaline trend in Nizam sagar dam. The water of Nizam sagar dam is found to be more suitable for fish culture.
Key Wards : Reservior, Physico-chemical parameters, and fish culture
Introduction :
The fresh water bodies of India includes a large number of rivers, ponds, dams, impoundments and lakes. The riverine system, have ideally the quality of water should be assessed on the basis of physic-chemical and biological parameters on order to provide the complete spectrum of information of the purpose fisheries management.
Nizam sagar dam is located near Nizam sagar village at the border of Maharashtra of Nizamabad district. Dam is constructed on Manjira. a major source for irrigation and fish production and also beneficial for drinking, agriculture purpose. It is a deep reservoir with lot of
submerged weeds and various species of fishes. The catchment area of the reservoir is about 312-84 sq. kms.
www.ijmer.in 182

INTERNATIONAL JOURNAL OF MULTIDISCIPLINARY EDUCATIONAL RESEARCH
ISSN : 2277-7881; IMPACT FACTOR – 4.527; IC VALUE:5.16; ISI VALUE:2.286 VOLUME 6, ISSUE 8(2), AUGUST 2017
Materials and methods :
For the purpose of study, the water samples were collected from the reservoir for a period of twelve months during the year 2014 from January to December. Four sampling spots namely A.B. C and D are selected for study. The temperatures were recoreded at the time of sampling, on the spot using centigrade thermometer. pH was measured with standard pH-meter. Other parameters were estimated by the procedures given in Trivedy and Goel (1984), also from methodology by
Kodarkar.
Result and discussion :
The physic-chemical parameters for 12 months recorded are given in the Table-1 The river water, which is lotic, becomes lentic in the reservoir. Hence the reverine fishery have different ecology compared to reservoir fishery. Thus to study the fish culture in a reservoir is important from the point of the ecology of the reservoir as said by Shrivastava (2000).
The climatic factors such as rainfall, temperature, atmospheric pressure and humidity help in understanding the complex process of interaction between the climate and the biological process in water bodies. Impinging
www.ijmer.in 183

INTERNATIONAL JOURNAL OF MULTIDISCIPLINARY EDUCATIONAL RESEARCH
ISSN : 2277-7881; IMPACT FACTOR – 4.527; IC VALUE:5.16; ISI VALUE:2.286 VOLUME 6, ISSUE 8(2), AUGUST 2017
Table 1. Monthly variations of physic-chemical parameters of Nizam sagar dam.
Parameters
Spots
Months Jan. Feb. Mar. April May June July Aug. Sept Oct. Nov. Dec.
Water Temerature (0C)
A 21.60 25.50 26.00 30.10 39.20 38.00 31.00 28.00 22.00 21.00 19.00 18.00 B 22.00 26.10 27.20 31.00 38.50 39.10 31.00 28.00 22.50 20.40 19.40 18.20 C 22.50 27.00 27.50 31.50 39.00 38.50 31.00 28.50 22.00 20.20 19.60 18.60 D 22.50 27.50 28.00 31.60 39.30 38.40 31.50 29.00 22.50 20.00 19.80 18.80
pH of Water A 7.63 7.55 7.30 7.35 7.32 7.34 7.40 7.50 7.56 7.58 7.71 7.85 B 7.64 7.56 7.32 7.35 7.32 7.35 7.40 7.52 7.55 7.58 7.70 7.86 C 7.64 7.57 7.32 7.36 7.30 7.34 7.42 7.52 7.58 7.57 7.72 7.88 D 7.63 7.56 7.30 7.38 7.30 7.34 7.42 7.42 7.50 7.57 7.70 7.87
Total alkalinity (mg/1)
A 134.00 130.80 129.90 131.00 132.20 132.80 136.20 139.90 138.10 137.90 128.00 131.30 B 134.00 130.80 129.90 131.30 132.10 132.90 136.20 139.80 138.00 137.90 128.10 131.20 C 134.20 130.70 129.80 131.50 132.10 132.70 136.40 140.00 138.10 137.80 128.10 131.50 D 134.40 130.60 129.80 131.60 132.10 132.60 136.40 140.00 138.00 137.90 128.00 131.40
Dissolved Oxygen (mg/1)
A 9.50 9.10 6.00 6.40 6.10 7.20 8.50 9.80 8.90 8.86 8.90 9.33 B 9.41 9.00 5.80 6.50 6.30 7.20 8.57 9.86 8.85 8.87 8.91 9.30 C 9.50 9.10 6.10 6.80 6.60 7.00 8.54 9.79 8.89 8.88 8.89 9.25 D 9.61 9.10 6.10 6.60 6.20 7.30 8.50 9.87 9.01 8.87 8.90 9.22
Carbon Dioxide (mg/1)
A 4.41 3.10 4.25 3.11 3.96 4.42 6.10 6.39 5.91 4.98 3.99 3.82 B 4.60 3.12 4.32 3.10 3.97 4.45 6.99 6.30 5.99 4.11 3.10 3.10 C 4.55 3.11 4.42 4.10 3.99 4.40 6.99 6.32 5.91 4.11 3.10 3.10 D 4.48 3.11 4.35 4.41 3.10 4.32 6.10 6.41 5.99 4.99 3.10 3.10
www.ijmer.in 184

INTERNATIONAL JOURNAL OF MULTIDISCIPLINARY EDUCATIONAL RESEARCH
ISSN : 2277-7881; IMPACT FACTOR – 4.527; IC VALUE:5.16; ISI VALUE:2.286 VOLUME 6, ISSUE 8(2), AUGUST 2017
Solar radiation and atmospheric temperature bring about interesting changes in aquatic ecosystem, which play significant role in the fish culture. Many workers as, Pandey and Tripathi (1988), Pulle (2000); Pawar (2002), Wagh (1998) studied the role of climatic factors in understanding the ecology of aquatic ecosystem.
Temperature :
It plays an important role in thermal stratification which have some effect on chemical and biological activities of aquatic media like
dissolved oxygen, carbon-di-oxide, water and air temperature go more or less hand in hand. The water temperature recoreded at morning hour ranges between 17 to 39.3 0c at all the four station. Maximum temperature is recorded in the months of May and June (Fig. 1).
Hyderogen-concentration :
pH is the scale of intensity of acidity and alkalinity of water and measures the concentration of H+ ions. Most of the biological processes and biological reactions are pH dependent. Swingle (1967) stated that waters having a pH range of 6.5 to 9.0 as recorded before day break are most suitable for pond culture and those having pH values of more than 9.5 (alkanline) as unsuitable, because in the later, CO3 is not available. Fish dies at pH 11. Acidic water’s reduce the appetite of the fish. Their growth and tolerance to toxic substances. Acidic water, carries toxicity of H2S4 copper and other heavy metals. The fish gets prone to attacks of parasites and diseases in acidic water. hence pH is considered as an indicator of overall productivity that causes habitat diversity (Minns, 1989). The pH recorded, ranged from 7.30 to 7.88 at all the four
stations. Total alkalinity :
The water that can neutralize the acid is called alkaline water. Acidic water is danger for fish growth, the reservoir or ponds should have alkalinity so that the acids can be neutralized and fish production is possible. The alkalinity might be due to the high pH or it may be
www.ijmer.in 185
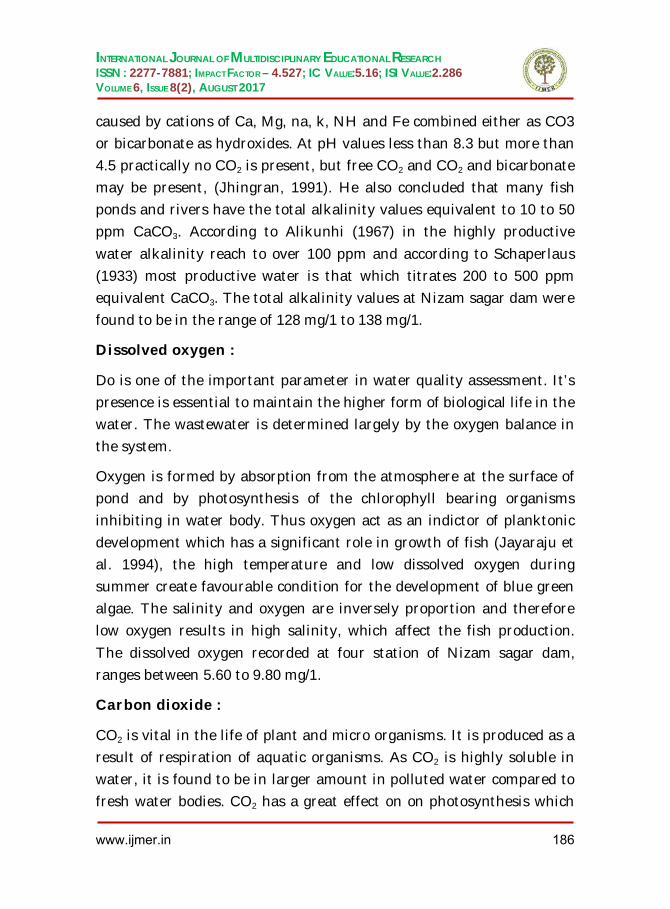
INTERNATIONAL JOURNAL OF MULTIDISCIPLINARY EDUCATIONAL RESEARCH
ISSN : 2277-7881; IMPACT FACTOR – 4.527; IC VALUE:5.16; ISI VALUE:2.286 VOLUME 6, ISSUE 8(2), AUGUST 2017
caused by cations of Ca, Mg, na, k, NH and Fe combined either as CO3 or bicarbonate as hydroxides. At pH values less than 8.3 but more than 4.5 practically no CO2 is present, but free CO2 and CO2 and bicarbonate may be present, (Jhingran, 1991). He also concluded that many fish ponds and rivers have the total alkalinity values equivalent to 10 to 50 ppm CaCO3. According to Alikunhi (1967) in the highly productive
water alkalinity reach to over 100 ppm and according to Schaperlaus (1933) most productive water is that which titrates 200 to 500 ppm equivalent CaCO3. The total alkalinity values at Nizam sagar dam were found to be in the range of 128 mg/1 to 138 mg/1.
Dissolved oxygen :
Do is one of the important parameter in water quality assessment. It’s presence is essential to maintain the higher form of biological life in the water. The wastewater is determined largely by the oxygen balance in the system.
Oxygen is formed by absorption from the atmosphere at the surface of pond and by photosynthesis of the chlorophyll bearing organisms inhibiting in water body. Thus oxygen act as an indictor of planktonic development which has a significant role in growth of fish (Jayaraju et al. 1994), the high temperature and low dissolved oxygen during summer create favourable condition for the development of blue green algae. The salinity and oxygen are inversely proportion and therefore low oxygen results in high salinity, which affect the fish production.
The dissolved oxygen recorded at four station of Nizam sagar dam, ranges between 5.60 to 9.80 mg/1.
Carbon dioxide :
CO2 is vital in the life of plant and micro organisms. It is produced as a result of respiration of aquatic organisms. As CO2 is highly soluble in water, it is found to be in larger amount in polluted water compared to fresh water bodies. CO2 has a great effect on on photosynthesis which
www.ijmer.in 186

INTERNATIONAL JOURNAL OF MULTIDISCIPLINARY EDUCATIONAL RESEARCH
ISSN : 2277-7881; IMPACT FACTOR – 4.527; IC VALUE:5.16; ISI VALUE:2.286 VOLUME 6, ISSUE 8(2), AUGUST 2017
effect again onfish growth. Dwivedi and Pandey (2002) found the free carbon dioxide high in pre-monsoon and monsoon period and low in winter. The values of CO2 ranges from 3.81 to 6.81 mg/1 at all four stations. High concentrations of free carbon dioxide more than 20 ppm is toxic to fish.
Conclusion :
The water of Nizam sagar dam is found to be more suitable for fish culture. The water is productive having the maximum Alkalinity 139
mg/1 also less than 8 pH, DO and CO2 of the water is measured within the renge of 5 to 10 mg/1 which is th suitable condition for fish growth. Hence Nizam sagar dam having the large area for catchment can be utilized for the production of fish on a large scale and a variety of species can be cultured.
Reference
Reference :
Alikunchi (1957). Fish culture in India. F.M. Bull. Indian Count Agri. Res. 20 : 144 p.
APHA (1985). Standard Methods for the examination of water and waste water. 16th edition. American Public Health Association, New York. PP : 1193.
Diwedi, B.K, and G.C. Pandy (2002). Physicochemical factors and algae diversity of two ponds (Girija Kund and Maqbara pond). Faizabad, India. Poll. Res. 21 (3) : 361-370.
Jayaraju, P.B., G.D.V. Prasadrao and S.V. Sharma (1994). Seasonal variation in physico- chemical parameters and diversity in Flora
and Fauna of the river Manneru, a tributary to river Krishna, Andhra Pradesh, India J. Aqua Biol. 9 (1 & 2) 19-22
www.ijmer.in 187

INTERNATIONAL JOURNAL OF MULTIDISCIPLINARY EDUCATIONAL RESEARCH
ISSN : 2277-7881; IMPACT FACTOR – 4.527; IC VALUE:5.16; ISI VALUE:2.286 VOLUME 6, ISSUE 8(2), AUGUST 2017
Jhingran V.G, (1991).Fish and Fishries of India, Hindustan Publishing
Corporation, (India) Delhi PP : 280.
Kodrakar, M.S, (Ed) (2006). Methodology for water Analysis Publ. 2 IAAB, Hyderabad. 3rd edition PP: 106.
Minns C.K, (1989). Factors affecting fish species richness in Ontario lakes. Transaction of the American Fisheries Society, 118 :
533-545.
Pandey S.N, and A.K. Tripathi (1988). Schizemeris Lubleoni (Kuetz) – An indicator of organic pollutin, Geobios.15 (6) : 277-278.
Pawar, S.K, (2000). Hydrobiology of Sirur Dam near Mukhed in Nanded District Ph.D. Thesis, SRTM, Universtiy, Nanded.
Pulle, J.S, (2000). Bio-monitoring of Isapur Dam water Ph.D. Thesis, SRTM University, Nanded.
Scharperclause W, (1933). Text book of Pond culture : Rearing and keeping of Carp. Trout and allied fishes (Tr. Fhund). Fish Leaflet. Washington, (311) : 260 P.
Singhal R.N, Swarnajeet and R.W. Devis (1986). The Physico-chemcial Environment and the Plankton of Managed Ponds in Haryana. India Proc. Indian Acad. Sci. (Sec B). 95 (3) : 253-263
Srivastava S.C, (2000). A text book of Fishery Science and Indian
Fisheries Kitab Mahal Publishers.
Swingle H.S, (1967). Standardization of Chemical analysis for water and pond mud. FAO Fish. Rep. 44 (4) : 397-421.
Trivedi, R.K. and Goel, P.K., (1984). chemical and biological methods for water pollution studies, Environmental publications, Karad.
www.ijmer.in 188

INTERNATIONAL JOURNAL OF MULTIDISCIPLINARY EDUCATIONAL RESEARCH
ISSN : 2277-7881; IMPACT FACTOR – 4.527; IC VALUE:5.16; ISI VALUE:2.286 VOLUME 6, ISSUE 8(2), AUGUST 2017
BIOFLOC TECHNOLOGY AN INNOVATIVE
AQUACULTURE SYSTEM FOR SUSTAINABLE GROWTH
K. Kavitha Department of Zoology &
Aquaculture Acharya Nagarjuna
University Nagarjuna Nagar – 522 510
Andhra Pradesh, India
K. Suneetha Department of Zoology &
Aquaculture Acharya Nagarjuna
University Nagarjuna Nagar – 522 510
Andhra Pradesh, India
Darwin.Ch Department of Zoology & Aquaculture
Acharya Nagarjuna University Nagarjuna Nagar – 522 510
Andhra Pradesh, India
Abstract
Aquaculture is the fastest growing food producing sector in the world. It is developing expanding and intensifying in almost all the regions of the world. As the global population continues to grow, food production industries such as aquaculture will need to develop in a sustainable way. Increasing aquaculture production is limited, because of severe limitations of water and availability of suitable land. To overcome these problems adopting the concepts of recycling and converting the metabolites into efficient
feed by zero/minimal water exchange conserving the water and land with high shrimp/fish production. Hence the best environmentally acceptable “BIOFLOC TECHNOLOGY” has been developed. Biofloc is a conglomeric of microbial communities.The main principle of this BFT involves manipulation of C/N ratio to convert toxic nitrogenous wastes into the useful microbial protein and helps in improving water
www.ijmer.in 189

INTERNATIONAL JOURNAL OF MULTIDISCIPLINARY EDUCATIONAL RESEARCH
ISSN : 2277-7881; IMPACT FACTOR – 4.527; IC VALUE:5.16; ISI VALUE:2.286 VOLUME 6, ISSUE 8(2), AUGUST 2017
quality under a zero/minimal water exchange system. An attempt has been made to summarize the sailent features and management aspects of the environmental friendly biofloc farming system to achieve sustainable aquaculture.
Key words: Biofloc, C/N ratio, water quality, microbial protein, sustainability
Introduction
With almost eight billion people on earth, and where the global human population is expected to raise by another 2 billion to
reach 9.6 billion people by 2050, it is important to meet the huge challenge of feeding our planet while safeguarding its natural resources for future generations (FAO, 2014).To support the rapidly growing human population, food production industries such as aquaculture need to expand. The aquaculture expansion must produce more aquaculture products without increasing the usage of the basic natural resources of water and land (Avnimelech, 2009). Moreover, the expansion of aquaculture is also restricted. Therefore, there was a wide search for years for a new alternative approach towards sustainable and environment-friendly technology for enhancing large-scale production. Biofloc technology has gained attention recently as anenvironment-friendly, cost-effective and sustainable aquaculture (Naylor et al. 2000; Avnimelech and Kochba, 2009).Hence, the present attempt
has been made to summarize the sailent features of the environmental friendly biofloc farming system.
Biofloc
Biofloc is an conglomericof heterogenous bacteria, algae, fungi, protozoans, metazoans, rotifers, copepods, nematodes, colloids, organic polymers, particulate organic matter such as uneaten feed, feces and detritus (Avnimelech, 2012 andWidanarni et al.,
www.ijmer.in 190

INTERNATIONAL JOURNAL OF MULTIDISCIPLINARY EDUCATIONAL RESEARCH
ISSN : 2277-7881; IMPACT FACTOR – 4.527; IC VALUE:5.16; ISI VALUE:2.286 VOLUME 6, ISSUE 8(2), AUGUST 2017
2012). The floccules are loosely held together in a matrix of mucus secreted by bacteria and electrostatic attraction. Bioflocs vary in size 1-200µm and can reach more than 1000µm. they are irregular in shape, easily compressible, highly porous and permeable to fluids. Colour generally ranges from brown to green, depending upon the constituents. Bioflocs have slow sinking rate, kept floating by aeration increasing the opportunity to derive nutrients
from water column. Normally flocs comprise 2-20% living microbial cells, 60-70% organic matter, and 30-40% total inorganic matter. A typical biofloc contains 4 components: bacterial colony, filamentous bacteria, absorbed matter and algae. Biofloc volume is measured with Imhoff cones. Desirable floc volume ranges between 1-40ml/litre. Besides the volume, colour and various physico-chemical parameters and nutritive value like protein levels, fattyacids etc., have also been used to characterize the flocs. The biofloc is an assemblage of more than 750 operational taxonomic units [OTUs] and recently as many as 2000 OTUs were identified (Avnimelech, 2015).
Concepts of Biofloc Technology
The main principle of Biofloc technology (BFT) is to recycle nutrients and nitrogenous wastes by maintaining a high carbon/nitrogen (C/N) ratio in the water to stimulate the growth of heterotrophic bacteria (Avnimelech and Weber, 1986). Bacteria
growth increases when carbon sources such as molasses, wheat bran and cellulose are applied in pond with continuous aeration (Avnimelech, 1999). Through maintaining the C/N ratio in culture system by adding carbon source the water quality can be improved along with the production of high-quality single-cell microbial protein (Crab et al., 2012). The BFT,not only maintain water quality, but also provide essential and higher quality nutrition to the shrimp in achieving fast growth,lesser FCR
www.ijmer.in 191

INTERNATIONAL JOURNAL OF MULTIDISCIPLINARY EDUCATIONAL RESEARCH
ISSN : 2277-7881; IMPACT FACTOR – 4.527; IC VALUE:5.16; ISI VALUE:2.286 VOLUME 6, ISSUE 8(2), AUGUST 2017
(Muylder et al., 2010) and possibility to prevent diseases (Avnimelech, 2012). The Promotion of floc formation is influenced by a combination of physical, chemical and biological interactions such as temperature, pH, dissolved oxygen, organic loading rate etc.
Nutritional Quality of Biofloc
Studies indicated that biofloc contains high levels of protein 38- 50%, lipid 3%, fiber 6%, ash 12% and 19 kj/g energy (Azam& little, 2008; Widanarni et.al., 2012). Protein levels in biofloc depend on
the crude protein in the diet and carbon sources applied. According to Tacon et. al., (2008) the poly unsaturated fatty acids in biofloc contain 27-28%, mono-unsaturated fatty acids 28-29%, and 30-35% of saturated fatty acids. The number of bacteria in biofloc pond can be 106 to 109 per ml of floc, which contains 10-30mg dry matter and bacteria produce 60-600kg/ha/day of protein for fish (Avnimelech, 1999). Even though biofloc have sufficient protein to maintain significant fish growth, supplementary feed is essential and its quantity has to be adjusted on the basis of biofloc volume.
Application of Biofloc Technology
BFT has been applied to culture various shrimp and fin fishes. Not all species are candidates to biofloc technology. Desirable characters are the filter feeding habit, omnivorous habit and digestive system adoptable to assimilate the microbial protein. The BFT has been adopted successfully from nursery (Samocha et
al., 2007 and Emerenciano et al., 2012), grow out phases(Avnimelech et al., 2007 and Crab et al., 2012)and even to enhance breeding capacity (Ekasari et al., 2015). BFT has been used successfully in culturing different crustaceansspecies such as L. vannamei(Mishra et al., 2008), P. monodon (Arnold et al.,
www.ijmer.in 192

INTERNATIONAL JOURNAL OF MULTIDISCIPLINARY EDUCATIONAL RESEARCH
ISSN : 2277-7881; IMPACT FACTOR – 4.527; IC VALUE:5.16; ISI VALUE:2.286 VOLUME 6, ISSUE 8(2), AUGUST 2017
2009), F. paulensis(Ballester et al., 2010),F. brasiliensis (Souza et al., 2011) and F. setiferus(Emerenciano et al., 2009). Among the fin fish Oreochromis niloticus (Azam& little, 2008),
Cyprinuscarpio(Najdegerami et al., 2016) and catfishClariasgariepinus(Yusuf et al., 2015)has been cultured.Nowadays, BFT have been successfully applied in aquaponics. The presence of rich-biota (microorganisms of biofloc) and a variety of nutrients such as micro and macronutrients originated from un-eaten feed seems to contribute in plant nutrition.
Strengths of Biofloc technology
The BFT strengths in aquaculture has been well documented which includes water conservation potentiality, because of zero or
minimal water exchange, maintaining temperature and heat fluctuations (Crab et al., 2009).It supports nitrogen removal even when organic matter and biochemical oxygen demand of the system is high (Avnimelech, 2015).It will reduce the pollution of pond water, and improves the water quality, lowering the concentration of toxic ammonia, nitrite and hydrogen sulphate. The major advantage of this technology is that it reuses the waste nutrients through microbial protein into fish or shrimps, these microbial flocs contribute nearly 50% requirement of fish protein and lowered the feed conversion (Krummenauer et al., 2014). It maximizes the growth, survival and promises healthy rearing system with less introduction of pathogen and diseases (Otoshi et al., 2009; Krummenauer et al., 2011 and Perez-Fuentes et al., 2013). In addition, BFT makes it possible to avoid the usage of antibiotics and enhances the meat quality. Moreover, it serves as
a natural probiotic and immunostimulant(Emerenciano et al., 2013).
www.ijmer.in 193

INTERNATIONAL JOURNAL OF MULTIDISCIPLINARY EDUCATIONAL RESEARCH
ISSN : 2277-7881; IMPACT FACTOR – 4.527; IC VALUE:5.16; ISI VALUE:2.286 VOLUME 6, ISSUE 8(2), AUGUST 2017
Disadvantages of Biofloc system
The most obvious disadvantages are continuous aeration to maintain high dissolved oxygen level > 5 ppm, hence high energy cost. Significantly higher skills and better equipped laboratories are necessary to monitor and operate the biofloc system efficient. This system can be practiced in intensive system and extensive systems. The ponds must be lined with HDPE sheet, or concrete ponds, are required for the efficient organization of this system. In concrete ponds, high levels of nitrite lead to Exuvia
Entrapment of shrimp. Accumulation of total suspended solids leads to proliferation of protozoans like vorticella and zoothamnium these protozoans feed on heterotrophic bacteria, reducing their number which inturn effects the quality and quantity of biofloc.
Future Research
The effects of water quality, microbial mechanisms involved in the process and environmental factors on the biofloc are largely unknown and warrant investigation further research should focus on the optimal way to manage biofloc in aquaculture ponds, with respect to optimal floc morphology, compositional and nutritional value of the floc. An additional challenge is to promote the
technology, which canconvince the farmers toimplement it. Therefore, sharing technical knowledge to the farmer in a clear, practical and straightforward way that can emphasize its economic benefits and to implement BFT in future aquaculture systems.
Conclusion
Supplying the protein food for the increasing human population have become a major problem at the global level. To cater the animal protein, expansion of aquaculture has become needed. But
www.ijmer.in 194

INTERNATIONAL JOURNAL OF MULTIDISCIPLINARY EDUCATIONAL RESEARCH
ISSN : 2277-7881; IMPACT FACTOR – 4.527; IC VALUE:5.16; ISI VALUE:2.286 VOLUME 6, ISSUE 8(2), AUGUST 2017
practicing unsustainable aquaculture which shows impact on environmental degradation, and socioeconomic conflicts. To minimize the impact of the environmental, health, and economic problems associated with aquaculture, BFT has become increasingly popular as a sustainable alternative for intensification. Biofloc technology will enable aquaculture grow toward an environmentally friendly approach, reducing
pollution,zero/minimal water exchange, recycling in- situ nutrients, improving biosecurity, improvement of FCR by augmenting natural food, providing stress free environment and eliminating the antibiotics and chemicals. These qualities make BFT system an alternative and it has immense potentiality to revolutionize the aquaculture sector.
References
Arnold SJ, Coman FE, Jackson CJ, Groves SA., (2009). High-intensity, zero waterexchange production of juvenile tiger shrimp, Penaeus monodon: An evaluation of artificial substrates and stocking density. Aquaculture. 293:42-48.
Avnimelech Y, Weber B.,(1986). Studies in circulated fish ponds: organic matter recycling and nitrogen transformation. Aquaculture Fisheries Management. 17:231–242.
Avnimelech, Y., (1999). Carbon and nitrogen ratio as a control element in Aquaculture systems. Aquaculture. 176: 227–235.
Avnimelech, Y., (2007). Feeding with microbial flocs by tilapia in minimal discharge bioflocs technology ponds. Aquaculture. 264:140–147.
www.ijmer.in 195

INTERNATIONAL JOURNAL OF MULTIDISCIPLINARY EDUCATIONAL RESEARCH
ISSN : 2277-7881; IMPACT FACTOR – 4.527; IC VALUE:5.16; ISI VALUE:2.286 VOLUME 6, ISSUE 8(2), AUGUST 2017
Avnimelech, Y., (2009). Biofloc Technology — A Practical Guide
Book. The World Aquaculture Society, Baton Rouge, Louisiana, United States. 182 pp.
Avnimelech, Y., (2012). Biofloc technology, a practical guide book. The world. Aquaculture Society, Baton Rouge, Louisiana, EUA.
Avnimelech, Y., (2015).Biofloc Technology, a Practical Guidebook,
3d Edition, World Aquaculture Soc. 258.
Azim, M. E. and Little, D. C., (2008). The biofloc technology (BFT) in indoor tanks: water quality, biofloc composition, and growth and welfare of Nile tilapia (Oreochromis niloticus). Aquaculture, 283: 29-35.
BallesterELC, Abreu PC, Cavalli RO, Emerenciano M, Abreu L, Wasielesky W., (2010). Effect of practical diets with different protein levels on the performance of Farfantepenaeuspaulensis juveniles nursed in a zero
exchange suspended microbial flocs intensive system. Aquac Nut. 16:163-172.
Crab R, Kochva M, Verstraete W, Avnimelech Y., (2009). Bio-flocs technology application in over-wintering of tilapia. Aquacultural Engineering. 40:105–112.
Crab, R., Defoirdt T., Bossier P. and Verstraete W., (2012). Biofloc technology in aquaculture: Beneficial effects and future challenges. Aquaculture. 351–357.
De Muylder, E., L. Claessens and M. Herizi.,(2010). Production of shrimp (Litopenaeusvannamei) without marine proteins in a biofloc system. Biofloc Production-Aquafeed Winter 2010 Publication, Aquafeed Magazine. 1-3.
www.ijmer.in 196

INTERNATIONAL JOURNAL OF MULTIDISCIPLINARY EDUCATIONAL RESEARCH
ISSN : 2277-7881; IMPACT FACTOR – 4.527; IC VALUE:5.16; ISI VALUE:2.286 VOLUME 6, ISSUE 8(2), AUGUST 2017
EkasariJ, Zairin M, Putri DU, Sari NP, Surawidjaja EH, Bossier
P., (2015).Biofloc-based reproductive performance of Nile tilapia Oreochromis niloticusL. broodstock. Aquaculture Research. 46:509–512.
EmerencianoM, Ballester ELC, Cavalli RO, Wasielesky W.,
(2012).Biofloc technology application as a food source in a limited water exchange nursery system for pink shrimp Farfantepenaeusbrasiliensis(Latreille, 1817). Aquaculture Research. 43:447–457.
EmerencianoM, Vinatea L, Gálvez AG, Shuler A, Stokes A, Venero J, Haveman J, Richardson J, Thomas B, Leffler J., (2009). Effect of two different diets fish meal based and “organic” plant based diets in Litopenaeussetiferusearlier post-larvae culture under biofloc, green-water and clear-water conditions. World
Aquaculture Society Meeting, Veracruz, México.
FAO (Food and Agriculture Organization of the United Nations). (2014). The State of World Fisheries and Aquaculture. Opportunities and challenges.223.
Krummenauer D, Peixoto S, Cavalli RO, Poersch LH, Wasielesky W., (2011). Superintensive culture of white shrimp, Litopenaeusvannamei, in a biofloc technology system in southern Brazil at different stocking densities. J World AquacultSoc 42(5):726–733.
Krummenauer D, Poersch L, Romano LA, Lara GR, Encarnacao P, Wasielesky JW., (2014). The effect of probiotics in a Litopenaeusvannameibiofloc culture system infected with
Vibrio parahaemolyticus. J. ApplAquac 26(4):370–379.
www.ijmer.in 197
INTERNATIONAL JOURNAL OF MULTIDISCIPLINARY EDUCATIONAL RESEARCH
ISSN : 2277-7881; IMPACT FACTOR – 4.527; IC VALUE:5.16; ISI VALUE:2.286 VOLUME 6, ISSUE 8(2), AUGUST 2017
Mishra JK, Samocha TM, Patnaik S, Speed M, Gandy RL, Ali A.,
(2008). Performance of an intensive nursery system for the Pacific white shrimp, Litopenaeusvannamei, under limited discharge condition. AquacEng 38:2–15.
NajdegeramiEH, Bakhshi F, Lakani FB., (2016). Effects of biofloc
on growth performance, digestive enzyme activities and liver histology of common carp (CyprinuscarpioL.) fingerlings in zero-water exchange system. Fish Physiology Biochemistry. 42(2):457–465.
Naylor RL, Goldburg RJ, Primavera JH, Kautsky N, Beveridge MC, Clay J, Folke C, Lubchenco J, Mooney H,Troell M., (2000). Effect of aquaculture on world fish supplies. Nature 405:1017–1024.
Otoshi CA, Tang LR, Moss DR, Arce SM, Holl CM, Moss S., (2009). Performance of Pacific white shrimp, Penaeus
(litopenaeus) vannamei, cultured in biosecure, super-intensive, recirculating aquaculture systems. BROWDY, CL; JORY, DE The rising tide-proceedings of the special session on sustainable shrimp farming. Baton Rouge: World Aquaculture Society.
Perez-Fuentes JA, Perez-Rostro CI, Hernandez-Vergara MP., (2013). Pond-reared Malaysian prawn Macrobrachiumrosenbergii with the biofloc system. Aquaculture 400:105–110.
SamochaTM, Patnaik S, Speed M, Ali AM, Burger JM, Almeida RV, Ayub Z, Harisanto M, Horowitz A, Brock DL., (2007).
Use of molasses as carbon source in limited discharge nursery and grow-out systems for Litopenaeusvannamei. Aquacultural Engineering. 36:184–191.
www.ijmer.in 198

INTERNATIONAL JOURNAL OF MULTIDISCIPLINARY EDUCATIONAL RESEARCH
ISSN : 2277-7881; IMPACT FACTOR – 4.527; IC VALUE:5.16; ISI VALUE:2.286 VOLUME 6, ISSUE 8(2), AUGUST 2017
Souza DM, Suita SM, Leite FPL, Romano LA, Wasielesky W,
Ballester ELC., (2011). The use of probiotics during the nursery rearing of the pink shrimp Farfantepenaeusbrasiliensis(Latreille, 1817) in a zero exchange system. Aquac Res.
Tacon, A. G. J., Cody, J. J., Conquest, L. D., Divakaran, S., Forster, I. P. and Decamp, O. E., (2002). Effect of culture system on the nutrition and growth performance of Pacific white shrimp Litopenaeusvannamei (Boone) fed different diets. Aquaculture Nutrition, 8: 121-137.
Widanarni, E. J. and Maryam, S., (2012). Evaluation of biofloc technology application on water quality and production performance of red tilapia Oreochromis sp. cultured at different stocking densities. Journal of Biosciences, 19 (2); 73-80.
Yusuf MW, Utomo NBP, Yuhana M, Widanarni., (2015). Growth performance of catfish (Clariasgariepinus) in biofloc-
based super intensive culture added with Bacillus sp. Journal of Fisheries and Aquatic Science. 10(6):523–532.
www.ijmer.in 199
INTERNATIONAL JOURNAL OF MULTIDISCIPLINARY EDUCATIONAL RESEARCH
ISSN : 2277-7881; IMPACT FACTOR – 4.527; IC VALUE:5.16; ISI VALUE:2.286 VOLUME 6, ISSUE 8(2), AUGUST 2017
LENGTH-WEIGHT RELATIONSHIP AND RELATIVE
CONDITION FACTOR OF LATES CALCARIFER (BLOCH, 1790) FROM SARADA AND VARAHA ESTUARINE CONFLUENCE
POINT, VISAKHAPATNAM, EAST COAST OF INDIA
G. Vijay Pratap and K. Ramesh Babu Department of Marine Living Resources, College of Science and
Technology Andhra University, Visakhapatnam
Corresponding author E-mail: [email protected]
Abstract:
The length-weight relationship of Lates calcarifer was studied at the Sarada and Varaha estuarine confluence point, East coast of India during the period January 2012 to December 2014. Weight increases faster than the length. For the length-weight relationship totally Two hundred and sixty two specimens computed for study. Regression analysis of length-weight relationship, along with the test of significance showed that the 'n' values were found to differ from one group to another and were found to be 600 mm in females and 350mm
in males during the year 2012-2014. It is evident from the results that the increases in weight in relation to length was well appreciable above in 200mm. Females were found to be lighter than males up to 600 mm while the males were lighter than females at higher lengths. The scattered diagrams drawn from length-weight relationship in males and females of Lates calcarifer in the study period evidenced that a curvi linear relationship. By plotting the logarithmic values of Length-Weight showed a linear relationship. This showed that the total weight of the fish increased as an exponential function of its length irrespective of size. It was also evident from the present results that the extent of association between the measures of Length and Weight separately for
www.ijmer.in 200

INTERNATIONAL JOURNAL OF MULTIDISCIPLINARY EDUCATIONAL RESEARCH
ISSN : 2277-7881; IMPACT FACTOR – 4.527; IC VALUE:5.16; ISI VALUE:2.286 VOLUME 6, ISSUE 8(2), AUGUST 2017
males and females. The co-efficient of correlation (r) obtained from the statistical analysis of the data. The co-efficient of correlation (r) for males, females and Juveniles during the study period were r=0.950, r=0.967; r=0.231, r=0.287and r=0.880, r=0.935 respectively. The condition factor was found to be less for females compared to males in all the years of the study period. The 'K' values are very high in small
size groups in all the years of the study period. The condition of the fish Lates calcarifer progressively decreased with increased length up to 191mm to 230 mm there after it showed a marked raise exhibiting an inflexion of the curve in this study period
Introduction
Length-weight relationship has the important role in fishery resource management (Fafioye and Oluajo 2005; Ferhat et al., 2007) and also useful for comparing life history and morphological aspects of populations inhabiting different regions (Goncalves et al., 1997). The length and weight data is needed to estimate growth rates, length and age structures, and other components of fish population dynamics (Kolher et al., 1995). Length-weight applications range from simple
estimates of an individual's weight to indication of fish body condition factor or inferences regarding sexual development (Le Cren, 1951). Knowledge of the length and weight relationship also helps to identify energy investments for growth or reproduction as a natural cyclic phenomenon of natural populations (Bolger and Connolly 1989).
The data of length and weight help in estimate the growth drive size and age structured stock assessment models (Quinn and Deriso, 1999), and is related to life history traits such as natural mortality (M) and age or length at maturity (Charnov, 1993). Age and growth determinations are important in studying longevity, age at first maturity, catchable size and other life history problems in fishes (Ricker, 1971). Age with growth parameters of fishes constitutes
www.ijmer.in 201

INTERNATIONAL JOURNAL OF MULTIDISCIPLINARY EDUCATIONAL RESEARCH
ISSN : 2277-7881; IMPACT FACTOR – 4.527; IC VALUE:5.16; ISI VALUE:2.286 VOLUME 6, ISSUE 8(2), AUGUST 2017
essential data to control the dynamic of ichthyologic populations. The length and weight relationship information gives an important indication on the fishery resource management and on the level of their exploitation (Summerfelt and Hall, 1975). The relationships between the biological changes and the growth, mortality and longevity have been studied by Alm (1959) and Pauly (1984). Using data in Fish-Base,
Froese and Binohlan (2000) have likewise demonstrated that size and age at sexual maturity are strongly correlated with growth, maximum size and longevity.
The present study was carried out at Sarada and Varaha estuarine confluence point, Andhra Pradesh and East coast of India. Several workers who have also been studied on the length and weight relationship of Lates calcarifer are (Froese and Binohlan 2000; Thirunavukkarasu et al., 2001; Volvich and Appelbaum 2001; Tucker et al., 2002; Yildirim et al., 2002; Thampi Sam Raj et al., 2003; Fafioye and
Oluajo 2005; Ferhat et al., 2007; Gokce et al., 2007).
Material and Methods
For studies on Length-weight relationship the length and weight data of 262 specimens (including Juveniles) were taken. The specimens were collected from the study area and each individual was examined for the sex and stage of maturation by examining the gonad externally to separate the juveniles from adults, they followed by males and females for calculation of functional regression. The total length of the fish is measured to the nearest mm and its corresponding weight in grams.
These data were utilized for the calculation of the relationship between total length and body weight of juveniles and adults. The regression values of the length-weight relationship in juveniles and adults and among adult fish, between males and females were tested for significance using 't‘ test.
www.ijmer.in 202

INTERNATIONAL JOURNAL OF MULTIDISCIPLINARY EDUCATIONAL RESEARCH
ISSN : 2277-7881; IMPACT FACTOR – 4.527; IC VALUE:5.16; ISI VALUE:2.286 VOLUME 6, ISSUE 8(2), AUGUST 2017
Analysis of the Length-weight data
Data on length and weight of the individual fish when plotted on arithmetic co-ordinates showed a curvilinear relationship. The relationship between length and weight is calculated by using the formula (Le Cren, 151).
W = aLb
Where,
W = weight of the fish in grams,
L = length of fish in cm and
'b‘ is the exponent, and 'a‘ is a constant.
The data on length and weight are converted into the corresponding logarithmic values and when plotted yielded a straight line relation. The length-weight relationship is calculated by using the following equation:
Log W = log a + b log L
Results
The length-weight relationship of Lates calcarifer was studied at the Sarada and Varaha estuarine confluence point, East coast of India during the period January 2012 to December 2014. Weight increases faster than the length. For the length-weight relationship totally Two hundred and sixty two specimens computed for study.
Length-Weight Relationship
Regression analysis of length-weight relationship, along with the test of significance showed that the 'n‘ values were found to differ from one group to another and were found to be 600mm in females and 350mm in males during the year 2012-2014. It was significant to note
that 'n' values were calculated 95% confidence intervals for males and
www.ijmer.in 203
INTERNATIONAL JOURNAL OF MULTIDISCIPLINARY EDUCATIONAL RESEARCH
ISSN : 2277-7881; IMPACT FACTOR – 4.527; IC VALUE:5.16; ISI VALUE:2.286 VOLUME 6, ISSUE 8(2), AUGUST 2017
females and always higher than 3. The length-weight relationship of males and females can be expressed by the following equations.
Male Log W = 0.2812 + 1.03014 Log L
Female Log W = 3.9976 + 0.0094 Log L
Juveniles Log W= 2.0434 + -0.01167 Log L
It is evident from the results that the increases in weight in
relation to length was well appreciable above in 200mm. Females were found to be lighter than males up to 600mm while the males were lighter than females at higher lengths.
The scattered diagrams drawn from length-weight relationship in males and females of Lates calcarifer in the study period evidenced that a curvi linear relationship. By plotting the logarithmic values of Length-Weight showed a linear relationship. This showed that the total weight of the fish increased as an exponential function of its length irrespective of size (Figs. 1 to 6 ).
It was also evident from the present results that the extent of association between the measures of Length and Weight separately for males and females. The co-efficient of correlation (r) obtained from the statistical analysis of the data. The co-efficient of correlation (r) for
males, females and Juveniles during the study period were r=0.950, r=0.967; r=0.231, r=0.287and r=0.880, r=0.935 respectively.
www.ijmer.in 204

INTERNATIONAL JOURNAL OF MULTIDISCIPLINARY EDUCATIONAL RESEARCH
ISSN : 2277-7881; IMPACT FACTOR – 4.527; IC VALUE:5.16; ISI VALUE:2.286 VOLUME 6, ISSUE 8(2), AUGUST 2017
Fig.1. Length-weight relationship of Lates calcarifer in juveniles
Fig.2. Log length-weight relationship of Lates calcarifer in juveniles
y = 1.8797x R² = 0.8804
15
65
115
165
215
265
10 30 50 70 90 110 130
Wei
ght (
in g
ms)
Length (in mm)
Log W=2.0434+ -0.01167 LogL
y = 1.4502x - 0.5875 R² = 0.9355
1.51.61.71.81.9
22.12.22.32.42.5
1.6 1.7 1.8 1.9 2 2.1
Log
Wei
ght
Log Length
www.ijmer.in 205

INTERNATIONAL JOURNAL OF MULTIDISCIPLINARY EDUCATIONAL RESEARCH
ISSN : 2277-7881; IMPACT FACTOR – 4.527; IC VALUE:5.16; ISI VALUE:2.286 VOLUME 6, ISSUE 8(2), AUGUST 2017
Fig.3. Length-weight relationship of Lates calcarifer in Males
Fig.4. Log length-weight relationship of Lates calcarifer in Males
y = 0.0047x2.0641 R² = 0.9502
0500
10001500200025003000350040004500
0 100 200 300 400 500 600
Wei
ght i
n gm
.
Length in mm
y = 0.5142x1.8531 R² = 0.9676
1.5
1.7
1.9
2.1
2.3
2.5
2.7
2.9
1.7 1.9 2.1 2.3 2.5 2.7 2.9
Log
wei
ght.
Log length
Log W= 0.2812+1.03014 LogL
Log W= 0.2812+1.03014 LogL
www.ijmer.in 206
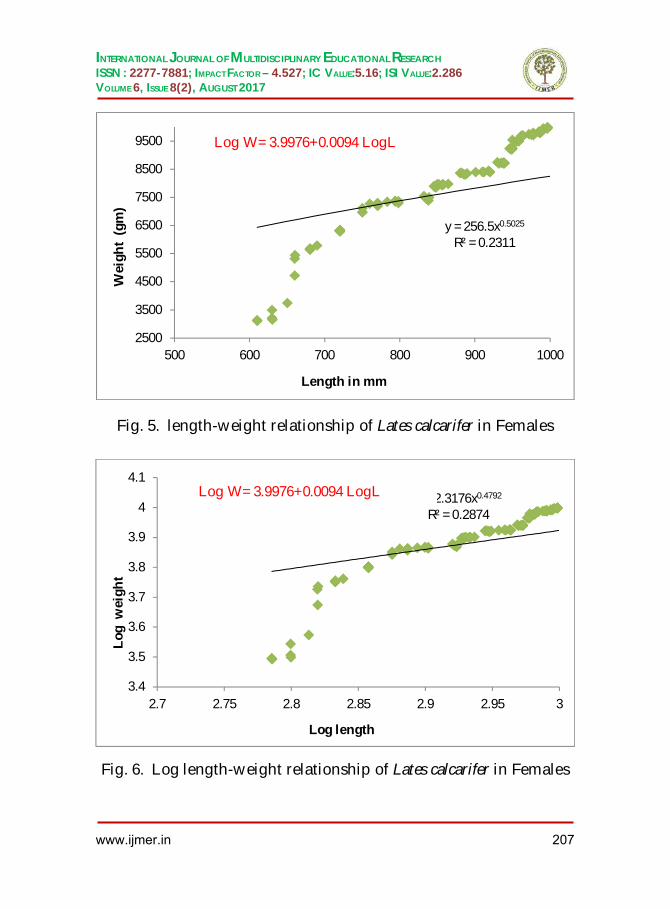
INTERNATIONAL JOURNAL OF MULTIDISCIPLINARY EDUCATIONAL RESEARCH
ISSN : 2277-7881; IMPACT FACTOR – 4.527; IC VALUE:5.16; ISI VALUE:2.286 VOLUME 6, ISSUE 8(2), AUGUST 2017
Fig. 5. length-weight relationship of Lates calcarifer in Females
Fig. 6. Log length-weight relationship of Lates calcarifer in Females
y = 256.5x0.5025 R² = 0.2311
2500
3500
4500
5500
6500
7500
8500
9500
500 600 700 800 900 1000
Wei
ght
(gm
)
Length in mm
y = 2.3176x0.4792 R² = 0.2874
3.4
3.5
3.6
3.7
3.8
3.9
4
4.1
2.7 2.75 2.8 2.85 2.9 2.95 3
Log
wei
ght
Log length
Log W= 3.9976+0.0094 LogL
Log W= 3.9976+0.0094 LogL
www.ijmer.in 207
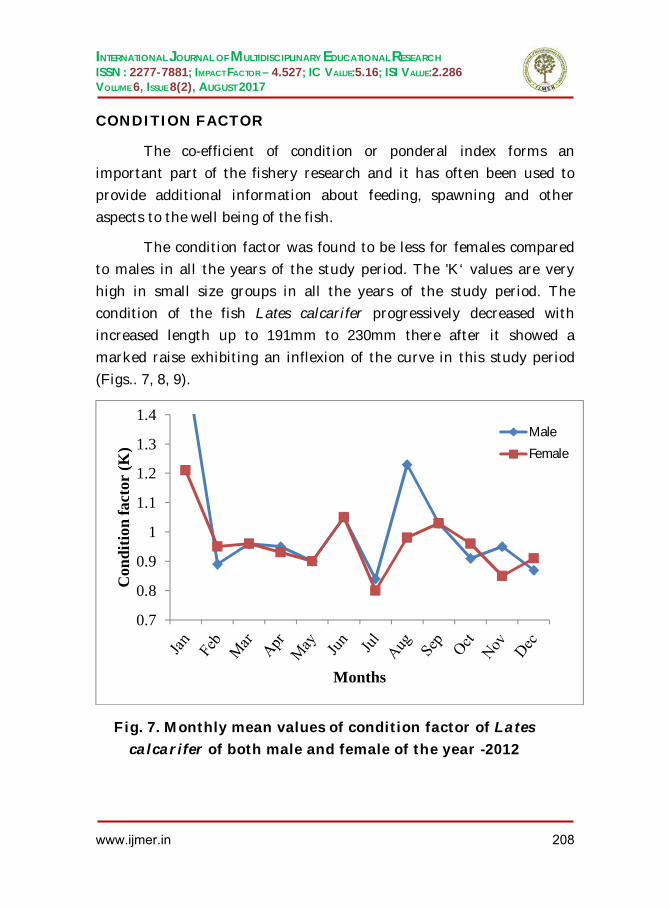
INTERNATIONAL JOURNAL OF MULTIDISCIPLINARY EDUCATIONAL RESEARCH
ISSN : 2277-7881; IMPACT FACTOR – 4.527; IC VALUE:5.16; ISI VALUE:2.286 VOLUME 6, ISSUE 8(2), AUGUST 2017
CONDITION FACTOR
The co-efficient of condition or ponderal index forms an important part of the fishery research and it has often been used to provide additional information about feeding, spawning and other aspects to the well being of the fish.
The condition factor was found to be less for females compared to males in all the years of the study period. The 'K‘ values are very high in small size groups in all the years of the study period. The condition of the fish Lates calcarifer progressively decreased with increased length up to 191mm to 230mm there after it showed a marked raise exhibiting an inflexion of the curve in this study period (Figs.. 7, 8, 9).
Fig. 7. Monthly mean values of condition factor of Lates calcarifer of both male and female of the year -2012
0.7
0.8
0.9
1
1.1
1.2
1.3
1.4
Con
ditio
n fa
ctor
(K)
Months
Male
Female
www.ijmer.in 208
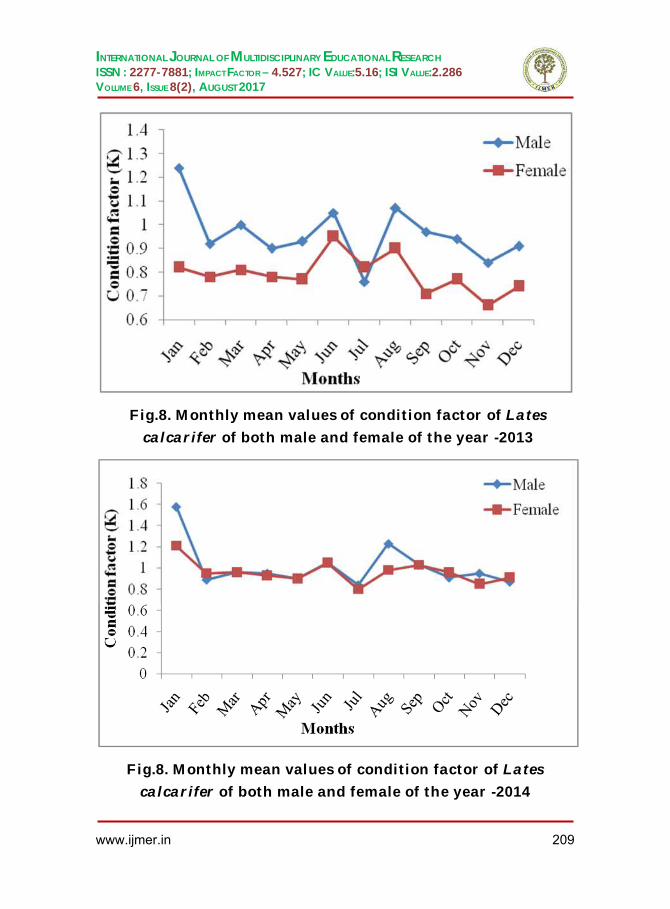
INTERNATIONAL JOURNAL OF MULTIDISCIPLINARY EDUCATIONAL RESEARCH
ISSN : 2277-7881; IMPACT FACTOR – 4.527; IC VALUE:5.16; ISI VALUE:2.286 VOLUME 6, ISSUE 8(2), AUGUST 2017
Fig.8. Monthly mean values of condition factor of Lates calcarifer of both male and female of the year -2013
Fig.8. Monthly mean values of condition factor of Lates calcarifer of both male and female of the year -2014
www.ijmer.in 209
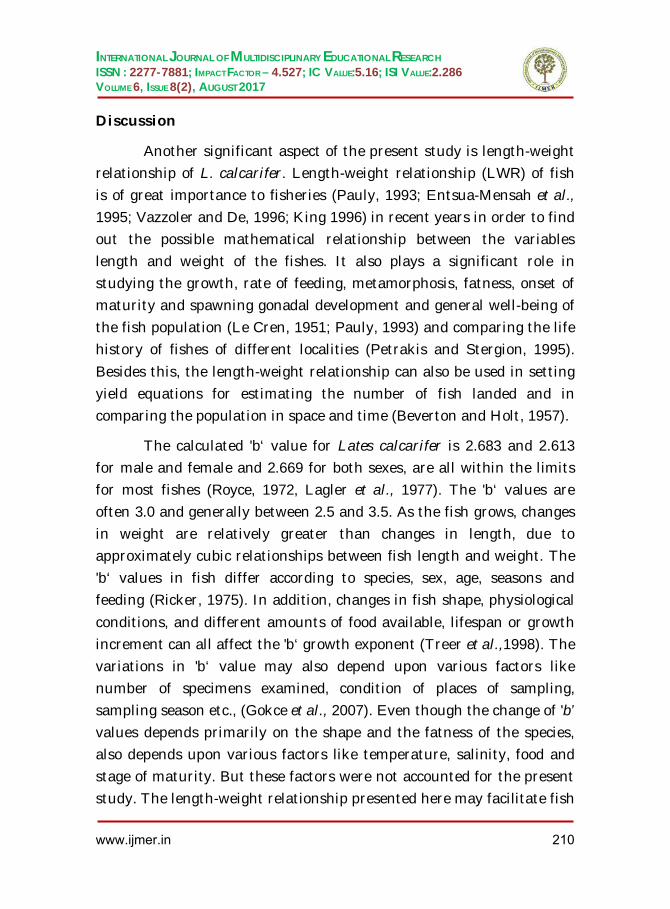
INTERNATIONAL JOURNAL OF MULTIDISCIPLINARY EDUCATIONAL RESEARCH
ISSN : 2277-7881; IMPACT FACTOR – 4.527; IC VALUE:5.16; ISI VALUE:2.286 VOLUME 6, ISSUE 8(2), AUGUST 2017
Discussion
Another significant aspect of the present study is length-weight relationship of L. calcarifer. Length-weight relationship (LWR) of fish is of great importance to fisheries (Pauly, 1993; Entsua-Mensah et al., 1995; Vazzoler and De, 1996; King 1996) in recent years in order to find out the possible mathematical relationship between the variables length and weight of the fishes. It also plays a significant role in studying the growth, rate of feeding, metamorphosis, fatness, onset of maturity and spawning gonadal development and general well-being of the fish population (Le Cren, 1951; Pauly, 1993) and comparing the life history of fishes of different localities (Petrakis and Stergion, 1995).
Besides this, the length-weight relationship can also be used in setting yield equations for estimating the number of fish landed and in comparing the population in space and time (Beverton and Holt, 1957).
The calculated 'b‘ value for Lates calcarifer is 2.683 and 2.613 for male and female and 2.669 for both sexes, are all within the limits for most fishes (Royce, 1972, Lagler et al., 1977). The 'b‘ values are often 3.0 and generally between 2.5 and 3.5. As the fish grows, changes in weight are relatively greater than changes in length, due to approximately cubic relationships between fish length and weight. The 'b‘ values in fish differ according to species, sex, age, seasons and feeding (Ricker, 1975). In addition, changes in fish shape, physiological
conditions, and different amounts of food available, lifespan or growth increment can all affect the 'b‘ growth exponent (Treer et al.,1998). The variations in 'b‘ value may also depend upon various factors like number of specimens examined, condition of places of sampling, sampling season etc., (Gokce et al., 2007). Even though the change of 'b’ values depends primarily on the shape and the fatness of the species, also depends upon various factors like temperature, salinity, food and stage of maturity. But these factors were not accounted for the present study. The length-weight relationship presented here may facilitate fish
www.ijmer.in 210

INTERNATIONAL JOURNAL OF MULTIDISCIPLINARY EDUCATIONAL RESEARCH
ISSN : 2277-7881; IMPACT FACTOR – 4.527; IC VALUE:5.16; ISI VALUE:2.286 VOLUME 6, ISSUE 8(2), AUGUST 2017
biologists to derive weight estimates for fishes that are measured but not weighed.
In the present study, the length-weight relationship is estimated as LogW =0.2812+1.03014LogL, LogW = 3.9976+0.0094LogL and LogW = 2.0434+-0.01167 LogL for males, females and Juveniles respectively. Patnaik and Jena (1976) estimated the 'b‘ value of Lates calcarifer from Chilika lagoon, as 2.916. Therefore the 'b‘ value obtained in the present study agrees with the findings of previous author Ganguly et al., (1959) studied the Length and Weight relationship of Lates
calcarifer in a natural population in relation to other morphometric characteristics. They found the Length and Weight relationship to be Log W =-5.01888+3.0342 Log L, R2 = 0.9988. De (1971) investigated the length and weight relationship of postlarvae, fry and juveniles of Lates calcrifer, revealing a strong positive correlation for postlarvae (10-15 mm) as Log W =6.41506 + 3.62342 Log L; fry (16-45 mm) as Log W = 6.83589 + 3.188958 Log L; and juveniles (50-200 mm) as Log W = 6.70072 +3.22692 Log L.
Patnaik and Jena (1976) studied the length and weight
relationship of this species based on 563 specimens from Lake Chilka in India. Regardless of period of collection, sex and size, the calculated relationship was W(g)= 0.0196 TL (cm)2.917, within the size range of 24-1010 mm and 0.2-12,707 g. Present study was approximately the same when plotted using the formula of Patnaik and Jena (1976). Rodgers (1996) provided observations of Length and weight relationships of reared barramundi fry (2-10 cm and 0.13-12.67 g).
Kund et al., (2011) reported that the relative condition factor (Kn) of small size fishes are higher due to their voracious nature of feeding. On the contrary the intensity of feeding in case of bigger fishes is less than small fishes, but their physiological status combined with gonad weight causes a higher weight gain particularly in the breeding
www.ijmer.in 211
INTERNATIONAL JOURNAL OF MULTIDISCIPLINARY EDUCATIONAL RESEARCH
ISSN : 2277-7881; IMPACT FACTOR – 4.527; IC VALUE:5.16; ISI VALUE:2.286 VOLUME 6, ISSUE 8(2), AUGUST 2017
season. However, the variation in 'Kn‘ values is dependent on the body weight of fishes. Bhatta (1970) pointed out that the condition factor decreases with an increase in length and increases with feeding.
In the present study, the length wise relative condition factor of L. calcarifer were estimated as 0.84, 0.87, 0.89, 1.24, at the length group of 200mm-400mm, 400mm-600mm, 600mm-800mm, 800mm-1000mm respectively indicating very less fluctuation within the size group. The relative condition factor being one or closer to one indicates, the good condition of fish.
References
Alm, G (1959). Connection between maturity, size, and age in fishes. Inst. Freshwater Res. Rep. No. 40: 145p.
Beverton, R.J. and Holt, S.J (1957). On the dynamics of exploited fish
populations, Fishery Invest. Lond., (2)l9, p.533.
Bhatta, V.S (1970). Studies on the biology of dome freshwater fishes. IV Mystus seenghala. Journal of the Bombay natural History Society., 67(2):194-211.Blackwell Scientific Publishers.
Bolger, T. and Connoly, P.L (1989). The selection indices for the measurement and analysis of fish condition. J. Fish Biol., 17(3): 1-182.
Charnov, E.L (1993). Life history invariants: Some explorations of symmetry in evolutionary ecology. Oxford University Press, Oxford, UK.
De, G.K (1971). On the biology of post larvae juvenile stages of Lates calcarifer (Bloch) J. Indian Fish. Assoc., I(2):51-64.
Entsua-Mensah, M., Abunyewa, A. and Palomares, M.L.D (1995). Length-weight relationships of fishes from tributaries of
www.ijmer.in 212

INTERNATIONAL JOURNAL OF MULTIDISCIPLINARY EDUCATIONAL RESEARCH
ISSN : 2277-7881; IMPACT FACTOR – 4.527; IC VALUE:5.16; ISI VALUE:2.286 VOLUME 6, ISSUE 8(2), AUGUST 2017
the Volta River, Ghana, Part I. Analysis of pooled data sets. Naga, ICLARM Quarterly 18:36-38.
Fafioye, O.O. and Oluajo, O.A (2005). Length-weight relationships of five fish species in Epe Lagoon, Nigeria. Afr. J. Biotechnol., 4: 749-751.
Ferhat Kalayc, Necati Samsun, Sabri Bilgin, Osman Samsun (2007). Length-Weight Relationship of 10 Fish Species Caught by Bottom Trawl and Midwater Trawl from the Middle Black Sea, Turkey Turkish Journal of Fisheries and Aquatic Sciences., 7: 33-36.
Froese, R. and Binohlan, C (2000). Empirical relationships to estimate asymptotic length, length at first maturity and length at maximum yield per recruit in fishes, with a simple method to evaluate length frequency data. J. Fish Biol., 56: 758-773.
Ganguly, D.N., Mitra, B., Bhatacharya, N (1959). On the inter relationship between total length, standard length, depth and weight of Lates calcarifer. Proceedings of the National Institute of Sciences of India., 25(B):175-187.
Gokce, G., Ilker, A. and Cengiz, M (2007). Length–weight relationships of 7 fish species from the North Aegean Sea, Turkey. I. J. Natural & Engg. Sc., 1: 51-52.
Goncalves, J.M.S., Bentes, L., Lino, P.G., Ribeiro, J., Canário, A.V.M. and Erzini, K (1997). Weight-length relationship for selected fish species of the small-scale demersal fisheries of the south and south-west coast of Portugal. Fish. Res., 30: 253-256.
King, R.O. 1996. Length-weight relationships of Nigerian coastal water fishes. Naga, ICLARM Quarterly 19:53-58.
Kolher, N., Casey, J. and Turner, P (1995). Length-weight
relationships for 13 species of sharks from the western North
www.ijmer.in 213

INTERNATIONAL JOURNAL OF MULTIDISCIPLINARY EDUCATIONAL RESEARCH
ISSN : 2277-7881; IMPACT FACTOR – 4.527; IC VALUE:5.16; ISI VALUE:2.286 VOLUME 6, ISSUE 8(2), AUGUST 2017
Atlantic. Fish. Bull., 93: 412-418.
Kund, G.C., Mishra, G., Sathapathy, D (2011). Length-weight relationship and relative condition factor of Mugil cephalus in Chilika lagoon, east coast of India. Journal of Applied Zoological Researches.,22(2):153- 156.
Lagler, K.F., Bardach, J.E., Miller, R.R. and May, D.R.P (1977). Ichthyology. 2nd ed. Wiley, New York, xv+pp506.
Le Cren, C.P (1951). Length-weight relationship and seasonal cycle in gonad weight and condition in the Perch (Perca fluviatilis). Journal of Animal Ecology 20(2): 201-219.
Patnaik, S. and Jena, S. (1976). Some aspects of biology of Lates
calcarifer (Bloch) from Chilka lake. Indian J. Fish., 23,(1 and 2): 65-71.
Pauly, D (1984). A mechanism for the juvenile-to-adult transition in fishes. J. Cons. CIEM, 41: 280-284.
Pauly, D (1993). Editorial Fish byte. Naga, ICLARM Quarterly 16:26.
Petrakis, G. and Stergion, K.I (1995). Weight-length relationships of 33 fish species in Greek waters. Fisheries Research 21:465-469.
Quinn, T.J. and Deriso, R.B (1999). Quantitative fish dynamics. Oxford University Press, New York.
Ricker, W. E (1975). Computation and interpretation of biological statistics of fish populations. Fish. Res. Board Canada Bull., 191: 203-233.
Ricker, W.R (1971). Methods for assessment of fish production in fresh waters. I.B.P., Blackwell Scientific Publishers
Rodgers, L (1996). Feeds, feeders and feeding practices for the nursing
of barramundi fry. pp. 65-71. In: Barramundi Farming Information Package. Introductory Information for Prospective
www.ijmer.in 214
INTERNATIONAL JOURNAL OF MULTIDISCIPLINARY EDUCATIONAL RESEARCH
ISSN : 2277-7881; IMPACT FACTOR – 4.527; IC VALUE:5.16; ISI VALUE:2.286 VOLUME 6, ISSUE 8(2), AUGUST 2017
Barramundi Farmers. Freshwater Fish. and Aquacult. Centre, Walkamin, Australia.
Royce, W.F (1972). Introduction to fishery sciences. Academic Press, London, 35p.
Summerfelt. R.C., and Hall, G.E (1975). Age and growth of fish. Iowa State University Press. Ames.
Thampi Sam Raj, Y.C., Vinod, P.N., Ramar, G., Mahendran and Dhandapani, K (2003). Commercial seabass seed production – RGCA shows the way. Infofish International 2:8-13.
Thirunavukkarasu, A.R., Kailasam, M., Kishore Chandra, P., Shiranee, P., Mathew Abraham, Charles, A.V.K. and Subburaj, R (2001). Captive broodstock development and breeding of seabass Lates
calcarifer (Bloch) in India. In: Menon, N. G. and Pillai, P. P. (Eds.), Perspectives in mariculture. The Marine Biological Association of India, Cochin, p. 111-124.
Treer, T., Habekovic, D., Anicic, I., Safner, R. and Kolak, A (1998). The growth of five populations of chub (Leuciscus cephalus) in the Danube River Basin of Croatia. Proc. International Symposium-Aquarium . May 1998, Galati, Romania,p18–22.
Tucker, J.W., Russell, D.J. and Rimmer, M.A (2002). Barramundi
culture: a success story for aquaculture in Asia and Australia. World Aquaculture., 33:53-59.
Vazzoler, A.E.A. and De, M (1996). Biologia da reproducao de peixes teleosteos: teoria practica. Maringa: EDUEM. Sao Paulo: SBI. 169 pp.
Volvich, L. and Appelbaum, S (2001). Length to weight relationship of seabass Lates calcarifer (Bloch) reared in a closed recirculating system. Israeli J. Aquaculture., Bamidgeh, 53: 158-163.
www.ijmer.in 215
INTERNATIONAL JOURNAL OF MULTIDISCIPLINARY EDUCATIONAL RESEARCH
ISSN : 2277-7881; IMPACT FACTOR – 4.527; IC VALUE:5.16; ISI VALUE:2.286 VOLUME 6, ISSUE 8(2), AUGUST 2017
Yıldırım, A., Erdogan, O. and Turkmen, M (2002). On the age, growth
and reproduction of the Barbel, Barbus plebejus (Steindachner, 1897) in the Oltu stream of Coruh River (Artvin-Turkey). Turkish J. Zool., 25: 163-168.
www.ijmer.in 216

INTERNATIONAL JOURNAL OF MULTIDISCIPLINARY EDUCATIONAL RESEARCH
ISSN : 2277-7881; IMPACT FACTOR – 4.527; IC VALUE:5.16; ISI VALUE:2.286 VOLUME 6, ISSUE 8(2), AUGUST 2017
NUTRITIONAL ASPECT FOR FRESHWATER PRAWN
(Macrobrachium rosenbergii) FARMING
K. Jaiswal*1, K.H. Vadher1, M. Pal1, K. Manusha1 & V. Sarman1 College of Fisheries Science, Junagadh Agricultural University, Veraval,
Gujarat, India ABSTRACT
Freshwater prawn have become an important component of global aquaculture both in terms of quantity and value. It is a one of the most important species for culture due to superior cultivable attributes such as very fast growth rate, high market demand, hardiness, euryhaline nature and its compatibility to grow with cultivable fin fishes.
It could be cultured almost all freshwater bodies such as ponds, tanks, canals, cage, pans, raceways. As freshwater prawn culture becomes more intensive, it also becomes less dependent on natural food and more on prepared feeds. Freshwater prawn farming is carried out by small and marginal farmers who are employing a low input level. Here we concerned on most dietary nutritional component and their effective application in aqua-farming. Various studies have shown that M. rosenbergii is able to utilize a higher proportion of plant derived protein. Their results provide useful perspective for managers of current prawn farming operations. The purpose of this study was to evaluate nutritional requirement of freshwater prawn in aqua-farming.
Key words: Freshwater prawn, Scampi, Feed, Nutrition, Aqua-farming,
INTRODUCTION
Fish is a vital component of food security and livelihood especially in
developing countries of the world. As the world population grow, the need for more food and more fish correspondingly increased. Aquaculture, the farming and the husbandry of fish and other aquatic
www.ijmer.in 217

INTERNATIONAL JOURNAL OF MULTIDISCIPLINARY EDUCATIONAL RESEARCH
ISSN : 2277-7881; IMPACT FACTOR – 4.527; IC VALUE:5.16; ISI VALUE:2.286 VOLUME 6, ISSUE 8(2), AUGUST 2017
organisms, is now a well-established industry worldwide and fastest growing food production sector. Fish nutrition and feeding play important roles in the sustainable development of aquaculture. The efficient conversion of feed to fish is important to fish farmers because feed is the largest component of the total cost of production. Improved feed composition and better feed efficiency will result in higher fish production, lower feed cost and low waste production hence, decreased nutrient load from fish farming.
The farming of the giant freshwater prawn Macrobrachium
rosenbergii popularly known as 'scampi' has been expanding in India recent years. Scampi farming gained momentum after the set-back in shrimp farming due to disease outbreaks and other factors. The infrastructure available to produce shrimp seed and process the shrimp was helpful in providing support to scampi farming. The existing culture system includes both monoculture and polyculture with Indian major carps in ponds. Grow out stocking densities range from 0.5-2.5 scampi per m2 in polyculture and 1-5 per m2 in monoculture. The culture period is 6-8 months starting at the beginning of southwest monsoon (June-July, 27-30°C ). The scampi are fed with farm-made or commercial
feeds.
ORIGIN OF MODERN FRESHWATER PRAWN CULTURE
Freshwater prawns have been reared in captivity, either through introducing wild-caught juveniles or by trapping them, along with other crustaceans (e.g. Penaeus spp. and Metapenaeus spp.) and fish, in tidal ponds and paddy fields, for example in the Indian sub-continent and Malaysia (Wickins 1976), from time immemorial. However, modern aquaculture of this species has its origins in the early 1960s. In 1961 the first major milestone was achieved at the Marine Fisheries Research Institute in Penang, Malaysia, when the Food and Agriculture Organization (FAO) expert Shao-Wen Ling discovered that freshwater prawn (M. rosenbergii) larvae required brackish conditions for survival.
www.ijmer.in 218

INTERNATIONAL JOURNAL OF MULTIDISCIPLINARY EDUCATIONAL RESEARCH
ISSN : 2277-7881; IMPACT FACTOR – 4.527; IC VALUE:5.16; ISI VALUE:2.286 VOLUME 6, ISSUE 8(2), AUGUST 2017
While Ling’s discoveries were fundamental, it was the work of another pioneer, Takuji Fujimura that made the commercial development of freshwater prawn culture possible. This was the second major milestone in the history of freshwater prawn farming. Fujimura’s research in Hawaii commenced in 1965, with the introduction of broodstock of M. rosenbergii from Malaysia (Ling & Costello 1979). Within 3 years, the
activities of Fujimura and his team in the Anuenue Fisheries Research Center in Honolulu resulted in the development of mass-rearing techniques for commercial-scale hatchery production of prawn postlarvae (PL) (Fujimura & Okamoto 1972). The third important milestone in the history of freshwater prawn farming occurred when the United Nations Development Programme (UNDP) decided to fund an FAO executed project, named ‘Expansion of Freshwater Prawn Farming’, in Thailand.
PRODUCTION STATUS OF FRESHWATER PRAWN IN INDIA
Plagued by the lack of demand the scampi culture and production has failed to so any increase. The scientific monoculture of scampi has been recorded only in about 2919 Ha registering a production of about 3332 MT.
Table 1. A state-wise detail of scampi production during 2011-12 & 2012-13
Sl. No.
State 2011-12 2012-13 Area
under culture
(Ha)
Estimated
production (MT)
Productivity in
(MT/Ha/Year)
Area under culture(Ha)
Estimated
production (MT)
Productivity in (MT/Ha/
Year)
1. West Bengal
4358.00 2906.00
0.66 1520.00 2446.00 1.61
2. Odisha 743.00 513.00 0.69 886.00 592.00 0.67 3. Andhra
Pradesh 485.00 475.00 0.98 280.00 174.00 0.62
4. Tamil 437.00 285.00 0.65 136.00 54.00 0.40
www.ijmer.in 219
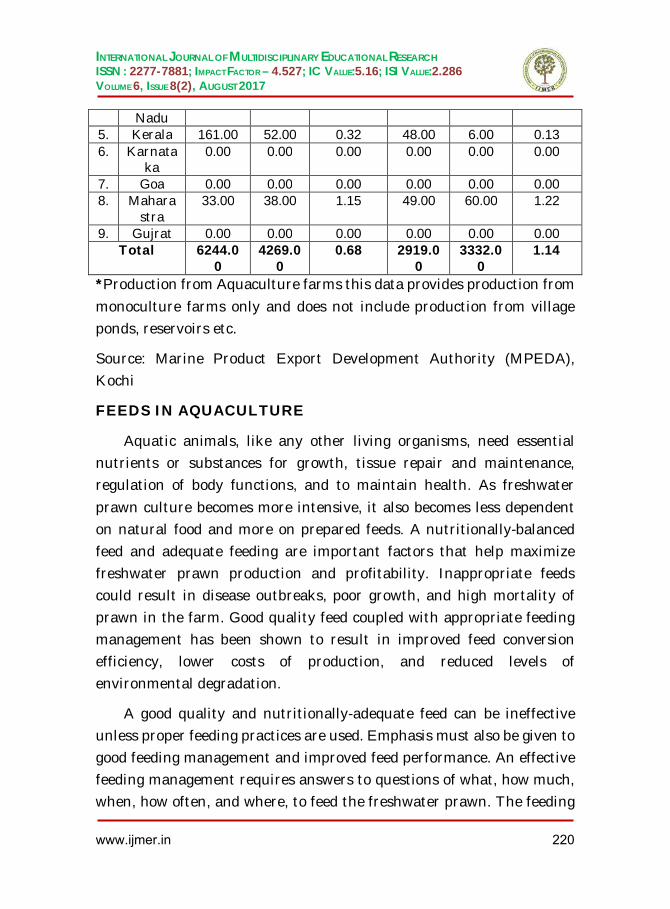
INTERNATIONAL JOURNAL OF MULTIDISCIPLINARY EDUCATIONAL RESEARCH
ISSN : 2277-7881; IMPACT FACTOR – 4.527; IC VALUE:5.16; ISI VALUE:2.286 VOLUME 6, ISSUE 8(2), AUGUST 2017
Nadu
5. Kerala 161.00 52.00 0.32 48.00 6.00 0.13 6. Karnata
ka 0.00 0.00 0.00 0.00 0.00 0.00
7. Goa 0.00 0.00 0.00 0.00 0.00 0.00 8. Mahara
stra 33.00 38.00 1.15 49.00 60.00 1.22
9. Gujrat 0.00 0.00 0.00 0.00 0.00 0.00 Total 6244.0
0 4269.0
0 0.68 2919.0
0 3332.0
0 1.14
*Production from Aquaculture farms this data provides production from
monoculture farms only and does not include production from village ponds, reservoirs etc.
Source: Marine Product Export Development Authority (MPEDA), Kochi
FEEDS IN AQUACULTURE
Aquatic animals, like any other living organisms, need essential nutrients or substances for growth, tissue repair and maintenance, regulation of body functions, and to maintain health. As freshwater
prawn culture becomes more intensive, it also becomes less dependent on natural food and more on prepared feeds. A nutritionally-balanced feed and adequate feeding are important factors that help maximize freshwater prawn production and profitability. Inappropriate feeds could result in disease outbreaks, poor growth, and high mortality of prawn in the farm. Good quality feed coupled with appropriate feeding management has been shown to result in improved feed conversion efficiency, lower costs of production, and reduced levels of environmental degradation.
A good quality and nutritionally-adequate feed can be ineffective unless proper feeding practices are used. Emphasis must also be given to good feeding management and improved feed performance. An effective feeding management requires answers to questions of what, how much, when, how often, and where, to feed the freshwater prawn. The feeding
www.ijmer.in 220
INTERNATIONAL JOURNAL OF MULTIDISCIPLINARY EDUCATIONAL RESEARCH
ISSN : 2277-7881; IMPACT FACTOR – 4.527; IC VALUE:5.16; ISI VALUE:2.286 VOLUME 6, ISSUE 8(2), AUGUST 2017
regime used should match the feeding behavior and digestive cycle of the freshwater prawn in order to maximize feed utilization. Any reduction in food wastage will have a significant impact on freshwater prawn production costs and the quality of the culture environment.
NUTRIENT REQUIREMENTS
There is a fairly good amount of information on the nutrient requirements of freshwater prawn. The prawns are capable of digesting a wide range of foods of both plant and animal origin. Characterization of the activities of the digestive enzymes in the alimentary tract indicates the presence of enzymes like trypsin, amino peptidases, proteases, amylases, chitinase, cellulase, esterases and lipases. Nutrient
requirements of different grow out stages of prawn are summarized in Table 2.
Proteins and Amino Acids
Diets with about 35-40% protein and gross energy level of about 3.2 kcal/g diet and protein:energy ratio of about 125-130 mg protein/kcal are suitable for growth of M. rosenbergii in clear water systems that do not have any supply of natural foods. Broodstock reared in ponds having natural food (benthic micro- and macro fauna) require about 30% protein in the diet. Many commercial feeds for grow-out contain 24-32% crude protein. Protein/starch ratio of 1:1 is known to be effective for better feed efficiency and growth rate. The prawn requires the same ten essential amino acids as other crustacean and fish species, but quantitative requirements have not been determined. The amino acid composition of the prawn muscle is used to provide guidance values in
feed formulation.
Carbohydrates
The comparatively high specific activity of amylase found for M. rosenbergii supports the fact that the species efficiently utilizes
www.ijmer.in 221

INTERNATIONAL JOURNAL OF MULTIDISCIPLINARY EDUCATIONAL RESEARCH
ISSN : 2277-7881; IMPACT FACTOR – 4.527; IC VALUE:5.16; ISI VALUE:2.286 VOLUME 6, ISSUE 8(2), AUGUST 2017
carbohydrates as a source of energy. During fasting, energy metabolism in the prawn is dominated by carbohydrates, followed by lipids and proteins. Complex polysaccharides including starch and dextrin are more effectively utilized than simple sugars. Dietary glucosamine (an amino sugar and intermediary between glucose and chitin) facilitates molting followed by enhanced growth. Dietary protein is efficiently utilized at dietary lipid-carbohydrate ratio of 1:3-1:4. The prawns are also known to utilize as high as 30% dietary fiber.
Lipids and Fatty Acids
In freshwater prawn that uses dietary carbohydrate efficiently as energy source, protein sparing by lipids is not considered to be crucial.
The dietary lipid level in prawn diets can be as low as 5 % provided the lipid source contains sufficient levels of essential fatty acids. There is a dietary requirement for highly unsaturated fatty acids (HUFA) although in very small quantities. Both n-3 and n-6 HUFAs at dietary levels of 0.075% are known to increase weight gain and feed efficiency remarkably. In addition both 18:2n-6 and 18:3n-3 are also required.
M. rosenbergii, like other crustaceans, is unable to synthesize cholesterol due to the absence of the enzyme 3 hydroxy 3 methylglutaryl CoA reductase. The dietary requirement for cholesterol is approximately 0.3-0.6% in diet. Substitution with 0.6% ergosterol or stigmesterol is generally not so effective compared to 0.6% cholesterol. However, a mixture of phytosterols (sitosterol, campesterol and
dihydrobrassi-casterol) has been found to be as effective as cholesterol. So, unlike in penaeid shrimp feeds, there is no need to add high levels of purified cholesterol in freshwater prawn feeds provided the ingredients contain sufficient levels of phytosterols. Low level of dietary cholesterol in broodstock diet is known to adversely affect egg quality resulting in inferior quality of seed production The cholesterol content in the eggs and hepatopancreas, and total lipid content in the ovary and hepatopancreas of pond reared broodstock fed with a diet containing 30%
www.ijmer.in 222

INTERNATIONAL JOURNAL OF MULTIDISCIPLINARY EDUCATIONAL RESEARCH
ISSN : 2277-7881; IMPACT FACTOR – 4.527; IC VALUE:5.16; ISI VALUE:2.286 VOLUME 6, ISSUE 8(2), AUGUST 2017
crude protein and 5% lipid was significantly lower when compared to the eggs from wild broodstock collected from the lower reaches of the river Brahmini in Orissa, India. Higher levels of lipids and cholesterol are probably key factors in egg maturation and egg quality.
The freshwater prawn also has limited ability to biosynthesize phospholipid (PL) de novo. A basal level of 0.8% dietary PLs is required to meet the demand of the scampi broodstock. A dietary source of phosphatidylcholine (PC) in the form of soy-lecithin is essential for larval growth and survival. Supplementation of larval diets with 5%
soy-lecithin along with 1 % cod liver oil and 1% groundnut oil improved growth rate by164%. In the absence of sufficient levels of bile salts during development, dietary PC may also enhance the assimilation of ingested fats by acting as temporary emulsifier.
Vitamins
Vitamin requirements of M. rosenbergii are probably similar to other crustaceans and fish species. The prawn requires 60-150mg vitamin C/kg diet. Levels of 60mg ascorbicacid and 300 mg -tocopherol per kg diet are considered sufficient for proper reproduction and offspring viability in prawn broodstock. However, feeding female prawn with higher levels of both these vitamins (each around 900 mg/kg) might improve larval quality including higher tolerance to ammonia stress. It has been reported that vitamin E at 200 mg/kg diet modulated some of the antioxidants defense system by decreasing lipid peroxidation in the
hepatopancreas.
Minerals
Information on quantitative mineral requirement of freshwater prawn is limited. Dietary supply of calcium seems to improve growth of freshwater prawn. Performance of the prawns were better when calcium was provided at 3% level in soft water (Calcium concentration at 5 ppm). Even when the calcium concentration was higher at 74 ppm,
www.ijmer.in 223

INTERNATIONAL JOURNAL OF MULTIDISCIPLINARY EDUCATIONAL RESEARCH
ISSN : 2277-7881; IMPACT FACTOR – 4.527; IC VALUE:5.16; ISI VALUE:2.286 VOLUME 6, ISSUE 8(2), AUGUST 2017
performance improved when calcium was provided at 1.8%. The optimum level of zinc is at 50-90mg/kg diet. Growth and feed conversion efficiency declined at higher dietary doses (> 90mg/kg) of zinc.
Table 2. Nutrient requirements of freshwater prawn, M. rosenbergii
Sl. No.
Nutrients Growth stages
Requirement
1. Protein (%) Broodstock 38-40 Juveniles (2nd 4th month)
35-37
Adult (5th 6th month)
28-30
2. Carbohydrate (%) For all stages 25-35 3. Lipid, including phospholipids
(%) For all stages 3-7
4. Lipid, including phospholipids (%)
> 0.08
5. Cholesterol (%) For all stages 0.5-0.6 6. Vitamin- C (mg/kg) Grow out 100 7. Calcium/Phosphorus - 1.5-2.0:1 8. Zn (mg/kg) - 90 9. Other minerals - Quantitative
requirements not yet known
10. Energy Broodstock 3.7-4.0 kcal/g feed
Other stages 2.9-3.2 kcal/g feed
(Source: MitraGopa et. al. 2005.)
MECHANISM OF NUTRITION
The process of nutrition involves three stages—ingestion, digestion and egestion.
www.ijmer.in 224

INTERNATIONAL JOURNAL OF MULTIDISCIPLINARY EDUCATIONAL RESEARCH
ISSN : 2277-7881; IMPACT FACTOR – 4.527; IC VALUE:5.16; ISI VALUE:2.286 VOLUME 6, ISSUE 8(2), AUGUST 2017
Ingestion
Prawn is omnivorous, i.e., eats all kinds of foods. It feeds actively at dusk and in the morning on algae, decaying vegetables and small insects. Food is procured by the chelate legs and brought near the mouth cavity by following appendages – maxilla, maxillulae, Mandibbles and maxillipeds. These appendages allow animal to bring food closer to mouth. Mandibles help to fragment the food into smaller bits and the molar processes of the mandibles inside the buccal cavity crush the food. Entrance of food within the cardiac stomach is assisted by the peristaltic motion of the oesophageal wall.
Digestion
Within the cardiac stomach the food is churned by the action of cuticular plates on the inner wall, finer particles of food filtered by the
complete come within lateral grooves from where it is guided into the ventral chamber of pyloric stomach. Digestion takes place within the pyloric stomach by the action of digestive juices which come from the hepatopancreas. All the enzymes for the breakdown of carbohydrate, protein and lipid are present in the juice.
The digested liquid food is strained by the filtering apparatus in the ventral chamber of pyloric stomach and enters within dorsal chamber and then to the hepatopancreas. The residual part of the food passes within the mid gut. After certain amount of absorption the residual matter enters within dorsal chamber and then to the hepatopancreas. The residual part of the food passes within the hind gut.
Egestion
From intestine the residual part of the food enters within the rectum and is temporarily stored there for some-time. Finally it is ejected through the anus.
www.ijmer.in 225

INTERNATIONAL JOURNAL OF MULTIDISCIPLINARY EDUCATIONAL RESEARCH
ISSN : 2277-7881; IMPACT FACTOR – 4.527; IC VALUE:5.16; ISI VALUE:2.286 VOLUME 6, ISSUE 8(2), AUGUST 2017
SUMMARY
The prawn is one of the high value aquaculture product emerging from Asia. At present feed is the largest single cost item, as it constitutes 40-60% of operational cost in prawn production. Hence feed to attain higher growth and more efficient feed conversion ratios needs to be developed. In this context, the use of feeding attractants will have relevance in improving feed intake and feed efficiency and to minimize feed wastage and water pollution.
REFERENCES
ICAR (2013). Handbook of Fisheries and Aquaculture. ICAR. Pp 413-438 & 664-667.
Mitra Gopa et. al. (2005). Nutrition and feeding in freshwater prawn (Macrobrachium rosenbergii) farming. Aqua Feeds:
Formulation & Beyond, volume 2 Issue I. Pp 17- 19.
Millamena Oseni M (2002). Introduction to nutrition in tropical aquaculture. SEAFDEC. Pp 01-05.
New M. Bernard et. al. (2010). Freshwater Prawns Biology and Farming. Wiley-Blackwell. Pp 01-10.
Wickins, J.F. (1976). Prawn biology and culture. In Oceanography and Marine Biology: An Annual Review, Vol. 14, (Ed. by H. Barnes), pp. 435–507. Aberdeen University Press, Aberdeen.
Ling, S.W. & Costello, T.J (1979).The culture of freshwater prawns: a review. In Advances in Aquaculture. Papers presented at the FAO Technical Conference on Aquaculture, 26 May–2 June 1976, Kyoto, (Ed. by T.V.R. Pillay& W.A. Dill), pp. 299–304. Fishing News Books, Blackwell Science, Oxford.
Fujimura, T. & Okamoto, H (1972). Notes on progress made in
developing a mass culturing technique for Macrobrachium
www.ijmer.in 226

INTERNATIONAL JOURNAL OF MULTIDISCIPLINARY EDUCATIONAL RESEARCH
ISSN : 2277-7881; IMPACT FACTOR – 4.527; IC VALUE:5.16; ISI VALUE:2.286 VOLUME 6, ISSUE 8(2), AUGUST 2017
rosenbergii in Hawaii. In Coastal Aquaculture in the Indo-Pacific Region, (Ed. by T.V.R. Pillay), pp. 313–27. Fishing News Books, Blackwell Science, Oxford.
CIFE (1996). Training manual: Modern approach to aqua feed formulation and on-farm feed management. CIFE. Pp 07-16.
Finfish nutrition research in Asia: Proceedings of the Second Asian Fish
Nutrition Networks Meeting. 1988. In: De Silva S (ed). Heinemann Publishers Asia Ptc. Ltd. Singapore. Pp 128.
Feed Development Section (1994). Feeds and feeding of milkfish, Nile tilapia, Asian sea bass and tiger shrimp. Aquaculture Extension Manual No. 21. SEAFDEC Aquaculture Department, Tigbauan, Iloilo, Philippines. Pp 97.
www.ijmer.in 227

INTERNATIONAL JOURNAL OF MULTIDISCIPLINARY EDUCATIONAL RESEARCH
ISSN : 2277-7881; IMPACT FACTOR – 4.527; IC VALUE:5.16; ISI VALUE:2.286 VOLUME 6, ISSUE 8(2), AUGUST 2017
FISH PRODUCTION IMPLIES TO ECONOMIC GROWTH&
STAINABLE DEVELOPMENT
Y.Suryasowjanya*Luke Steeven Babu** Research scholar Dept. of Economics
Acharya Nagarjuna University, Guntur
ABSTRACT: Fisheries are a very important source of food, livelihood
and trade surplus in many developed as well as developing countries of the world. Globally the sector provides nearly sixteen percent of total
animal protein supplies and an estimated food supply of 17 Kg per capita, direct employment to 45 million people and about forty percent of fish output is traded internationally .Fisheries in India is a very important economic activity and a flourishing sector with varied resources and potentials. Only after the Indian Independence, has fisheries together with agriculture been recognized as an important sector. The vibrancy of the sector can be visualized by the 11–fold increase that India achieved in fish production in just six decades, i.e. from 0.75 million tonnes in 1950-51 to 9.6 million tonnes during 2012–13. This resulted in an unparalleled average annual growth rate of over 4.5 percent over the year which has placed the country on the forefront of global fish production, only after China. Besides meeting the domestic needs, the dependence of over 14.5 million people on fisheries activities for their livelihood and foreign exchange earnings to the tune
of US$ 3.51 billion (2012–13) from fish and fisheries products, amply justifies the importance of the sector. India is also an important country that produces fish through aquaculture in the world. India is home to more than 10 percent of the global fish diversity. Presently, the country ranks second in the world in total fish production with an annual fish production of about 9.06 million metric tonnes. As the second largest country in aquaculture production, the share of inland fisheries and aquaculture has gone up from 46 percent in the 1980s to over 85 percent in recent years in total
www.ijmer.in 228
INTERNATIONAL JOURNAL OF MULTIDISCIPLINARY EDUCATIONAL RESEARCH
ISSN : 2277-7881; IMPACT FACTOR – 4.527; IC VALUE:5.16; ISI VALUE:2.286 VOLUME 6, ISSUE 8(2), AUGUST 2017
fish production. Freshwater aquaculture showed an overwhelming ten-fold growth from 0.37 million tonnes in 1980 to 4.03 million tonnes in 2010; with a mean annual growth rate of over 6 percent. Freshwater aquaculture contributes to over 95 percent of the total aquaculture production. The freshwater aquaculture comprises of the culture of
carp fishes, culture of catfishes (air breathing and non-air breathing), culture of freshwater prawns, culture of pangasius, and culture of tilapia. In addition, in brackish water sector. Thus, the production of carp in freshwater and shrimps in brackish water from the bulk of major areas of aquaculture activity. The three Indian major carps, namely catla (Catla catla), rohu (Labeo rohita) and mrigal (Cirrhinus mrigala) contribute the bulk of production to the extent of 70 to 75 percent of the total fresh water fish production, followed by silver carp, grass carp, common carp, catfishes forming a second important group contributing the balance of 25 to 30 percent. It is estimated that only about 40 percent of the available area of 2.36 million hectares of ponds and tanks has been put to use and an immense scope for expansion of area exists under freshwater aquaculture. But increasing aquaculture one side and other side fallen aquaculture production because the
climate changing problems and rapid spread decease’s and also increasing investment and expenditure on fertilizes, aqua feed etc. So government to conduct awareness programmes to people participation on aquaculture practices. Creating new innovations introduce hybrid shrimps to growth any season and all climate changes, environmental conditions and developing aquaculture production India has first position entered global economy.
Keywords:
Fish production, economic growth, stainable development, Freshwater aquaculture
www.ijmer.in 229
INTERNATIONAL JOURNAL OF MULTIDISCIPLINARY EDUCATIONAL RESEARCH
ISSN : 2277-7881; IMPACT FACTOR – 4.527; IC VALUE:5.16; ISI VALUE:2.286 VOLUME 6, ISSUE 8(2), AUGUST 2017
INTRODUCTION:
Fisheries and aquaculture are an important sources for food and livelihoods for people along the world’s seashores and waterways and influence the livelihoods for more than one billion people. Both industries exploit renewable natural resources with a substantial potential for environmental degradation if the industries’ production practices are not sustainable, a feature that are not uncommon. The
industries are also important users of energy with a significant carbon footprint. the world’s fishing fleets are using 1.2% of the global oil consumption, primarily as fuel, and by a rough estimate this number will increase to 2% if aquaculture is included. Green growth policies in relation to fisheries, aquaculture production and trade will, depending Green growth policies in relation to fisheries, aquaculture production and trade will, depending on the conditions of production, have to address different challenges and opportunities, although there are also a number of common threads. Hence, when discussing the issues, to provide different discussions for the two different production processes, but treat them together after the fish has come out of the water through the value chain on its way to the final market and the consumer. This will allow identification of the key challenges in the different sectors, and give the necessary background for the discussion
on green growth policies.
OBJECTIVES:
The main objective of this paper will focus on the potential for fish production and stainable development.
The objective of commercial fish farming is to produce fish for sale and earn profits.
Therefore, production should be planned from the
onset to target identified markets.
www.ijmer.in 230
INTERNATIONAL JOURNAL OF MULTIDISCIPLINARY EDUCATIONAL RESEARCH
ISSN : 2277-7881; IMPACT FACTOR – 4.527; IC VALUE:5.16; ISI VALUE:2.286 VOLUME 6, ISSUE 8(2), AUGUST 2017
Have the required product (size and form)
available when the market wants it be able to produce adequate volumes to sustain targeted market.
Produce at a competitive price and profit.
To control water pollutions and product stainable
development .
Reporting on the impact of an economic activity generally begins with a descriptive profile of the activity, setting out its nature and economic characteristics and providing an overview of its linkages with other sectors in the broader economy. Key factors affecting performance and trends are discussed and quantified using industry-specific indicators. Relevant factors include resource conditions, regulatory framework and markets, with performance measured using such indicators as the quantity and value of production, number of establishments, employment and exports.
In producing its output, an industry also triggers activity elsewhere in the economy. The sum of this activity, generally referred to as economic impact, is conventionally measured with three indicators:
GDP: an industry’s contribution to Gross Domestic Product
represents its broadest measure of economic impact. The domestic product of aquaculture captures the value it adds to purchased inputs (e.g., feed and utilities) through the
application of labour and capital. GDP represents the sum of the value added by all firms in an industry, where value added is composed of the income earned – labour income, and returns to and of capital. Value added should not be confused with output value, since the latter would include the value of purchased inputs.
www.ijmer.in 231

INTERNATIONAL JOURNAL OF MULTIDISCIPLINARY EDUCATIONAL RESEARCH
ISSN : 2277-7881; IMPACT FACTOR – 4.527; IC VALUE:5.16; ISI VALUE:2.286 VOLUME 6, ISSUE 8(2), AUGUST 2017
Employment: industry employment is important because of
the significance generally attached to jobs; from a purely economic impact perspective, the significance lies in the economic impact generated through the spending of employment income. The greater the employment and higher the average income, the more significant the industry in terms of its overall economic impact. Unless otherwise indicated,
employment is measured in full-time equivalents (FTE).
Labour income: this captures payments in the form of wages
and salaries earned in an industry. Returns to labour in the form of wages, salaries and earnings form a key component of GDP. Industries paying relatively high average wages and salaries generate a correspondingly higher economic impact than industries paying lower average incomes.
Economic impacts are generated through direct, indirect and induced demand in the economy expressed in terms of industry and consumer purchases of goods and services.
Direct impact: refers to impact arising from the expenditures
made by firms in the subject industry (in this case aquaculture) on the goods and services needed to produce industry outputs. Direct activities include hatchery operations, grow-out, harvesting, processing and corporate administration.
Indirect impact: refers to the impacts arising from purchased
inputs triggered by the direct demand. For example, aquaculture companies buy feed, vessels and cages from manufacturers, and business services from biologists, technicians and divers. These companies in turn buy their
inputs (e.g., fish meal and oil, steel and winches, plastics and netting, professional labour and equipment) from other companies, and so on. Taken together, the process of producing
www.ijmer.in 232

INTERNATIONAL JOURNAL OF MULTIDISCIPLINARY EDUCATIONAL RESEARCH
ISSN : 2277-7881; IMPACT FACTOR – 4.527; IC VALUE:5.16; ISI VALUE:2.286 VOLUME 6, ISSUE 8(2), AUGUST 2017
these goods and services creates profits, employment and income generating indirect impacts.
Induced demand: refers to the demand created in the broader
economy through consumer spending of incomes earned by those employed in direct and indirect activities. It may take a year or more for these rounds of consumer spending to work their way through an economy.
Aquaculture is the fastest growing food production sector in the world. Since 1984, global aquaculture output has increased at an average annual rate of about 10 percent, compared with a 3 percent increase for livestock meat and 1.6 percent increase for capture fisheries. Aquaculture is emerging as a major source of food and income, thus making it a significant contributor to food security. Today, aquaculture production accounts for over a quarter of total world fish production.
India is the second largest producer of fish in the world contributing to 5.43% of global fish production. India is also a major producer of fish through aquaculture and ranks second in the world after China. The total fish production during 2010-2011 (provisional) is at 8.42 million metric tonnes with a contribution of 5.20 million metric tonnes from inland sector and 3.22 million metric tonnes from marine
sector respectively. Fisheries inland sector and 3.22 million metric tonnes from marine sector respectively. Fisheries being one of the promising sectors of agriculture and allied activities in India, a growth marine fish production the growth rate of inland fish production registered an impressive 5.52 percent during 2000. During 2010 volume of fish and fish products exported was 8,13,091 tonnes worth crores. As per the estimates of Central Statistical inland sector and 3.22 million metric tonnes from marine sector respectively. Fisheries being one of the promising sectors of agriculture and allied activities in India, a
www.ijmer.in 233

INTERNATIONAL JOURNAL OF MULTIDISCIPLINARY EDUCATIONAL RESEARCH
ISSN : 2277-7881; IMPACT FACTOR – 4.527; IC VALUE:5.16; ISI VALUE:2.286 VOLUME 6, ISSUE 8(2), AUGUST 2017
growth target rate of 6 per cent was fixed by the Union Five year Plan. Though there is Government so as to achieve the overall growth rate of 4.1 per cent for Agriculture during the 12901.47marginal variation in growth rate of Organization (CSO), the values of GDP from fisheries sector at current price during 2009-10 was 52,363 crores which is 4.85
percent of the total GDP of Agriculture and allied sectors. Fisheries sector occupies a very important place in the socioeconomic development of the country. It has been recognized as a powerful income and employment generator as it stimulates growth of a number of subsidiary industries.
The challenge of sustainable production
1. The challenge now is to keep fish production on the rise to meet the increasing protein needs of a growing global population, while at the same time allowing overfished populations to recover and preventing other species joining the list of the overfished. It is a major challenge.
2. Nutritious food besides being a foreign exchange earner. Most importantly, it is the source of livelihood for a large section of economically backward population of the country.
3.The main challenges facing fisheries development in the country includes accurate data on assessment of fishery resources and their potential in terms of fish production, development of sustainable
technologies for fin and shell fish culture, yield optimization, harvest and postharvest operations.
Aquaculture production on a sustainable basis is:
1. Intensification of aquaculture in ponds and tanks. 2. Increase of the productivity of ponds and reservoirs. 3. Usage of derelict water bodies. 4. Construction of new ponds and tanks. 5. Introduction of culture based capture fisheries in reservoirs.
www.ijmer.in 234

INTERNATIONAL JOURNAL OF MULTIDISCIPLINARY EDUCATIONAL RESEARCH
ISSN : 2277-7881; IMPACT FACTOR – 4.527; IC VALUE:5.16; ISI VALUE:2.286 VOLUME 6, ISSUE 8(2), AUGUST 2017
6. Species diversification and introduction of high value
commercial species. 7. Development of breeding and farming technologies for new
indigenous species that have potential for farming and market demand.
PROBLEMS:
1. Lack of knowledge to farmers in aquaculture farming
2. Poor housing facilities.
3. Lack of markets information.
4. Lack of infrastructure facilities
Suggestions:
1. Tap the marine resources in the Exclusive Economic Zone (EEZ) and high seas in a sustainable manner.
2. Create adequate post harvest infrastructure. To treat aquaculture at par with agriculture. Establish schemes for processing of fish hygienically to produce consumer friendly fish/ fish products.
3. All organizations dealing with fish and fisheries should be brought under a single umbrella.
4. Enhance production and productivity of the existing water bodies by developing technologies for intensive culture, integrated aquaculture, brood bank development, creating new hatcheries, nurseries, feed mills, diagnostic laboratories.
5. To developed stainable aquaculture in rural areas.
Conclusion:
Aquaculture is the fastest growing food production sector for the last
decade, and there is significant potential for continued expansion and growth of aquaculture and culture-based fisheries. It has been proven
www.ijmer.in 235

INTERNATIONAL JOURNAL OF MULTIDISCIPLINARY EDUCATIONAL RESEARCH
ISSN : 2277-7881; IMPACT FACTOR – 4.527; IC VALUE:5.16; ISI VALUE:2.286 VOLUME 6, ISSUE 8(2), AUGUST 2017
that aquaculture and inland fisheries have played and will continue to play an important role in human nutrition and poverty alleviation in many rural areas through integrated aquaculture-agriculture farming systems and integrated utilization of small and medium-size water bodies. Aquaculture is also facing the challenge of sustainable
development. To reduce the environmental impacts of aquaculture development as well as avoid impacts on aquaculture caused by non-aquaculture activities, both a result of poor management, further efforts are needed to improve resources use and appropriate environmental management. . However, extensive and semi-intensive practices are likely to continue to be the most important for some time.
Reference: 1.
AQUACULTURE nptel.ac.in courses 120108002 module 6 lecure 16. Chapter 10 – Running a Fish Farm as a Business 172.
Dr. G. Rajeswari (2014). “Recent trends in Fisheries Technology Development in Andhra Pradesh of India”, STC Scholars Vision, Vol. No:3, Jan - Dec. 2014 Pg. Nos: 38 - 42, ISSN No: 2321 - 6425.
Dr. Mruthyunjaya Director, NCAP (2004). National Centre For Agricultural Economics And Policy Research New Delhi, India Penang, Strategies and Options for Increasing and Sustaining Fisheries and Aquaculture Production to Benefit Poor Households in India. .
Featured Articles Aquaculture Production 26 March 2007 ISSN 1020-5489 By Food and Agriculture Organization of the United Nations (FAO) and extracted from The State of World Fisheries and Aquaculture 2006
Radheyshyam (2001). "Community-Based Aquaculture in India Strengths, Weaknesses, Opportunities and Threats", Naga, the ICLARM Quarterly (Vol. 24, Nos. 1 & 2) January-June.
www.ijmer.in 236

INTERNATIONAL JOURNAL OF MULTIDISCIPLINARY EDUCATIONAL RESEARCH
ISSN : 2277-7881; IMPACT FACTOR – 4.527; IC VALUE:5.16; ISI VALUE:2.286 VOLUME 6, ISSUE 8(2), AUGUST 2017
BIO STATISTICAL VALUES, IMPORTANCE, THREATS AND CONSERVATION MEASURES OF FRESH AND BRACKISH
WATER WETLAND ICTHYIOFAUNAL DIVERSITY OF SRIKAKULAM DISTRICT, ANDHRAPRADESH, INDIA
*Dr. S. Mukunda Rao, R. Ramachandra Rao, Prof. B. Bharatha Lakshmi.
Department of Zoology, Andhra University, Visakhapatnam, Andhra Pradesh, India - 530003
E-mail: [email protected] ABSTRACT
India has a wealth of wetland ecosystems distributed in different
geographical regions India has a wealth of wetland ecosystems distributed in different geographical regions. Fishery sector is one of the ‘Engines of growth’. The results of the present investigation confirmed that the occurrences of total fifty six (56) species of fishes (46 Fresh water and 10 brackish water) were recorded. Forty six (46) species of fresh water fishes belonging to six orders and eighteen families recorded in commercial catches. The order Cypriniformes was dominant with 18 species followed by order Perciformes with 16 species, Siluriformes with 08 species, while the order Cyprinidontiformes were represanted by 02 Angulliformes were represented by 01 species and order Osteoglossiformes with 01 species. The loss of wetlands leads to environmental and ecological problems. Conservation measures and Awareness programmes should be taken for sustainable development of wetlands and aquaculture.
Key Words:
Statistical values, Wetland, Diversity, Aquaculture, Economic Classification, Checklist, Conservation, Srikakulam.
www.ijmer.in 237

INTERNATIONAL JOURNAL OF MULTIDISCIPLINARY EDUCATIONAL RESEARCH
ISSN : 2277-7881; IMPACT FACTOR – 4.527; IC VALUE:5.16; ISI VALUE:2.286 VOLUME 6, ISSUE 8(2), AUGUST 2017
INTRODUCTION
Wetlands are the ecotones or transitional zones between permanent aquatic and terrestrial ecosystems. The greatest diversity of life is found on the edges of interfaces of land and water. Wetlands are vital ecosystems that provide livelihood for the people who live in and around them. Aquaculture in India has a long history. India has 8,118 kilometers of marine coastline, 3,827 fishing villages, and 1,914 traditional fish landing centers. India's fresh water resources consist of
195,210 kilometers of rivers and canals, 2.9 million hectares of minor and major reservoirs, 2.4 million hectares of ponds and lakes, and about 0.8 million hectares of flood plain wetlands and water bodies of 2012, the marine and freshwater resources offered a combined sustainable catch fishing potential of over 4 million metric tons of fish. In addition, India's water and natural resources offer a tenfold growth potential in aquaculture (farm fishing) from 2010 harvest levels of 3.9 million metric tonnes of fish, if India were to adopt fishing knowledge, regulatory reforms, and sustainability policies adopted by China over the last two decades.
The marine fish harvested in India consist of about 65 commercially important species/groups. Pelagic and mid water species contributed about 52% of the total marine fish in 2012. India is a major supplier of fish in the world. In 2011 the country exported over 600,000 metric tonnes of fish, to some 90 countries, earning over $1.8 billion.
Shrimps are one of the major varieties exported. The giant tiger prawn (Penaeus monodon) is the dominant species chosen for aquaculture, followed by the Indian white prawn (Fenneropenaeus indicus). Shrimp production from coastal aquaculture during 2004 stood at approximately 120,000 tonnes. Farmed shrimp accounted for about 60% of shrimp exported from the country. Marine and freshwater catch fishing combined with aquaculture fish farming is a rapidly growing industry in India. In 2008 India was the sixth largest producer of
www.ijmer.in 238

INTERNATIONAL JOURNAL OF MULTIDISCIPLINARY EDUCATIONAL RESEARCH
ISSN : 2277-7881; IMPACT FACTOR – 4.527; IC VALUE:5.16; ISI VALUE:2.286 VOLUME 6, ISSUE 8(2), AUGUST 2017
marine and freshwater capture fisheries, and the second largest aquaculture farmed fish producer in the world.
STUDY AREA
Srikakulam District formerly known as Chicacole. The district Srikakulam is situated between 180 20! And 190, 10! N latitudes and 830 05! And 840 50! E longitudes, it is the north eastern most one in Andhra Pradesh state. The district can be distinctively divided, based on the terrain and geomorphology, into three zones namely i) the Hills,
ii) the Midland plains and iii) the Coastal plains. Most of the wetlands are seen in the coastal plains followed by the midland plains. The major rivers of the district, Nagavalli, Mahendratanaya and Vamsadhara drain into Bay of Bengal. As per 2011 census, the population of Srikakulam district is 25, 37,593; females 50.4% and males 49.6%. Inland fishing based on ‘Beela’s and tanks are a major source of income for the fishing communities. The traditional fishers, mostly migrants from Odisha, belonging to Scheduled Castes/Scheduled Tribes hold the fishing rights in these water bodies.
MATERIALS AND METHODS
The fishes were collected with the help of local fishermen by using different types of nets viz. hand nets, cast nets, stake nets, drag nets and gill nets. A Collection of catch and statistics based on regular surveys to make an assessment of the stock of the different species and the important varieties. Seasonal collections were made from January 2013 to February 2015 spanning over a period of two years.
The specimens brought to laboratory for the further studies like
their species identification. The species were ascertained on the basis of various morph metric characters and meristic counts following criteria given by (Jayaram 2002, Talwar and Jhingran 1991). Standard identification keys were used for identification of specimen’s up to species level (Das and Srivastava, 1956, Misra 1962, Dutta Munshi and
www.ijmer.in 239

INTERNATIONAL JOURNAL OF MULTIDISCIPLINARY EDUCATIONAL RESEARCH
ISSN : 2277-7881; IMPACT FACTOR – 4.527; IC VALUE:5.16; ISI VALUE:2.286 VOLUME 6, ISSUE 8(2), AUGUST 2017
Srivastva1968, Dutta and Malhotra 1984, Dutta etal., 1987, Jhingran 1982 and Nath 1986). The classification of fishes based on economic importance (Lagler, 1956).
RESULTS
Fishes are valuable source of high grade protein and they occupy a significant position in the socio-economic fabric by providing the population not only the nutritious food but also income and employment opportunities.
The results of the present investigation confirmed that the occurrences of total fifty six (56) species of fishes (46 Fresh water and 10 brackish water) were recorded. Forty six (46) species of fresh water fishes belonging to six orders and eighteen families recorded in commercial catches. The order Cypriniformes was dominant with 18 species followed by order Perciformes with 16 species, Siluriformes with 08 species, while the order Cyprinidontiformes were represanted by 02 Angulliformes were represented by 01 species and order Osteoglossiformes with 01 species. The commercial catches are represented by Carps, Catfishes, Eels, Perches, Murrels and rest of them belonging to miscellaneous category. Apart from carps, the tanks used to support a rich fishery of catfishes, perches, murrels, eels and miscellaneous groups of fish, with an estimated catch of over 7607 M. tons /year
Out of 46 fresh water species, 19 species are commercially
important, 08 species have fine food value and 14 species are classified as coarse food fishes as they form food for poor people of this region. 14 species are suitable for aquarium, while 02 species have importance in public health, as they are larvivorous and others are of medicinal value.
some euryhaline species of fish have established themselves in the major wetlands, since there is saline intrusion as tidal effect from tekkali and sompeta creeks Out of the 10 brackish water species of
www.ijmer.in 240
INTERNATIONAL JOURNAL OF MULTIDISCIPLINARY EDUCATIONAL RESEARCH
ISSN : 2277-7881; IMPACT FACTOR – 4.527; IC VALUE:5.16; ISI VALUE:2.286 VOLUME 6, ISSUE 8(2), AUGUST 2017
fishes belonging to (5) five orders and (9) nine families recorded in commercial catches. The order Perciformes was dominant with 6 species followed by remaining orders.
DISCUSSION
Discharge of pollutants, which are posing an environmental problem for the very existence of these wetlands. Extensive encroachments of these wetlands for intensive agriculture, using chemical fertilizers and pesticides. Few fish species are considered as
edible healing for diseases. Channus punctatus is used in the treatment of Asthmatic patients. Air breathing fishes Heteronuestos, Clarius and Anabas are known for their nutritive, invigorating and therapeutic qualities and recommended by Physicians as diet during convalescence.
Fish farms situated closer to the industrial effluents points are the worst affected. The parasites are opportunists and take a firm hold on impoverished fish. External symptoms, (gill rot, fin rot, descaling, opercular rot, skin rot, bulged abdomen, etc.) fungal, bacterial infested fish are a common sight in these tanks. Fish diseases have given rise to
heavy fish mortalities observed in fish tanks.
The water of these wetlands maintains ideal ecological conditions suitable for fish production. The Temperature 320, Dissolved oxygen 5-7 ppm, PH 7.5-8.5, Turbidity 25-40 cm, and nutrients (rich) appear to be ideal for pisciculture. Hence Schemes were formulated to construct fish tanks along the wetlands. Each tank is given to a Fishermen Cooperative Societies. There are 127 such societies with a membership of 22,525 People in the district.
The conditions with regard to pesticides accumulation in the major wetland waters are quite serious and not only uninhabitable to fish, but also toxic for long stretches in the neighbourhood of effluent points. Agriculture runoff directly enters the area. The possible effects of aquaculture chemicals on the quality of water and fish have the
www.ijmer.in 241

INTERNATIONAL JOURNAL OF MULTIDISCIPLINARY EDUCATIONAL RESEARCH
ISSN : 2277-7881; IMPACT FACTOR – 4.527; IC VALUE:5.16; ISI VALUE:2.286 VOLUME 6, ISSUE 8(2), AUGUST 2017
effects on those who consume contaminated fish with pesticides i.e humans and birds. Pesticides in water and from fish farms produce various effects on fish such as chronic changes in behaviour and morphological and physiological changes. The hygienic viewpoint the pesticide levels of fish from fish farms were higher. Fishes contaminated with pesticides may not be consumed as food. The input
of chemicals such as pesticides in intensive agriculture may cause the accumulation of pesticides in fish tissues from fish farms. It is dangerous for the human beings who consume them without fear by eating pesticide contaminated fish. These need to be accelerated by regular monitoring of water quality with regard to pesticides and their accumulation in fish muscle.
www.ijmer.in 242
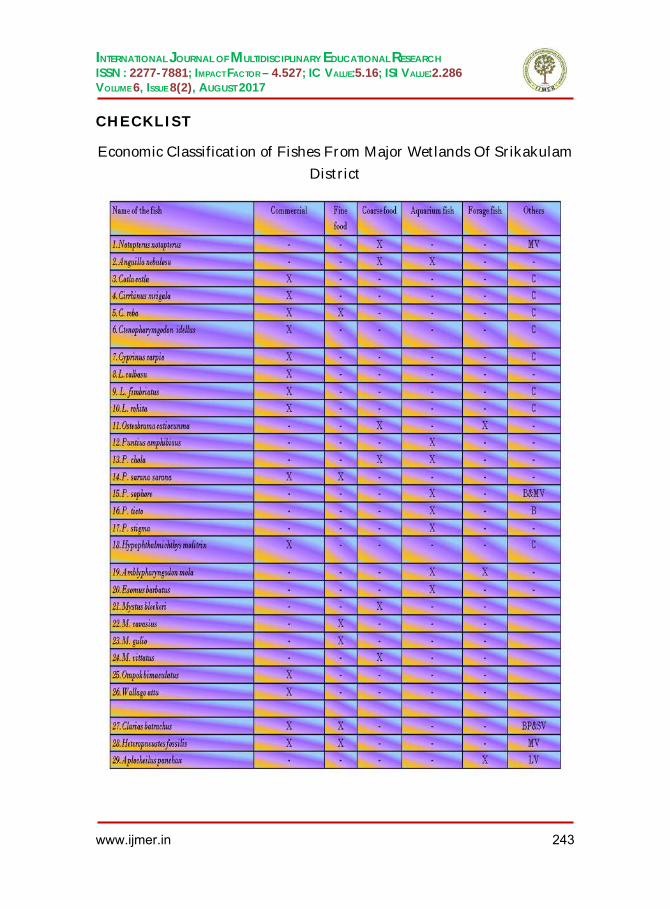
INTERNATIONAL JOURNAL OF MULTIDISCIPLINARY EDUCATIONAL RESEARCH
ISSN : 2277-7881; IMPACT FACTOR – 4.527; IC VALUE:5.16; ISI VALUE:2.286 VOLUME 6, ISSUE 8(2), AUGUST 2017
CHECKLIST
Economic Classification of Fishes From Major Wetlands Of Srikakulam District
www.ijmer.in 243
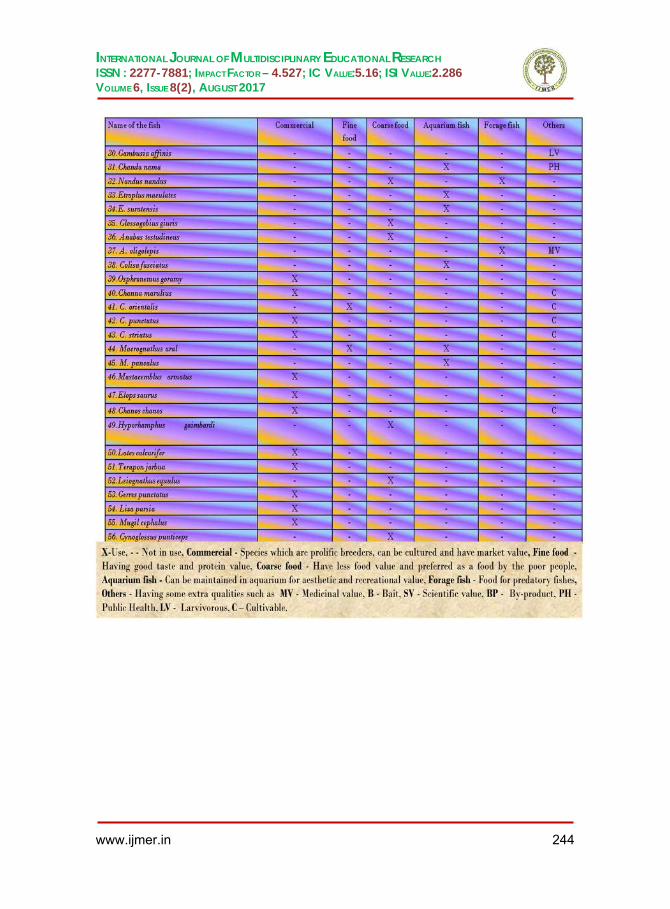
INTERNATIONAL JOURNAL OF MULTIDISCIPLINARY EDUCATIONAL RESEARCH
ISSN : 2277-7881; IMPACT FACTOR – 4.527; IC VALUE:5.16; ISI VALUE:2.286 VOLUME 6, ISSUE 8(2), AUGUST 2017
www.ijmer.in 244

INTERNATIONAL JOURNAL OF MULTIDISCIPLINARY EDUCATIONAL RESEARCH
ISSN : 2277-7881; IMPACT FACTOR – 4.527; IC VALUE:5.16; ISI VALUE:2.286 VOLUME 6, ISSUE 8(2), AUGUST 2017
Table.1: ORDER WISE ICHTHYOFAUNAL DIVERSITY RECORDED
FROM STUDY AREA.
Orders Families Sub families Genus Species Angulliformes * 1 0 1 1 Cypriniformes * 1 3 10 18 Osteoglssiformes 1 0 1 1 Cyprinodontiformes 2 0 2 2 Siluriformes 4 0 5 8 Percifromes 9 2 10 16 Total 18 5 29 46
Figure.1: ORDER WISE NUMBER OF ITCHYO FAUNAL
DIVERSITY FROM STUDY AREA
Table.2: ORDER WISE BRAKISH WATER ICHTHYO FAUNAL
DIVERSITY FROM STUDY AREA.
Orders Families Sub families Genus Species Osteoglssiformes 1 0 1 1 Gonorhynchiformes 1 0 1 1 Cyprinodontiformes 1 0 1 1 Percifromes 5 0 6 6 Pluronectiformes 1 0 1 1 Total 9 0 10 10
05
101520
1 1 1 2 4 9
0 3
0 0 0 2 1
10
1 2 5
10
1
18
1 2
8
16
No
of fa
m,s
.fam
,gen
,sps
orders
Families
Subfamilies
www.ijmer.in 245
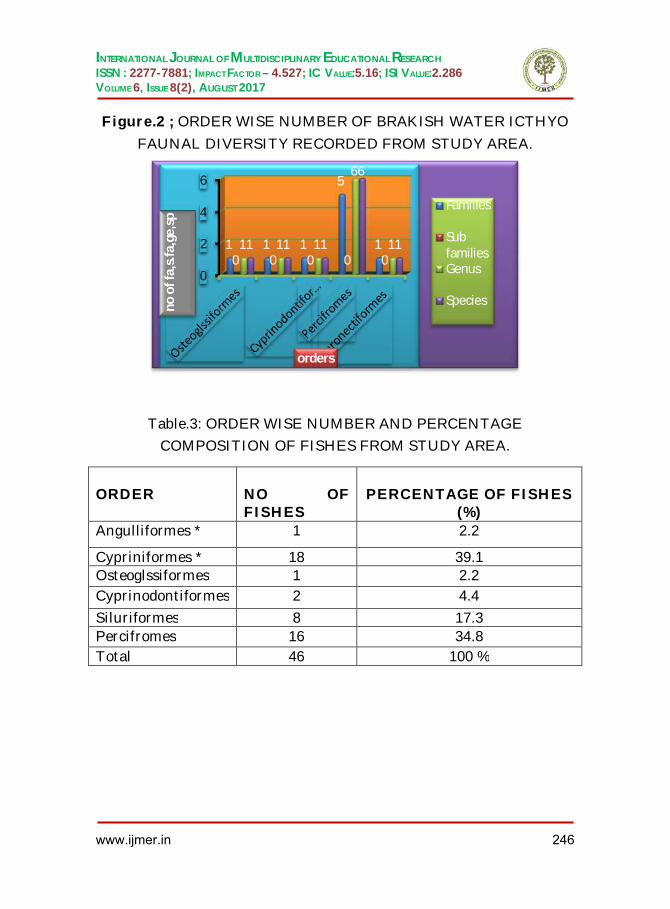
INTERNATIONAL JOURNAL OF MULTIDISCIPLINARY EDUCATIONAL RESEARCH
ISSN : 2277-7881; IMPACT FACTOR – 4.527; IC VALUE:5.16; ISI VALUE:2.286 VOLUME 6, ISSUE 8(2), AUGUST 2017
Figure.2 ; ORDER WISE NUMBER OF BRAKISH WATER ICTHYO
FAUNAL DIVERSITY RECORDED FROM STUDY AREA.
Table.3: ORDER WISE NUMBER AND PERCENTAGE COMPOSITION OF FISHES FROM STUDY AREA.
ORDER
NO OF FISHES
PERCENTAGE OF FISHES
(%) Angulliformes * 1 2.2
Cypriniformes * 18 39.1 Osteoglssiformes 1 2.2 Cyprinodontiformes 2 4.4 Siluriformes 8 17.3 Percifromes 16 34.8 Total 46 100 %
0
2
4
6
1 1 1
5
1 0 0 0 0 0
1 1 1
6
1 1 1 1
6
1
no o
f fa,
s.fa
,ge,
sp
orders
Families
SubfamiliesGenus
Species
www.ijmer.in 246
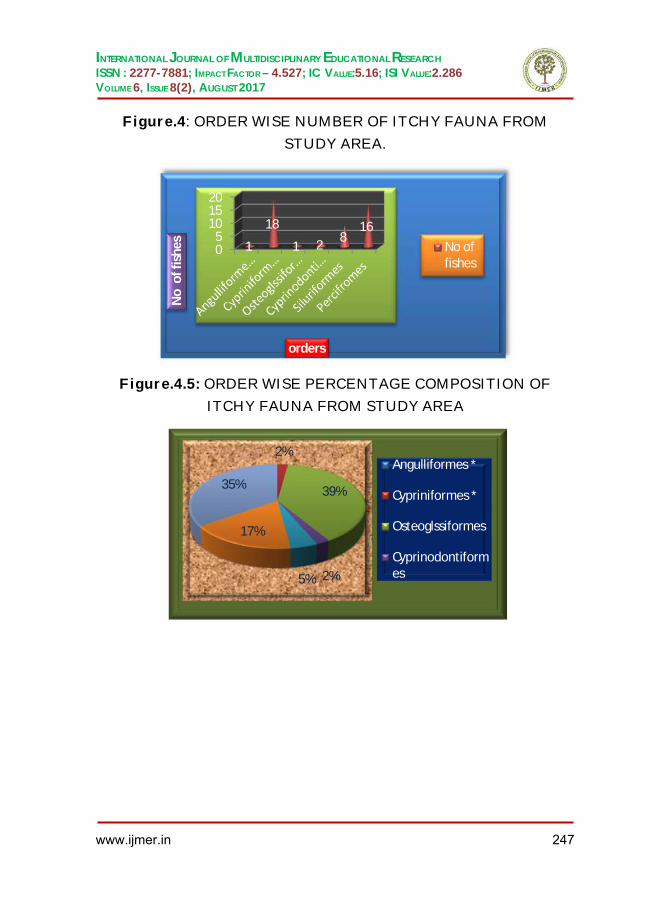
INTERNATIONAL JOURNAL OF MULTIDISCIPLINARY EDUCATIONAL RESEARCH
ISSN : 2277-7881; IMPACT FACTOR – 4.527; IC VALUE:5.16; ISI VALUE:2.286 VOLUME 6, ISSUE 8(2), AUGUST 2017
Figure.4: ORDER WISE NUMBER OF ITCHY FAUNA FROM
STUDY AREA.
Figure.4.5: ORDER WISE PERCENTAGE COMPOSITION OF
ITCHY FAUNA FROM STUDY AREA
05
101520
1
18
1 2 8 16
No
of f
ishe
s
orders
No offishes
2%
39%
2% 5%
17%
35% Angulliformes *
Cypriniformes *
Osteoglssiformes
Cyprinodontiformes
www.ijmer.in 247

INTERNATIONAL JOURNAL OF MULTIDISCIPLINARY EDUCATIONAL RESEARCH
ISSN : 2277-7881; IMPACT FACTOR – 4.527; IC VALUE:5.16; ISI VALUE:2.286 VOLUME 6, ISSUE 8(2), AUGUST 2017
Table.4.7: ORDER WISE NUMBER AND PERCENTAGE
COMPOSITION OF BRACKISH WATER FISHES FROM STUDY AREA
Orders No of fishes Percentage (%) Osteoglssiformes 1 10 Gonorhynchiformes 1 10 Cyprinodontiformes 1 10 Percifromes 6 60 Pluronectiformes 1 10 Total 10 100 %
Figure.4.6: ORDER WISE NUMBER OF BRAKISH WATER FISHES
FROM STUDY AREA.
0123456
1 1 1
6
1
No
of fi
shes
orders
No of fishes
www.ijmer.in 248

INTERNATIONAL JOURNAL OF MULTIDISCIPLINARY EDUCATIONAL RESEARCH
ISSN : 2277-7881; IMPACT FACTOR – 4.527; IC VALUE:5.16; ISI VALUE:2.286 VOLUME 6, ISSUE 8(2), AUGUST 2017
Figure.4.7: ORDER WISE PERCENTAGE COMPOSITION OF
BRAKISH WATER FISHES ROM STUDY AREA
THREATS & CONSERVATION METHODS
The wetlands of Srikakulam has been faced the anthropogenic pressures and has undergone tremendous ecological changes. These wetlands are facing multidimensional threats and are under pressure from pollution, eutrophication and agricultural encroachments. The plethora of factors contributing to the decline in habitat quality and species population has been growing in the past few decades.
An Ichthyo faunal diversity loss occurs in the major wetland
system through land use changes, habitat destruction, exploitation of resources and invasive species. Vulnerable, threatened, and endangered species of waterfowl, fresh-water dependent mammals, fresh water fish, fresh water amphibians, fresh water turtles and other species are threatened.
10% 10%
10%
60%
10% OsteoglssiformesGonorhynchiformesCyprinodontiformesPercifromesPluronectiformes
www.ijmer.in 249

INTERNATIONAL JOURNAL OF MULTIDISCIPLINARY EDUCATIONAL RESEARCH
ISSN : 2277-7881; IMPACT FACTOR – 4.527; IC VALUE:5.16; ISI VALUE:2.286 VOLUME 6, ISSUE 8(2), AUGUST 2017
Threats include even contribution to climate change, point and
non-point pollution, and air and water quality due to destructive wetland practices.
People living near wetlands whose livelihood on the services are directly harmed by their degradation. Conservation of water bodies of these wetland areas helps in maintaining the freshwater Ichthyo faunal
diversity and production to some extent. It is an important factor for sustaining of fisheries and their interconnected role in the food chain where waterfowl depend upon.
Discouragement of monoculture introduction.
Restriction on introduction of exotic species without
adequate investigations.
Water resource management:
Planning, Managing and Monitoring
Coordinated Approach
Building Awareness
Traditional aquaculture is a potential means to increase
production, Commercial fishing by adopting modern management strategies and marketing would strengthen fisheries sector. The traditional fishing is economically more remunerative to the major wetlands dependant people in Srikakulam district, will help to boost the revenue and to improve the quality of life. To augment the population of local fish species, fish fingerlings were released. This has also helped in the enhancement of employment potential of the local fishermen.
REFERENCES
Chandrasekhar S.V.A (2004). Fish fauna of Hyderabad and its environs, Zoos’ Print Journal, 19(7), 1530-1533
www.ijmer.in 250

INTERNATIONAL JOURNAL OF MULTIDISCIPLINARY EDUCATIONAL RESEARCH
ISSN : 2277-7881; IMPACT FACTOR – 4.527; IC VALUE:5.16; ISI VALUE:2.286 VOLUME 6, ISSUE 8(2), AUGUST 2017
Devi K.R. and Indra T.J (2012). Check list of the native freshwater
fishes of India, Zoological Survey of India, http://zsi.go v.in/che ck_list.html
https://www.google.co.in/?gws_rd=ssl
Jadhav B.V., Kharat S.S., Raut R.N., Paingankar M. and Dahanukar N (2011). Freshwater fish fauna of Koyana River, northern Western Ghats, India, Journal of Threatened Taxa 3(1), 1449-1455.
Jayaram K.C (1999). The freshwater Fishes of the Indian region, Narendra Publication New Delhi, India, 55.
Jayaram, K.C (1981). The Freshwater Fishes of India, Pakistan, Bangladesh, Burma and Sri Lanka-A Hand Book, Director, Zoological Survey of India, Kolkata.
Johnson J.A., Ravi Parmar K. Ramesh, Subharanjansen & Sreenvasa (2012). Fish diversity and assemblage structure in Ken River of Panna landscape, Central India, Journal of Threatened Taxa, 4(13), 3161-3172.
Kumar Niraj and Singh N.P (2013). Studies on the Ichthyofauna of Kararia Lake of Motihari, East-Champaran, Bihar, India, Res. J. Animal, Veterinary and Fishery Sci., 1(4), 8-12.
Menon A.G.K (1999). Check list - freshwater fishes of India, Records of the Zoological Survey of India, Occasional, 175, 366.
Nyanti L., Fish fauna of Sayap-Kinabalu Park, Sabah. In. I. Ghazally and D. Laily (Eds) (1995). A scientific journey through Borneo: Sayap-Kinabalu Park, Sabah (189-199), Kuala Lumpur: Pelanduk Publication.
Prabahar C. and Senthil Murgan A (2012). Fish Diversity In Relation to physico-chemical characteristics of Kamala Basin of Darbhanga District, Bihar, India, International Journal of Pharmaceutical & Biological Archives, 3(1), 211-217.
Rahimullah M (1943). Fish Survey of Hyderabad State, Part-II. Fishes of Hyderabad city and its suburbs, Journal of the Bombay Natural History Society, 44 (1&2), 88-95.
www.ijmer.in 251
INTERNATIONAL JOURNAL OF MULTIDISCIPLINARY EDUCATIONAL RESEARCH
ISSN : 2277-7881; IMPACT FACTOR – 4.527; IC VALUE:5.16; ISI VALUE:2.286 VOLUME 6, ISSUE 8(2), AUGUST 2017
Rao C.AN., J. Deepa and M. Hakeeel (2011). Comparative account on
icthyofauna of Pocharam and Wyra lakes of Andhra Pradesh, India, Journal of Threatened Taxa, 3(2), 1564- 1566.
Rao M. and Reddy Y.S (1984). Fish fanua of Hussainsagar, Hyderaba, Jantu, 2, 1-16.
www.ijmer.in 252