Embed Size (px)
Citation preview

PV POWER PLANT TECHNOLOGY AND BUSINESSVolume 13 December 2017
Next-generation invertersTechnology, architecture, certifi cation – special report, p.18
Plant performance The technical
challenges of
solar O&M in the
Middle East, p.67
Market WatchTackling
India’s solar-
fuelled grid
logjam, p.32
Storage & Smart PowerHow storage can
save millions
on new T&D
infrastructure, p.84
Design & BuildChallenging the
myths over BIPV
aff ordability, p.54


regulars
3 www.pv-tech.org | December 2017 |
Welcome to Volume 13 of PV Tech Power, unlucky for some perhaps, but we’re confident this issue has a stellar line-up owing nothing to good luck.
As always we’ve put a lot of time into identifying topics that offer real value to you and that delve deeper into the nuts and bolts (literally in some cases) of the solar deployment business.
While module and cell technology draw a lot of attention, inverters are often overlooked. To begin the process of addressing this imbalance we have compiled a three-part inverter special report. Fraunhofer ISE examines the emerging trends in inverter technology (p.18). Sungrow assesses the prospects of 1,500V(DC) architecture and, crucially, what comes next (p.22). Finally, certification body UL acknowledges the rise of smart inverters and presents a roadmap to ensure testing processes keep pace (p.27).
The Middle East has begun delivering meaningful volumes of MWs and is transitioning from hype to delivery. Jordan-based O&M provider MASE lifts the lid on the real-world challenges presented by regional projects and how to address them, including some novel solutions to preventing inverter failure in high temperatures (p.67). We also speak to Sterling & Wilson, the EPC contractor on Abu Dhabi’s 1.2GW Sweihan project to
learn how it is maximising the LCOE to deliver on a headline grabbing tariff rate (p.72).
First Solar offers some insight to its recycling procedures and how these impact on a project’s lifecycle costs.
Liam Stoker reports from the site of the UK’s first unsubsidised, large-scale solar plant. The 10MW development is co-located with storage as part of the effort to make the economics stack-up (p.64).
Speaking of energy storage, our Storage and Smart Power section, developed in partnership with our colleagues at Energy-Storage.News, offers a superb array of must-read material.
Navigant’s Alex Eller explores how energy storage can replace traditional grid infrastructure (p.84) and we have a pair of papers providing alternative views on the role of blockchain in a modern power grid.
Clean power investor Jigar Shah speaks with Andy Colthorpe on life at the leading edge of clean energy finance, not to be missed (p.92).
The team will be at the World Future Energy Summit in Abu Dhabi in January as well as at our own European solar finance event in London (30-31 January, 2018). We look forward to seeing you there.
John ParnellHead of content
Introduction
Brands of Solar Media:
Cover illustration by Adrian Cartwright, Planet illustration
Published bySolar Media Ltd.3rd Floor, America House, 2 America Square, London, EC3N 2LU, UKTel: +44 (0) 207 871 0122www.pv-tech.org
PublisherDavid Owen
EditorialHead of content:John Parnell
Managing editor:Ben Willis
Senior news editor:Mark Osborne
Reporters:Andy Colthorpe, Tom Kenning, Liam Stoker
Design & productionDesign and production manager:Sarah-Jane Lee
Production:Daniel Brown
AdvertisingSales director:David Evans
Account managers: Graham Davie, Lili Zhu, Oliver Amos, Will Swan
Printed by Buxton Press Ltd., Derbyshire
PV Tech Power Volume 13, 2017ISSN: 2057-438X
While every effort has been made to ensure the accuracy of the contents of this supple-ment, the publisher will accept no respon-sibility for any errors, or opinion expressed, or omissions, or for any loss or damage, consequential or otherwise, suffered as a result of any material here published.
The entire contents of this publication are pro-tected by copyright, full details of which are available from the publisher. All rights reserved. No part of this publication may be reproduced, stored in a retrieval system or transmitted in any form or by any means – electronic, me-chanical, photocopying, recording or otherwise – without the prior permission of the copyright owner.

regulars
4 | December 2017 | www.pv-tech.org
Contents
08-12 NewsRound-up of the biggest stories in PV from around the world.
18-29 cover storySpecial report: Next-generation inverters
18-21 Technical trends in next-generation solar inverters By Stephan Liese, Fraunhofer ISE
22-26 1,500V and beyond – where next for inverter technology? By Geng Tian, Sungrow North America
27-29 Advanced testing for smart inverters By Tim Zgonena, UL
30-38 Market watch30-33 India’s ‘head in the sand’ over solar grid integration
challenges Tackling India’s solar-fuelled grid bottleneck
34-35 Delivering on record low PPAs How Abu Dhabi’s price-busting Sweihan project is keeping costs down
36-38 Land, bankability and regulation - Southeast Asia’s solar snags The challenges of shifting to a post-subsidy market
40-53 Financial, legal, professional40-46 Technical Briefing Towards standardisation in PV
plant reporting By Christos Monokroussos, Matthias Heinze, K. Dixon Wright and Mark Skidmore, TÜV Rheinland
47-50 Technical Briefing Life cycle management and recycling of PV systems By Parikhit Sinha, Sukhwant Raju, Karen Drozdiak and Andreas Wade, First Solar
51-53 Legal Briefing The legal pitfalls of PV acquisitions By Arturo Sferruzza and Ginevra Biadico, Norton Rose Fulbright
13
18
30
36


regulars
6 | December 2017 | www.pv-tech.org
54-58 Design & build54-58 Technical Briefing Analysing BIPV affordability
By Laura Maturi and Jennifer Adami, Institute for Renewable Energy of Eurac Research
59-66 system integration59-61 Technical Briefing Understanding PV bypass
diode faults, testing and scope for test developmentBy Vivek Gade and Narendra Shiradkar, PVQAT Task Group 4
64-66 Project Briefing Storage the game-changer in UK’s first subsidy-free utility-scale solar plantBy Liam Stoker
67-80 Plant performance67-71 Technical Briefing Solar O&M in the Middle East:
technical challenges and solutionsBy Tareq Khalifeh, Ady Almadanat, Omar Baker and Haya Shahatit, MASE
72-77 Technical Briefing Determining soiling losses on PV modules in a desert climateBy David Daßler, Stephanie Malik and Akshayaa Pandiyan, Fraunhofer CSP
78-80 Cyber security: how prepared is the PV industry?Keeping the hackers at bay
84-93 storage & Smart Power84-88 Distributed energy technologies challenge
conventional thinking around grid planningEnergy storage as an alternative to new grid infrastructure
89-90 Look beyond the hype: to really disrupt the energy world, we need a Yin to blockchain’s YangHow blockchain can fulfill its potential as an energy system game changer
91 Blockchain in action: stabilising the grid in Germany and the NetherlandsUsing blockhain to balance the network
92-93 Life at the frontier of green investmentJigar Shah on the freedom to invest the most promising clean technologies
Regulars03 Introduction
13 Products
94 Advertisers index
64
78
84
22

www.tuv.com/solar
® T
ÜV,
TU
EV
an
d T
UV
are
reg
iste
red
tra
dem
arks
. Uti
lisat
ion
an
d a
pp
licat
ion
req
uir
es p
rio
r ap
pro
val.
Lite
ratu
re C
od
e: P
.00A
D01
6en
BO
1705
1.0.
Because there is more than
meets the eye.
Independent PV Supply Chain Management.
Why PV Supply Chain Management Services?Mitigate and manage risks throughout the entire supply chain for you and your investors, while ensuring that PV modules and inverters perform as contractually stipulated. Independent
suppliers, conducting in-line and pre-shipment inspections and verifying power-output pre- and post- shipment, are key to your success and enhance the attractiveness of your PV power plant projects for lenders and investors.
Why TÜV Rheinland? With more than 35 years of expertise in Photovoltaics, we are your partner to provide you all-round risk management solutions throughout the entire supply chain. We offer sound
in hand with our independent engineering services. Take
and PV experts. Make your PV project a success with TÜV Rheinland.

NEWS | from PV-Tech.org
8 | December 2017 | www.pv-tech.org
Europe
Hive Energy, Wirsol confirm plans for ‘pioneering’ 350MW
solar farm in the UK
Not to be outdone, developer Hive Energy submitted planning
documents for a 350MW plant in the UK that would be built without
subsidy. Hive has partnered with EPC firm Wirsol, and the duo has
formed the SPV Cleve Hill Solar Park Ltd to advance the project.
Should the project complete, Cleve Hill will be almost five times the
size of the UK’s current largest solar farm; the 70MW DTTC Lyneham
array completed in 2015. It will be located between the Kent towns
of Faversham and Whitstable in the south of the country. The project,
dubbed Cleve Hill Solar Park, will also be designed differently to
standard solar farms in the UK to provide the maximum amount of
electricity. Panels are to be orientated in an east-to-west fashion,
rather than south-facing, and will also be mounted at a shallower
angle than usual to produce a more consistent generation curve.
Battery storage will also be incorporated into the design to provide
grid balancing services.
The Netherlands
Capital Stage acquires two planned solar parks in the
Netherlands
Independent European PV power plant operator Capital Stage has
entered the Netherlands market for the first time with the acquisi-
tion of two solar parks that are expected to be completed in 2018.
Recently, GTM Research reported that the Netherlands has seen
strong annual growth since 2011, primarily from the residential
rooftop market, driven by the ‘Stimulation of Sustainable Generation’
scheme in the country, and would for the first time become a 1GW
market in 2018. Capital Stage said that the two solar parks Melissant
(10MW) and Ooltgensplaat (37.6MW) will provide a total generation
capacity of 47.6MW with an investment of €44.5 million. The projects
are expected to be completed and be grid connected in October
2018.
First Solar to provide 19MW in PV modules for two
projects in Netherlands
First Solar will provide its thin-film PV modules to help power two
utility-scale PV power plants in the Netherlands, with both installa-
tions developed by Denmark’s Obton. The company broke ground
on the first project, a 13.92MW installation, in November, while the
other 4.4MW project is expected to come online in mid-2018. Both
installations are located in Stadskanaal and have secured licenses
under the country’s SDE+ renewable energy programme.
Supply deals
SunPower to supply 291MW in second round of CRE4
French tenders
SunPower announced that it will supply 291MW of its solar panels
to projects awarded under the second round of France’s CRE
tender process. These projects include ground mount, carport and
rooftop projects in continental France, along with storage and
self-consumption in the country’s ZNI (non-interconnected zones).
Peter Aschenbrenner, SunPower executive vice president, said:
“With these awards, the total capacity of SunPower solar panels
supplied to ground, carport and rooftop, and ZNI projects awarded
in this year’s first and second round tender process is 505MW, more
than any other solar panel brand. “SunPower solar panels deliver
cost-competitive power and proven long-term reliability, and we
are proud to play a significant role in serving France’s goals for clean,
renewable solar power.”
JinkoSolar was panel supplier to Armenia’s first utility-
scale PV power plant
Leading ‘Silicon Module Super League’ (SMSL) member JinkoSolar
has supplied 3,700 ‘Eagle’ multicrystalline modules to the first
1MW utility-scale PV power plant in Armenia. JinkoSolar said that
the opening ceremony took place in November in the city of Talin
in collaboration with Staubli, Enerparc and Sungrow and project
developer, Arpi Solar. The plant has a PPA for 25 years. In mid-2017,
the Armenia Ministry of Energy Infrastructure and Natural Resources
announced that it has pre-qualified 10 companies for a 55MW solar
tender.
americasCompanies
First Solar produces first Series 6 model
First Solar reported strong results, a new manufacturing plant in
Vietnam and confirmed that the first Series 6 module had been
produced. The company realigned its manufacturing strategy to
accelerate its focus on the larger format Series 6 panels, which it
claims will reduce installed costs per W. Major orders for Series 6,
nudging 800MW, were also announced in December.
WElink claimed PV’s general competiveness in the country and ability of it and its
EPC partner to optimise costs were the key enablers for the unsubsidised plant.
Post-subsidy
WElink starts constructing ‘largest unsubsidised’ solar project in Europe
WElink Energy has started construction of a 221MW solar PV plant in Portugal that will not
benefit from subsidies. The Solara4 project, located in Vaqueiros, southern Portugal will
be the largest unsubsidised solar PV plant in Europe, the company claimed. The project
is of major significance to the European industry given the widespread winding down of
subsidies over recent years. Only 15 months ago, Portugal’s renewables association had
said solar cannot work without financial support in the market conditions of that time. The
new 221MW project will generate power for the equivalent of 150,000 homes. WElink’s
long-standing partner China Triumph International Engineering Co. Ltd (CTIEC) was
signed up as EPC contractor earlier this year. At the time of the signing, WElink had said
construction was expected to start in Q1 this year, so there has been some delay. WElink
claimed that it will be able to deliver the project without subsidies due to the increasing
competitiveness of PV generation and the two firms’ ability to optimise costs. The southern
location in Portugal also boasts excellent irradiation levels. Solara4 will include 850,000
solar modules and is expected to employ around 300 people during construction. The
project is expected to be grid-connected by mid-2019.
Cre
dit:
WEl
ink

Join the world‘s leading exhibition series for the solar industry
AUGUST 28–30, 2018, SÃO PAULO, BRAZIL SOUTH AMERICA’S LARGEST EXHIBITIONAND CONFERENCE FOR THE SOLAR INDUSTRY www.intersolar.net.br
DECEMBER 11–13, 2018, MUMBAI, INDIAINDIA‘S LARGEST EXHIBITION AND CONFERENCE FOR THE SOLAR INDUSTRY www.intersolar.in
JUNE 20–22, 2018, MUNICH, GERMANYTHE WORLD’S LEADINGEXHIBITION FOR THE SOLAR INDUSTRY www.intersolar.de
SUMMITINTERSOLAR SUMMIT USAAPRIL 4, 2018, NEW YORK www.intersolar-summit.com
JULY 10–12, 2018, SAN FRANCISCO, USANORTH AMERICA’S PREMIER EXHIBITION AND CONFERENCE FOR THE SOLAR INDUSTRY www.intersolar.us
FOLLOW US

NEWS | from PV-Tech.org
10 | December 2017 | www.pv-tech.org
will receive US$8 million for construction from Enel which expects
the project to be completed by June 2018. The project is estimated
to produce 12GWh annually, covering 9.8 hectares and containing
around 21,600 solar panels.
South America
Celsia makes pact with indigenous peoples over 100MW
Colombia solar project
Celsia, the energy arm of Colombian conglomerate Grupo Argos,
has moved forward with its development of a 100MW solar farm in
Colombia by reaching an agreement with the indigenous people
of the Sierra Nevada de Santa Marta in the Andes mountains. The
Valledupar farm, to be spread across 197 hectares in the village of
La Mesa, will be able to generate 187GWh of electricity each year, to
power the equivalent of 105,000 homes. It is now expected to start
operations in the first half of 2019.
EDF, Canadian Solar commission 284MW PV pipeline in
Brazil
Canadian Solar and renewable energy company EDF Energies
Nouvelles have commissioned the 191.5MW Pirapora I and the
92.5MW Pirapora III solar energy projects in Brazil, with the two
projects boasting a combined generation capacity of 284MW. Both
sites were commissioned in November 2017. The Pirapora I and III
solar projects, located in the Brazilian state of Minas Gerais, were each
awarded a 20-year power purchase agreement following the second
and first Reserve Energy Auctions, respectively. The two projects,
powered by 600,000 solar panels and 290,000 Canadian Solar
modules, will generate 392 GWh and 186 GWh of clean, renewable
energy.
middle east & africaUnique Plants
Jordan connects 12.9MW PV project in refugee camp
Jordan has officially switched on the largest PV project ever to be
developed in a refugee camp, with the 12.9MW project set to provide
renewable energy to nearly 80,000 Syrians. The PV project was devel-
oped at the Zaatari refugee camp on the border of Jordan and Syria,
with the power generated at the installation allowing families to run a
fridge, TV, fans and lights in their shelters. The US$17.5 million project,
which was funded by the German government, will provide electricity
in the Zaatari camp for up to 14 hours a day.
Dubai utility awards floating solar contract
Etihad Esco is set to develop and install floating solar PV systems
after being awarded a contract by Dubai Electricity Water Author-
ity (DEWA). Ali Al Jassim, CEO of Etihad Esco, said: “The installation
of solar PV systems at DEWA water reservoirs comes under the
implementation of the vision of the Vice President, Prime Minister
and Ruler of Dubai, HH Sheikh Mohammed bin Rashid Al Maktoum,
to transform Dubai into one of the most sustainable cities in the
world.” Esco said the installation of systems on DEWA’s water reservoir
will add to Dubai’s solar power energy mix and reduce the emirate’s
carbon footprint.
Politics and finance
IFC-led consortium finalises ‘largest private sector financ-
ing package’ for solar in MENA region
The International Finance Corporation (IFC) has finalised a US$653
Tesla loses solar crown
Tesla reported a 38% decline in solar system installations in the
third quarter of 2017, compared to the previous quarter, its weakest
installation figures since the acquisition of SolarCity in 2016. Tesla
said it deployed 109MW of energy generation systems in the third
quarter, down from 176MW in the second quarter and 170MW in the
prior year period. The company is losing major market share in the
process, with GTM Research reporting that Sunrun was set to eclipse
Tesla/SolarCity as the top residential solar provider.
Central America and Caribbean
World Bank approves US$35 million for renewables and
energy access in Haiti
The World Bank has approved two grants of US$35 million in total to
improve access to electricity for more than two million Haitians, and
to scale-up investments in renewable energy. The bank noted that
more than five million people could be reached through solar PV,
adding that only one in three Haitians has access to electricity and
access is limited in rural areas. Anabela Abreu, World Bank’s country
director for Haiti, said: “Haiti has significant untapped sources of
renewable energy. The country is taking an important step in creat-
ing the enabling environment for private investors and in boosting
access to electricity.
Enel begins 8MW solar PV plant for Nestle in Panama
Construction is underway on an 8MW solar PV plant in Panama by
Enel Green Power (EGP) for Swiss company Nestle. Project Estrella
Trump will make the final decision by the end of January.
Section 201
US trade case handed over to President Trump
The US International Trade Commission (ITC) recommended duties and quotas in the
section 201 case that fall some way short of those requested by the petitioners. None of the
four commissioners recommended absolute value tariffs, instead opting for percentages
over a set value. None of the four commissioners exceeded 35% with most at or below
30%. The suggestions will be passed to the White House with President Trump making the
final ruling before the end of January. In late September, the petitioners in the case, Suniva
and Solarworld Americas, lowered their requested remedies. Suniva lowered its floorprice
from US$0.78 for modules with foreign cells to US$0.74. SolarWorld suggested a quota of
0.22GW for cells and 5.7GW for modules in 2018 instead of a floor price. Both insisted any
remedy must include a tariff with a rate of US$0.25/W for cells and US$0.32/W for modules
and protested that the proposed rates were too lenient. According to ROTH Capital, a 30%
tariff would mean c-Si module ASP of around US$0.49/W. In a follow-up investor note,
ROTH Capital said that further industry checks suggested a post-tariff c-Si module ASP of
US$0.42/W.
Cre
dit:
Flic
kr/W
hite
Ho
use

NEWS
Zimbabwe utility plans first 300MW of solar
Zimbabwe state-owned power company Zimbabwe Power
Company (ZPC) has applied to develop three solar PV plants with
the Zimbabwe Energy Regulatory Authority (ZERA). This is the firm’s
first foray into solar energy. The three 100MW projects would be
based at Gwanda, Munyati and Insukamini, and are expected to
take two years to construct at an estimated cost of US$570 million.
Feasibility studies have been carried out and EPC contracts signed.
The company now awaits approval of its application from ZERA.
However, Robert Mugabe’s “resignation” after 37 years in power
has created both political uncertainty and new possibilities for
Zimbabwe’s solar market. Solar has begun to emerge in Zimbabwe,
but remains undeveloped due to the political uncertainty of recent
years.
Big plants
Huge Iranian projects in the pipeline
Norwegian firm Saga Energy has signed a preliminary agreement
with Iranian state-run firm Amin Energy Developers to build solar
plants requiring investment of €2.5 billion investment (US$2.9
billion) in Iran. The plans for 2GW of PV capacity are still reliant on
finalising guarantees from Iran’s capital Tehran in order to proceed.
Meanwhile, Quercus will build a 600MW solar plant in Iran as part of
an agreement with the country’s energy ministry. Quercus will take a
lead on development and operation of the plant, which will be built
at a rate of 100MW every six months for three years.
The company has signed a PPA for the project at a “comparable”
rate to other large PV sites in the region.
Saudi Arabia
Bids in 300MW Saudi solar tender breach
two cents
Saudi Arabia’s 300MW solar tender saw opening
bids go lower than two US dollar cents per unit,
setting the tone for a new global solar power
tariff record if awarded. Abu Dhabi Future
Energy Company (Masdar) bid for 300MW
capacity with a tariff of SAR0.0669736/kWh (US$1.786 cents). Saudi Arabia’s new Renew-
able Energy Project Development Office (REPDO) revealed the eight companies that had
made it through to this stage, having had 27 companies shortlisted originally in April.
These bids will be evaluated for compliance with the requirements of the RfP. The project
will be awarded to the winning consortium on 27 January 2018, backed by a 25-year power
purchase agreement (PPA). The financial closing date will be 28 February 2018 and the
commissioning date is expected during 2019. In April, analysis firm GTM Research forecast
that this tender, for capacity located at Sakaka in Northern Saudi Arabia, was the most likely
contender for solar to break 2 US cents in 2017.
24-25 APRIL 2018LONDON, UK
Best Practice and Optimisation of Solar Portfolios
If you’re serious about capitalising from your solar assets for decades to come, or want to establish a reliable O&M reputation, Managing European Solar Assets is not to be missed.
assets.solarenergyevents.com
Cre
dit:
Get
ty
million debt package for 13 solar projects at the Benban Solar Park,
near Aswan in Egypt. This is the largest private sector financing
package for a solar PV facility in the Middle East and North Africa
(MENA) regions. The 13 plants will have a combined capacity of
752MW. There have been a number of announcements regarding
financing of the various PV projects at Benban in recent months,
with multiple finance institutions including the European Bank for
Reconstruction and Development (EBRD) and developers confirm-
ing progress.
NEWS | from PV-Tech.org
12 | December 2017 | www.pv-tech.org
Belectric to build Israel’s ‘largest’ PV plant
Belectric has won the engineering, procurement and construction
(EPC) contract for a 120MW project in Israel. Belectric will work with
local engineering firm Solel Boneh on what they claim to be the
country’s largest project. Work is expected to commence within the
next few months with commissioning in 2019. “Zeélim is the largest
single PV project in our company history outside of Germany,” said
Ingo Alphéus, CEO, Belectric Solar & Battery GmbH. “We are very
proud that this EPC contract has been awarded to us. This is in line
with our strategy to significantly grow our business in key solar
markets like Israel.” Belectric will also take on the O&M contract for
the plant after completion, adding to its existing portfolio of 1.3GW.
asia-pacificFar East
Seoul-ar City: South Korean capital investing US$1.5bn
for 1GW of PV
South Korean capital Seoul plans to invest US$1.55 billion in a solar
plan, which aims to install 1GW of PV generation capacity by 2022.
“Solar City Seoul” will involve the undertaking of seven initiatives
then subdivided into 59 separate projects. One key element of the
plan is to oversee the increase of miniature solar generators on
household rooftops and verandas from around 30,000 up to one
million.
Influential think tank recommends 200GW solar target
for China
The Chinese government should increase its 2020 solar target from
110 to 200GW, according to the China National Renewable Energy
Centre (CNREC). The think tank is the main advisor to the govern-
ment’s National Energy Administration (NEA), which would be
ultimately responsible for acting on the recommendation. In August,
the continuing boom of installations saw the country edge past
its existing 2020 target. Frank Haugwitz, of the Asia Europe Clean
Energy Advisory (AECEA), which highlighted the recommendation
in a briefing note, considers the target to be achievable. “The recom-
mended ‘new’ solar PV target in AECEA’s opinion will be realised, if
not exceeded by approx. 15-20%,” he wrote.
Southeast Asia
Masdar and Indonesian power giant to build world’s
largest floating solar plant
Indonesian power company PT Pembangkitan Jawa-Bali (PT PJB),
a subsidiary of state utility PLN, and the UAE’s Masdar have signed
an agreement to develop the world’s largest floating solar project
with a capacity of 200MW in Indonesia. This would be twice the size
of a 100MW floating PV plant planned by Hanwha and five times
larger than the current largest project of 40MW built by Sungrow in
Anhui Province, China. Sungrow and Chinese firm CECEC are also
constructing 150MW and 70MW projects respectively in the same
region of China. The plant will be built on the reservoir of an existing
1GW hydropower plant.
Vietnam’s final solar PPA still short of bankability
Vietnam’s final solar power purchase agreement (PPA) has to a large
extent ignored recommended changes from a group of interna-
tional Chambers of Commerce and therefore its attractiveness to
foreign investors remains in doubt. The Ministry of Industry and
Trade (MOIT) officially released a Circular including the revised solar
PPA acting as a mandatory template for utility-scale and rooftop
solar projects. The Vietnam Business Forum (VBF), an umbrella group
for multiple international Chambers of Commerce, had expressed a
long list of concerns about the original draft PPA back in May.
India and South Asia
India plans 77GW of solar tenders in three years
India has announced plans for an unprecedented solar procure-
ment regime that aims to tender for 20GW in 2017/18, followed by
another 30GW in each of the two following years, but analysts have
described the policy as “completely unrealistic”. The main tendering
in the current fiscal year would follow the timeline below:
• 3GW in December 2017
• 3GW in January 2018
• 5GW in February 2018
• 6GW in March 2018
Vinay Rustagi, managing director of consultancy firm Bridge
to India, said: “There is clearly no detail to how the government is
going to actually fulfil or implement such an ambitious roll out and
it just seems like this is a simplistic plan - a ‘filling the gap’ kind of
plan rather than something which takes into account the various
challenges on the ground and tries to solve them one by one to then
achieve the 175GW target.”
Indian solar asset sellers getting ‘desperate’
Many developers with solar assets in India are looking to sell their
portfolios. Some of them have been in the market for a long time
and are under pressure from their investors to find an exit. Vinay
Rustagi, managing director of Bridge to India, said: “If you look at all
the developers in India, most of them are backed by private equity
money or corporate capital, which needs to find an exit in the next
2-3 years depending upon the horizon of the individual investors.”
Rustagi’s comments come after a spate of reports suggesting a large
number of companies are looking to divest their Indian solar assets,
including Ostro Energy, Essel Infra, Orange Power, Shapoorji Pallonji,
SkyPower, Fortum and FRV.
Record deal
Equis Energy bought by GIP for
US$5 billion in record renewable
energy deal
US-based investment fund Global Infra-
structure Partners (GIP) and co-investors
have acquired Singapore-headquartered
Equis Energy, the largest renewable
energy IPP in the Asia Pacific region, for US$5 billion along with assumed liabilities of
US$1.3 billion. This is the largest renewable energy acquisition ever, with GIP set to take
over 180 assets with a combined capacity of 11,135MW in operation, construction and
development across Australia, Japan, India, Indonesia, the Philippines and Thailand.
The transaction is subject to customary regulatory approvals and is expected to close
in the first quarter of 2018. David Russell, cheif executive of Equis and chairman of Equis
Energy, said: “The investment by GIP and its partners is exciting news for the develop-
ment of renewable energy in the Asia-Pacific. GIP has a strong track record of managing
and growing utility-scale infrastructure businesses, and the combination of experience
and knowledge across GIP and the existing management team will allow Equis Energy to
continue expanding competitively across its target markets.” In August, Equis said it would
build a 1GW solar project in Queensland that would be the largest in Australia.

products
13 www.pv-tech.org | December 2017 |
Product Outline: BIG SUN Group has
combined its dual-axis iPV Tracker with a
bifacial module resulting in up to a claimed
100% power generation gain over a conven-
tional fixed-tilt system.
Problem: Bifacial PV modules, which have
the ability to significantly increase PV power
plant yields, require fixed mount and tracker
systems that do not impede scattered light
from the rear solar cells as this can limit yield
benefits.
Solution: BIG SUN’s iPV Tracker has been
redesigned to maximise the use of bifacial
modules. iPV tracker’s unique 360 degree,
universal-axis design with a slim cable
Product outline: DNV GL has launched the
first control hardware in loop (CHIL) test
facility for renewable energy generation
plants. The facility connects physical power
plant controllers to a real-time simulator,
allowing the controller to be fully tested and
validated without the need for an actual
generation facility or power grid.
Problem: Since 2016, Germany has updated
its medium- and high-voltage grid codes
to require certification of all wind farm
controllers before the wind farm can start
supplying the grid. Similar guidelines are
expected to follow elsewhere in the world,
both nationally and internationally and
include solar PV power plants. Until now,
testing controllers meant downtime for the
Product Outline: GCL System Integration
Technology (GCL-SI) has launched its first
modular PV power plant system, incorpo-
rating single-axis tracking and 1,500VDC
technologies.
Problem: The use of standardised and
modular components developed together
provides the opportunity to reduce balance
of system (BOS) costs further, shorter
installation times and increase reliability,
compared to bespoke designs.
Solution: The Super 2.5 MW Solar Block
is claimed to be cost-effective and to
maximise space efficiency. The design
of the block ensures long-term reliable
operation, even in extreme environmental
conditions, according to GCL-SI. The block
drawn driving mechanism, has reduced the
shading impact from the linear actuator and
slewing drive employed with the conven-
tional dual axis trackers. To eliminate any
shading from the module mounting frame,
BIG SUN has redesigned the rear supporting
generation farm and
huge effort coordinating
many different players.
What’s more, a failure
during testing could
have far-reaching and
expensive consequences.
Solution: The physical
controller is connected
to a real-time simulator that emulates the
solar farm as well as the grid connection.
Furthermore, a communication layer is
included for the master SCADA simulating
the grid operator. This setup allows the
controller’s behaviour in any situation to be
explored, and any unwanted interactions to
be identified.
design utilises GCL-SI’s in-house developed
96-cell modules with a specially developed
horizontal single axis tracker to accom-
modate the large-area modules but with
a reduction in panel fixture and electrical
connections to support faster construc-
tion times. All components comply with
frame so as to match exactly to the frame
dimension of any module.
Applications: PV power plants.
Platform: The iPV Tracker is tall enough to
have the sunlight reflected and absorbed
onto the rear side of the bifacial module.
These features enable the realisation of the
benefits of bifacial modules, especially in
snow season regions. Fitted with BIG SUNs
energy monitoring system, iPVita, the iPV
Trackers can reach > 99.9% availability in
field operation.
Availability: Available since September
2017.
Applications: PV power plant control
hardware can be rigorously tested under
real-world conditions without connection to
actual generating plants and energy grids.
Platform: The test bench allows
complete testing according to the latest
revisions of the German grid codes, with
the possibility of ISO 17025 accredited
measurements. DNV GL will make it avail-
able for customers including controller
manufacturers, and renewable energy
generation site developers and opera-
tors through testing and measurement
services.
Availability: Available since September
2017.
1,500VDC standards, which ensures lower
costs in cabling and power conversion,
leading to high system efficiency. The
all-in-one PV inverter power container
was specially developed with two 1000kW
inverters with 1,500 DC System voltage, and
one MV transformer, which further reduces
on-site electrical and grid connection work.
GCL-SI uses a built-in monitoring system for
the inverter.
Applications: Utility-scale PV power plants.
Platform: GCL-SI is offering a global service
network as well as remote monitoring,
regular inspections as well as a full O&M
service.
Availability: Available since October 2017.
Tracker BIG SUN’s iPV Tracker has new bifacial module version to boost yield
Plant control DNV GL launches world’s first control hardware in loop test bench for PV power plants
System design GCL-SI offers ‘Super 2.5MW Solar Block’ for modular PV power plants
Product reviews

products
14 | December 2017 | www.pv-tech.org
Product Outline: GoodWe has launched
its new SBP series, which is claimed to be
the world’s first AC-coupled retrofit solution
with UPS function which allows energy
storage and uninterruptible power supply
to both single- and three-phase inverter
systems.
Problem: Due to grid instability and the
reduction of solar feed-in tariffs, grid-feed
solar systems have become less economi-
cal, and an increasing number of users
are turning to energy storage and self-
consumption as an alternative. However,
for those consumers with a conventional
grid-connected solar system, replacing their
existing grid-tied string inverter with a new
hybrid inverter involves an additional costly
Product Outline: GoodWe has launched
its second generation of MT Series string
inverters, GW50K-MT and GW60K-MT,
for large-scale commercial rooftops and
ground-mounted solar PV systems. Apart
from offering a more compact design
and competitive price, the new MT Series
provide a continuous power boost function
to achieve a higher yield and quicker return
on investment.
Problem: Conventional inverters are usually
able to temporarily boost the AC output
power but cannot offer a continuous and
cost-effective solution to maximise the
output from high-voltage solar modules.
Therefore, a larger number of inverters is
required to achieve a higher output, leading
Product Outline: Hanwha Q CELLS has
introduced its Q.PEAK DUO module series
that combines half-cut cell technology, six
busbars and the company’s proprietary
Q.ANTUM (PERC) monocrystalline cell
technology to offer efficiencies of close
to 20% and power outputs of up
to 330Wp from 120 half-cut cells
and up to 395Wp from 144 half-
cut cells.
Problem: Controlling the various
degradation effects such as
potential-induced degradation (PID), light-
induced degradation (LID) and light and
elevated temperature-induced degradation
(LeTID), which can appear on multicrystal-
line or monocrystalline PERC solar cells in
investment. While there are
AC-coupled inverter-charger
hybrid systems on the market,
none of them are able to offer
uninterruptible power supply
to prevent the connected loads
from experiencing power inter-
ruptions.
Solution: GoodWe SPB Series
is a cost-efficient, battery
backup solution which can
work alongside any grid-tied
string inverters. Even though GoodWe SBP
Series is a single-phase AC retrofit device,
it can also work with a three-phase meter
to become a three-phase energy storage
system. By adding batteries, users can store
to a significant increase in capital
expenditures and operating costs.
Solution: The new GoodWe MT
Series provides a continuous
maximum AC output power
overload of up to 15%, reducing
the total number of inverters to
be installed, while minimising
labour and installation costs. It
also features a more compact
design with less than 20%
volume and lighter weight compared to
other conventional models, which greatly
simplifies installation and commissioning.
With capacities of 50kW and 60kW, the new
transformerless, three-phase GoodWe MT
series grid-tied inverters are equipped with
early operation
stages, is required
to mitigate the
effects of degra-
dation.
Solution: Q.ANTUM
is the proprietary
solar cell technol-
ogy platform of
Hanwha Q CELLS and
the engine behind its
complete portfolio of solar
modules. While being based on the rear
side passivation of the solar cell (PERC),
Hanwha Q CELLs claims Q.ANTUM offers
many additional features that differentiate
it from conventional PERC technologies –
the energy that the solar array is produc-
ing in the daytime and use it at night or
even during a power outage. When the
grid is down, GoodWe SBP seamlessly
begins to invert power from the battery
bank to power the critical loads, offering an
automatic switchover time of less than 10
milliseconds.
Applications: PV residential rooftop
systems.
Platform: GoodWe SBP Series works with
any grid-tied string inverter and is compat-
ible with BYD, LG, Pylon and GCL lithium-ion
batteries.
Availability: Currently available.
four MPPTs ensuring that the outputs of
connected modules are able to generate
the highest yields even in different PV instal-
lation conditions. In addition, it also allows
a wireless communication network for
monitoring and control of the entire system
through smartphone, tablet or laptop.
Applications: Large-scale commercial
rooftops and ground-mounted solar PV
systems.
Platform: Two different MT Series string
inverters, GW50K-MT and GW60K-MT, are
available to adapt to different requirements
in terms of output power.
Availability: Currently available.
primarily its strengths in controlling PID LID
and LeTID.
Applications: Residential and C&I rooftops.
Platform: Hanwha Q CELLS’s processes to
control degradation are reflected in the
performance warranties of all Q.ANTUM
products, which guarantee at least 98% of
nominal power during the first year, at least
93.1% of nominal power up to 10 years
and at least 85% of nominal power up to
25 years. Additionally, Q.ANTUM features
Hot-Spot-Protect and Tra.Q laser marking for
100% traceability of any cells produced, as
well as strict Q CELLS quality standards.
Availability: Currently available.
Inverter GoodWe launches the world’s first AC-coupled retrofit inverter
Inverter GoodWe’s new MT series inverters provide greater output power for large DG projects
Module Hanwha Q CELLS launches Q.PEAK DUO modules with half-cut cell technology
Product reviews

products
16 | December 2017 | www.pv-tech.org
Product Outline: KACO new energy has
launched the blueplanet 50.0 TL3 RPonly
inverter, which can feed in reactive power at
any time in order to maintain grid voltage
in the specified tolerance range – a key
contribution to grid management.
Problem: When there is a lot of sunshine,
solar parks can feed large amounts of
energy into the grid when weather condi-
tions enable high irradiance. However,
when there is less irradiance, less electric-
ity is generated resulting in fluctuations
and grid impedance. One useful means of
compensating for the resulting fluctuations
in the grid is to provide what is known as
reactive power.
Product Outline: LG Electronics’ flagship
solar PV panel has a 365W rating with
improved temperature coefficient
and extended product warranty
designed with high aesthet-
ics for residential applica-
tions.
Problem: Residential
solar markets are increasingly demand-
ing higher panel output, to minimise the
quantity of panels required for maximum
system electricity generation and reduce
overall system costs. This is coupled to
greater demand for panel aesthetics that
better blend with rooftop structures and
provide a seamless installation.
Product Outline: Lumeta Solar has
introduced the Lumeta ‘Lynx’ line of solar
modules that eliminate racking resulting in
faster installation, zero roof penetrations,
and improved aesthetics. The low-profile,
black-on-black, frameless monocrystal-
line modules adhere directly to the roof,
dramatically reducing module installation
time on tile, shingle, and commercial roofs.
Problem: A module that slashes installa-
tion time and almost erases the chance of
roof leaks is a benefit for solar contractors’
bottom line. A lighter weight system with
fewer components is intended to increase
operational efficiency for distributors and
contractors alike.
Solution: The Lumeta Lynx 60-cell module
is a 300W 18.1% efficient module that is
Solution: As a “phase-shifting”
device, the blueplanet 50.0 TL3
RPonly can supply any value of
reactive power between 0 and
10%, current leading or lagging.
The power is not given in watts
or volt-amperes but in var. As
its name suggests, the inverter
can supply up to 50kvar. The
correction value applied at the
grid connection point is the
crucial factor. This is where the
park control system ‘reads’ the
measured reactive power. If the
measured value deviates from the set-point
– which can be set to any value between
100% active and 100% reactive – the
Solution: The LG ‘NeON R’ panel
uses n-type monocrystalline
cells with back contact
electrode technol-
ogy to minimise
problems
from the
light-induced
degradation
(LID) and maximise the performance and
potential power output for the life of the
module.
Applications: Residential rooftops.
Platform: The LG NeON R comes with an
extended product warranty, covering
labour and delivery. The combined product
designed for both tile roofs,
where it is installed using
inserts that create a level
surface, and composition
shingle roofs. The Lumeta Lynx
72-cell module is a 360W 18.3%
efficient module designed
for installation on almost all
commercial roof systems.
An industrial-strength butyl
adhesive, commonly used in
the roofing industry, secures
the module for the system’s
lifetime and enables removal if ever
required. The module was tested to NREL’s
demanding Qualification Plus standard and
passed a Black & Veatch-developed reliabil-
ity and robustness testing protocol that
ensures the module withstands the rigors of
real-life handling.
inverter will be requested to supply reactive
power to the extent that is required to arrive
at the target value.
Applications: The application goes beyond
solar parks and can be used for reactive
power compensation in industrial or other
large consumer sites.
Platform: The blueplanet 50.0 TL3 RPonly
can be used in new and existing plants,
wherever reactive power is required in grid
management, perfectly complementing
solar inverters from KACO new energy or
other manufacturers.
Availability: Currently available.
and performance warranties guarantee
the materials, workmanship and perfor-
mance of the panels for a full 25-year
period. In the North American market LG
has teamed with SolarEdge Technologies
to include SolarEdge inverters with LG
NeON R panels, creating one of the most
power-dense rooftop solutions on the
market. LG is also offering its first AC panel
the NeON 2 Ace, coupled with microin-
verters from Enphase Technologies for
the US residential market, which reduces
installation time by half, compared with
conventional modules, while offering
cutting-edge technology.
Availability: Currently available.
Applications: Residential and C&I rooftops.
Platform: The Lynx series modules use
Dupont’s ETFE (ethylene tetrafluoroeth-
ylene) sheet that replaces the glass front
sheet and enables heat dissipation. The
high efficiency black monocrystalline
silicon cells with industry-standard EVA
encapsulation is intended to provide
decades of reliable energy production. A
FRP (fibre-reinforced polymer) semi-
rigid back sheet protects the cells and
a tapered edge seal replaces the frame,
removing the need for grounding and
reducing soiling.
Availability: Lumeta Lynx will begin
shipping to select partners in Q4 2017 and
be available throughout the United States
in Q1 2018.
Inverter KACO’s ‘blueplanet 50.0 TL3 RPonly’ supports grid stability with reactive power
Module LG Electronics NeON R solar panel has 365W rating with improved temperature coefficient
Module Lumeta Solar’s ‘Lynx’ module offers low-profile, zero-penetration installation
Product reviews

products
17 www.pv-tech.org | December 2017 |
Product Outline: Mecasolar’s Hyperion-SR’
is touted to be the most advanced single-
row horizontal tracker on the market. Main
features are minimum number of piles
per MW, self-powered operation, wireless
communications, extended slope tolerances
and sophisticated optimisation.
Problem: Providing flexibility in the design
of ground-mounted PV power plants,
while enabling higher land use density to
maximise yield are required to reduce the
plant balance of system costs. However,
trackers need to provide higher uptime, fast
installation and accurate tracking to deliver
the highest returns. Increased adoption of
1,500VDC technology also requires longer
module rows, and trackers that enable this
Product Outline: Solaria Corporation’s
‘PowerVision’ series of customised architec-
tural solar (BIPV), power generating glass
solutions for building facades can be widely
used in nearly every aspect of a building
envelope beyond the rooftop to generate
electricity.
Problem: There is increased demand to
evolve building designs to incorporate
more solar solutions, and construct, when
possible, high performance, net zero energy
structures. Buildings currently account for
40% of global energy use.
Solution: Solaria PowerVision-150 is an
Product Outline: Tabuchi America
has launched its next-generation
Eco-Intelligent Battery System (EIBS).
The all-in-one system is compliant with
the UL 9540 certification requirements,
which provides third-party validation
of safety, reliability and efficient energy
management for hybrid solar-plus-
storage systems.
Problem: While there are many efforts
to develop and apply safety standards
for the rapidly evolving energy storage
industry, the UL 9540 certification
compliance is limited to a relatively
small number of energy storage
manufacturers. Attention to safety
regulations is more important than ever,
not just to protect the safety of residen-
tial home owners and property, but also
are being demanded.
Solution: The
‘Hyperion-SR’ tracking
system is claimed to
increase PV power
plant output by up
to 27% compared to
fixed structure systems while its dimensions
can be extended to to 90 modules per row
for 1,500VDC systems. Each row integrates
an advanced controller equipped with
electrical devices such as UPS, inclinometer
and motor current monitor sending its data
through a wireless mesh network. Raising
the system voltage to 1,500 volts allows
for 50% longer strings thus reducing the
number of strings for the same amount of
architecturally beautiful
vision glass that can be used
in locations not typically
associated with solar
panels. Building owners
and occupants accrue
many benefits as solar-
outfitted windows mitigate
the sunlight’s effect on a
building. When combined
with high-efficiency solar PV
modules, together they offer
a seamless strategy to unlock
the full power potential of
buildings with technologies
that boost energy generation,
to expedite
the permit-
ting process.
Solution:
The system is
designed for
adaptability
and ease of
installa-
tion with a
DC-coupled battery. This maximises
the amount of solar energy used by the
system and safely provides solar power
to the grid and to residential customers
during power outages. Consumers get
more out of their system because both
the battery’s bi-directional converter
and the solar inverter are DC-coupled.
This allows the energy generated by
power and eliminating almost 30% of the
related cabling and combiner boxes permit-
ting fewer inverters per project.
Applications: Utility-scale PV power plants.
Platform: The weight of the structure
has been significantly reduced while the
optimised design allows wider rotation
angles (+/- 55 degrees). In case of severe
weather conditions, the tracker automati-
cally moves to stowing position in less than
three minutes. The entire tracker can be
assembled with fastening devices, therefore
on-site welding is not required, reducing
workforce cost and mounting time.
Availability: Currently available.
providing high yield at a low cost.
Applications: A wide range of BIPV and
BAPV applications such as building facades,
skylights, canopies and sloped glazing roofs
as well as other structural components.
Platform: PowerVision-150 is endorsed by
leading glass and fabrication companies
including Pilkington, AGC, and Walters &
Wolf. Recently, Linel, a fabricator of custom-
ized architectural glass and metal products
has also endorsed the technology for BIPV
sloped glazing systems.
Availability: Currently available.
the solar panels to directly charge
the batteries without first converting
to alternating current (AC) like most
storage systems. This also leads to
higher system efficiency through one
less DC-AC inversion.
Applications: In tandem with residen-
tial roof top PV systems.
Platform: The increased storage capac-
ity can help retain critical electrical
loads operational longer during a black-
out. Added surge capability enables
the EIBS system to power motor-driven
loads such as water pumps, which have
a higher starting load, allowing greater
integration within the home.
Availability: Currently available.
Tracker Mecasolar ‘Hyperion-SR’ horizontal tracker designed for flexibility and cost competitiveness
Module Solaria provides ‘PowerVision’ series of customised architectural glass modules
Storage Tabuchi’s smart inverter and battery package future-proofs residential solar-plus-energy

18 | December 2017 | www.pv-tech.org
cover story SPECIAL REPORT: Next-generation inverters
Towards a global CO2-neutral
energy supply, renewable energy
sources are becoming increas-
ingly important worldwide. In particular,
photovoltaics will take a key role in this
context. In recent years, the levelised
cost of electricity for PV has dropped
massively compared with conventional
energy sources [1]. As the key element
of a photovoltaic system, irrespective
of the power range, the efficiency and
reliability of solar power generation are
essentially determined by the properties
of the PV inverters. As a result of increas-
ing cost pressures, new generations of PV
inverters are required, in which not only
technical innovations and reliability but
also cost optimisation and intelligence
play a central role.
Power density
Power density and power-to-weight ratio
already played a major role in inverters
at the beginning of their development
in the early 1990s. Major technologi-
cal advances have been made over the
last few decades by eliminating circuit
topologies with transformers and adding
new semiconductor technologies. Not
only could the efficiency therefore be
brought close to the theoretical limit of
99% [2], but also the power density and
power-to-weight ratio could be increased
significantly.
The introduction of the latest semicon-
ductor technology has led to a significant
increase in power density, particularly in
the field of photovoltaic inverters. The
introduction of silicon carbide semicon-
ductors has led to higher switching
frequencies being realised, thus allowing
the passive components, such as induc-
tors, to be reduced (Figure 1).
Due to the increasing market penetra-
tion of wide bandgap semiconductors,
SiC-MOSFETs are increasingly being used
in PV inverters. Wide bandgap semicon-
ductors permit devices to operate at
much higher voltages, frequencies and
temperatures than conventional silico-
based semiconductors. The combination
of silicon IGBTs and SiC Schottky diodes,
in so-called hybrid power modules,
has already become state of the art in
commercially available inverters. Due
to the increasing electrification of the
transport sector and the resulting volume
market for semiconductors in addition
to photovoltaics (Figure 2), it can be
assumed that prices for SiC semiconduc-
tors will continue to fall in the coming
years. In the transport sector, power
density or power-to-weight ratio is even
more important than in the field of
photovoltaics. Each additional kilogram
of weight saved can increase the range
of electric vehicles. As a result, silicon
carbide technology within photovol-
taic inverters will become state of the
art within the next few years. The first
manufacturers in the field of PV inverters
have already announced devices that
are completely based on silicon carbide
technology.
Semiconductor technologies such as
gallium nitride, which are still predomi-
nantly used in consumer electronics
today, are becoming increasingly interest-
ing for applications in power electronics.
By increasing the switching frequency in
the megahertz range, weight and volume
as well as the associated material costs
can be further reduced. In contrast to
SiC semiconductors, which are commer-
cially available up to a reverse voltage
of 1,700V, commercially available GaN
semiconductors are only available up
to a reverse voltage of 650V and with
a maximum current carrying capac-
ity of 60A, which adversely affects the
scalability of the power classes. Due to
the high price and low reverse voltage,
GaN semiconductors are still mainly used
for research purposes in smaller power
electronics devices (<5kW). One of the
future challenges will be to improve GaN
semiconductors for parallel connection
Inverter technology | Inverters are the subject of intensive ongoing innovation as the range of roles they are expected to play in PV power plant operation continues to grow. Stephan Liese of Fraunhofer ISE scopes out some of the key areas for further technological advancement in the next generation of solar inverters
Technical trends in next-generation solar inverters
Figure 1. Example
of weight/volume
reduction of
inductors
Cre
dit
Fra
un
ho
fer I
SE

19 www.pv-tech.org | December 2017 |
cover storySPECIAL REPORT: Next-generation inverters
to cover higher power ranges. The high
switching frequencies associated with GaN
semiconductors will require additional
innovative, internal and external EMC
device concepts that comply with current
standards.
Photovoltaic inverters can basically be
divided into two categories. On the one
hand there are string inverters in the range
up to around 125kW and on the other
hand there are central inverters starting
with several hundred kilowatts of power
up to the megawatt range. In string invert-
ers, multi-level topologies have established
themselves as state of the art. The related
introduction of a large number of voltage
levels leads to an additional reduction of
the passive components in the output
filter, in addition to the increase of the
switching frequency by new semiconduc-
tors. However, multilevel topologies with
an increasing number of voltage levels
have the disadvantage that their operation
is associated with a considerable additional
effort of circuit and control technology.
The so-called three-level topologies offer
a good compromise in terms of complex-
ity and power density. The combination
of multi-level topology and the latest
semiconductor generations in combina-
tion with high switching frequencies will
not only continue in the field of string
inverters, but will also increasingly find
its way into the field of central inverters.
In the case of central inverters, the trends
are clearly moving in the direction of even
higher power and input voltages. Research
projects are already being undertaken
that significantly reduce the size of central
inverters due to semiconductor technolo-
gies and innovative design concepts
(Figure 3) [3].
Increasing the power to weight
ratio
The cost breakdown of PV inverters shows
that the actual power electronics with
their semiconductors and their control
contribute only about one third of the
total costs. The vast majority of the
costs, up to 70%, are associated with
the mechanical and electromechanical
components. The mechanical compo-
nents include the housing, which consists
mainly of die-cast aluminum or sheet
metal, depending on the performance
class, the aluminum heat sinks, which
are partly integrated into the housing
structures, and the supporting structures.
The inductors, PCBs and connectors can
be assigned to the electromechanical
components. With the exception of induc-
tors, which are becoming increasingly
small due to higher switching frequencies
in conjunction with new semiconductors,
only a few technological innovations have
been produced in all other areas, which
make a significant contribution to costs.
A small number of inverter manufac-
turers, for example, are already using
the first polycarbonate housings, which
reduce the use of materials and contrib-
ute to cost reduction. New material
combinations with regard to the housings
and adapted production processes can
thus meet EMC requirements on the
one hand and on the other hand, these
innovations also promise considerable
cost-cutting potential in the future.
As far as cooling is concerned, the
so-called concept of the “hot core” has
recently been investigated experimen-
tally within the research project “PV-Pack”
[4]. The aim of the project is clear from
its name: “PV Pack: Optimised cooling,
packaging and assembly technologies
for efficient, fast-switching and highly
integrated PV inverters in the 10 to
40 kW power range.” To achieve this, a
highly qualified consortium was formed,
comprising SMA Solar Technology,
Fraunhofer Institute for Manufacturing
and Applied Materials Research (IFAM),
Phoenix Contact and Fraunhofer ISE.
Due to the thermal insulation of the
heat sink, increased temperature levels
can be achieved, which, especially in
conjunction with SiC semiconductors
and their operating temperatures of up
to 200°C, allow a more efficient use of
the heat sinks and semiconductors. The
use of composite materials can further
reduce the material costs of the heat sink
and thus increase the power-to-weight
ratio. Furthermore, different tempera-
ture zones have been introduced in the
concept, which means that electronic
and electromechanical components with
lower temperature requirements can
be used, which in turn has an impact on
costs (Figure 4).
The connection of cooling and housing
is state-of-the-art in the field of string
inverters and at the same time includes
the supporting structure of the inverter.
Within the above-mentioned research
project, these two components were
completely decoupled from each other,
which in turn allowed the support
structures to be viewed separately. In
the future, multi-functional lightweight
construction concepts could be used
here, for example with integrated heat
transfer mechanisms or with partial
Figure 3. Demon-
strator system
of a modular,
highly compact
1MW battery
inverter using
SiC-MOSFET’s
Figure 2. The SiC
power semicon-
ductor market.
Source: IHS
Cre
dit
Fra
un
ho
fer I
SE

20 | December 2017 | www.pv-tech.org
cover story SPECIAL REPORT: Next-generation inverters
electrical conductivities, which would
allow a more effective use of the installa-
tion space.
Considering the costs and the
associated use of materials, there is still
considerable potential for optimisation in
this area to bring further innovation. Here
the emerging mass market for electro-
mobility could have a massive impact on
cost-cutting potential too. To increase the
power-to-weight ratio, however, it is not
enough to focus solely on the above-
mentioned points. PV inverters and the
associated power electronics also require
a number of additional components,
which are usually purchased separately.
For example, EMC filters, capacitors and
a whole range of circuit breakers can
fall under this range. In the future, these
components should also be investigated
more intensively to determine to what
degree an increase in the power-to-
weight ratio can be achieved and how
this can also contribute to cost optimisa-
tion. Particularly with the introduction of
1,500V technology in the field of string
inverters (>50 kW) and for some time
already in the field of central inverters, it
can be seen that a considerable number
of parts and components are not yet
commercially available for the increased
voltage resistances, especially for string
inverters, and that they have to be devel-
oped partly on request.
Reliability and intelligence
The main failure causes of PV inverters in
terms of power electronics are nowadays
either the power semiconductors or
the capacitors. In the future, it must
be ensured that either the reliability of
these two components is increased or
the power electronics is empowered
to make intelligent statements about
state of health of the inverter or these
two components. Fault-tolerant PV
inverters can also help to ensure system
services by, for example, only operating
at reduced power, depending on the
fault. In the age of industry 4.0, a whole
series of innovations are still needed at
this point regarding monitoring, in order
to increase the internal intelligence of
PV inverters. One look at some wind
turbine manufacturers, which are already
a considerable step further along this
particular line, is enough.
Photovoltaic inverters are normally
dimensioned for a lifetime of 20 years,
although it must be taken into account
that this calculation “only” takes the hours
of sunshine into account. In recent years,
however, the devices have increasingly
been taking over various system services
that are otherwise provided by conven-
tional generators; in order to be able to
provide such services on a permanent
basis, the devices must also be dimen-
sioned for night-time operation. As a rule,
the ancillary services are grid-supporting
methods, such as frequency support via
active power or voltage maintenance via
reactive power.
Due to the implemented control
technology, most inverters can only
function as current sources and thus
Figure 4. PV-Pack
70kVA PV inverter
with new cooling
concept
Table 1. Operat-
ing modes and
behaviour of
inverters. Source:
Fraunhofer ISE
Operation Mode Grid-feeding Grid-forming Grid-supporting Grid-sustaining
Grid interconnected grid island grid interconnected grid interconnected grid or island
grid
Application grid with a high share of
rotating generators
grid is formed by one
inverter
grid with a high share of
inverters
Inverter-dominated grid / no
rotating generators
Source characteristic at
fundamental oscillation
(50 Hz)
current source
Z ∞
voltage source
Z 0
current source
Z ∞
voltage source with virtual
impedance
Z = R + jωL
Equivalent circuit diagram
Droop Control no no P(f ), Q(U) f(P), U(Q)
[grid-compatible]

cover storySPECIAL REPORT: Next-generation inverters
With the increasing number of invert-
ers feeding the interconnected grid and
the reduction of synchronous generators,
the need to control the grid voltage and
frequency by the inverters is increasing.
The operation mode of inverters that
operate in an interconnected grid or
island grid is called grid-sustaining. This
operation mode demands complex and
universal control algorithms which are
currently under development and are still
being used for research purposes. In the
future, this functionality should be imple-
mented as a standard feature in multi-
function devices, battery inverters and
photovoltaic inverters, so that PV can also
contribute to the full supply of renewable
energies, even if limited by the available
power, to maintaining the grid.
Furthermore, the increasing intercon-
nection and digitalisation of renewable
energy plants will become increasingly
important, especially with regard to
the fluctuating generation of electricity
from PV and wind. Often, the electricity
generated is not consumed directly on
site, but has to be transported where it
is needed. The additional expansion of
electrical storage facilities will help to
Stephan Liese joined the Fraunhofer ISE in Freiburg
in 2011. Starting from the development of software
for power electronic devices he has managed several
industrial and public projects related to this topic.
Since 2015 he has been the head of the “Modelling
and Control of Converter Systems” team and since 2016 the head
of the “Distributed Generation and Storage” group within the
Power Electronics and Grid Technologies department.
Author
[1] https://www.ise.fraunhofer.de/content/dam/ise/de/documents/
publications/studies/Photovoltaics-Report.pdf
[2] https://www.ise.fraunhofer.de/content/dam/ise/en/documents/
press-releases/2009/press-release-fraunhofer-ise-sets-a-new-world-
record.pdf
[3] http://netfficient-project.eu/
[4] https://www.ise.fraunhofer.de/en/press-media/press-releases/2017/
photovoltaic-inverter-with-highly-integrated-concept-promises-
lower-costs.html
References
contribute to the maintenance of the
electricity grid only to a limited extent.
However, due to the increasing penetra-
tion of feed-in inverters into the power
grid and the displacement of “convention-
al” rotating machines such as synchro-
nous generators, it will be necessary in
future for the inverters themselves to
ensure the maintenance of the grid.
Typically, PV inverters operate in grid-
feeding operation. Due to the increasing
multifunctionality of inverters, e. g. with
inputs for photovoltaics and connec-
tion options for batteries, these devices
usually have two operating modes. This
includes on the one hand grid-parallel
operation and on the other hand island
operation. In grid-parallel operation the
inverter is synchronised with the grid
voltage and grid frequency and feeds a
current into the grid. Therefore the source
characteristic is a current source. This
operation mode is called “grid feeding”.
In island operation, however, the inverter
forms the grid voltage and frequency
of the island grid. The source character-
istic is a voltage source. The current is
determined by the connected loads. This
operation mode is called “grid-forming”.
bring production and consumption closer
together. Precise acquisition and control
of power flows is essential. In order
to ensure this and not endanger grid
stability, the communicative capabilities
of the devices will play an increasingly
important role in the future, especially
with the superordinate grid operators,
in order to optimally control the power
flows in the grid.
As the fi rst subsidy free solar projects begin to appear, Solar Media is preparing to mark the dawn of a new era of subsidy free business for Europe and with nearly 4GW of large scale solar in the UK’s pipeline alone, the time for subsidy free solar has arrived. Solar Media is proud to present Large Scale Solar Subsidy Free Europe 2018, a 2-day conference covering the full scale and potential for the solar PV subsidy free market across Europe. Learn about recent utility scale subsidy free projects already deployed or in motion, and discover different feasible business models capable of operating free of a government support mechanism.
• What exactly is subsidy free and how can this change the face of Europe’s PV market?• Where is the opportunity for SF in Europe and is now the right time to go subsidy free? • Pipeline of European SF projects: A deep dive into recent projects of UK, Italy, Ireland • Sourcing the current fi nance and investment to enable stable development• Storage and solar and the commercial appeal of co-locating • Examples of corporate PPAs and individual off-taker success stories• Commercial and industrial opportunity across Europe• What alternative mechanisms can governments utilise to enable projects post subsidy?• Community energy projects in a subsidy free era
DUBLIN, MARCH 2018
Confi rmed speakers
LIGHTSOURCE Nick Robb, Head of Development
NEXT ENERGY Abid Kazim, Managing Director
NTR PLCAnthony Doherty, Group
Corporate Finance Director
GRIDSERVE Mark Henderson, CIO
For speaking and sponsorship opportunities contact: [email protected]

22 | December 2017 | www.pv-tech.org
cover story SPECIAL REPORT: Next-generation inverters
One of the limitations, Geng says, is the fact that although
1,500V central inverters are well suited to large utility-scale
projects, the reality is that opportunities for such projects are
diminishing.
“The reason why we were thinking about a string inverter in
the 1,500V range was because in the central inverter market, the
power block size is changing from 1MW to 2MW to 3MW to 4MW;
if you go outside the US – Mexico, Australia, India – they’re looking
at 5MW, 7MW and 10MW blocks,” he explains. “But in reality the
market has started moving away from the super power plants, like
Desert Sunlight or Solar Star – those 500, 700MW plants. So a block
size of 4MW or 3MW is becoming a limitation for relatively smaller
projects.
“If you look at the commercial and industrial (C&I) and small
utility market, predominantly over the past couple of years in that
market most of the applications there is string inverters – three-
When Chinese inverter specialist Sungrow launched the
world’s first 1,500V(DC)string inverter at Solar Power
International in the US last September, the event under-
lined the extent to which the higher voltage power plant technol-
ogy was well on its way to becoming industry standard. Previously
restricted to central inverters and thus the larger projects for which
these are generally used, 1,500V combined with the flexibility of
the string inverter format opened up a whole new range of possi-
bilities for the higher voltage architecture and the benefits it offers.
Sungrow North America’s director of product and engineering,
Geng Tian, was one of the team that developed the company’s
pioneering 125kW, 1,500V string inverter. He had also worked
on the solar industry’s very first 1,500V inverter, the LV5 central
inverter produced by GE. This gave him a unique perspective on
the 1,500V concept, both in terms of its potential possibilities but
also its limitations.
Interview | Last year Sungrow became the first to market with both a string and central inverter at 1,500V. Geng Tian, director of product and engineering of Sungrow North America, tells Ben Willis how the evolution of inverter technology will help propel the next leap forward in PV plant design
1,500V and beyond – where
Cre
dit
Sun
gro
w
Sungrow’s
SG125HV was the
first 1,500VDC
string inverter on
the market

23 www.pv-tech.org | December 2017 |
cover storySPECIAL REPORT: Next-generation inverters
next for inverter technology?
phase, 1,000V string inverters at 20kW, 60kW. These are products
targeted at the small commercial/industrial projects, from a couple
of hundred kilowatts to 1-3MW. But there is a huge gap in the
market, between around 1 and 20MW. And the sites for these are
not like a square anymore; and the developers who are normally
doing the big utility-scale projects, they have high overheads,
they don’t have enough justification to go after the 5, 10, 20MW
projects anymore. But the smaller developers, who are normally
doing the 1MW, 2MW projects, do not have the sophistication to
deal with the complexity of utility-scale projects – the 10, 20MW
projects. So it’s like a hole in the market – there’s the demand but
no product.”
The key attributes of the string inverter – ease of handling,
installation and maintenance – made it the ideal product to fill this
gap. But to produce it at the higher voltage threw up a number of
technical challenges. Chief among these was how to squeeze the
higher power into a unit that was still small enough to retain the
characteristics of a string inverter.
“It’s easy for us to produce a 200 or 300kW string inverter,
but the issue is that always we want to make sure this is a string
inverter and not a small central inverter, meaning that we can
have two people easily carry and install it,” Geng explains. “And
at the same time we need to increase the power as much as we
can, because the higher the power of each block, the less balance
of plant components you’re going to have to use. So 125kW is an
ideal block – it’s a trade-off between the higher power, the weight,
the cost and other considerations such as manufacturability.”
The technological leap that enabled Sungrow to achieve the
necessary power density was a shift from the standard three-level
topology normally found in inverters to five. What this essentially
means is increasing by two the number of power conversion steps
the inverter must make, but it had the advantage of enabling the
use of smaller, more efficient components.
“We developed our own technology that allowed us to signifi-
cantly shrink the size of the capacitors and the reactors and other
components,” Geng explains. “So that’s the biggest technological
achievement that allowed us to reduce the weight and increase
the power density. Sungrow central inverters and older generation
string inverters are all using three-level topology. But this 1,500V
string inverter introduced a new five-level topology.”
With the 1,500V string technology firmly under its belt, Sungrow
is now pushing the concept of the ‘virtual central inverter’. What this
means is clustering a number of string inverters together in the field
to emulate the balance-of-system benefits of a centralised architec-
ture – reduced cabling, better control at the point of interconnec-
tion and so forth – but with the flexibility of a string inverter – ease
of installation and ease of maintenance to name but two.
Geng says it also gives developers “ultimate flexibility” with their
site, overcoming the power block limitations of central inverters.
“You can easily put eight or nine inverters per 1MW block; or you
can put in 20 inverters for a 2.5MW block,” he says. “And the entire
balance of plant is essentially like a central inverter – you’re running
1,500V cables, you’re using the combiner boxes almost in exactly
the same way as a central inverter…but still able to capture the
benefits of the string inverter and its flexibility. For the people who
are developing large-scale utility PV projects, their supply chain
and design practices are really built around the central inverters. So
this is like a natural transition for those developers – to replace one
central inverter with multiple string inverters in the same location.”
The next leap forward
The big question is where next for inverters and PV power plant
design in general. There has been no shortage of debate about
whether the next step is an even higher voltage – 2,000 or even
3,000VDC, which would bring into play medium voltage DC (MVDC)
architecture. Such a transition would be a huge leap forward for the
PV industry, but it seems a way off yet, as underlined recently when
Greentech Media reported that US giant First Solar had indefinitely
suspended previously announced plans to shift to MVDC due to
what it said was ongoing competition in the inverter market.
Figure 1. The architecture of a typical 1,500VDC PV array (top) and (below) as envisaged by Geng Tian with the 600VAC power conversion stage
eliminated
1,500VDC 1,500VDC 34.5kVAC 110kVAC
PV array Combiner box Inverter
DC
AC
600VAC
Padmount
transformer
Substation
transformer
Point of
interconnection
±10kVDC~±20kVDC1,500VDC 110kVAC
PV array
Combiner box/
DC/DC converter
Inverter
DC
AC
DC
AC
Substation
transformer
Point of
interconnection
4,160VAC
7,200VAC
13,800VAC
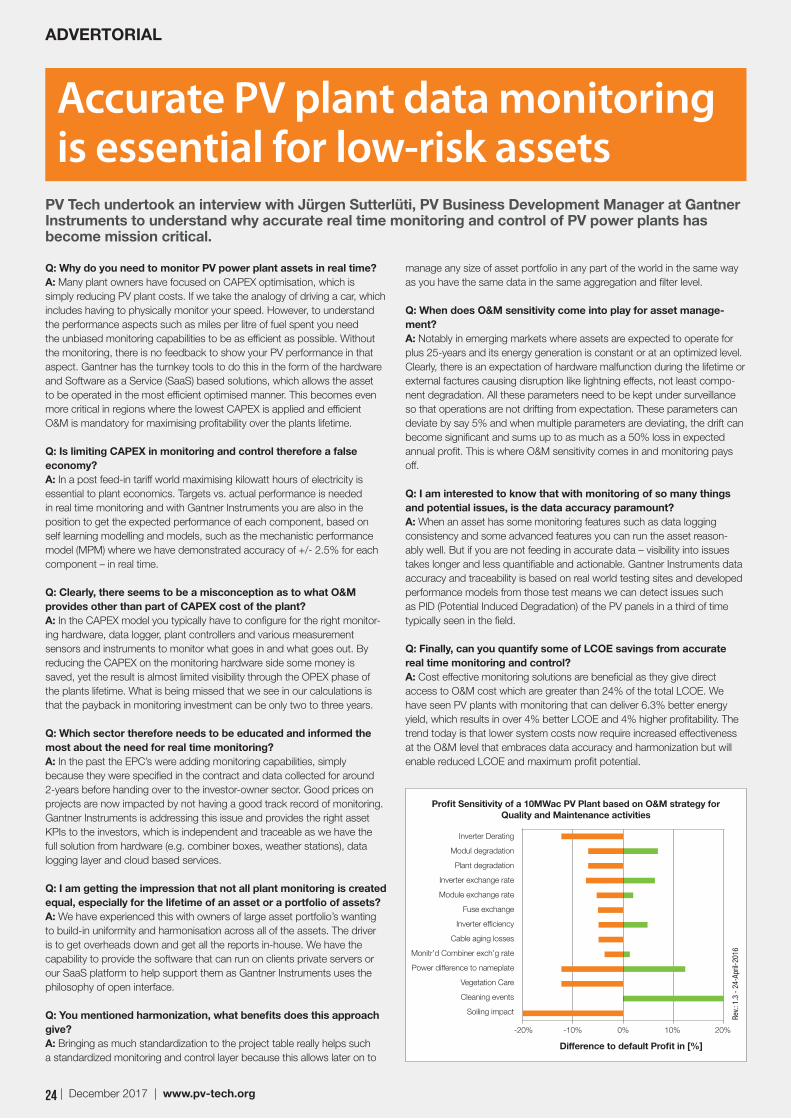
24 | December 2017 | www.pv-tech.org
Q: Why do you need to monitor PV power plant assets in real time?
A: Many plant owners have focused on CAPEX optimisation, which is
simply reducing PV plant costs. If we take the analogy of driving a car, which
includes having to physically monitor your speed. However, to understand
the performance aspects such as miles per litre of fuel spent you need
the unbiased monitoring capabilities to be as efficient as possible. Without
the monitoring, there is no feedback to show your PV performance in that
aspect. Gantner has the turnkey tools to do this in the form of the hardware
and Software as a Service (SaaS) based solutions, which allows the asset
to be operated in the most efficient optimised manner. This becomes even
more critical in regions where the lowest CAPEX is applied and efficient
O&M is mandatory for maximising profitability over the plants lifetime.
Q: Is limiting CAPEX in monitoring and control therefore a false
economy?
A: In a post feed-in tariff world maximising kilowatt hours of electricity is
essential to plant economics. Targets vs. actual performance is needed
in real time monitoring and with Gantner Instruments you are also in the
position to get the expected performance of each component, based on
self learning modelling and models, such as the mechanistic performance
model (MPM) where we have demonstrated accuracy of +/- 2.5% for each
component – in real time.
Q: Clearly, there seems to be a misconception as to what O&M
provides other than part of CAPEX cost of the plant?
A: In the CAPEX model you typically have to configure for the right monitor-
ing hardware, data logger, plant controllers and various measurement
sensors and instruments to monitor what goes in and what goes out. By
reducing the CAPEX on the monitoring hardware side some money is
saved, yet the result is almost limited visibility through the OPEX phase of
the plants lifetime. What is being missed that we see in our calculations is
that the payback in monitoring investment can be only two to three years.
Q: Which sector therefore needs to be educated and informed the
most about the need for real time monitoring?
A: In the past the EPC’s were adding monitoring capabilities, simply
because they were specified in the contract and data collected for around
2-years before handing over to the investor-owner sector. Good prices on
projects are now impacted by not having a good track record of monitoring.
Gantner Instruments is addressing this issue and provides the right asset
KPIs to the investors, which is independent and traceable as we have the
full solution from hardware (e.g. combiner boxes, weather stations), data
logging layer and cloud based services.
Q: I am getting the impression that not all plant monitoring is created
equal, especially for the lifetime of an asset or a portfolio of assets?
A: We have experienced this with owners of large asset portfolio’s wanting
to build-in uniformity and harmonisation across all of the assets. The driver
is to get overheads down and get all the reports in-house. We have the
capability to provide the software that can run on clients private servers or
our SaaS platform to help support them as Gantner Instruments uses the
philosophy of open interface.
Q: You mentioned harmonization, what benefits does this approach
give?
A: Bringing as much standardization to the project table really helps such
a standardized monitoring and control layer because this allows later on to
manage any size of asset portfolio in any part of the world in the same way
as you have the same data in the same aggregation and filter level.
Q: When does O&M sensitivity come into play for asset manage-
ment?
A: Notably in emerging markets where assets are expected to operate for
plus 25-years and its energy generation is constant or at an optimized level.
Clearly, there is an expectation of hardware malfunction during the lifetime or
external factures causing disruption like lightning effects, not least compo-
nent degradation. All these parameters need to be kept under surveillance
so that operations are not drifting from expectation. These parameters can
deviate by say 5% and when multiple parameters are deviating, the drift can
become significant and sums up to as much as a 50% loss in expected
annual profit. This is where O&M sensitivity comes in and monitoring pays
off.
Q: I am interested to know that with monitoring of so many things
and potential issues, is the data accuracy paramount?
A: When an asset has some monitoring features such as data logging
consistency and some advanced features you can run the asset reason-
ably well. But if you are not feeding in accurate data – visibility into issues
takes longer and less quantifiable and actionable. Gantner Instruments data
accuracy and traceability is based on real world testing sites and developed
performance models from those test means we can detect issues such
as PID (Potential Induced Degradation) of the PV panels in a third of time
typically seen in the field.
Q: Finally, can you quantify some of LCOE savings from accurate
real time monitoring and control?
A: Cost effective monitoring solutions are beneficial as they give direct
access to O&M cost which are greater than 24% of the total LCOE. We
have seen PV plants with monitoring that can deliver 6.3% better energy
yield, which results in over 4% better LCOE and 4% higher profitability. The
trend today is that lower system costs now require increased effectiveness
at the O&M level that embraces data accuracy and harmonization but will
enable reduced LCOE and maximum profit potential.
Accurate PV plant data monitoring is essential for low-risk assets
ADVERTORIAL
PV Tech undertook an interview with Jürgen Sutterlüti, PV Business Development Manager at Gantner Instruments to understand why accurate real time monitoring and control of PV power plants has become mission critical.
24 | December 2017 | www.pv-tech.org
Profit Sensitivity of a 10MWac PV Plant based on O&M strategy for
Quality and Maintenance activities
Rev.:
1.3
- 24
-Apr
il-20
16
Inverter Derating
Modul degradation
Plant degradation
Inverter exchange rate
Module exchange rate
Fuse exchange
Inverter efficiency
Cable aging losses
Monitr’d Combiner exch’g rate
Power difference to nameplate
Vegetation Care
Cleaning events
Soiling impact
-20% -10% 0% 10% 20%
Difference to default Profit in [%]

Intelligent Solutions for eff ective O&M and lowest PV production cost
String, Data, SCADA level Worldwide commissioning & service
Monitoring and Control of Utility Scale Photovoltaic Systems
Gantner Instruments Environment Solutions GmbHGermany | Austria | China | France | India | USA | Latin America | MENA www.gantner-environment.com

26 | December 2017 | www.pv-tech.org
cover story SPECIAL REPORT: Next-generation inverters
power to a low-voltage 600V (AC), before it is stepped back up
by the transformer. Each of those stages result in voltage losses
of several percent, so eliminating the low-voltage AC stage of the
power conversion process Geng says would be a big breakthrough
for the industry.
“You want to be able to break through the 600V (AC) limit
so you can step up to 1,500V from the PV array directly to the
medium voltage, so you break through the limit of the ideal
block size,” he says. “You don’t need to worry about ok, is it
going to be 4MW or 2.5MW, because you don’t have to worry
about running a 600V [AC] cable all over the place or a 1,500V
cable all over the place; instead you can run a 10kV or 20kV DC
cable across the fi eld, rather than run a lot of AC cable across in
the fi eld. So there’s a huge reduction in of cost in the cabling.”
Figure 1 (previous page) shows a schematic diagram of what
such an innovation would look like.
Whether or not that happens depends on numerous factors,
many on them based on the appetite at a policy and regulatory
level for such a big change to the status quo. But on the technol-
ogy side, the advent of high-voltage, low-cost
silicon carbide could also be a key enabler in
driving such an advance, Geng believes.
“Silicon carbide is an enabler for optimising and
improving the entire balance of plant,” he says.
“There’s a 10kV silicon carbide device coming into
fruition; that single device will help to signifi cantly
simplify the topology required to go to a medium
voltage type of architecture so you can easily use
a 10kV device and traditional two-level topology
to create the AC output at around 6.6kV or 7.2kV.
If you use a three-level topology with a 10kV
device you can easily convert that into a 13.8kV or
something in that range. So you don’t have to go
through the low voltage stage anymore.”
Such a progression of course remains within the
realm of speculation for now. But as Geng points
out, the evolution of PV power plant technology
has already surpassed expectation, with many
believing that even the previous jump from 600
to 1,000VDC was pushing the envelope, let alone
the 1,000V to 1,500V that has since come around.
It would be an unwise gambler, therefore, to bet
against the next big leap forward being too far
ahead.
“No one knows when there will be a unique
development,” Geng says. “It’s not just the inverter
manufacturers, it’s the developers and EPCs
and key component suppliers; it’s the whole
supply chain all the way from the top down. Any
breakthrough in any area could lead to a complete
architectural change in solar plants.”
Geng’s view is that this transition, if it happens at all, is a long
way off yet. This is due not only to the massive implications it has
in terms of component supply chains but also because moving to
medium voltage on the DC side of a plant would require specially
qualifi ed medium-voltage technicians, signifi cantly pushing up the
cost of operations and maintenance.
Over the next two years Geng believes there will be no “funda-
mental change” in inverter technology, rather a steady lowering of
costs and incremental improvements in performance and reliabil-
ity. He predicts 1,500V will see ongoing geographic expansion
beyond Europe and the US into pretty much all the world’s growth
solar markets – India, Australia, Mexico, MENA.
Beyond that, out to something like fi ve years from now, Geng
says it will be a “diff erent story”. “The PV inverter we’re looking at
right now is going to be a lot diff erent in fi ve years,” he says.
One major development on the horizon will be the likely shift
from silicon to silicon carbide componentry in inverters.
“The shift to fi ve-level topology is using current semiconduc-
tor devices and putting a more sophisticated level of topology
to improve the power and reduce the cost,” Geng says. “But with
silicon carbide, it will help simplify the topology because it can
switch a lot faster, has much less switching losses. So silicon
carbide will help to increase the effi ciency as well as reduce the
cost, providing that the price of silicon carbide devices will drop
low enough.”
A shift to high-power silicon carbide technology could also
pave the way for innovation on the AC side of power plants, Geng
believes. Currently, 1,500VDC inverters step down the output
“Any breakthrough in any area could lead to a complete architec-tural change in solar plants”
Cre
dit
Sun
gro
w

27 www.pv-tech.org | December 2017 |
cover storySPECIAL REPORT: Next-generation inverters
With the advent of today’s
modernising grid, it becomes
imperative that standards,
codes and deployment guidelines improve
and advance in parallel with the integra-
tion of photovoltaic (PV) energy storage
systems and the increased levels of
distributed generation. In the United States
alone, there are several hundred thousand
miles of high-voltage transmission lines
carrying electricity between the three
major power grids: the Eastern Intercon-
nection, the Western Interconnection and
the Texas Interconnected system, and
additionally there are several million miles
of local distribution power lines. To date,
the US Department of Energy (DOE) has
invested more than US$100 million dollars
in an effort to advance the US power grid’s
resiliency [1]. Though overall improve-
ments were necessary due to aspects such
as ageing infrastructure and population
growth, many advancements are also the
result of PV technology, energy storage
systems and increased distributed genera-
tion being integrated into the grid.
Naturally, these changes made
advanced inverter technology both impor-
tant and necessary to help ensure contin-
ued grid reliability. As always, with many
changes come a range of considerations
that need to be addressed to effectively
understand, align and harmonise proto-
cols, standards and certifications because
codes and standards vary internationally
and by state or local jurisdiction.
Traditionally, testing and certification
regimes tackled inverters from the safety
perspective. Most traditional UL equip-
ment safety standards evaluate functionali-
ty, electrical hazards, fire hazards, mechani-
cal hazards and verification of electrical
ratings. All of these hazards are evaluated
and tested under both normal and foresee-
able abnormal conditions. Standards, such
as UL 1741, offer a means to determine
that inverters and other renewable energy
power conversion electronics:
• Are constructed per common industry
requirements;
• Can be installed in accordance with US
codes;
• Can be operated per industry-specific
required ratings;
• Perform safely under rated normal
worst-case conditions;
• Perform safely under foreseeable abnor-
mal operating conditions and failure
modes.
At the advent of PV generation, when the
percentage of energy generated via PV
was still quite low, the grid interconnec-
tion requirements were based on a “get
out of the way” approach, meaning the PV
inverters and other distributed generation
equipment would go offline if the grid
voltage or frequency transitioned outside
the ranges of normal operation. However,
as the grid faces ever increasing penetra-
tion of PV generation, that approach is
reaching the limits of its usefulness.
The original utility interconnection
requirements of IEEE 1547 Edition 1
state that DG devices must cease output
current if grid instability conditions occur;
however, utilities with high percentages of
distributed generation are moving to new
enhanced functionality to reinforce grid
stability and the new technology required
to accommodate this change must be able
to operate safely in this new environ-
ment. A new methodology, designed to
support the unique attributes of a grid
that includes PV and works to minimise
fluctuations to enhance grid stability was
required.
Updating UL 1741 for an interna-
tional audience
In 2014, an updated UL Standard, UL
62109, represented a significant step
forward in harmonising PV power conver-
sion equipment safety requirements with
an international perspective. As a result,
this standard is now the US harmonised
version of the international PV power
conversion standard IEC 62109, which
was originally based on UL 1741. Utilities
and authorities having jurisdiction (AHJs)
require distributed generation that is
reliable, safe, compatible with the require-
ments of the National Electrical Code (NEC)
and has been tested and constructed to
withstand the rigours of daily, full power
operation under harsh electrical and
environmental conditions.
While the UL 1741 and UL 62109
standards address many similar concerns,
there are also key differences. UL 1741
was written to cover all forms of distrib-
uted energy (DE)/distributed generation
(DG) source types, whereas UL 62109
was written specifically for PV applica-
tions (including specific requirements for
battery-based energy storage) while also
anticipating and addressing the connec-
tion of other (non-PV) energy sources.
Unlike UL1741, IEC 62109-2 addresses
the specific requirements for PV inverters
but specifically excludes grid intercon-
nection requirements. The UL 62109-2
draft standard being developed will
reference UL 1741 for grid interconnection
requirements as many US electric utility
commissions require a UL 1741 certifi-
Certification | As inverter technology advances in step with the development of the smart grid, so too are testing and certification regimes. Tim Zgonena of UL looks at how standards are evolving to ensure inverters are keeping up with the demands of a rapidly modernising power network
Advanced testing for smart inverters
Inverter testing
is becoming
increasingly
rigorous
Cre
dit
UL
LLC
201
7

28 | December 2017 | www.pv-tech.org
cover story SPECIAL REPORT: Next-generation inverters
cation for grid interactive PV inverters.
National differences in the US/UL versions
of IEC 62109 allow products to be brought
into the U.S. market with little redesign
and retesting required, while still allowing
compliance with U.S. NFPA 70 National
Electric Code (NEC) requirements. Many of
the challenges of increased growth in PV
generation have been addressed by the
development, expansion and use of the UL
1741 and UL 62109 standards.
Necessary updates to UL 1741
‘Grid support interactive’ inverters, often
referred to as ‘advanced ‘or ‘smart’ inverters,
are the future of smart grids and improved
energy distribution, and the advanced
inverter movement is now in full force.
Worldwide solar power rose by a stagger-
ing 76GW in 2016, with the US and China
leading the charge by almost doubling
the solar added in 2015 [2]. In recognition
of this growth and the growing need to
address the changing landscape in the US
market, UL published its long anticipated
update to UL 1741, Standard for Inverters,
Converters, Controllers and Interconnection
System Equipment for Use With Distributed
Energy Resources, in the autumn of 2016.
Supplement SA for grid support utility
interactive inverters and converters was
published as a 60-page addition to the UL
1741 2nd Edition base standard to address
safety concerns and performance needs
of inverters that perform critical stabilising
functions during abnormal grid events in
lieu of tripping off line to get out of the
way. To help strengthen smart grids and
support their broader use, the UL 1741
Supplement SA specifies test methods that
evaluate an inverter’s ability to take action
in accordance with specific utility defined
performance criteria to help the utility grid
stay within normal operating conditions,
(hence the term “smart”).
The intended next stage for grid
support/advanced inverter functionality
will allow electric utilities to intelligently
control DG equipment to maximise grid
reliability and flexibility. This feature is the
foundation of the smart grid and the future
of energy distribution with increasing
amounts of DG. Both California and Hawaii
(which runs on its own independent grid
run by Hawaiian Electric Company, HECO)
mandated advanced inverter functionality
and the need to comply with these new
requirements, raising the bar for grid inter-
connection in the US by establishing the
need for new grid support inverter testing
and certification requirements.
The new UL 1741 Supplement SA
addresses this need and is the result of 19
months of work from a diverse panel with
representatives from the inverter industry;
electric utilities in California, Hawaii and
Arizona; Sandia National Laboratories;
National Renewable Energy Laboratory
(NREL); Electrical Power Research Institute
(EPRI); and other labs. Supplement SA is
built on UL 1741 and specifies the test
methods required to evaluate compliance
with an electric utility ‘source requirement
document’ (SRD) for limits and parameter
settings.
Due to the high amount of PV and
wind generation installed in California
and Hawaii, these states first took action
and expanded their grid interconnection
requirements to improve power genera-
tion, efficiency and environmental impact.
California’s Electric Tariff Rule 21 (Rule 21)
and Hawaiian Electric HECO 14H are SRDs
that were written to define the specific grid
interconnection requirements for these
utilities and both can be evaluated using
the requirements and tests in the UL 1741
Supplement SA even though it was not
written exclusively for either market. For
example, Arizona and other markets in the
United States are making progress with
green energy and grid modernisation and,
as progress continues, further SRDs may be
added. In addition to the technical require-
ment changes in California Rule 21 and
Hawaiian Electric 14H, both also include
a deadline for all inverters to be certified
“listed” as a UL 1741 Supplement SA “Grid
Support Interactive Inverter” for all new
installations as of 7 September 2017.
Currently, UL 1741 SA contains both
required and optional tests. Required tests
are listed and described below, using the
language from the standard:
• Low/High Voltage Ride Through.
Testing determines how the inverter
responds to low and high grid voltage
excursions that are deemed abnormal.
Ride through response behaviours
include Momentary Cessation, Permis-
sive Operation, or Mandatory Operation.
• Low/High Frequency Ride Through.
Testing determines how the inverter
responds to low and high frequency
grid excursions that are deemed abnor-
mal. Ride through response behaviours
include Momentary Cessation, Permis-
sive Operation, or Mandatory Operation
and Trip.
• Ramp Rate (Normal & Soft-Start).
Testing confirms the inverter’s ability to
ramp smoothly from one power level to Cre
dit
UL Figure 1. Some of the standard test protocols specified in
UL 1741 SA. From top: voltage ride through; frequency
ride through; volt/Var; frequency watt; volt watt
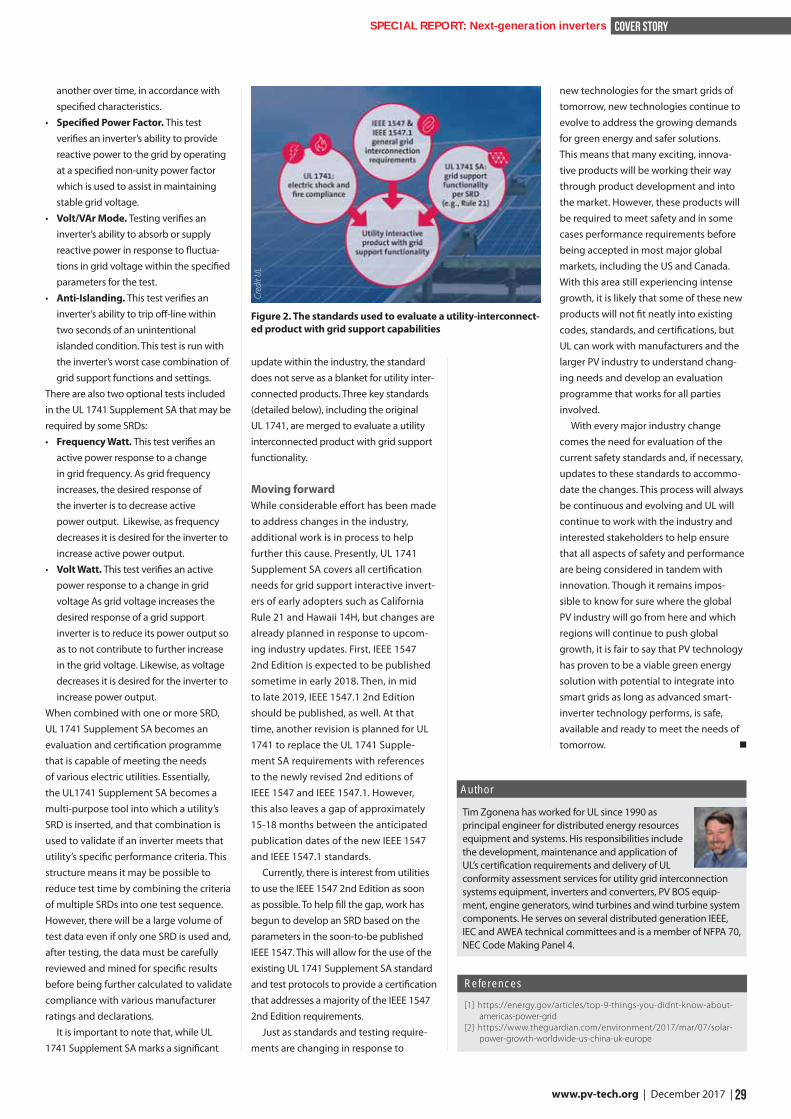
29 www.pv-tech.org | December 2017 |
cover storySPECIAL REPORT: Next-generation inverters
[1] https://energy.gov/articles/top-9-things-you-didnt-know-about-
americas-power-grid
[2] https://www.theguardian.com/environment/2017/mar/07/solar-
power-growth-worldwide-us-china-uk-europe
References
another over time, in accordance with
specified characteristics.
• Specified Power Factor. This test
verifies an inverter’s ability to provide
reactive power to the grid by operating
at a specified non-unity power factor
which is used to assist in maintaining
stable grid voltage.
• Volt/VAr Mode. Testing verifies an
inverter’s ability to absorb or supply
reactive power in response to fluctua-
tions in grid voltage within the specified
parameters for the test.
• Anti-Islanding. This test verifies an
inverter’s ability to trip off-line within
two seconds of an unintentional
islanded condition. This test is run with
the inverter’s worst case combination of
grid support functions and settings.
There are also two optional tests included
in the UL 1741 Supplement SA that may be
required by some SRDs:
• Frequency Watt. This test verifies an
active power response to a change
in grid frequency. As grid frequency
increases, the desired response of
the inverter is to decrease active
power output. Likewise, as frequency
decreases it is desired for the inverter to
increase active power output.
• Volt Watt. This test verifies an active
power response to a change in grid
voltage As grid voltage increases the
desired response of a grid support
inverter is to reduce its power output so
as to not contribute to further increase
in the grid voltage. Likewise, as voltage
decreases it is desired for the inverter to
increase power output.
When combined with one or more SRD,
UL 1741 Supplement SA becomes an
evaluation and certification programme
that is capable of meeting the needs
of various electric utilities. Essentially,
the UL1741 Supplement SA becomes a
multi-purpose tool into which a utility’s
SRD is inserted, and that combination is
used to validate if an inverter meets that
utility’s specific performance criteria. This
structure means it may be possible to
reduce test time by combining the criteria
of multiple SRDs into one test sequence.
However, there will be a large volume of
test data even if only one SRD is used and,
after testing, the data must be carefully
reviewed and mined for specific results
before being further calculated to validate
compliance with various manufacturer
ratings and declarations.
It is important to note that, while UL
1741 Supplement SA marks a significant
update within the industry, the standard
does not serve as a blanket for utility inter-
connected products. Three key standards
(detailed below), including the original
UL 1741, are merged to evaluate a utility
interconnected product with grid support
functionality.
Moving forward
While considerable effort has been made
to address changes in the industry,
additional work is in process to help
further this cause. Presently, UL 1741
Supplement SA covers all certification
needs for grid support interactive invert-
ers of early adopters such as California
Rule 21 and Hawaii 14H, but changes are
already planned in response to upcom-
ing industry updates. First, IEEE 1547
2nd Edition is expected to be published
sometime in early 2018. Then, in mid
to late 2019, IEEE 1547.1 2nd Edition
should be published, as well. At that
time, another revision is planned for UL
1741 to replace the UL 1741 Supple-
ment SA requirements with references
to the newly revised 2nd editions of
IEEE 1547 and IEEE 1547.1. However,
this also leaves a gap of approximately
15-18 months between the anticipated
publication dates of the new IEEE 1547
and IEEE 1547.1 standards.
Currently, there is interest from utilities
to use the IEEE 1547 2nd Edition as soon
as possible. To help fill the gap, work has
begun to develop an SRD based on the
parameters in the soon-to-be published
IEEE 1547. This will allow for the use of the
existing UL 1741 Supplement SA standard
and test protocols to provide a certification
that addresses a majority of the IEEE 1547
2nd Edition requirements.
Just as standards and testing require-
ments are changing in response to
new technologies for the smart grids of
tomorrow, new technologies continue to
evolve to address the growing demands
for green energy and safer solutions.
This means that many exciting, innova-
tive products will be working their way
through product development and into
the market. However, these products will
be required to meet safety and in some
cases performance requirements before
being accepted in most major global
markets, including the US and Canada.
With this area still experiencing intense
growth, it is likely that some of these new
products will not fit neatly into existing
codes, standards, and certifications, but
UL can work with manufacturers and the
larger PV industry to understand chang-
ing needs and develop an evaluation
programme that works for all parties
involved.
With every major industry change
comes the need for evaluation of the
current safety standards and, if necessary,
updates to these standards to accommo-
date the changes. This process will always
be continuous and evolving and UL will
continue to work with the industry and
interested stakeholders to help ensure
that all aspects of safety and performance
are being considered in tandem with
innovation. Though it remains impos-
sible to know for sure where the global
PV industry will go from here and which
regions will continue to push global
growth, it is fair to say that PV technology
has proven to be a viable green energy
solution with potential to integrate into
smart grids as long as advanced smart-
inverter technology performs, is safe,
available and ready to meet the needs of
tomorrow.
Tim Zgonena has worked for UL since 1990 as
principal engineer for distributed energy resources
equipment and systems. His responsibilities include
the development, maintenance and application of
UL’s certification requirements and delivery of UL
conformity assessment services for utility grid interconnection
systems equipment, inverters and converters, PV BOS equip-
ment, engine generators, wind turbines and wind turbine system
components. He serves on several distributed generation IEEE,
IEC and AWEA technical committees and is a member of NFPA 70,
NEC Code Making Panel 4.
Author
Figure 2. The standards used to evaluate a utility-interconnect-
ed product with grid support capabilities
Cre
dit
UL

Market watch
30 | December 2017 | www.pv-tech.org
Despite the ‘must-run’ status of
renewable energy generation in
India, now enshrined in national
electrical grid codes, curtailment has
still hit several states and many wonder
whether enough is being done to accom-
modate the huge projected additions of
solar and wind capacity in the coming
two years. At a roundtable of more than
30 CEOs at the recent REI Expo in Delhi, it
was noted that India is in a massive excess
power supply situation, albeit temporary,
and that the distribution companies
(discoms) are unclear whether they
still need to procure renewable energy
generation. Many have tipped energy
storage to come to the rescue for any
grid integration troubles, but there’s still
no policy on storage. While the issues are
clearly well known to the government, it
can appear at times that both the govern-
ment and the various solar developers are
ploughing on with new capacity, without
enough tangible action on these transmis-
sion constraints.
To give an indication of just how impor-
tant the issue is for the solar sector and
the central government’s goals, Dr. Rahul
Walawalkar, executive director of the India
Energy Storage Alliance (IESA), says: “Based
on our interactions with the concerned
authorities it is clear that grid constraint is
the most important challenge that could
prevent India from meeting the 100GW by
2022 target.”
Government awareness
At an early stage, the government started
working on ‘green energy corridors’ to
transmit solar from renewable energy-rich
states to areas of high power demand
such as the big cities. It also freed up
energy trading by waiving inter-state
transmission charges. There are two
phases of these green energy corridors,
says Pankaj Batra, who oversees planning
around integration of renewables into the
grid at the Central Electricity Authority
(CEA). One is complete to a large extent,
while the second one is being imple-
mented.
However, this infrastructure does not
benefit every solar PV project. Ministry
of New and Renewable Energy (MNRE)
secretary Anand Kumar has stated publicly
that India is well aware of the challenge
of intermittent power in the renewables
sector and thus the government is now
also looking to focus on hybrid systems
and improving forecasting and scheduling
rules, but perhaps most tellingly, Kumar
called out for international partners to
come in and show India the way on grid
management.
There is clearly, therefore, admission of
the issue at a government level, also signi-
fied by the fact it has already conducted
a number of studies, including one in
partnership with the US-based National
Renewable Energy Laboratory (NREL)
a few months ago, says Vinay Rustagi,
managing director, Bridge to India. There
have also been talks about the Ministry of
Power developing a 15-point agenda plan
to deal with transmission and distribution
issues etc.
“So all that is very positive,” adds
Rustagi. “But I think the tsunami is going
to reach us before most of these things
become operational and effective.”
Discom tactics
Discoms and the transmission companies
do have many reasons to hide behind if
they cannot absorb this new renewable
energy generation.
“In the past in India, the way the grid
has been balanced has been either by way
of by load shedding – if demand is too
high, you cut down the customers – or if
the generation is too high, you cut down
the suppliers without compensating.
That has been the historical practice and I
Grid | Curtailment of PV generation is an increasingly common phenomenon in India as the country’s solar capacity expansion outstrips the grid’s ability to accommodate it. Tom Kenning reports on efforts being made to address the problem and the role storage could play in providing a solution
India’s ‘head in the sand’ over solar grid integration challenges
India’s grid is
struggling under
the weight of
new capacity
additions from
solar and windC
red
it To
m K
enn
ing


Market watch
32 | December 2017 | www.pv-tech.org
think not enough attention is being paid
even today in anticipation of the actual
capacities that are coming up and how
those issues are going to be resolved,”
adds Rustagi.
“It’s head in the sand right now,” adds
Kuljit Singh, partner, transaction advisory
services at consultancy EY. However,
Singh also says there have been changes
in the competitive bidding guidelines,
which provide that if a solar developer is
confronted with grid issues, it can receive
a form of deemed generation benefi t,
so power purchase agreements (PPAs)
become more like take-or-pay PPAs.
However, Singh notes that this still
exposes some of the earlier projects to the
problem.
For example, Indian conglomerate
Adani went public on an early project,
by submitting a petition to the regula-
tor in the state of Tamil Nadu claiming
that power produced from its 648MW
Kamuthi solar project was being curtailed.
In this case, the discom was likely to have
been put off by the high tariff of around
7 rupees per unit (US$0.107), and solar’s
must-run status was clearly fl outed.
Referring to the general lack of urgency
on grid issues, Rustagi says: “This is unfor-
tunately a classic Indian way of operating
both for the public and the private sector.
Everybody is focused on the here and
now because there are always enough
challenges and frustrations and enough
problems to deal with, and there are very
few people actually thinking about how
this is going to play out.”
For Rustagi, it was clearly visible when
multiple solar tenders were coming out in
2014 and 2015 that India could not actual-
ly sustain such a large amount of capacity
and this has been partly the reason for the
current and ongoing hiatus in solar tender
issuance in India, while some old tenders
have even been cancelled.
“It is a typical Indian syndrome that
people are focusing on auctions, execu-
tion and fi nancing, because curtailment is
not a problem here and now, but we see
that as a major issue that is going to come
up in the next two to three years.”
Southern states
The crunch point will be most felt in
southern India, whose states have the
highest penetration of renewable energy,
but the lowest power demand.
“Historically the southern grid in India
has been isolated from the rest of the
Indian grid and it was very congested, so
in that last two years curtailment for the
wind sector in Tamil Nadu was as high as
30%,” says Rustagi. “Now that situation
improved last year and it may improve
even more, because a lot of investment
has gone into the southern grid, but I
think it is inevitable that as renewable
capacity rises, more and more curtail-
ment risk will continue to occur.”
Other aff ected states include Rajasthan
in the north west and Madhya Pradesh
in central India. Together with the south,
these states could soon have around
30-40% of their total power demand
coming from renewables, which is a huge
percentage coming from intermittent
and unpredictable sources, says Rustagi.
This makes the issue far more complex
than simply adding green corridor and
transmission capacity. The key is being
able to absorb that power and it will need
a lot of policy-level reform, particularly
in making the power demand itself more
resilient and fl exible.
“It means a lot of ancillary market
reforms in terms of making coal and gas
more fl exible. Progress on all those fronts,
including on the storage front, is actually
much slower than we would have expect-
ed it to be given how fast the renewables
sector is growing,” adds Rustagi.
What can developers do?
To prevent or alleviate these grid
troubles, developers can be selective
in their project locations. They need to
examine how the project is connected
to the grid, whether it is a state grid or a
national grid and at what voltage level,
and whether it is a high- or low-tension
grid. Rustagi says all these can have a
huge impact on the risk of curtailment.
“Some developers are already quite
smart on these things,” adds Rustagi. “So
you will fi nd developers who are selling
power only to NTPC of SECI [state-owned
off -takers], they are connecting only to
the national grid. If you are in a solar park
connecting right at the power grid substa-
tion at, let’s say’ 765kV etc. then your risk
of curtailment is almost minimal barring
some technical defaults. So there are ways
in which the developers can manage,
mitigate and minimise that risk.”
Unfortunately, not every developer is
as savvy; there a dozen large developers
who know the market well, but there are
“literally hundreds of developers of all
sizes across India”, says Rustagi. Multi-
ple fi rms are building 1-10MW projects
and many do not have the capability to
mange this grid integration risk.
Must-run
Curtailment is a cause of major apprehen-
sion for any solar developer, but the new
bidding guidelines, mentioned earlier,
have off ered some hope in that respect
Pankaj Batra of the CEA says that the
fi nancial implications of purchasing solar
and wind are working in their favour as it
now makes economic sense for discoms
to purchase this renewable energy, since
the prices have come down so low in
comparison to thermal power.
The ‘must-run’ concept remains largely
on paper, but is not enforced. Madhya
Pradesh has already announced inten-
tions to remove the must-run status
and it remains unclear just how much
protection developers have from discoms
fl outing the rules.
“It does look likely that more and
more states will over a period of time say
that must-run status is not practically or
technically feasible and we have to sched-
ule all this power and it has to go through
some kind of common grid dispatch
norms,” adds Rustagi.
At a recent IESA meeting in Delhi, the
CEA also discussed the potential for bring-
ing the leeway for forecasting inaccuracy
down from 15% to 5%. This is just an idea
at the moment, but while it presents
a challenge to solar plant operators, it
would also help the cause of the discoms
Cre
dit
MN
RE
Green energy corridors have been devised to ease pressure on
the grid from renewables capacity additions
Market watch
3 - 4 JULY 2018Singapore
Key 2017 speakers included:
SUNSEAP GROUPLawrence Wu, Founder & Director
SENAKessara ThanyalakparkDeputy Chief Executive
Offi cer
INFRACO ASIAAllard Nooy, CEO
ARMSTRONG ASSET MANAGEMENT
Andrew Affl eck, Founder
fi nanceasia.solarenergyevents.com [email protected]
Key agenda topics for 2018 summit
• Regional investment strategy for PV from debt and equity providers: expected returns, attracting lower cost of capital, secondary market activity, quality assurance and deal fl ow prediction for 2017-2018
• Understand the private PPAs marketplace: creditworthiness, offtakers’ key drivers, fl oating to fi xed rates, offsite vs onsite
• How to structure bilateral agreements in pre-FiT countries
• Energy storage business case: revenue stacking, retrofi ts and the impact on pre-existing PPAs, export/import charges and TSO/DSO perspectives
• How to attract fi nance to island microgrid solutions combing PV, diesel gen-sets and BESS
This event aims to connect fi nanciers and investors in solar PV as well as energy storage and microgrid with developers in the Asia Pacifi c region.
in balancing the grid. Moreover, it would
also pave the way for energy storage
providers to integrate their systems with
solar plants to help ease sudden power
fluctuations and improve forecasting
abilities (see box). However, such a
policy will ultimately need the backing
of the Central Electricity Regulatory
Commission (CERC). It is CERC that lays
down the guidelines to be adopted by
states, but states also have the freedom
to accept or reject CERC guidelines.
If grid constraints do really start
to impact the sector, the resolve
prime minister Narendra Modi has for
progressing solar is so huge – for him it
is a pet project – that one can imagine
drastic action will be taken. It’s still not
clear just how much disruption the
industry will face in the meantime, but
India has the advantage of being able
to learn from the mistakes of mature
solar markets, such as Germany. And
if anyone heeds the calls from MNRE
secretary Kumar, India may well get a
much needed boost of expertise from
foreign grid management experts to get
to grips with what is clearly an increas-
ingly pressing issue.
Dr. Rahul Walawalkar, executive director of the India Energy Storage Alliance (pictured), discusses the
on-going debate about mandating storage with large-scale solar projects and the current status of
storage in India
“The Central Electricity Authority (CEA) committee formulating these regulations believes mandating
storage with solar/wind is an option for the long run. In addition, ancillary services market regulations are expected to be
formalised in due course and energy storage assets can play a crucial role in the space. The Central Electricity Regulatory
Commission (CERC) has released a staff paper on energy storage-related regulatory changes, and is expected to release
the final approach paper before end of the year.
“The Solar Energy Corporation of India (SECI) last year even released a request for proposals for six projects for solar
plus 10% storage to demonstrate the advantages of hybrid projects. The Indian renewable energy industry has also
realised this and is exploring hybrid solutions with energy storage that can offer more sustainable and scalable solutions
in India.
“Unfortunately current regulatory mechanisms and the focus on lowest cost reverse bid-based auctions have created
a challenge in implementing this. Under current regulations, solar power projects are deemed must-run plants and
hence they can’t be backed down by the utilities for any reason including grid constraints. Although backing down of
generation is clearly visible in some parts in recent times the developers are banking on the regulations to bail them out.
Also there is too much focus on just building additional transmission capacity, and not sufficient effort is provided on
improving flexibility of the system and improving utilisation of the T&D infrastructure.
“Nearly 50MWh of energy storage projects are under auction in India. A few developers did evaluate the feasibility of
setting up battery pack assembly to cater to this market. The solar industry is playing a wait and watch game to decide on
back-end assembly/manufacturing or partnering with international suppliers to cater to this demand.
“The global energy storage industry is actively looking at the Indian market and has already deployed over 1GWh of
li-ion based solutions in India in the past two years for the telecom tower market. This year, various Indian manufactures
such as Acme, Delta and Exicom have set up >1GWh annual assembling capability for manufacturing li-ion packs. Also
the anticipated electric vehicle market has resulted in multiple global players considering li-ion cell manufacturing
in India as well. Suzuki has announced the first gigawatt-scale cell manufacturing plant to be built in Gujarat and we
anticipate that with the right policy support at least two such manufacturing plants will be announced in next six
months.
“We anticipate that India could get at least 3-5GWh annual cell manufacturing capacity by 2020. In the meantime,
India will continue to be a large importer for advanced energy storage solutions.
“The recent solar power project tenders have created a strong interest among solar developers towards energy
storage. The interest is likely to sustain in the near future. IESA has witnessed very strong interest from solar developers,
and over 20 such companies including Sterling & Wilson, Hero Future Energies, Vikram Solar are part of IESA and are
actively developing capabilities in this area.”
Storage to the rescue

Market watch
34 | December 2017 | www.pv-tech.org
Many emerging solar markets of
the past two years have been
characterised by headline-
grabbing bids that trigger very diff erent
responses.
The mainstream liberal press uniformly
herald that solar has beaten coal on
price. Optimists within the solar industry
herald another milestone in its develop-
ment. Sceptics, or realists, depending on
your own viewpoint, will question how
the project will be delivered at that cost
without any direct subsidy.
One project that followed this trajec-
tory was the 1.2GW Sweihan plant in Abu
Dhabi. Bids for the project, submitted in
September 2016, were all under US$0.037/
kWh with a consortium of Jinko Solar and
Japanese conglomerate Marubeni winning
out with a bid of US$0.0242/kWh.
The facility is being delivered for the
emirate’s utility, the Abu Dhabi Water and
Electricity Authority (ADWEA).
To answer the question of how such
a project can be delivered, we spoke to
Keith Symmers, project director at Sterling
& Wilson, the engineering, procurement
and construction (EPC) fi rm charged with
the task of delivering one of the world’s
largest single-site solar farms at a hugely
competitive rate.
“Local attitudes for the project are very
supportive,” he says. “Land grants and
project sponsorship by ADWEA helps to
put an offi cial stamp on the project. That
said, the local municipality (Al Ain, Abu
Dhabi, UAE) is the agency with jurisdiction
on all permitting, with no shortcuts given.
Once design is complete, permitting steps
take four to eight weeks.”
The project is considered part of the
UAE’s wider economic objectives to free
up oil for export, create local jobs and
decarbonise its electricity generation
while meeting soaring demand. But
anyone looking in from the outside should
be mindful of Symmers’ appraisal, “no
shortcuts”.
This is where external perspectives on
project development in emerging solar
markets can diverge from reality. There is
nothing new about state-owned utilities
freeing up land for infrastructure, particu-
larly in countries where land is readily
available. It makes perfect sense to trade
that land for a lower PPA. Many European
governments will be envious of the oppor-
tunity to trade land for low PPA prices
rather than the administrative and fi nancial
burden of legacy feed-in tariff s and clean
energy certifi cate schemes. The US, under
the previous administration, also sought to
open up government-owned land for solar
development.
Together ADWEA, Jinko Solar and
Marubeni have formed a project company
to act as an independent power provider
(IPP) and deliver on the PPA contract.
System design
With a targeted completion date in 2019,
S&W has the unique problem of deliver-
ing on a project so large that the technical
landscape for solar projects will have had
time to move on considerably from when
it was appointed in June 2017 to the fi nal
commissioning date.
From grading the site to component
selection, S&W is faced with the challenge
of maximising output with proven technol-
ogies while mitigating for the environment
the project will operate in.
“The land is greenfi eld desert in Abu
Dhabi. It is characterised as medium
density sand mixed with gatch, a clay-
rich sand, but some areas are hardened
sandstone. Sand dunes, around 8m high,
needed to be graded, with sand used as a
fi ll mixture in low areas as well as to backfi ll
buried cable trenches,” says Symmers.
Possibly with scale in mind, 1,500V(DC)
architecture was rejected with the wide
availability of 1,000V components winning
out.
“Structural design responsibility lies with
S&W. Design aspects are supported by
Krinner ground screws and a superstruc-
ture from Greencells. More than 300km of
cable is to be installed. Four separate cable
manufacturers are being used based on
adherence to standards, pre-approvals by
the utility, cost, manufacturing capacity,
transportation time, and adherence to our
delivery schedule.”
Symmers explains that the project has
been split into fi ve portions, with each of
those divided down into blocks.
“Four Ingeteam Sun 1165TL PowerMax
Project delivery | Abu Dhabi’s giant 1.2GW Sweihan PV plant made headlines last year for achieving a record low bid price. With construction well underway, Tom Kenning and John Parnell look at how the project is being executed
Delivering on record low PPAs
Cre
dit
Ster
ling
& W
ilso
n
Construction of
Sweihan is due
for completion in
2019

Market watch
35 www.pv-tech.org | December 2017 |
the support afforded to these projects,
be it subsidised grid connection or free
land, is a more solid foundation for a
low PPA than, for example, a strike price.
These bids, which either top up the rate to
match market prices or see the provider
reimburse the guarantor if market prices
move above the “strike price”, create
variable outlay, or income for the govern-
ments involved. The pitfalls of feed-in tariffs
have featured plenty on the pages of this
journal.
Critics point to the provision of land and
cheap finance as explanations of why these
prices are not market driven. Governments
and regulators are defining partners in
energy markets, however. That’s unlikely
to change while energy continues to be of
such huge strategic importance.
Complaining about these conditions,
or comparing the prices across borders,
where conditions vary greatly, is neither
productive nor warranted. Solar power is
of sufficient importance in a number of
emerging economies that governments
are offering the same sort of assistance that
as long been used to seed road building or
deep water ports or coal-fired generation.
The Sweihan project may not demon-
strate a route to US$0.272/kWh solar in
Germany, but with a focus on energy
density and tight control on logistics, you
can understand how the price can be made
to work under these conditions.
Understanding any eye-wateringly low
PV tariff requires a pragmatic consideration
of the project’s full context. Comparing
tariffs across borders is fruitless. Equally, so
is complaining about an energy invest-
ment receiving assistance from a host
government.
Over the border in neighbouring
emirate Dubai, its own state utility is
building a “clean coal” plant at what is
expected to be a global low for power
generation anywhere in the world. You
can be sure that concessions made to that
project, which again is a strategic choice to
diversify the fuel mix, are similar to those
Sweihan will receive.
In short, behind the tariffs, are the
details. Perceived cash-rich Gulf states are
not throwing good money after bad and
they are not treating solar as a low carbon
loss-leader. Speaking about Saudi Arabia’s
own record low tariffs (US$0.017/kWh), the
Saudi solar trade body said that “they do
not reflect private sector economic reality”.
With the energy industry so entrenched in
public sector policy, that might not be a fair
reality within which to judge solar’s lows.
B420 inverters are used in each block,” he
says. “Selection was based on suitability to
meet the functional specifications of the
project, company reputation, manufactur-
ing capacity, warranty terms, service level
agreement, and delivery schedule.”
According to Ingeteam’s own specifi-
cations, the B420 inverter has a recom-
mended array power of 1,178-1,513.2kWp,
meaning each block is somewhere
between 4.8 and 6MW.
The emphasis put on delivery schedules
goes some way to further explain the
choice of 1,000V architecture for a project
of the sort of scale that some may have
thought was a solid choice for 1,500V.
East-west
There are more surprises still when we look
at the site layout.
“We’re not using a tracker. Instead, an
east-west design, with half the panels
facing east at a five-degree tilt and half
facing west at the same tilt,” Symmers says.
It’s worth remembering how dramatical-
ly air-conditioning impacts on the demand
profile in the region compared to say, parts
of California, where the peak smoothing
of a single-axis tracker has become near
ubiquitous. The east-west option over
trackers could be partly to do with the
scale of this 1.2GW project. Even market
leader NEXTracker has installed 10GW in
its entire history and at the time of writing
stated that the largest single install was
“over 300MW”.
The density of the site is also interesting.
The project is one of abundance but it is
also one of economy.
“Aside from interior roads, there is no
gap on site larger than 1m. This design
maximises the energy density at this
latitude and region of the world,” says
Symmers.
This compact design is in part enabled
by the proposed robotic cleaning process.
This removes the need for wide channels
between the banks of arrays to accommo-
date vehicle-based cleaning. A waterless
system will be used for this. S&W has the
O&M contract for the first two years of
operation.
Less surprising is the use of modules
from consortium partner Jinko Solar. As
a partner, it is highly unlikely that Jinko’s
margin on the panels matches what a
third-party sale would generate, offering
yet more efficiencies. The selection of high-
power modules again highlights the issue
of energy density that seems to define
S&W’s approach.
“We are using Jinko Solar’s Eagle PERC
72 355-370W modules, approximately
3.3 million of them in total. They have
high reliability, bankability, manufactur-
ing capacity and high efficiency for the
constraints to maximise power given a set
project boundary,” explains Symmers.
The great unknowns
There are of course other factors that
contribute to the PPA price outwith the
system itself.
It is understood that a 1.6 multiplier will
be in place during the summer months
lifting the average annual PPA price to
something closer to US$0.29kWh over the
course of the year.
Financing details for the project are
relatively sparse, with a “syndicate of local
and international” banks involved. The
state utility will be considered a reliable
off-taker.
It is a safe assumption that ADWEA, as
a project partner, would also have drawn
highly favourable financing conditions,
from banks local and otherwise. Marubeni,
an US$11 billion company in its own right,
is also going to be able to attract beneficial
interest rates. Grid connection charges for
the plant, some 120km from Abu Dhabi,
are also likely to have been in some way
absorbed by the state.
Lows
Clearly not all low tariffs are created equal.
Be they in Mexico, India, Saudi Arabia or
the UAE, there is always more to the story
than the headline figures themselves. But
The land on which
Sweihan is being
built is predomi-
nantly clayey
sand and stone
Cre
dit
Ster
ling
& W
ilso
n

Market watch
36 | December 2017 | www.pv-tech.org
Once seen as a region guaranteed
to deliver higher solar project
returns than most other parts of
the globe, Southeast Asia’s margins are
beginning to feel the squeeze with greater
competition and the steady adoption of
auctions over subsidy support. As the more
mature market begins to grapple with the
post-subsidy era, this article looks at the
region’s competitive tendering activity and
where large-scale solar opportunities can
found amidst an apparent lull.
The case for solar remains strong in
Southeast Asia since power demand is still
growing rapidly in many of its markets,
but traversing the unique regulations and
policies of each country and knowing
which PV segment is most suitable remain
challenging.
In some countries, regulatory barriers
on the utility-scale side are pushing the
short-term opportunities into commercial
and industrial (C&I) rooftop solar, but there
are hopes for Malaysia where the market
is maturing with its Large-Scale Solar (LSS)
auction programme, and Vietnam with its
new feed-in tariff (FiT) for solar and wind.
Land remains a major issue, with
one analyst at the Solar and Off-Grid
Renewables Southeast Asia (SORSEA)
2017 conference in Bangkok, Thailand, in
November noting that getting 500-plus
hectares of contiguous plots of land is nigh
on impossible in the ASEAN region. As a
result, the corporate PPA market, mostly
in rooftop solar, which is not constrained
by land, looks set to fly, again excepting
some regulatory challenges. Meanwhile,
floating solar is the word on everyone’s
lips, with its much-hyped ability to bypass
the land constraint issue. The region is of
course, awash with bodies of water, from
hydro dams and thermal power ponds to
man-made reservoirs.
Ultimately, large-scale PV progress
is still limited and the industry will be
hoping for an uptick in activity over
the next 12 months, particularly as the
capacities tendered so far have been tiny
in comparison to the size and population
of the countries involved. Indeed, Abhishek
Rohatg, a Bloomberg New Energy Finance
(BNEF) analyst notes that Southeast Asia
is “far behind” other regions in auctioned
capacity, while also having “comparatively
higher” risks.
Many criticisms of utilities being reluc-
tant to open up to renewables have been
aired, although some including Meralco
of the Philippines and TNB of Malaysia are
pursuing renewables projects, which is
seen as positive sign. Others such as PLN
of Indonesia, are seen as “not having any
money”, which is a major drawback for
budding solar developers.
Thailand’s latest cooperative utility-scale
programme is winding down and the
Philippines has PPAs of all forms stuck at
the regulator’s office. But perhaps Malaysia
Region update | Southeast Asia’s PV markets are entering a post-subsidy phase, creating numerous policy and regulatory challenges for developers. But, as Tom Kenning heard at November’s Solar and Off-Grid Renewable Southeast Asia event in Bangkok, there are still plenty of opportunities
Land, bankability and regulation - Southeast Asia’s solar snags
The ‘SaCaSol’ PV
power plant in
the Philippines.
Southeast Asia’s
solar markets
face numerous
regulatory barri-
ers
Cre
dit
Kan
ad
au
rlau
ber
/Wik
imed
ia C
om
mo
ns

Market watch
37 www.pv-tech.org | December 2017 |
will push on with a third round of its LSS
auctions and the big question marks
around the highly promising Vietnamese
market could start to get answered; if
Vietnam’s much touted multi-gigawatt
pipeline – one government official recently
put the figure at 17GW – actually goes
from development into construction,
then the industry might start to change
its attitude towards the solar PPA, whose
parameters have taken a battering in the
media due to its infamous off-taker and
curtailment risks. This would make Vietnam
a bastion of strong project returns in the
region due to the attractive subsidy, which
is set to continue up until 2019, while
most other markets have culled their FiT
programmes.
Thailand
With its large-scale solar ambitions
constricted to a complex co-operative
scheme, the other major hope for develop-
ers in Thailand is the country’s recently
announced hybrid ‘firm’ PPA scheme, which
seeks to encourage energy storage being
coupled with large-scale renewable energy
projects to generate a fixed output from
each system.
This tender had been four to five times
oversubscribed, says Dave Edmonds, vice
president, business, IMI Group, which
demonstrates a high level of interest, but
it’s not clear yet whether these projects
will be able to offer notable returns to
investors.
Meanwhile, Franck Constant, founder
and CEO of Constant Energy, says that
corporate PPAs, particularly in solar
rooftops, are set to boom over the next
three to five years in Thailand, as well as
much of the rest of the region. Despite
current rules preventing such solar systems
from feeding power back into the grid,
significant power savings can already be
offered to large corporates, without even
the benefit of net metering regulations.
Philippines
The Philippines has gone from a FiT at
US$0.17/kWh in early 2016 to a Competi-
tive Selection Process (CSP) resulting in
US$0.058/kWh as the lowest price this year.
It is one of the first countries in the region
to grapple with the post-subsidy era.
Leandro Leviste, CEO of developer
Solar Philippines, says the CSP wining
price undermined claims of developers
that regulation and policy support were
needed to grow the PV industry, but not all
developers can take this merchant risk and
Leviste admits that many developers have
either stopped or left the Philippines due
to regulatory barriers, such as the backlog
of permit approvals at the Energy Regula-
tory Commission (ERC).
However, he also says: “This price should
set a benchmark for the region, where
high land costs, moderate irradiance and
relatively high interest rates had previously
led others to believe that Southeast Asia
prices would remain higher than other
regions.”
Carlos Gatmaitan, chairman of MRC
Allied, points out that the Wholesale
Electricity Spot Market (WESM) is a
welcome backup option to the regulated
market for PV generators, and he notes
that the demand for electricity per capita
in the Philippines is rising at around 7%
each year, which means solar should have
a role to play to fill the gap between supply
and demand.
Referring to the restriction of 40%
foreign ownership on Filipino projects,
Allard Nooy, CEO of Singapore-based
InfraCo Asia Development, says that the
Philippines has a number of credible
partners available to alleviate the issue –
adding: “The liquidity in the market is very
high. It’s got a pretty deep debt market at
the moment, therefore usually internation-
al financing is not required, which helps,
but in terms of being restricted to 40% you
are able to get around that on a number of
different arrangements.”
Malaysia
Malaysia’s second round LSS auction
results are due to be released soon, and
they are widely expected to hit new lows
for the country, having been heavily
oversubscribed.
The auctions are due to procure up to
250MW each year to reach 1GW by 2020,
says Dr Azhar Abd Rahman, project direc-
tor of the renewables division at major
utility TNB. This makes it one of the only
ASEAN markets with active large-scale
tendering activity at present. Rahman says
securing a partnership is a difficult task and
it is important to build up a presence in the
market to succeed. He also hints that prices
are continuing to go down.
However, Akmal Samah, COO of
Malaysia’a Sustainable Energy Develop-
ment Authority (SEDA), the body which
conducts the auctions, says that many of
the incumbent energy firms and utilities
have been reluctant to accept renew-
able energy. There have been no serious
technical issues so far, but he warns that as
capacity closes in on 1GW that could create
“some resistance” from the utilities.
The nation will also be hoping that the
second auction does not see a repeat of
the first, in which several projects have
not gone ahead. The most high profile of
these was a 50MW(AC) project by Malakoff,
whose approval was withdrawn after a
change in location.
The SEDA representative admits that
the authority could have tightened its
selection process in the early stages of
its original FiT programme as well. Just
520MW of renewable energy capacity has
been built so far out of 1.4GW that had
been approved. SEDA has in fact been
under pressure to cancel some of these
approvals for delayed projects and to give
the quota to other developers who are
more ready and experienced to conduct
these projects.
Vietnam
Vietnam is now set to offer some of the
best returns in the region, with the intro-
duction of a generous US$0.0935/kWh
FiT for projects completed by June 2019
drawing many developers to the market.
The government is also considering
auctions beginning in 2020, once the FiT
comes to an end, says Dr Tuan Nguyen
Anh, Renewable Energy Centre, Institute
of Energy, at the Ministry of Industry and
Trade (MOIT).
Nguyen gives the usual Vietnamese
government line by announcing bombas-
tic pipeline figures and claiming “huge”
levels of interest from international devel-
opers, despite negligible reported action
on the ground.
He says MOIT will also have completed a
solar PV assessment study by January 2018.
Land is already seen as a major constriction
for solar in Vietnam, with conflicts looming
in the agricultural and forestry sectors.
PPA parameters are still a major concern,
although Nguyen says that a kind of ‘take-
or-pay’ PPA is being discussed, which could
comfort some developers.
Dispute resolution and curtailments
are inadequately addressed in the PPA,
says Allard Nooy, however, in terms of the
off-taker risk with the monopoly utility,
EVN, he offers a refreshing alternative to
the huge negativity around the issue to
date, using his previous experience with
EVN on other power projects.
“EVN is not a very creditworthy
organisation – that’s absolutely true,” he
says. “But the fact of the matter is that on
foreign invested IPPs they have never ever

Market watch
38 | December 2017 | www.pv-tech.org
defaulted on a PPA. And given our most
recent experience with a hydro project,
they have paid us in the last 18 months
every month on the dot. So our experience
has been actually quite good for EVN.”
Indonesia
Indonesia targets 5GW of solar by 2020
in its National Development Plan, but the
utility PLN has come up with a 10-year
plan, which more or less disregards solar.
However, it does have an ongoing tender
out, with a ceiling price of US$0.07/kWh.
This has been criticised for being unreason-
ably low by some developers, says Leandro
Leviste, but despite this, at least 120 devel-
opers still applied to the tender.
Stefan Robertsson, senior advisor at
economic consultancy the Lantau Group,
says that there is “no doubt” the country
will have plenty of solar deployment in the
long term, but in the short term it is easy
to be “cautiously pessimistic”. The financial
difficulties of PLN remain the key barrier,
and the current minister appears very
focused on keeping costs down for PLN,
rather than raising electricity prices and
making solar more viable.
“You have basically very poor regula-
tion that goes back to the tariff setting in
Indonesia,” Robertsson adds.
He says the upcoming bid for 160MW in
Sumatra could add some momentum, but
this will depend on what tariffs come out
of it and whether the awards get dragged
out over a period of time. There are plans
for a second tender for around 80MW in
Kalimantan, but Robertsson says these
capacities are very small in comparison to
the size of Indonesia.
“For the next one to three years there
will be progress, but it will be limited
progress,” he adds. “In the end it’s very
much tied to the economics. There’s very
little financial support or financial incen-
tives above tax credits from the govern-
ment.”
Andre Susanto of Bluejay Energy offers
a similar perspective: “The biggest issue
is PLN doesn’t have any money. They
only have two income streams which is
revenue from households and C&I clients
and government subsidy, which is given
directly to PLN.”
Unless the consumer tariff is raised
to provide PLN with more money, he
says, then the larger-scale PV progress
will remain stuck, but he did praise the
country’s progress in micro-grid deploy-
ment over the last 12 months.
Emerging markets
Cambodia, Laos and Myanmar have
tended to trudge behind other ASEAN
markets in solar progress. But there are
signs of progress with major utility-scale
solar park plans for Cambodia in partner-
ship with the Asian Development Bank
(ADB) starting to take shape and a tender
earmarked for June 2018, work beginning
on a 220MW solar plant in Myanmar and
talk of huge floating solar potential in Laos.
Cambodia was praised for its openness
to foreign investment, but is still seen as
risky. Kenneth Stevens, managing director
of Leopard Capital, says: “A country like
Cambodia, which is still a cowboy kind of
place – Wild West – is open to foreigners
coming in and open to foreigners doing
it, sometimes too much. They expect the
ADBs to pay for the roads, to pay for the
power, the IFCs [International Finance
Corporation] to come in and do their
thing...”
Nevertheless, as a AAA-rated body, ADB
has the power to capitalise on first-of-kind
projects across the region, such as the
10MW PV plant with Sunseap in Cambo-
dia. The bank has also worked on rooftop
investments in Thailand, is pursuing
large-scale projects in Myanmar and is in
discussions over floating solar in Laos, says
Pradeep Tharakan, senior energy specialist,
ADB.
Rooftop solar in Cambodia is currently
under threat, however, as a draft regulation
has been issued that has brought uncer-
tainty over the legality of both completed
and new PV projects, without a newly
introduced permit.
Floating PV
Floating solar is making its mark across
the globe and Southeast Asia looks set to
become a major market, after pioneer firm
Ciel & Terre announced manufacturing
plans in Thailand and Vietnam as well as
more progress in Malaysia.
ADB’s Tharakan says: “There’s always
a downside that comes along with [new
power sources] and in solar it is land.
Arable land is in short supply in Southeast
Asia and so it’s going to be hard to find
hundreds and hundreds of acres each time
to build these plants.”
Due to these constraints, floating PV
opportunities were cited for almost every
Southeast Asian market during the SORSEA
conference, particularly on hydro dams.
The Solar Energy Research Institute of
Singapore (SERIS) is also pioneering with
the world’s largest test centre for floating
solar. As it happens, Singapore contin-
ues to have a burgeoning rooftop solar
industry, but as a market remains restricted
by land.
In the long term, Southeast Asia still
shines as a major opportunity for solar PV
and in the meantime, the off-grid sector
can capitalise on the huge number of
islands and un-electrified populations,
where major grids make less sense. Overall
progress in the next 12 months could
largely come down to regulators. Perhaps a
good summary of the current predicament
of the industry came from one delegate
at SORSEA, discussing the Philippines,
who said: “The GDP is growing and power
demand is growing, which is perfect for
solar, but there’s nothing we can do about
the regulations.”
Cre
dit
Cie
l et T
erre
Hopes are high that floating solar plants will overcome Southeast Asia’s land constraints

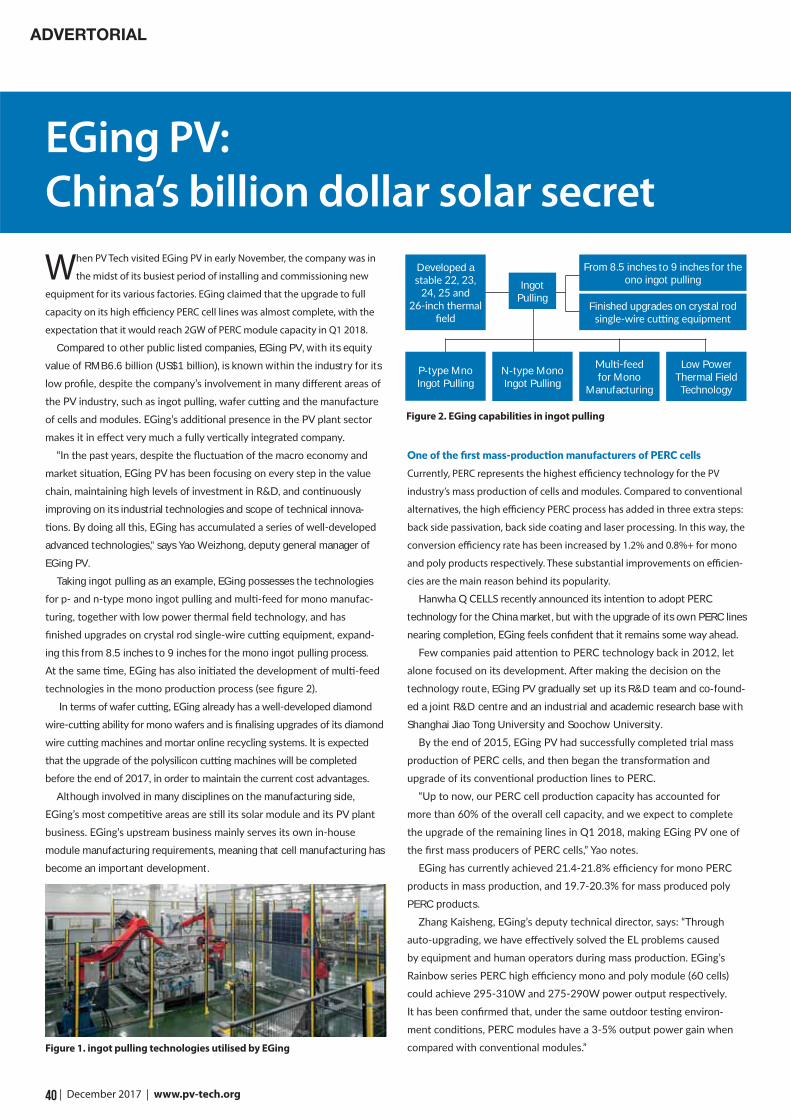
| December 2017 | www.pv-tech.org40
When PV Tech visited EGing PV in early November, the company was in
the midst of its busiest period of installing and commissioning new
equipment for its various factories. EGing claimed that the upgrade to full
capacity on its high efficiency PERC cell lines was almost complete, with the
expectation that it would reach 2GW of PERC module capacity in Q1 2018.
Compared to other public listed companies, EGing PV, with its equity
value of RMB6.6 billion (US$1 billion), is known within the industry for its
improving on its industrial technologies and scope of technical innova-
advanced technologies,” says Yao Weizhong, deputy general manager of
EGing PV.
Taking ingot pulling as an example, EGing possesses the technologies
-
-
ing this from 8.5 inches to 9 inches for the mono ingot pulling process.
Although involved in many disciplines on the manufacturing side,
module manufacturing requirements, meaning that cell manufacturing has
become an important development.
Currently, PERC represents the highest efficiency technology for the PV
industry’s mass production of cells and modules. Compared to conventional
alternatives, the high efficiency PERC process has added in three extra steps:
back side passivation, back side coating and laser processing. In this way, the
conversion efficiency rate has been increased by 1.2% and 0.8%+ for mono
and poly products respectively. These substantial improvements on efficien-
cies are the main reason behind its popularity.
technology for the China market, but with the upgrade of its own PERC lines
technology route, EGing PV gradually set up its R&D team and co-found-
ed a joint R&D centre and an industrial and academic research base with
Shanghai Jiao Tong University and Soochow University.
PERC products.
-
EGing PV:
China’s billion dollar solar secret
ADVERTORIAL
Figure 1. ingot pulling technologies utilised by EGing
Developed a
Finished upgrades on crystal rod
From 8.5 inches to 9 inches for the ono ingot pulling
P-type Mno Ingot Pulling
N-type Mono Ingot Pulling for Mono
Manufacturing
Low Power Thermal Field Technology
Ingot Pulling
Figure 2. EGing capabilities in ingot pulling


| December 2017 | www.pv-tech.org42
Besides PERC technology related developments, EGing PV simultane-
ously began research into and investment on the following process study
EGing PV’s module products have benefited from the company’s approach to
research in the cell area, and EGing has made significant progress. In recent
years, EGing has successfully achieved mass production, making full use of
its technical advancements in the areas of tape frame importing, half-cut,
multi-busbar modules, p-type modules with double sided cells, double-glass
module frame tape, reduced thickness double-glass modules and hotspot
free modules. All these technologies substantially reduce the damage rate
during production, installation and transportation of modules, and effectively
increase their power output and reliability. By lowering module costs, the
dual goal of cost reduction and increased efficiency has been achieved.
In the area of bifacial/glass-glass modules, EGing has completed
upgrades and improvements in its p-type PERC cell and module
-
ment future in areas such as distributed systems, water surface applica-
-
-
-
materials, processes and products, processing hundreds of pieces of
In 2010, EGing PV introduced a module production line with the world’s
highest automation level, with a nameplate of 500MW. It was installed and
commissioned in the first half of 2011, setting what was then the world
record for the highest automation level and capacity of a module production
line, leading the company, well ahead of the rest of the industry, into the PV
4.0 era.
-
-
Figure 3. High-efficiency cell production line
Figure 4. Janus II modules

43 www.pv-tech.org | December 2017 |
financial, legal, professionalTechnical Briefing
PV power plants have high initial
costs that can be a barrier to
development. New PV power
plant procurement worldwide increas-
ingly relies on a tender process
involving reverse auctions for purchase
power agreements (PPA) contracts. The
resulting low price should place high
importance on oversight due diligence
to minimise risks to financial stakehold-
ers.
Whereas this is often scrupulously
observed for administrative and legal
issues, the technical component of this
oversight is often less developed. It
may also be noted that tenders have
little if any commonalities and, most
disconcerting, currently technical due
diligence is neither standardised nor
based on standard definitions within
the industry.
We present two new avenues: 1)
presenting project risk transparency
to financial markets for competitive
pricing on financing, financial guaran-
tees, insurance and surety for improved
bankability; and, 2) correspond-
ing strengthening of technical due
diligence for new projects to be built
and to facilitate existing projects with
change of ownership and re-financing.
Status quo of PV system expenses
from financial markets
The lender and financial markets
currently underwrite projects by coordi-
nating the various information and
analytical assessments from multiple
stakeholders in the given project. The
coordination requires aggregating
data from different sources, each with
their own nuanced treatment of data
that requires manual interpretation,
manual processing and data entry into
systems. Each of the components from
the financial markets that impact the
financial cost of project development
likewise aggregate data from different
sources; again each of these has its own
particular nuances as regards interpre-
tation and entry into industry-specific
systems to generate premiums, fees and
interest charges.
Figure 1 depicts a highly simplified
view of a project lifecycle, showing a
typical US project flow and tranche
assignments. All ‘up’ arrows represent
minor (small arrows) and major (large
arrows) transfers of funds, a “tranche”.
The list of reports and documents may
be neither necessary nor complete for
each milestone.
The role of independent
engineering reports
Independent engineers (IE) provide
unbiased and impartial evaluations,
reviews and assessments as part of the
due diligence process during various
phases of the PV plant life cycle. IEs use
a combination of technical, financial
and other necessary information and
Technical due diligence | PV plant data reported to stakeholders has hitherto lacked consistency. Christos Monokroussos, Matthias Heinze, K. Dixon Wright and Mark Skidmore report on efforts by the IECRE to harmonise the information being reported to investors, regulators and others over a project’s life cycle
Towards standardisation
in PV plant reporting
Figure 1. Plant
life cycle and due
diligence

44 | December 2017 | www.pv-tech.org
financial, legal, professional Technical Briefing
data to assess the performance metrics
that help stakeholders gain confidence
and may be required as part of their
fiduciary responsibilities. IE activi-
ties may be required at each life cycle
milestone. IE involvement may be
continuous at intervals or at specific
instances (e.g. continuous monitoring,
warranty reviews, yearly performance
audits, damage assessments). Independ-
ent engineering’s principal object is the
PV plant, but all components are poten-
tially a target of IE scrutiny. IEs may
exercise oversight in all phases of plant
life cycle as required by stakeholders.
Figure 2 shows how IECRE due diligence
in-process reporting would be struc-
tured from a value-chain perspective.
Of special concern is that PV plants
rely on mass production of components,
making production, process and supply
chain-related quality assurance (QA)
services necessary as part of the due
diligence process prior to commission-
ing. In this context, it is important to
note that the standard IEC 62941 for
PV module production QA has recently
been released by the IECRE (IEC Renew-
able Energy).
The IECRE role and fundamental
principles
The IECRE is setting out to bring a
modicum of standardisation to the
process of due diligence assessments
in PV power plants (known as the IE
process). The status quo hitherto was
that those conducting IE work were
doing so at their own discretion. Not
only was nobody checking the checkers
but the process, the output, information
and data could be entirely undefined
and the resulting data could not be
interoperable – one measurement may
or may not compare to another.
As an example, buyers of stocks
or bonds would be oblivious that
the “capacity” of a PV power plant in
megawatts could mean a variety of
things; “capacity” in one statement
could mean something else in another.
The IECRE is ensuring that all
inspection and certification bodies are
subject to a strict peer review process
that verifies impartiality, competence,
accountability and transparency of the
data.
Figure 3 identifies stakeholders that
the IECRE is serving and the informa-
Figure 2.
In-process IECRE
reporting
Figure 3. Stake-
holders and data
needs
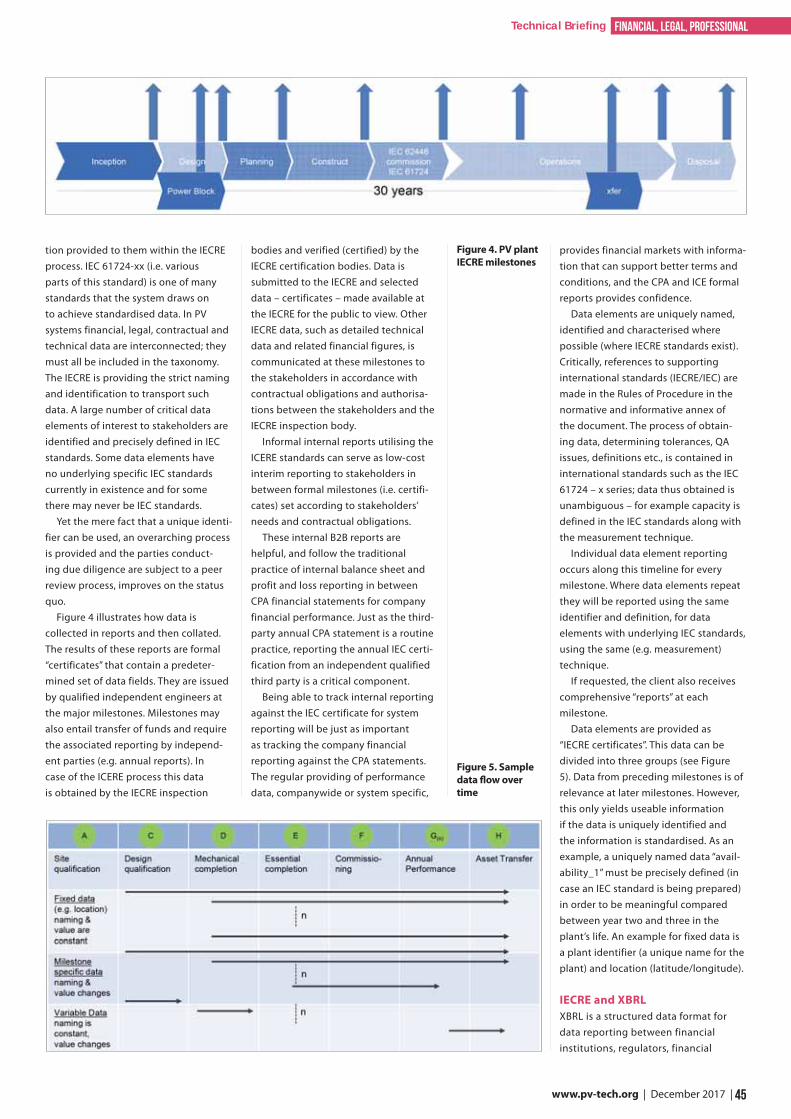
45 www.pv-tech.org | December 2017 |
financial, legal, professionalTechnical Briefing
tion provided to them within the IECRE
process. IEC 61724-xx (i.e. various
parts of this standard) is one of many
standards that the system draws on
to achieve standardised data. In PV
systems financial, legal, contractual and
technical data are interconnected; they
must all be included in the taxonomy.
The IECRE is providing the strict naming
and identification to transport such
data. A large number of critical data
elements of interest to stakeholders are
identified and precisely defined in IEC
standards. Some data elements have
no underlying specific IEC standards
currently in existence and for some
there may never be IEC standards.
Yet the mere fact that a unique identi-
fier can be used, an overarching process
is provided and the parties conduct-
ing due diligence are subject to a peer
review process, improves on the status
quo.
Figure 4 illustrates how data is
collected in reports and then collated.
The results of these reports are formal
“certificates” that contain a predeter-
mined set of data fields. They are issued
by qualified independent engineers at
the major milestones. Milestones may
also entail transfer of funds and require
the associated reporting by independ-
ent parties (e.g. annual reports). In
case of the ICERE process this data
is obtained by the IECRE inspection
bodies and verified (certified) by the
IECRE certification bodies. Data is
submitted to the IECRE and selected
data – certificates – made available at
the IECRE for the public to view. Other
IECRE data, such as detailed technical
data and related financial figures, is
communicated at these milestones to
the stakeholders in accordance with
contractual obligations and authorisa-
tions between the stakeholders and the
IECRE inspection body.
Informal internal reports utilising the
ICERE standards can serve as low-cost
interim reporting to stakeholders in
between formal milestones (i.e. certifi-
cates) set according to stakeholders’
needs and contractual obligations.
These internal B2B reports are
helpful, and follow the traditional
practice of internal balance sheet and
profit and loss reporting in between
CPA financial statements for company
financial performance. Just as the third-
party annual CPA statement is a routine
practice, reporting the annual IEC certi-
fication from an independent qualified
third party is a critical component.
Being able to track internal reporting
against the IEC certificate for system
reporting will be just as important
as tracking the company financial
reporting against the CPA statements.
The regular providing of performance
data, companywide or system specific,
provides financial markets with informa-
tion that can support better terms and
conditions, and the CPA and ICE formal
reports provides confidence.
Data elements are uniquely named,
identified and characterised where
possible (where IECRE standards exist).
Critically, references to supporting
international standards (IECRE/IEC) are
made in the Rules of Procedure in the
normative and informative annex of
the document. The process of obtain-
ing data, determining tolerances, QA
issues, definitions etc., is contained in
international standards such as the IEC
61724 – x series; data thus obtained is
unambiguous – for example capacity is
defined in the IEC standards along with
the measurement technique.
Individual data element reporting
occurs along this timeline for every
milestone. Where data elements repeat
they will be reported using the same
identifier and definition, for data
elements with underlying IEC standards,
using the same (e.g. measurement)
technique.
If requested, the client also receives
comprehensive “reports” at each
milestone.
Data elements are provided as
“IECRE certificates”. This data can be
divided into three groups (see Figure
5). Data from preceding milestones is of
relevance at later milestones. However,
this only yields useable information
if the data is uniquely identified and
the information is standardised. As an
example, a uniquely named data “avail-
ability_1” must be precisely defined (in
case an IEC standard is being prepared)
in order to be meaningful compared
between year two and three in the
plant’s life. An example for fixed data is
a plant identifier (a unique name for the
plant) and location (latitude/longitude).
IECRE and XBRL
XBRL is a structured data format for
data reporting between financial
institutions, regulators, financial
Figure 5. Sample
data flow over
time
Figure 4. PV plant
IECRE milestones

46 | December 2017 | www.pv-tech.org
financial, legal, professional Technical Briefing
markets, investors and other parties
that demand data consistency and
interoperability. Many public markets
require reporting in XBRL. IECRE data
identifiers and definitions have been
incorporated into the XBRL taxonomy
(see Figure 6) as part of the USA
Department of Energy-funded Orange
Button programme. All data generated
in the IECRE scheme can be presented
in XBRL format. The individual fields
in Figure 6 maybe not be visible but
the functioning of the IECRE system
should be visible (for further informa-
tion see www.xbrl.org). Note that the
IECRE releases only the smaller set of
certificate data to the public whereas
other data may be made available by
stakeholders in PV projects.
Surety as a risk management tool
in PV project financing
Surety bonds are financial products
similar to letters of credit except they
can respond to a default by providing
a cure. A letter of credit is often cash
collateralised due to its “on demand”
liquidity, leaving the beneficiary with
the responsibly for managing the
default and accountable for the use
of the funds drawn. The surety, on the
other hand, responds to a default by
working to cure the default, in collabo-
ration with the beneficiary, and relieves
the beneficiary from having to manage
the external aspects of the default by
tendering the problem to the surety.
By employing Surety Based Risk
Management, PV project owners
seeking financing can demonstrate
mitigated risk from contractor default
during construction, which can help
secure competitive pricing. Project
owners can also use surety bonds where
financial guarantees are required to
lessen the need for additional lender
financing through letters of credit.
Reduced credit requirements can
make it easier for lenders to provide
the capacity required for funding the
project.
The surety industry is active with
XBRL US and has been expanding
the XBRL taxonomy to incorporate
surety terms and definitions. XBRL
US is likewise active with the Orange
Button to expand the XBRL taxonomy to
incorporate IECRE 61724 data terms and
definitions.
With the surety industry, as with
other financial markets, able to lever-
age the XBRL taxonomy for high data
quality and reliable data exchange for
processing and administration of surety
risks, they will be able to streamline and
implement data analytics for underwrit-
ing, predictive analytics for risk mitiga-
tion and quantified, mutually accepted
data benchmarks for predicable claims
response.
Conclusion
The IECRE is providing a new stand-
ardised process to address the issue
of widely diverging tenders, RFQs and,
consequently, due diligence reports.
The IECRE provides process standardisa-
tion, a peer review process for the IECRE
inspection and certification bodies,
standardised data naming and defini-
tion for data along the entire PV plant
life cycle. Not only does this provide
for greater performance transpar-
ency, it is critical to the transactable
energy network of the future that, for
example, would employ blockchain
technology. Sophisticated financing
demands sophisticated, digital, timely,
well-defined and reliable data to meet
due diligence needs. Bank financ-
ing combined with Surety Based Risk
Management, with both leveraging
common IECRE data, enables improved
risk management, and reduced risk will
support more competitive terms and
conditions for PV asset financing.
Christos Monokroussos has 10 years of experience
in the field of PV research. His activities centre
on characterisation of solar cells, PV modules, PV
measurement systems and PV module reliability. He
is an active member in the IECRE. Christos earned
his doctorate degree in photovoltaics at Loughborough
University, UK. He is the director R&D in the TÜV Rheinland
Group solar and fuel cells business field.
Matthias Heinze has several decades of experience
in the field of PV plant qualification and monitoring,
laboratory module and component testing, perfor-
mance measurement and failure analysis. He is an
active member of the IECRE. Holder of a university
degree in engineering, Mr. Heinze serves as director business
development of TÜV Rheinland Group.
K. Dixon Wright is senior vice president at Wells
Fargo Insurance Services and leads the SGIP PAP25
for Harmonising Financial Data and the XBRL-CET
(Construction Energy Transportation) working
group to promote the use of data standards in the
solar, construction and surety industries.
Mark Skidmore has over 14 years’ experience in the
solar industry, and over 18 years’ experience in the
construction contracting industry. As a registered
professional electrical engineer, certified energy
manager, and NABCEP solar professional, Mr.
Skidmore also holds a university degree in mechani-
cal engineering and serves as solar plant services manager at
TÜV Rheinland Group in Tempe (USA).
AuthorsFigure 6. IEC data to XBRL reporting

47 www.pv-tech.org | December 2017 |
financial, legal, professionalTechnical Briefing
In 2015, estimated annual global volumes
of electronic waste (e-waste) reached
a record 43.8 million metric tons and
global e-waste generation is expected
to increase up to 50 million metric tons
by 2018 [1]. Even though solar PV panels
significantly differ from typical consumer
electronic products, global regulators
view PV panels increasingly in the context
of e-waste regulations. Solar PV currently
accounts for less than 1% of total annual
e-waste volumes. However, as PV deploy-
ment continues to grow exponentially,
cumulative PV waste is expected to amount
to 1.7 million-8 million metric tons by
2030, equivalent to 3-16% of total e-waste
produced annually today [2]. As global PV
demand increases and more modules and
systems reach the end of their useful life
over the next 10-15 years, recycling will
become increasingly important for all PV
technologies to ensure that clean energy
solutions do not pose a waste burden.
In addition to ensuring compliance
with evolving regulatory waste manage-
ment requirements, PV recycling offers an
opportunity to influence project economics
in an increasingly commoditised market.
As component prices continue to drop, the
financial provisions related to decommis-
sioning, collection and recycling become
more relevant to the levelised cost of
electricity (LCOE) for PV generation assets.
These provisions have to be taken into
consideration during PV project develop-
ment, site permitting and when putting
PV system components on the market (i.e.
PV modules, inverters, other electrical and
electronic products).
Voluntary and regulatory approach-
es to end-of-life management in
leading markets
In most countries, PV panels are classified as
general or industrial waste and managed in
accordance with general waste treatment
and disposal requirements [2]. Beyond
general waste regulation, voluntary and
regulatory approaches have been specifi-
cally developed for managing end-of-life
PV waste.
The European Union (EU) was the first
to adopt PV-specific waste regulations by
mandating the recycling of all solar panels
under the Waste Electrical and Electronic
Equipment (WEEE) Directive (2012/19/
EU). Since 2012, the provisions of the WEEE
Directive have been transposed into nation-
al law by the EU member states, creating
the first mandatory market for PV module
recycling. In the United States, PV panel
disposal is covered under the Resource
Conservation and Recovery Act, which is the
legal framework for managing hazardous
and non-hazardous waste. In 2016, the US
Solar Energy Industries Association (SEIA)
partnered with PV manufacturers and
installer-developers to voluntarily launch
a national PV recycling programme, which
aims to make affordable PV recycling
solutions more accessible to consumers [3].
In Japan, end-of-life PV panels are
covered under the general regulatory
framework for waste management (the
Waste Management and Public Cleans-
ing Act), which defines industrial waste
generator and handler responsibilities and
waste management requirements includ-
ing landfill disposal. In 2015, a roadmap
for promoting a scheme for collection,
recycling and proper treatment of end-of-
life renewable energy equipment was
developed, followed in 2016 by a guideline
promoting proper end-of-life treatment of
PV modules including recycling [2].
China has no PV-specific waste regula-
tions but has sponsored R&D on PV
recycling technologies through the National
High-tech R&D Programme for PV Recycling
and Safety Disposal Research under the
12th five-year plan. Directives for accelerat-
ing the end-of-life management of waste
PV modules are also expected in the 13th
five-year plan. In India, PV waste is managed
by the Ministry of Environment, Forest and
Climate Change under the 2016 Solid Waste
Management Rules and the Hazardous and
Other Wastes (Management and Trans-
boundary Movement) Rules [2].
Internationally, a new sustainability
leadership standard for PV modules (NSF
457) includes product end-of-life manage-
ment criteria covering take-back and
recycling.
PV recycling technology
In recent years, R&D projects on PV recycling
technology have been sponsored in Europe,
China, Japan and Korea, and there has
been significant patent activity for both
crystalline silicon (c-Si) and thin-film PV
module recycling technology in the same
regions as well as in the United States [4].
Recycling technology can be categorised as
either bulk recycling (recovery of high-mass
fraction materials such as glass, aluminum
and copper) or high-value recycling (recov-
ery of both bulk materials and semicon-
ductor and trace metals). Bulk recycling is
similar to existing laminated glass recycling
technology in other industries, and may
not recover environmentally sensitive
(e.g., Pb, Cd, Se) or valuable (e.g., Ag, In, Te,
solar-grade Si) materials in PV modules.
High-value PV recycling consists of three
main steps: pretreatment to remove the
metal frame and junction box, delamination
Recycling | The end-of-life handling of PV equipment is becoming an important element in the total life cycle costs of PV generation assets. Parikhit Sinha, Sukhwant Raju, Karen Drozdiak and Andreas Wade of First Solar look at the growing importance of PV recycling
Life cycle management and recycling of PV systems
Figure 1. High
value PV recycling
process steps

48 | December 2017 | www.pv-tech.org
financial, legal, professional Technical Briefing
to remove the module encapsulant and
recovery to extract glass and metals from
the module (Figure 1).
Some common goals in PV recycling
technology are to maximise recovery yields,
minimise impurities in the products of
recycling and minimise capital and operat-
ing costs to be competitive with other
disposal options. Ensuring worker safety
and environmental protection are addition-
al priorities that are implemented through
management systems such as OHSAS 18001
and ISO 14001, and air emissions controls
and wastewater treatment technology.
In addition to technology, other related
considerations that affect the viability of PV
recycling are effective collection schemes,
predictable waste volumes, customers for
the products of recycling and regulations on
the handling and transport of waste. These
factors can affect commercial decisions
on when and where to site PV recycling
facilities and whether to operate them
in a centralised or decentralised (mobile)
manner [5].
The recovery value of a PV module
PV panels typically consist of glass,
aluminum, copper and semiconductor
materials that can be successfully recovered
and reused at the end of their useful life
(Figure 2). By mass, today’s typical crystalline
silicon PV panels consist of approximately
76% glass, 10% polymer (encapsulant and
backsheet foil), 8% aluminium, 5% silicon
semiconductor, 1% copper (interconnec-
tors) and less than 0.1% silver (contact lines)
and other metals including tin and lead.
Thin-film CIGS and CdTe PV panels consist of
higher proportions of glass: 89% and 97%,
respectively [2].
Current PV waste volumes remain low
as modules have a lifetime of 25 years or
more. However, as global PV deployment
continues to grow and more modules
reach the end of their useful life over the
next 10-20 years, PV waste is set to increase
nearly 40-fold by 2030 under a normal loss
scenario, which assumes a 30-year module
lifetime. Leading solar markets includ-
ing China, the US, Germany, Japan and
India (Figure 3) are expected to represent
the majority of these projected PV waste
streams [2].
By 2030, the recoverable value from
recycling end-of-life PV modules is
estimated to amount to US$450 million. The
recovery value of glass alone has the poten-
tial to exceed US$28 million, assuming an
average secondary material market price
of US$30-50/mt depending on recovery
quality of the glass [6].
In Europe, the current raw material recov-
ery rate for recycling PV modules is 65-70%
by mass and is in line with the EU WEEE
Directive. CENELEC, the European Commit-
tee for Electrotechnical Standardisation,
has developed a supplementary standard
specific to PV panel collection and treat-
ment (EN50625-2-4 & TS50625-3-5) to assist
treatment operators. The standard specifies
various administrative, organisational and
technical requirements aimed at preventing
pollution and improper disposal, minimis-
ing emissions, promoting increased material
recycling and high-value recovery opera-
tions, and impeding PV waste shipments to
facilities that fail to comply with standard
environmental and health and safety
requirements. The standard includes
specific depollution requirements whereby
the content of hazardous substances in
output glass fractions shall not exceed the
following defined limit values:
• 1 mg/kg (dry matter) cadmium (Si-based
PV); 10 mg/kg (dry matter) cadmium
(non-Si-based PV)
• 1 mg/kg (dry matter) selenium (Si-based
PV); 10 mg/kg (dry matter) selenium
(non-Si-based PV)
• 100 mg/kg (dry matter) lead
The residual value of a PV system at
end-of-life
Decommissioning cost modelling
Decommissioning a PV system at end-of-life
involves dismantling and disposing of the
system. For utility-scale PV projects, local
permitting requirements often include
stringent decommissioning and land
remediation measures [7] [8]. These specify
disconnecting the project from the grid,
removing the installed features (modules,
trackers, electrical wire, inverters, trans-
formers, fencing, O&M building, etc.), and
recontouring and revegetating the land to
its preconstruction condition. For example,
the following utility-scale PV projects in the
US and Germany have decommissioning
plans containing detailed cost estimates for
dismantling, disposal and site restoration.
• Desert Stateline Solar Farm Project (300
MWAC
PV project in California) [7];
• Helmeringen I Solar Park (10 MWAC
PV
project in Germany) [8];
• Silver State South Solar Project (250 MWAC
PV project in Nevada) [9].
Costs from these and other representa-
tive projects can be aggregated and used to
model the present value of the net cost to
decommission a PV power plant (NDCPV):
where,
DCT + IC
T = Direct cost (labour, equipment)
and indirect cost of PV plant
de-installation, demolition,
recovery, and land reclamation
in year T.
MRT = PV module recycling cost in year
T.
LFT = Landfill disposal cost in year T,
including landfill tipping fees
and hauling, of non-salvageable
material.
SVT = Scrap value of steel, copper and
aluminum recovered during PV
solar field and power equip-
ment removal and sold to
recyclers at prices prevailing in
year T.
LVT = Value of reclaimed land in year T.
r = Rate of annual discount applied
to costs and revenues realised in
year T.
In order for net costs to be negative
(profitable), the scrap metal value and/
or land value must exceed the decommis-
sioning costs. In particular, there are large
quantities of steel, copper and aluminum in
PV power plants (Figure 4) associated with
mounting structures and electrical cables.
Recent economic analysis indicates that
the commercial scrap value of PV power
plant decommissioning (mainly associ-
Figure 2. Average
recoverable
material fractions
of PV Panels in
2030 based on [2]
Figure 3. Estimat-
ed cumulative PV
waste volumes
in leading solar
markets by 2030
and 2050 (regular
loss scenario) [2]

financial, legal, professionalTechnical Briefing
Returning for a 5th successive year, The Solar Finance & Investment Conference is fi rmly established as the must-attend event for developers, asset owners and debt providers involved in the European solar market.
Join us in 2018 to fi nd out about• Primary and secondary markets
• How to attract capital in a mature market
• Who owns European solar assets and how can you manage them?
• Who is buying and who is selling Europe’s 100GW of operational solar?
• What does a European developer need to know in emerging markets in order to be competitive?
30-31 JANUARY 2018London, UK
Secondary Markets | Zero Subsidy Solar | Corporate PPAs | European Tenders
fi nance.solarenergyevents.com [email protected]
ated with scrap steel and copper) exceeds
decommissioning costs, incentivising
recycling over disposal. Decommissioning
cost optimisation modelling by Fthenakis
et al. [11] estimated a net profit of up to
US$1.58 per module area. Monte Carlo
analysis by ERM [12] indicated 100% confi-
dence in a net profit from PV plant decom-
missioning when land value was included
and up to 95% confidence in a net profit
when land value was excluded, depending
on plant design scenarios such as above-
ground versus below-ground cabling.
High-value recycling scenarios in both
studies indicate opportunities to positively
influence project economics and the LCOE
of a given PV project, with net revenues of
up to US$0.01-0.02/W from project decom-
missioning (excluding land value).
First Solar’s first-generation
recycling technology was based on
the mining industry and involved
moving glass and liquid from process
to process with a modest 10 metric
tons per day capacity. In 2011, First
Solar developed its second-generation
recycling technology, which was
based on the chemical industry batch
process of circulating liquids within
scalable reactor columns (30 metric
tons per day capacity).
In 2015, First Solar developed its third-
generation recycling technology which
achieves superior glass and semicon-
ductor purity with reduced capital and
operating (chemicals, waste and labour)
costs. The continuous-flow process
improves the recycling efficiency and
throughput, increasing the plant’s daily
recycling capacity from 30 metric tons to
150 metric tons.
First Solar is proactively investing in
recycling technology improvements to
drive down overall PV waste collection and
recycling costs. By 2018, First Solar recycling
plants will have zero liquid waste discharge
and will convert most of the incoming PV
waste streams into valuable raw materials
for other industries.
Figure 4. Material
fractions of PV
power plants [10]
State-of-the-art: the First Solar recycling
process
In 2005, First Solar established the industry’s
first voluntary global module recycling
programme and has been proactively
investing in recycling technology improve-
ments and driving down recycling costs
ever since (figures 5-7). In contrast to
mechanical recycling processes which
focus on recovering major components
such as glass, copper and aluminum, First
Solar’s high-value recycling process is able
to recapture more materials while retaining
their maximum value so they can be reused
in new First Solar modules and new glass or
rubber products. First Solar’s state-of-the-art
PV recycling process recovers more than
90% of the semiconductor material and
approximately 90% of glass.

50 | December 2017 | www.pv-tech.org
financial, legal, professional Technical Briefing
Conclusions
The responsible life cycle management
of PV systems is not only becoming a
compliance requirement, e.g. in the
European Union where PV module
recycling is already mandated by the EU
WEEE directive, but also offers oppor-
tunities to positively influence project
economics and the LCOE of a given PV
project by leveraging cost-effective,
high-value recycling technologies. In
addition to creating value from second-
ary resources, PV recycling services help
de-risk the decommissioning and end-of-
life phase for PV asset owners.
Figure 5. First Solar’s first-generation recycling technology
based on the mining industry’s batch process
Figure 7. First Solar’s third-generation PV recycling technol-
ogy based on a continuous-flow process
Figure 6. First Solar’s second-generation recycling technology
based on the chemical industry’s batch process
[1] C. P. Baldé, F. Wang, R. Kuehr and J. Huisman, “The Global E-Waste Monitor”, United Nations
University, IAS-SCYCLE, Bonn, Germany, 2014.
[2] S. Weckend, A. Wade, G. Heath and K. Wambach, “End-of-Life Management: Photovoltaic
Panels”, International Renewable Energy Agency (IRENA), International Energy Agency
Photovoltaic Power Systems Program Task 12 (IEA PVPS Task 12), Abu Dhabi, Amsterdam,
2016.
[3] E. Butler, “SEIA National PV Recycling Program”, in Solar Power International, Las Vegas, 2016.
[4] K. Komoto and J. Lee, “End-of-Life Management of Photovoltaic Panels: Trends in PV Module
Recycling Technologies”, IEA-PVPS T12-10:2017, 2017.
[5] D. Ravikumar, P. Sinha, T. Seager and M. Fraser, “An anticipatory approach to quantify
energetics of recycling CdTe photovoltaic systems”, Prog. Photovolt: Res. Appl., vol. 24, pp. 735-
746, 2015.
[6] Eurostat, “Recycling – Secondary Material Price Indicator”, 2014. [Online]. Available: http://
ec.europa.eu/eurostat/statistics-explained/index.php/Recycling_%E2%80%93_secondary_
material_price_indicator#Glass.
[7] Desert Stateline, LLC; LSA Associates, Inc., “Closure, Decomissioning, And Reclamation
Plan - Stateline Solar Farm Project San Bernadino County, California”, U.S. Bureau of Land
Managment, Needles, San Bernadino County, California, USA, 2014.
[8] Schimpf, G. et.al.; Gehrlicher Solar AG, “Untersuchungen zum Recycling einer konkreten PV
Anlage”, Forum Solarpraxis, Berlin, Germany, 2011.
[9] Silver State Solar Power South, LLC; CH2MHill, “Facility Decommissioning Plan Silver State Solar
South Project”, Bureau of Land Management, Las Vegas, NV, USA, 2014.
[10] J. E. Mason, V. M. Fthenakis, T. Hansen and H. C. Kim, “Energy Payback and Life-cycle CO2
Emissions of the BOS in an Optimised 3.5MW PV Installation”, Prog. Photovolt: Res. Appl., vol.
14, no. 2, pp. 179-190, 2006.
[11] V. Fthenakis, Z. Zhang and J. Choi, “Cost Optimisation of Decommissioning and Recycling
CdTe PV Power Plants”, in Proc. IEEE PVSC, Washington D.C., 2017.
[12] A. Cates and R. Stifter, “PV Power Plant Net Decommissioning Cost Model Technical Report”,
Environmental Resources Management (ERM), San Francisco, CA., 2017.
References
Dr. Parikhit Sinha is a Senior Scientist in the Global Sustainability group at
First Solar, where he leads the company’s research on environmental prod-
uct safety and life cycle assessment. He is a member of the International
Energy Agency PVPS Task 12 Committee on PV Environmental, Health, and
Safety, and a former study director at the U.S. National Academy of Sciences.
He has a Ph.D. in atmospheric sciences from the University of Washington, Seattle, and a
B.A. in environmental engineering from Harvard University.
Sukhwant Raju is the Global Director of Recycling Operations and Services at
First Solar where he leads the development of PV module recycling technol-
ogy and manages a global recycling team, which currently operates com-
mercial-scale recycling plants in Europe, Asia, and the United States. He has
more than 28 years of experience in the chemical and environmental indus-
try and has been involved in the technical design, operations, and business
management of chemical treatment, recycling, and hazardous waste management
operations at several companies. Sukhwant is a chemical engineer with an Executive
MBA degree from David Eccles School of Business at University Of Utah.
Karen Drozdiak is the Sustainability Communications and Analysis Manager
at First Solar, where her responsibilities include data analysis, market
research, internal and external sustainability communications, and corpo-
rate sustainability reporting. She has worked in the PV industry for the past
six years and recently participated in the development of the industry’s first
sustainability leadership standard, led by NSF International and the Green
Electronics Council. Karen has a B.A. in History and U.S. Foreign Policy from Columbia
University and an M.A. in International Relations and Diplomacy from the Anglo-
American University in Prague.
Andreas Wade is the global sustainability director at First Solar where he has
been in charge of the company’s sustainability programme for the past three
years. He previously supported business development as director of techni-
cal relations and public affairs in Europe. Prior to joining First Solar, Andreas
designed and implemented the life cycle management strategy for Q-Cells
and worked as a process engineer at Shell Exploration and Production.
Andreas is the deputy operating agent of the International Energy Agency’s PVPS Task 12
Committee and currently also leads the development of a minimum recycling standard
for PV modules within the Technical Committee 111X Working Group 6 of CENELEC.
Authors

51 www.pv-tech.org | December 2017 |
financial, legal, professionalLegal Briefing
Even after the retrospective cut in
renewable energy incentives in
Italy, the acquisition of operat-
ing solar photovoltaic (PV) plants in
Italy under the right conditions may
still provide strong financial returns to
investors.
Nevertheless, irrespective of the
financing structure or size of the
project, there are risks associated with
such transactions that a buyer will need
to get comfortable with during the due
diligence process.
A thorough legal due diligence
exercise should cover a wide range of
issues, including land rights, permits
and environmental aspects, grid-
connection rights, corporate aspects,
any construction aspects that may be
still relevant, O&M, as well as the exist-
ing financing agreements in place.
Property
Property due diligence would be
initially required to establish whether
the development of the PV plant on the
site was allowed from a development
planning perspective. If it emerges that,
at the time of the construction works,
the site had a “cadastral” classification
that was in principle not suitable for
the installation of the PV plant, or if
the site fell within an area of special
environmental value (like a special
preservation zone or a site of European
significance), then it is necessary to
establish if the local authority amended
the cadastral classification of the land
or if specific environmental proceed-
ings were carried out to evaluate the
potential impact of the project on the
environment.
To ensure that the permits were
legitimately issued and the incentives
are lawfully paid, it is necessary to inves-
tigate if the developer had in place at
the start of the authorisation procedure
the requisite land rights in respect of
the site where the PV plant has been
built, and if it has continued to hold
such rights during the incentive period.
The nature of the land rights (propri-
etary right versus land lease) giving the
project developer use of the site may
impact on the bankability of the project,
as banks usually require security over
the land itself.
It is standard for a 20-25 year surface
right to be granted, often with an
option to renew for a further period of
time if the project remains operational.
A buyer should make sure that the
duration of the land right is aligned with
the duration of the incentive period, at
no extra cost. In the case of rooftop PV
installations, the owner of the building
is required to grant the project special
purpose vehicle (SPV) full access to
the roof in accordance with health and
safety regulations, and responsibility
for maintenance works on the building,
the roof and the PV plant needs to be
adequately allocated.
In the context of property due
diligence, both legal and technical
advisors should review searches at the
land registry to ensure that the site
is not affected by prejudicial encum-
Secondary market | Many mature solar markets are seeing strong investor interest in acquiring operating solar assets. But as the lessons from Italy show, transactions in the secondary PV market come with numerous legal risks attached, necessitating thorough due diligence, write Arturo Sferruzza and Ginevra Biadico of Norton Rose Fulbright
The legal pitfalls of PV acquisitions
Experiences from
Italy’s thriving
secondary solar
market under-
line the need for
thorough legal
due diligence on
acquisitions
Cre
dit
Enel
Gre
en P
ow
er

52 | December 2017 | www.pv-tech.org
financial, legal, professional Legal Briefing
brances or third party rights (such as
pledges, civic uses, or pre-emption
rights) and that all titles affecting the
site are reported on. However, excerpts
from the land registry have limited
legal value and the assurances that the
SPV has acquired the land rights from
the full owner of the land and that no
prejudicial encumbrances affect the site
may only be obtained through a 20-year
notarial report (relazione notarile venten-
nale) prepared by a public notary. A
20-year notarial report may be a useful
instrument to understand if the root
of title over the land is good or not,
allowing a purchaser to take adequate
remedies in the sale and purchase
agreement (SPA) in connection with the
findings of the notary search.
If the 20-year notarial report shows
that titles to the site have been trans-
ferred through donation or under wills,
then there is a risk that legitimate heirs
(eredi legittimari) may be entitled to
start a legal claim, claiming that the
donations made by the deceased or the
provisions of the will have prejudiced
the mandatory quota of the estate
reserved to them at law and, therefore,
asking for the restitution of the site or
the payment of the value of the site.
The buyer will expect a full indemnity
against any losses or expenses arising
from any claims that may be brought by
any legitimate heirs, so as to pay them
and avoid the restitution of the site.
It is advisable that the buyer’s
advisors review the findings of the
20-year notarial report well in advance
of the signing date, in order to make
sure that potential encumbrances (e.g.
foreclosures, mortgages, etc.) or other
issues (e.g. unregistered property rights,
existence of donations or wills, etc.) are
known in advance and that adequate
protections are contemplated in the
SPA.
A key part of the property due
diligence is to check that the SPV has
the rights to lay a cable to the point
of connection to the grid. If the grid
connection works have not been carried
out by the grid operator, then full due
diligence would be required, with the
same level of detail as previously carried
out for the project site itself. It is also
crucial to identify where the electrical
cables cross roads or other infrastruc-
ture (such as gas or water pipelines), so
that it can be established whether the
necessary consents were been obtained
from the competent authority. Conces-
sions for the use of public land may
often trigger annual fees and taxes to
be paid to local authorities.
Buyers will seek to confirm that all
permits are valid and effective, that
there is no risk of judicial review, that no
additional permit is necessary and that
the conditions set out in such permits
(e.g. in terms of distances from buffer
zones, and environmental mitigation
measures) have been complied with.
Avoiding challenges
In the secondary market, the risk that
third parties may challenge the authori-
sations is quite remote due to the
expiry of the statutory appeal periods.
Notwithstanding this, an assessment
of this risk may still be necessary in
the event that new post-completion
authorisations are granted to imple-
ment changes to the original author-
ised project or to rectify discrepancies
between the as-built and the authorised
project design. In this respect, it is
crucial to understand if any changes are
material. If they are material the authori-
sation procedure would be much more
complicated and the entitlement to the
incentives may be at risk.
Furthermore, any public authority
is entitled to act in “self-defence” and
annul an administrative act formerly
approved when it becomes apparent
that the relevant administrative act had
been issued in breach of any provision
of law and an actual and current public
interest exists to support annulment of
the act. According to recent changes in
law, the power to annul in self-defence
may be lawfully exercised only within
18 months, but this time limit is subject
to some exceptions. A potential buyer
would be interested in confirming that
no circumstances exist that may lead
the public authorities to start an action
in self-defence.
The risk of third-party challenges and
public authority actions in self-defence
against the authorisations reduces with
the lapse of time since commissioning
of the PV plant. However, there is still a
residual risk of forfeiture or revocation
of incentives due to facts or circum-
stances existing prior to the award of
the incentive. From a legal perspective,
this risk assessment is the most impor-
tant exercise to be carried out. The
Gestore dei Servizi Energetici (GSE), Italy’s
state energy management agency, has
a general power of inspection on PV
plants. Depending on the seriousness
of the violation, the GSE may order the
suspension or the revocation of the
incentives and seek to recover all of
sums already paid.
When it comes to the granting of
permits and administrative matters, the
key issues known in the market that
may adversely impact the incentives
are generally related to the legality and
completeness of the authorisation relat-
ing to the type of plant, its size, location
and the date of title release. This is due
to the fact that Italian legislation, over
the years, has proven to be complex and
inconsistent. Because responsibility for
energy matters has been vested, since
the 2001 constitutional reform, both in
the state and in the regions, the regula-
tory framework relating to the permits
necessary to construct a PV plant is
different in every region. This situation
has ultimately resulted in a series of
regulatory mismatches rendering the
applicable authorisation procedure
uncertain, due to the cumbersome
nature of the multilevel regulatory
system, the tangle of administrative
competences and the increase of the
litigation between state and regions.
Major issues for market relate to
PV plants authorised by means of a
simplified deemed-consent procedure
(dichiarazione di inizio attività) and
which have been built on adjoining
plots of land. Since 2008 some regions
have introduced guidelines to detect
instances where applicants were
seeking separate authorisations for
ajoining projects to ultimately build
larger PV plants that should have been
“A thorough legal due diligence exercise should cover a wide range of issues, including land rights, permits and environmental aspects, grid-connection rights, corporate aspects, any construc-tion aspects that may be still relevant, O&M, as well as the exist-ing financing agreements in place”

53 www.pv-tech.org | December 2017 |
financial, legal, professionalLegal Briefing
designed to cover unexpected issues
that arise after a deal has completed;
however, this assumes that the buyer
has performed thorough due diligence
on the target rather than relying on the
policy (and that the seller has carried
out a thorough disclosure exercise).
Insurers will expect a balanced negoti-
ated SPA and that the due diligence
exercise has been robust and complete.
Indications that the due diligence
process has been skipped or rushed
could lead to a high premium, lowering
the scope of the coverage or denial of
a policy entirely. Environmental issues,
defects in the construction works,
bribery and corruption are generally
excluded from the scope of W&I cover-
age.
Finally, it is not uncommon for sellers
to seek earn-out provisions, for instance,
in the event that, after the closing date,
the competent authorities approve a
repowering or grant a special subsidy in
addition to the Conto Energia incen-
tives (such as the Tremonti Ambientale).
While the approval of a repowering
may be a win-win situation for both the
seller and the buyer, the feasibility and
the conditions for the simultaneous
application of Conto Energia incentives
and other types of public subsidies
should be prudently verified depending
on the applicable Conto Energia.
Notwithstanding these issues
identified, there is a strong secondary
market for Italian PV projects which
demonstrates that risks are manageable
provided that buyers undertake the
appropriate level of due diligence and
achieve adequate mitigation measures
within the SPA.
authorised through more complex
procedures. The regulation relating
to the subsidy for solar PV generation
has been amended since 2011 to take
account of these issues. The so-called
“Fourth Conto Energia” introduced
certain criteria which must be applied
when calculating the capacity of PV
plants for the purpose of determining
the applicable level of incentive. This
is to prevent operators from splitting
a single PV plant into multiple sites
to benefit from an incentive that is
higher than that applicable to the plant
considered as a whole. Finally, pursu-
ant to Ministerial Decree dated 23 June
2016, the GSE can consider many items
as an indicator of “malicious fractioning”,
including the fact that plants share the
same grid connection infrastructure or
the same electrical line.
Portfolios comprising PV plants
subsidised according to the Second
Conto Energia that have applied for the
benefits under the Salva Alcoa Law have
to be analysed with particular atten-
tion. Some of the most serious issues
generally relate to problems in the
drafting of the certificate of completion
of the works, the absence of any notice
of completion submitted to the grid
operator and the authority, or the lack
of documentation demonstrating the
actual completion of the plant by 31
December 2010 (e.g. pictures showing
the installation of modules, inverters
and transformers, parts labelling and
shipping documents).
The legal and technical due diligence
exercise will also investigate whether a
grid connection agreement is in place
between the SPV and the competent
grid operator, whether the export/
import capacity is sufficient for the
project’s planned generation output,
whether all the connection costs have
been paid, the grid connection works
have been completed with no outstand-
ing liabilities, that the grid connec-
tion granted by the grid operator is
not limited in time and that the date
of entry into operation of the plant is
compatible with the project’s accredita-
tion under the incentive regime granted
by the GSE.
Environmental risk
There may also be environmental risks.
Various laws may require a current or
previous owner, occupier or opera-
tor of property to investigate and/or
clean-up hazardous or toxic substances
or releases at or from a property. These
owners, occupiers or operators may also
be obliged to pay for property damage
and for investigation and clean-up costs
incurred by others in connection with
any such substances.
The standard set of representations
and warranties to be given by the seller
in an SPA is expected to cover most
of the above issues. Generally, there
will be no liability on the seller’s side
if the relevant issue has been “fairly”
disclosed. On the other hand, if the
seller has not been able to provide
access to a comprehensive suite of
documentation, then from the buyer’s
perspective it would be prudent for the
due diligence exercise not to limit the
representations and warranties of the
seller in the SPA and for the buyer to
negotiate appropriate pro-sandbagging
language in the SPA.
Depending on the findings of the
due diligence, buyers may also seek
a purchase price reduction or special
indemnity protections in the SPA
alongside representations and warran-
ties. In general, it is important to make
sure that monetary caps on the seller’s
liabilities allow sufficient compensation
and that any time limit on the buyer’s
ability to claim under the indemnities
allows sufficient time for completion of
surveys plus a few additional months to
prepare the claim.
In this context, there is a trend
towards requiring warranty and indem-
nity (W&I) insurance, providing cover for
breaches of warranties, covenants and
indemnities given by the seller under
an SPA. This insurance product seeks
to bridge the gap between the buyer’s
wish for deal protection and the seller’s
desire for a clean exit. Advantages for
buyers may include the duration of the
coverage, and the reduction of the risks
of an insolvent seller. W&l insurance is
Arturo Sferruzza is a bank-
ing and projects lawyer
for Norton Rose Fulbright
based in Milan where he is
head of the Italian banking
and energy teams. His practice covers
project finance (energy and infrastruc-
ture), export credit and international
trade finance and shipping finance.
Ginevra Biadico is an admin-
istrative lawyer for Norton
Rose Fulbright based in
Milan. She has experience
of advising on domestic
and international project
finance and M&A transactions in the
energy, pharmaceutical and real estate
sectors.
Authors
As subsidies for PV dwindle in many of the European solar
markets that initially thrived on mechanisms such as feed-in
tariffs, the importance of the secondary market is coming to
the fore.
Italy has seen significant activity in this space, earning
it the unofficial badge of Europe’s leading secondary
solar market. The UK, meanwhile, has also emerged as a
leading secondary market player, as the initial investors
in PV projects sell up to secondary investors looking to
amass large portfolios of operating assets. Some analysts
have predicted UK solar to have the most concentrated
ownership among mature market by the end of 2017.
PV market consolidation

54 | December 2017 | www.pv-tech.org
Design and Build Technical Briefing
Several recent international surveys
[1] [2] carried out among BIPV
stakeholders reveal that one of
the main obstacles for the widespread
deployment of building-integrated
PV (BIPV) systems is the high cost. The
economic issue is still perceived as a
barrier by architects and contractors,
who are the main BIPV stakeholders.
On the other hand, the drastic cost
breakdown of PV in recent years has
enormously decreased BIPV prices
leading to cost competitiveness with
standard building materials.
It is thus essential to increase the
trust of architects, investors and finan-
cial stakeholders, by showing business
cases and real stories. Architects’
perceptions are highly influenced by
tangible examples and real experiences
– more than by theoretical calculations.
We have analysed 16 realised BIPV
projects as business case studies,
providing information on their final user
costs. The case studies were selected
from among more than 40 examples
collected in a local “call for case studies.
Our investigation field is not focused
on “extraordinary, ‘archistar’-designed”
BIPV projects, but on “ordinary BIPV
high quality”, meaning BIPV examples
of a high quality, but which have high
replication potential in Europe. The
sample group includes several kinds of
integration typologies from both private
and public sector applications.
Case studies
In order to collect the most repre-
sentative case studies for our investi-
gation (i.e. ordinary BIPV high quality
examples), a local call for case studies
was launched by contacting most of the
engineers, architects and profession-
als of the Trentino-Alto Adige region of
northern Italy. This region has been very
active in recent years in the BIPV field
by boosting PV use and building energy
efficiency through several measures:
incentive schemes, dedicated policies,
awareness raising, guidelines develop-
ment and public engagement in the
use of PV in public buildings. Out of
more than 40 collected cases, the best
ones were selected through an internal
workshop.
The meaning of the acronym BIPV in
this case-study analysis is intended to
convey a broader meaning compared
to the EN 50583-1:2016 “Photovoltaics
in buildings” standard definition and
in particular refers to a triple concept
of integration: technology, aesthetic
and energy integration. Technology
integration is meant as the capability
of the PV system to be “multifunctional”
(as intended in the EN Standard) and
aesthetic refers to the architectural
appeal. “Energy integration” refers to
the capability of a PV system to interact
BIPV | One argument frequently used against building-integrated PV is its high cost relative to normal building materials. But as Laura Maturi and Jennifer Adami argue, evidence gathered from real-life BIPV projects suggests otherwise
Analysing BIPV affordability
The case studies
analysed by
EURAC challenge
the cost
argument often
made against
BIPV
Figure 1. BIPV
integration
concept

55 www.pv-tech.org | December 2017 |
Design and Build Technical Briefing
with the building and district energy
system in order to maximise the local
use of the produced electricity.
This is in our view a quite important
aspect, which is often not considered in
the traditional BIPV definitions. In fact,
despite the existing “BIPV” definitions,
we believe that in order for BIPV system
design to be successful, all three aspects
must be considered. The selected BIPV
case studies are considered respond-
ent to this triple concept (see Figure 1,
previous page).
The selected BIPV systems have been
installed in a variety of building typolo-
gies. They include office, residential,
agricultural, industrial, community,
religious, commercial and transporta-
tion buildings. Most of them have been
integrated during the building construc-
tion (around 60%), the other ones
represent retrofit intervention.
Several architectural integration
types are shown, including opaque and
semi-transparent roof, warm, cold and
double-skin façades as well as external
devices such as parapets and solar
shading elements. The most predomi-
nant are façade and roof systems.
The different building typologies
represent both private and public
ownerships, giving an overview of the
different approaches to the BIPV matter,
especially regarding the decision-
making related to economic issues (see
Figure 2).
In terms of PV module materials,
crystalline silicon technology is the
most widely exploited, being used
in around 80% of the analysed case
studies. Most of the modules are stand-
ard products (only 30% are custom-
made modules). It shows that in many
cases appealing BIPV systems can be
realised without needing customisation
(Figure 3). A more detailed case studies
description is found in [3].
BIPV final user cost
The economic matter is tackled from
two different perspectives: the “PV”
perspective – normalising the cost to
kWp, and the “building” perspective –
normalising the cost to m2.
Looking at the PV perspective, results
show that the cost of the analysed BIPV
systems, whose construction years lie
between 2004 and 2015, ranges from
€2,500/kWp to €8,300/kWp, with an
average of around €5,500/kWp.
This variation can be ascribed to
several factors, such as the type of
technological integration, type of
components and, most important, the
construction year, since the cost of PV
has seen an impressive decrease in the
last few years.
In particular, looking at the techno-
logical integration types, the following
average values are found:
• Opaque cold façade: ~€7,900/kWp
• Semi-transparent roof-façade:
~€5,100/kWp
• External device: ~€4,900/kWp
• Opaque tilted roof: ~€4,400 /kWp
In order to look at the economic
matter from a different perspective,
the cost has been normalised to the
envelope covered surface (€/m2), thus
using an indicator which is normally
used in the building sector. The cost of
the analysed BIPV systems ranges from
€300/m2 to €1,300/m2, with an average
of around €600/m2.
In particular, looking at the techno-
logical integration types, the following
average values are found:
• Opaque tilted roof: ~€600/m2
• Opaque cold façade: ~€850/m2
• Semi-transparent roof-façade: ~€500/m2
• External device: ~€500/m2
As the €/kWp index, the cost varia-
tion can be ascribed to several factors.
In particular, this time a crucial role is
played by the PV module efficiency. For
this reason, looking at this indicator
might be misleading but it is very useful
to compare the BIPV system cost with
standard building materials. It demon-
strates that in fact, the BIPV system
capital cost lies in an acceptable range
and is in fact even cheaper than some
standard passive building materials (e.g.
glazed curtain walls, stone and others)
[4]. This, without even considering the
payback time period, which ranges from
four to 11 years for the presented case
studies (this information was not avail-
able for all cases) and which is “infinite”
for standard passive solutions (without
taking into consideration energy
savings).
As mentioned above, the cost varia-
tion of BIPV is widely influenced by the
construction year, due to the falling
costs of PV recent years. Figures 4 and
5 show the trend over the years of the
final user BIPV systems cost, considering
the “PV” and “building” perspective.
A clear decreasing trend is shown for
the last decade (from 2004 to 2015) with
values of ~€8,000/kWp and ~€950/m2 in
“BIPV system capital cost lies in an acceptable range and is in fact even cheaper than some standard passive building materials”
Figure 2. Building typologies (left) and architectural integration types (right) presented in the case studies
Figure 3. PV technologies (left) and module types (right) presented in the case studies

The innovative character of the S’Tile Modules is based on the manufacture of the i-Cell (integrated cell), i.e. a cell bearing on the same silicon wafer several cells smaller thanstandard cells, and on Pad-to-Pad connection technology. The i-Cells then are laser-cut in 4or 5 equal pieces, and through S’Tile’s patented Pad-to-Pad connection technology thesepieces are soldered into strings. The rest of the process flow is more or less equal tostandard module which makes it very attractive for upgrading of existing facilities (capitalreuse) for the production of 60- or 72-cell equivalent modules.
Moreover, custom sizesand shapes (round, square,hexagonal, triangular, a.o.) canbe manufactured that, thanks tothe smaller cell-sizes, offerexcellent fill-factor and henceexcellent power density.In order to automate the Pad-to-Pad connection technique, S’Tileengineers developed thesoldering process with a supplierof commercial stringers into acost-effective and mechanicallyrobust solution. The companyalso offers advisory services inorder to upgrade existingstringer equipment of futuremanufacturing partners.
Reduces resistive losses by over 16 times thereby increasing module efficiency.No need for bus bars on the cell resulting in a 50% reduction of shading losses andsilver usage.The innovative Pad-to-Pad cell interconnection process reduces copper ribbonconsumption by 75%.Power output ~10% higher compared to equivalent conventional modules.This all results in significant materials cost savings at higher module power.Module can be “All-Black” with minimal space losses between the cells. Very attractivefor the eye.
Flexible production of standard and customized modules in the Poitiers-1 line, up to 15MW/year.Subcontracted manufacturing for the S’Tile branded modules.Licensing of the module technology.Co-investment in future capacity expansions.Distribution partnership.
The differentiating approach of S'Tile is atechnology to increase the peak power deliveredby the modules by reducing the energy dissipatedby Joule effect within the module, and the lossescreated by shadowing from copper tapes. Thisapproach also leads to a reduction in theconsumption of interconnection materialsbetween cells, such as silver, copper and tin,which makes S'Tile technology one of the mostefficient in terms of the costs of consumedmaterials in relation to power delivered andcarbon footprint (in kg CO2 emitted per kWproduced).
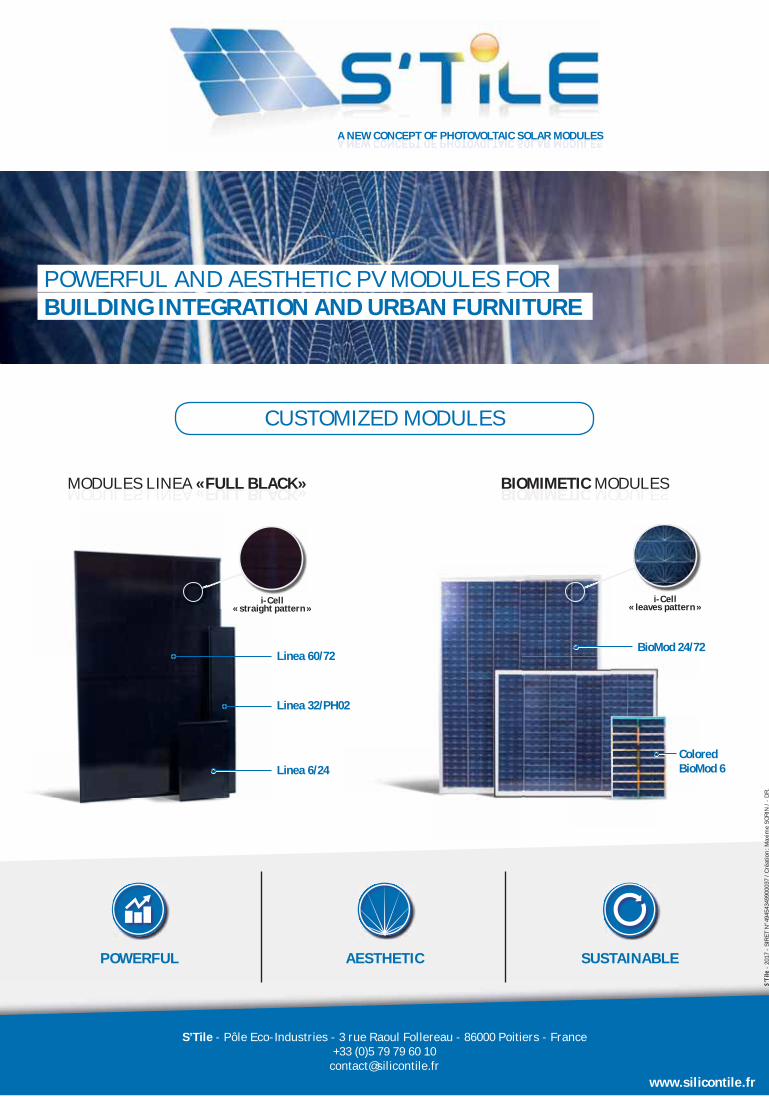
CUSTOMIZED MODULES
S’Tile - Pôle Eco-Industries - 3 rue Raoul Follereau - 86000 Poitiers - France+33 (0)5 79 79 60 10
A NEW CONCEPT OF PHOTOVOLTAIC SOLAR MODULESS
POWERFUL AND AESTHETIC PV MODULES FOR BUILDING INTEGRATION AND URBAN FURNITURE
Linea 60/72
Linea 32/PH02
BioMod 24/72
ColoredBioMod 6Linea 6/24
MODULES LINEA «FULL BLACK»MODULES LINEA «FULL BLACK» BIOMIMETIC MODULES BIOMIMETIC MODULES
POWERFUL AESTHETIC SUSTAINABLE
www.silicontile.fr
S’Ti
le -
201
7 -
SIR
ET N
°494
5434
9900
037
/ Cré
atio
n : M
axim
e SO
RIN
/ -
DR
.
i-Cell« straight pattern »
i-Cell« leaves pattern »

58 | December 2017 | www.pv-tech.org
Design and Build Technical Briefing
Laura Maturi is a senior
researcher at the Institute
for Renewable Energy of
Eurac Research. She has an
MSc in architectural engi-
neering and a PhD in environmental
engineering. She has been working for
10 years in the field of BIPV, renewable
energy, photovoltaic systems and build-
ing energy efficiency, in national and
international research projects. She is
currently coordinating the EU’s H2020
EnergyMatching project (www.energy-
matching.eu).
Jennifer Adami is a junior
researcher at the Institute
for Renewable Energy
of Eurac Research. She
approached the green
buildings field taking a LEED training
course. After graduating from Venice
University with a degree in architecture
and innovation she majored in the BIPV
field, working on related design issues
and realised case studies.
Authors
[1] PVSITES H2020 project. 2012. “BIPV
market and stakeholder survey:
summary of results.”
[2] International Energy Agency, “Task 41
- Building Integration of Solar Thermal
and Photovoltaics – Barriers, Needs and
Strategies.”
[3] L. Maturi, J. Adami, F. Tilli, “BIPV in
Trentino Alto Adige - The beauty of
power generation.” In press.
[4] G. Verberne et al. 2014. “BIPV Products
for Façades and Roofs: a Market
Analysis.”
[5] European Commission. 2010 “Directive
2010/31/EU of the European Parliament
and the Council on the energy
performance of buildings (EPBD).”
[6] European Parliament and European
Council. 2009. “Directive 2009/28/CE on
renewable energy sources (RES).”
[7] Energy Matching H2020 project, www.
energymatching.eu
References2004 and of ~€3,300/kWp and ~€400/
m2 in 2015.
By comparing this data with standard,
non-integrated PV systems, we might
conclude that the BIPV trend cost in
2015, corresponding to €3,300, is not
too far from a ground-PV solution
(considering a baseline cost of around
€2,500/kWp, typical of small plants in
the last few years).
Conclusions
These tangible examples demonstrate
that, despite the fact that the economic
issue is still perceived as a barrier
against the widespread deployment
of BIPV systems [1], [2] the use of PV in
architecture is in fact viable for many
cases. A clear decreasing trend over the
years during the last decade is shown
(see Figure 4 and Figure 5). Even if some
incentive schemes are over in Europe
(e.g. the “Conto Energia” for Italy, which
lasted from 2005 until 2013), they have
paved the way to an irreversible process
that cannot now be stopped.
In Italy, the current support schemes
rely mainly on two measures: a tax
credit, which allows to recoup 50% of
the capital cost in 10 years, and the “net
billing scheme” managed by agency
GSE, which valorises from an economic
point of view the energy delivered to
the grid. The economic viability of BIPV
systems is thus preserved, even if we
can somehow read a conceptual shift in
the way to reward it: the “Conto Energia”
boosted the formal and technological
integration (through a higher contribu-
tion foreseen for “innovative BIPV”),
while the current schemes pursue
energy integration, in order to maxim-
ise the energy match between the
produced and consumed energy.
The energy integration concept is
becoming more and more important
to meet the new building concept
and its energy provision. In fact, also
thanks to EU policies such as the NZEB
(Nearly Zero Energy Buildings) concept
and renewable energy goals [5], [6],
buildings are becoming more than just
stand-alone units using energy from the
grid. They are becoming micro energy
hubs consuming, producing, storing
and supplying energy, thus trans-
forming the EU energy market from a
centralised, fossil fuel-based, national
system towards a decentralised, renewa-
ble, interconnected and variable system.
Eurac Research is currently coordinat-
ing a European research project named
EnergyMatching [7] to address these
issues related to BIPV energy integration
developing new concepts and technolo-
gies in this direction. In this context,
PV integration is irrevocably destined
to play an essential role in the years to
come and, learning from the experi-
ence gathered in realised projects, BIPV
systems have certainly the opportunity
to improve in all the three aspects
of technology, aesthetic and energy
integration.
“Despite the fact that the economic issue is still perceived as a barrier against the widespread deploy-ment of BIPV systems, the use of PV in architecture is in fact viable for many cases”
Figure 4. Final user costs of the analysed BIPV systems per construction
year, normalised to the system nominal power
Figure 5. Final user costs of the analysed BIPV systems per construction
year, normalised to the envelope covered surface

59 www.pv-tech.org | December 2017 |
system integrationTechnical Briefing
PV bypass diode faults: current testing and scope for future test development
The PV industry has been through
significant price reductions in the
recent years. The competition to
provide the best at the least cost can
lead to compromises in design for long-
term reliability and quality. The industry
needs to keep growing while reduc-
ing risks for investors, reducing cost of
capital and avoiding a black eye in the
event shortcuts are taken in the highly
competitive PV landscape. Component
design and evaluation become very
critical under such circumstances. A
reductionist approach is very important
to improve product quality through use
of robust components.
PVQAT was formed after the Ministry
of Economy, Trade, and Industry (METI)
in Japan approached the US Department
of Energy (DOE) in late 2010 with a vision
to initiate an international effort on PV
reliability. In July 2011 an International
PV module quality forum was held in San
Francisco. This forum helped form an
international PV module quality assur-
ance/reliability task force.
Task force group #4 was formed to
focus on junction and diode reliability
with an aim to propose test protocols
and standards that would eventually
lead to robust designs and ultimately
lower the levelised cost of energy (LCOE)
from solar. Several industry experts
joined the team, drawn from the US
National Renewable Energy Laboratory,
solar panel manufacturers, junction box
manufacturers and diode manufacturers.
Apart from the group in USA, significant
contributions have come from teams
working in other geographic locations
namely Japan, China and Europe.
The group investigated several differ-
ent aspects of junction box and diode
reliability, starting with the accuracy
of technical datasheets and exploring
and performing new qualification tests.
Some of the unique work performed
involved collecting information of
real failures in the field, with an effort
to recreate these failures through
controlled chamber testing, and failure
analysis of field failures using analytical
tools to understand the root cause and
failure mechanism.
Bypass diode failures
Bypass diode failures can be encoun-
tered in two modes: short circuit and
open circuit failures.
Short circuit failure
When a bypass diode fails in short
circuit, it shorts the sub-string of 20 or
24 cells within a 60- or 72-cell module
respectively. Typically, commercial
modules have one diode per sub-string
and there are three such sub-strings
within a module. Therefore, short circuit
failure of one diode results in a one-third
power loss for the module. This would
immediately put the module out of
assured performance warranty. In this
case, either the diode or usually the
whole junction box needs to be replaced
to bring the module power back to
normal values. In the worst case, where
the junction box cannot be replaced in
the field, the entire module needs to be
replaced.
Open circuit failure
Bypass diodes are used in PV modules to
prevent the application of high reverse
voltage across cells under the event of
shading. When a bypass diode across a
sub-string of cells fails in open circuit,
this condition is similar to not having the
diode across that sub-string. This type
of failure does not affect the module
performance under normal (unshaded)
conditions. However, in case a cell in the
same sub-string experiences shading,
there is nothing that can prevent the
application of voltage generated by
all other cells in the module across the
shaded cell in reverse bias. This leads to
failure of the shaded cell due to exces-
sive power dissipation. In a worst-case
scenario, the temperatures can reach
very high values, posing a threat of fire
hazard. Therefore, open circuit failures
of bypass diodes are regarded as safety
risks. In this case, either the diode or
usually the whole junction box needs
to be replaced to eliminate safety risk.
In the worst case, where the junction
box cannot be replaced in field, entire
module needs to be replaced.
Module degradation | A working group of the international PV Quality Assurance Task Force has been undertaking research and testing initiatives aimed at improving the design and long-term reliability of module junction boxes and bypass diodes. Vivek Gade and Narendra Shiradkar, who are active leaders of this work, report on efforts to shine a light on a hitherto poorly understood aspect of module reliability
High diode temperatures in forward
bias observed inside a junction box

60 | December 2017 | www.pv-tech.org
system integration Technical Briefing
Failure detection and field failures
Short circuit failures are relatively easier
to detect as compared to open circuit
failures and can be detected using a
variety of techniques. This is because
diode failures in short circuit often result
in a loss of one-third of the module’s
voltage in open circuit (Voc). Therefore,
even with a simple multi-meter, it would
be possible to detect such a significant
drop in module Voc. In fact, it is also
possible to identify a sub-string of cells
with a short-failed bypass diode using
infrared imaging. Of course, when a
regular I-V trace is performed on the
module, diode short circuit failures can
be easily identified. In a laboratory,
when electroluminescence imaging
is performed on a module, the entire
sub-string of cells with a short-failed
diode appears dark.
On the other hand, open-failures of
diodes are not easy to detect as they
impact the module performance only
under shading. Therefore, I-V tracing under
partial shading or use of specialised equip-
ment such as a diode checker is necessary
in order to identify open failed diodes.
Failures may or may not have any
visible signatures such as burn marks on
the diodes or junction boxes. Difficul-
ties in detecting diode failures may be
the reason why only very few published
studies are available that have reported
diode failures in any significant quantity.
The box, left, details one detected
instance of a diode failure.
Failure mechanisms/stressors
leading to diode failures
Temperature over-stress in forward
bias
When a PV module is partially shaded,
the bypass diode turns ON and its
temperate begins to increase due to
power dissipation in forward bias. If this
condition persists for a long duration,
the diode temperature eventually stabi-
lises as the diode reaches a steady state.
If the diode temperature exceeds the
maximum rated temperature, the diode
may undergo failure due to this single
event of temperature over-stress. The
bypass diode thermal test in IEC 61215
is introduced as a check to screen out
designs of bypass diodes/junction boxes
that are susceptible to failure under
partial shading due to temperature over-
stress. Junction box designs qualified
under IEC 61215 have demonstrated
reduced infant mortality from tempera-
ture over-stress events.
Gaps: The current bypass diode test is
performed at 75oC ambient temperature
and its first part involves passing current
equal to short circuit current of the
module through the diode for one hour
and monitoring if the diode temperature
exceeds maximum rated temperature.
The maximum temperatures achieved
under these test conditions are repre-
sentative of rack-mounted modules in
moderate climates. However, these days
modules are increasingly being deployed
in hot climates and also in roof mounted
configurations, in which the test condi-
tions experienced in field are much
harsher. Therefore, it is necessary to
revise the test conditions to reflect this
reality and reduce the occurrence of false
positives under the current test when the
module is deployed in hot climates.
Long-term high-temperature opera-
tion in forward bias
If a partial shade scenario persists for long
duration, and is a daily occurrence, diodes
may end up spending significant amount
of time at high temperature in forward
bias. This may lead to diode failure due to
continuous operation at a high tempera-
ture. This type of behaviour is not assessed
by the bypass diode test in IEC 61215,
which only tests a diode at an elevated
temperature for a total of two hours.
Gaps: Currently there is no standard to
test the susceptibility of junction boxes
against failure due to long-term opera-
tion at high temperature in forward bias.
Thermal runaway in reverse bias/
forward to reverse transition
As explained above, a diode operates at
a high temperature if the partial shading
is held on the module for significant
amount of time. If the shading is
suddenly removed, the diode immedi-
ately turns to reverse bias. If the power
dissipation in reverse bias is more than
the power taken out by the junction
box cooling system, the temperature
of the diode begins to increase further.
Since reverse current (and power
dissipation) exponentially increases with
temperature, this leads to a further rise
in temperature until this cyclic process
results in diode failure.
Gaps: Until recently, there was no stand-
ard available that would test the junction
boxes for susceptibility against failure
by thermal runaway. Initiatives from
the PVQAT diode group members have
led to the development of IEC 62979
(drafted by Uchida-san, Japan) to assess
the susceptibility of junction boxes
towards thermal runaway. However,
qualification under this standard is not
yet mandatory.
Long-term high-temperature opera-
tion in reverse bias
When the module is not subjected
to partial shading, the diodes are
The following discusses a junction box failure due to short
circuit. The unit containing three ultra-low VF Schottky Barrier
Rectifier diodes failed in the field. The part was electrically
tested and found to be a total short circuit.
It is possible that the centre diode may have been severely
damaged by the electrical overstress (EOS) event and diode
on the right to a slightly lesser extent. Unfortunately, little
could be learned from the failure analysis due to the extent
of the damage to the diodes; resulting in the die fracturing
in several places and the epoxy mold compound carbonising
on the front face of the die, preventing it from being removed
by standard chemical methods. It was clear from the damage
to the die, packages, and the surrounding plastic unit that
the over-stress event was very severe, generating significant
temperatures. Significant melting of the surrounding plastic
unit has also occurred. This diode has also been extensively
damaged.
Field failures
Figure 1. Testing showing total short. As resistance
approaches 0, the slope approaches infinity, i.e., the I-V
characteristic becomes vertical through the origin. This
is an ideal short circuit; the voltage is zero for any current
through
Figure 2. Diode failure involving cracked epoxy packaging
potentially due to high temperatures caused by electrical
over-stress

61 www.pv-tech.org | December 2017 |
system integrationTechnical Briefing
climates. IEC TS 63126 Guidelines for
qualifying PV modules, components,
and materials for operation at higher
temperatures.
The intent would be to develop
a test to simulate service life under
mechanisms such as high-tempera-
ture forward bias operation (currently
assuming the Arrhenius model), and
thermal cycling (currently assuming
a modified Coffin-Manson model).
Moreover, in order to address the
issue of failures by thermal cycling,
the group has recommended passing
current through the diode for at least
50 cycles during the normal thermal
cycling test on PV modules followed
by a diode functionality test.
Efforts are also underway to
develop a framework to establish
direct predictive relationships
between the failure mode parameters
(activation energies for high-tempera-
ture forward bias and thermal cycling,
thermal runaway crossover tempera-
ture) of diodes, the field stressors
determined by the thermal resistance,
module current, climate of deploy-
ment and mounting configuration,
and the diode lifetime in the field
for the several different deployment
scenarios. Even though diode failures
have been reported by different
entities for several systems, both
ground-mounted and rooftop, actual
field failures are very hard to come by
for investigation in detail.
reverse-biased. This is the normal
mode of operation for bypass diodes
and they spend significant duration
of their service life in this state. When
the modules are deployed in moder-
ate climates and/or in rack-mounted
configuration, the temperature of
bypass diodes in reverse bias is not
considerably high. However, for
the case of modules deployed in
hot climates and/or roof-mounted
configurations, the diodes may operate
at elevated temperatures (but at a
temperature less than necessary to
cause thermal runaway) for a long
duration and may undergo failure due
to increased junction leakage because
of the release of impurities on the
silicon die surface. Prolonged tempera-
ture exposure may lead to degradation
of material properties and eventually
inferior electrical performance. More
testing and research is needed in this
area to establish the exact mechanisms.
Gaps: Currently there is no standard to
test the susceptibility of junction boxes
against failure due to long-term opera-
tion at high temperature in reverse
bias.
Thermal cycling
PV modules are tested for their robust-
ness for thermal cycling during the
tests in IEC 61215. However, when the
diodes are in forward biased due to
recurrent partial shading, the ΔT (the
difference between maximum and
minimum temperature) experienced
by the diodes is much higher than that
experienced by the modules. In this
case, the large temperature fluctua-
tions may cause diode failure by solder
bond failures at the die or in the worst
case crack propagation in the die itself
due to thermal cycling.
Gaps: Currently there is no standard
to test the susceptibility of junction
boxes against failure due to exposure
to significant amount of cyclic thermal
stresses.
Electrostatic discharge (ESD)
Until recently, ESD was a major cause
for diode failures in a PV module
manufacturing line. The diodes may
fail during module assembly due to
high voltage spikes generated through
contact by humans/machines or equip-
ment such as a flash tester.
Gaps: Initiatives from the PVQAT
diode group members have led to the
development of IEC TS 62916:2017,
(drafted by Kent Whitfield) to assess the
susceptibility of bypass diodes against
failure by ESD. The test specification
provides the opportunity to perform
the tests and measure the efficacy of
this test. This also helps address any
need to make further changes and if
no changes are needed based on the
data collected this could be poten-
tially be a test standard in the future
and potentially be made a mandatory
standard test.
PVQAT diode group initiatives to
address the gaps
As discussed, the only mandatory quali-
fication test for bypass diodes/junction
boxes is the bypass diode test in IEC
61215-1 and a functionality test at the
end of IEC 61730-2, which addresses
the issue of temperature over-stress in
moderate climates. It was realised that
bypass diodes in the field experience
several different stressors and may fail
by various failure mechanisms. The
diode group of PVQAT is focused on
developing methodologies and acceler-
ated tests to address diode failures
by the different failure mechanisms
discussed above. The goal is to make
available methodologies to screen for
reliable bypass diode/junction box
designs that would provide longer
service life in field against different
failure mechanisms. The work on ESD
and thermal runaway has led to devel-
opment of IEC TS 62916:2017 and IEC
62979:2017 respectively.
For the other failure mechanisms,
efforts are focused on understanding
the underlying physics and develop-
ing models that can explain failure
data due to respective stressors such
as high-temperature forward bias
operation, thermal cycling etc. Once
these models are identified, it would
be possible to determine the field
equivalents of various accelerated tests
and develop tests that would simulate
25 years in the field (for a given end use
environment and failure mechanism).
When new diode/junction box samples
are used in such accelerated tests, it
would become possible to predict the
service life of diodes under various end
use environments.
Research efforts are now focused on
developing a bypass diode test for hot
Vivek Gade has worked in the PV industry for over
13 years, focusing on reliability and manufactur-
ing. He has been managing the Jabil Solar and
Environmental Test Center (JSEC) in St Petersburg,
Florida, supporting several gigawatts of manufac-
turing, quality and reliability, for over seven years. JSEC provides
services such as PV component evaluation, module design,
prototyping, testing, field evaluation and failure analysis to a
wide range of customers. Jabil is primarily into creating unique,
automated processes for its customers through several cutting-
edge manufacturing service offerings including solar panel
manufacturing. He has been a US ANSI TAG 82 and WG2 group
member since 2010 and the USA leader of the PVQAT Task Group
4 on diodes and shading since 2011.
Dr. Narendra Shiradkar is a co-leader of the PVQAT
Task Group 4 on diodes and shading. He is currently
assistant professor at the department of electrical
engineering, IIT Bombay and leads the module reli-
ability initiative of the India’s National Center for
Photovoltaic Research and Education (NCPRE). Before that, he
worked as Photovoltaic Research Engineer at Jabil Circuit Inc. He
has a PhD with specialisation in module reliability from Florida
Solar Energy Center, University of Central Florida.
Authors
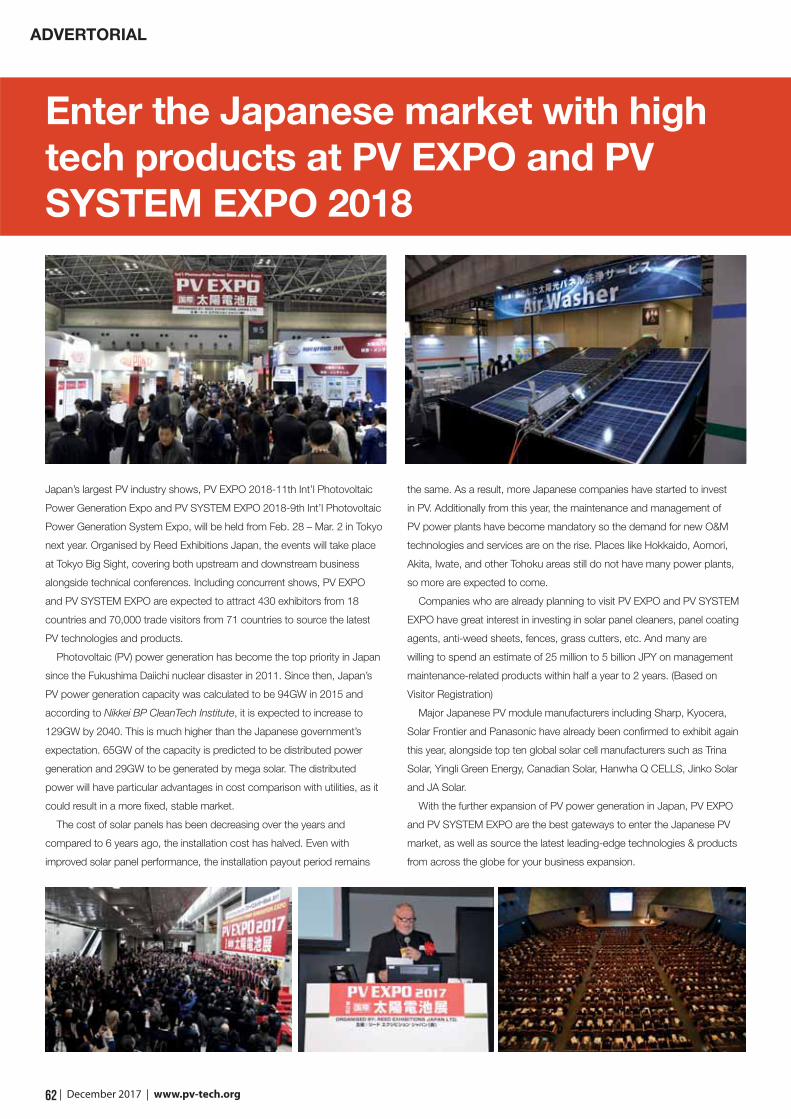
62 | December 2017 | www.pv-tech.org
Japan’s largest PV industry shows, PV EXPO 2018-11th Int’l Photovoltaic
Power Generation Expo and PV SYSTEM EXPO 2018-9th Int’l Photovoltaic
Power Generation System Expo, will be held from Feb. 28 – Mar. 2 in Tokyo
next year. Organised by Reed Exhibitions Japan, the events will take place
at Tokyo Big Sight, covering both upstream and downstream business
alongside technical conferences. Including concurrent shows, PV EXPO
and PV SYSTEM EXPO are expected to attract 430 exhibitors from 18
countries and 70,000 trade visitors from 71 countries to source the latest
PV technologies and products.
Photovoltaic (PV) power generation has become the top priority in Japan
since the Fukushima Daiichi nuclear disaster in 2011. Since then, Japan’s
PV power generation capacity was calculated to be 94GW in 2015 and
according to Nikkei BP CleanTech Institute, it is expected to increase to
129GW by 2040. This is much higher than the Japanese government’s
expectation. 65GW of the capacity is predicted to be distributed power
generation and 29GW to be generated by mega solar. The distributed
power will have particular advantages in cost comparison with utilities, as it
could result in a more fixed, stable market.
The cost of solar panels has been decreasing over the years and
compared to 6 years ago, the installation cost has halved. Even with
improved solar panel performance, the installation payout period remains
the same. As a result, more Japanese companies have started to invest
in PV. Additionally from this year, the maintenance and management of
PV power plants have become mandatory so the demand for new O&M
technologies and services are on the rise. Places like Hokkaido, Aomori,
Akita, Iwate, and other Tohoku areas still do not have many power plants,
so more are expected to come.
Companies who are already planning to visit PV EXPO and PV SYSTEM
EXPO have great interest in investing in solar panel cleaners, panel coating
agents, anti-weed sheets, fences, grass cutters, etc. And many are
willing to spend an estimate of 25 million to 5 billion JPY on management
maintenance-related products within half a year to 2 years. (Based on
Visitor Registration)
Major Japanese PV module manufacturers including Sharp, Kyocera,
Solar Frontier and Panasonic have already been confirmed to exhibit again
this year, alongside top ten global solar cell manufacturers such as Trina
Solar, Yingli Green Energy, Canadian Solar, Hanwha Q CELLS, Jinko Solar
and JA Solar.
With the further expansion of PV power generation in Japan, PV EXPO
and PV SYSTEM EXPO are the best gateways to enter the Japanese PV
market, as well as source the latest leading-edge technologies & products
from across the globe for your business expansion.
Enter the Japanese market with high
tech products at PV EXPO and PV
SYSTEM EXPO 2018
ADVERTORIAL


system integration
64 | December 2017 | www.pv-tech.org
Project name: Clay Hill Solar Farm
Location: Flitwick, Bedfordshire, England
Project capacity: 10MW
Storage capacity: 6MW/6MWh
“This is where the market will go, and we
need to build the first one,” Steve Shine,
chairman at UK renewables developer
Anesco says, recanting a conversation
he shared with the rest of his board. That
direction was co-located solar and storage,
designed to lighten the load renewables
have had on the UK’s grid; that first one was
Clay Hill Solar Farm, the UK’s first solar farm
built entirely free of government support,
which Anesco connected in the summer
of 2017.
Anesco first conceptualised the site
around 18 months previously, having
planned a separate solar farm on land
adjacent to the site which would come to
be known as Clay Hill. Land owned by the
same farmer – literally across a small access
road – hosts a 5MW solar farm connected to
the grid some months prior. That solar farm,
the Hermitage Solar Farm, was completed
under the Renewables Obligation (RO)
scheme, the now-defunct UK support
mechanism for ground-mount utility-scale
solar farms. Hermitage was one of the last
to be completed and receives just 1.2 RO
certificates for each unit of electricity it
produces, but that was enough to finance
its development.
Clay Hill is not fortunate enough to
receive such support, but does directly
benefit from Hermitage being built. Clay
Hill doesn’t share a grid connection – it has
its own – but it has been connected to the
same part of the grid as Hermitage, allowing
it to share some of the associated works.
This shaved a little off the cost of the overall
development, only helping its cause.
Construction was relatively swift.
Development of the site started roughly
two months after the RO window slammed
shut on 31 March 2017 and the park was
formally completed in August. It was then
unveiled to the public the following month
at an event which was also attended by UK
climate change minister Claire Perry. Having
joked about the site justifying its Clay Hill
name – weather conditions in the UK had
meant the ground more closely resembled
a bog than a power station – Perry lauded
Anesco’s feat and described it as a momen-
tous achievement for UK solar.
What she also mentioned was something
Shine had been quick to stress to her and
something he is only too quick to reiter-
ate: that the farm could not have been
developed without a considerable amount
of collaboration with Anesco’s supply-chain
partners.
Supply-chain engineering
It was akin to locking Anesco’s suppliers in
a room and not letting them out until they
could get it done, said one person who
worked on the project.
Shine paints it in a slightly lighter manner,
describing how Anesco held a serious of
workshops with its suppliers as it looked to
reduce the overall cost of the farm’s devel-
opment. “We completely re-engineered
how we built [solar farms] in the past and
rethought how it needs to be done,” he says.
Anesco elected to source both the solar
modules and accompanying batteries from
Chinese manufacturer BYD and, in doing so,
secured a better deal than most. In the end
more than 30,000 315W BYD modules have
been used, with five, 1.2MW batteries also
included in the order.
It approached UK-based Hill & Smith
Solar for the mounting frames and
managed to remove several tonnes worth
of steel from what was required for the
project by electing for bespoke frames that
took several millimetres off standard design
sizes. This, too, contributed towards the
overall savings achieved during the design
and development stage.
Inverters were supplied by Huawei,
which provided its brand new 1,500VDC
string inverters for their first deployment in
Europe. Shine admits that, at 10MW, there
was the temptation to use a central inverter
system at Clay Hill but the firm persevered
with its belief that string inverters are too
beneficial to overlook. Each of the Huawei
inverters includes maximum power point
trackers and 12 directly connected string
inputs to improve flexibility in the PV
STORAGE THE GAME-CHANGER IN UK’S FIRST SUBSIDY-FREE UTILITY-SCALE SOLAR PLANT
Project briefing

system integration
65 www.pv-tech.org | December 2017 |
strings, helping to maximise energy yield.
The inverters are also expected to fail far less
frequently – a problem which has reared
its head for some of the UK’s existing solar
assets due to the country’s surprisingly
humid summers – and achieving savings in
the long run.
Lord Browne of Madingley, chairman
of Huawei UK, said the firm was proud to
have a role to play in the site’s develop-
ment. “Significant technological advances,
underpinned by industry collaboration
have helped deliver the first subsidy-free
solar farm in the UK and Huawei’s smart
PV solution has played a critical role in the
successful delivery of this initiative… This
project is evidence of how solar is not only
one of the most competitive renewables,
but is now able to compete with all forms of
generation,” he said.
In total, Shine says that Anesco managed
to shave more than a third (35%) off the
total development cost of the site just
through the supply-chain engineering the
company is quick to laud. It’s these innova-
tions that it holds up as examples that other
developers could embrace to drive costs
down further, although not every UK-based
developer will have the leverage to lean on
names like BYD as Anesco has done.
With the supply chain engineered and
cost savings achieved, Clay Hill was ready to
generate power. But it’s not just power that
solar projects have to produce, particularly
if they’re to be investable. It’s the returns –
especially so in subsidy-free environments
– that will make or break a project.
The revenue stack
Such was the desire to see the project over
the line that Anesco financed the site via its
balance sheet. Anesco has historically sold
the assets it has developed not long after
their completion, but Shine says that this
may change with Clay Hill. It could be sold
in the coming years, but not before Anesco
has used the site to demonstrate that its
model works.
The panels are expected to generate
more than 9,000MWh per year but, despite
beneficial prices secured by Anesco’s
exhaustive supply-chain efforts, the export
of power would not be enough to finance
the site’s development alone. It is for this
reason that Clay Hill has been developed
with 6MW of battery storage facilities
on-site.
These batteries are pivotal to Clay Hill’s
economic viability. Not only can they be
used to shift the sale of solar-generated
power to peak times, achieving more
lucrative prices on the UK spot market; they
will also be utilised by Anesco to provide
grid-balancing services to the UK’s system
operator National Grid.
The UK’s transmission network is
maintained at a frequency of 50Hz – the
frequency at which power is transmitted
most effectively – and kept to within 0.5Hz
of it either side. National Grid has various
tools at its disposal to keep it within those
parameters and has been called upon to use
these tools more frequently as greater levels
of variable generation has come onto the
grid. Battery storage has come to the fore as
a pivotal technology in National Grid’s suite
of grid balancing tools.
In 2016 it handed out four-year support
contracts to 200MW worth of batteries
under its Enhanced Frequency Response
(EFR) programme. Those batteries must
respond within one second’s notice should
National Grid command them to and
receive fees for both standing idle and
being used in action.
While EFR has now closed to new
applicants, battery storage plants can be
supported through both the Fast Frequency
Response (FFR) market – which acts in a
similar fashion to EFR – and the Capacity
Market mechanism, used by National Grid
to procure reserve capacity at times in the
winter months when the capacity margin is
at its tightest.
Clay Hill’s batteries will be eligible to
While some ground-mount solar farms in the UK, particularly those developed as
part of community benefit schemes, have been developed using feed-in tariffs (and
an even smaller number supported by the competitive auction process dubbed
Contracts for Difference) the significant majority have been supported through
the Renewables Obligation scheme. This was established by the UK government to
incentivise the development of all forms of renewables generation and it lit a fire
under the UK solar industry. The scheme rewarded developments with RO certificates
for each unit of electricity generated that could be sold, providing a predictable
revenue stream. Each year on 31 March the scheme degressed, awarding fewer and
fewer certificates for completed projects. The ROC windows of 2015 and 2016 were
particularly successful, bringing forward around 4GW of solar alone, which caused
the government to close the scheme prematurely in 2017.
A brief history of UK solar subsidies
By Liam Stoker

system integration
66 | December 2017 | www.pv-tech.org
bid for any future frequency response
markets and, crucially, have been entered
into pre-qualification for the forthcoming
Capacity Market mechanism. One of the
criteria to bid for Capacity Market contracts
is that generator stations are deemed to
be newly built (to incentivise the develop-
ment of new assets, rather than continue to
support ageing, legacy infrastructure), and
it is for this reason that while the solar farm
connected and began generation in early
September, the batteries were not switched
on at the same time.
In that sense, Clay Hill has been built
unlike any other solar farm operational
in the UK today, although Anesco is also
at the forefront of retrofitting existing,
ROC-accredited solar farms with battery
storage. It has done this at more than 10
sites in the UK to date following close work
with the country’s energy regulator Ofgem,
done so to ensure that there is no chance
of the site being subsidised twice; once for
when the power is generated to the battery
and another time for when it is dispatched
from the battery.
Clay Hill has sought to set a standard that
not just Anesco, but other solar farm devel-
opers in the UK and beyond, can replicate.
A replicable model
Anesco has another four solar farms just like
Clay Hill that are shovel-ready. These will
feature solar alongside batteries, in keeping
with Shine’s vision that renewable genera-
tors must do more to be accommodated
into the future power system.
But the UK’s Department for Business,
Energy and Industrial Strategy, which is
responsible for energy policy, has thrown
something of a spanner in the works. The
Capacity Market mechanism that could
provide a highly bankable 15-year service
contract looks like being tinkered to more
appropriately recognise the way in which
different battery technologies work.
Given that the Capacity Market is
designed to procure reserve capacity in the
wake of a period of strain, National Grid
expects them to deliver for a period of up to
four hours. Lithium-ion batteries are unable
to deliver their rated capacity for that period
and, as a result, BEIS looks set to ‘de-rate’
them – allow them to enter the market at
a set percentage of their overall capac-
ity – from this or the next Capacity Market
auction.
Shine acknowledges that some de-rating
for batteries is inevitable, but says now is
not the time. “It’s a negative move at this
particular time… it’s not the revenue that
investors want, it’s the ability to raise debt
and 15-year contracts that are vital,” he says.
Anesco is now investigating the potential
for flow batteries to be installed rather than
lithium-ion as a workaround, but given the
comparative costs of the two technologies
this looks more like being a longer-term
play than anything else.
Anesco has replied to the government’s
consultation on the subject pitching a
phased approach to de-rating. The full
de-rating would be introduced in parts over
three or four years in a similar fashion to
how the RO subsidy scheme was phased
out. This would, Shine insists, stave off inves-
tors’ fears that the market could change
overnight.
Even better still, Shine says, would be
a set of tariffs that National Grid would
pay projects like Clay Hill for the flexibility
or reserve capacity services they could
provide. Long-term contracts would provide
investment certainty and there would be
no subsidy involved, with renewables-plus-
storage developments earning their crust.
It is perhaps a fanciful vision, but one
that fits very much with the changing
power landscape the UK is currently
experiencing. Such a scheme would
establish a place for solar in the UK power
market, solve a critical requirement for
the country’s energy infrastructure
and undoubtedly save millions in grid
reinforcement works.
But until such a set of tariffs is intro-
duced solar in the UK will have to find its
own way. Clay Hill may have been the first
subsidy-free project in the country but it
will not be the last. PV Tech Power publish-
er Solar Media’s in-house market research
team is tracking a multi-gigawatt pipeline
or projects that could be built as early as
2018, with international developers Hive
Energy and Wirsol having unveiled plans
for a 350MW project for the Kent coast in
early November – by far the UK’s largest
solar project if realised.
Clay Hill will however be regarded
as a landmark for UK solar, one realised
through intensive supply-chain engineer-
ing and a flexible approach to its revenues.
Shine says that despite operating sans
subsidies, Clay Hill is poised to generate a
better IRR than some ROC-accredited sites
in the UK given what these are currently
selling for on the secondary market.
Anesco is keen to hold on to the sites for
now but could look to sell in the long
term. Investor appetite for sites like Clay
Hill would be the surest sign yet that the
UK solar market is back on track.

67 www.pv-tech.org | December 2017 |
plant performanceTechnical Briefing
The Middle East region has over
the decade experienced an
unprecedented growth in solar
energy, with some countries targeting
a triple-digit megawatt penetration of
solar capacity. Developers, contractors,
lenders and consultants now consider
the Middle East region as one of the
most promising solar energy markets.
Pioneering countries such as Jordan, UAE
and Morocco have already interconnect-
ed over 500MW of solar capacity onto
their electricity grids.
However, whilst solar energy sees
rapid penetration in the Middle East
and more facilities interconnect to
the region’s grids, solar plant opera-
tors and asset management firms are
facing unique technical and operational
challenges not seen in other regions
such as Europe and the United States
where solar PV markets are generally
more established. Local O&M firms such
as MASE with acute knowledge of the
operational particulars are pioneering
solutions to overcome these challenges
and are harvesting valid and reliable data
in the process. This feedback is proving
essential to stakeholders in the develop-
ment of a bespoke technical blueprint
to cater for the Middle East region’s
growing demand for solar energy.
Background
Over the past four years, Jordan has
interconnected over 200MW of utility
solar PV capacity, corresponding to
approximately 5% of the country’s total
power generation. While traditionally
Jordan has relied on 3.5GW of diesel- and
gas-fired conventional power plants for
energy generation, plans are underway to
add a further 450MW of solar PV capacity
over the next two years, boosting the
total solar PV penetration in the overall
mix to over 10%. The Jordanian grid is
managed by the National Electricity
Power Company (NEPCO) and is intercon-
nected to neighbouring Egypt and Syria
with plans to connect to Iraq and Saudi
Arabia. This article contains data and
analysis gathered by MASE, a regional
operations and maintenance firm with
over 80MW solar assets under care.
Operations and maintenance | From sandstorms to extreme heat, solar installations in the Middle East face some unique operational and technical challenges. Experts from Jordan-based developer and O&M specialist MASE describe some of the innovative solutions emerging to keep plants running in the harshest conditions
Solar O&M in the Middle East: technical challenges and solutions
Extremely soiled
PV panels in
Jordan. Dust
is one of the
region’s biggest
challenges

68 | December 2017 | www.pv-tech.org
plant performance Technical Briefing
As local and international solar O&M
firms measure up to manage utility
solar PV plants currently operational
in Jordan and elsewhere in the Middle
East region, they are having to deal
with unique technical and opera-
tional challenges and innovate bespoke
solutions to overcome them. Oftentimes,
harsh weather conditions and unstable
grid behaviour adversely impact the
performance of solar PV plants by a daily
factor of up to 40%. Also, soiling and
high temperatures are proving to be
more significant operational factors than
originally anticipated.
The impact of soiling on plant
generation
More than 80% of the Middle East region
is desert and receives fewer than 25
centimetres of rainfall a year. This trans-
lates to a particular technical challenge
for site operators who in many cases
are expected to stand behind perfor-
mance guarantees often benchmarked
against less harsh foreign topographical
conditions. Whilst soiling is a common
concern for solar PV operators around
the world, it poses a significant opera-
tional concern in the Middle East region,
especially given that the majority of
solar pants are constructed in remote
desert locations, by virtue of the higher
levels of irradiation in such locations.
In some extreme cases, soiling losses
of up to 30% have been recorded when
solar panels are left unwashed over
relatively short periods of time (less than
60 consecutive days). The following data
was collected from a solar plant located
in Azraq, Jordan, a desert city to the
north east of the country.
As Figure 1 demonstrates, the severe
soiling recorded not only impacts the
overall production curve, but also
flattens the peak point during which
the plant is expected to generate at its
full capacity. In the case demonstrated
in Figure 1, the plant was left unwashed
for two consecutive months during the
summer season (August and Septem-
ber) and was fully washed in October
using water and specialised mechanical
machinery.
Even though soiling can be managed
by increasing the frequency at which
solar panels are washed, site operators
and plant owners must evaluate the
economic cost benefit of each additional
wash given the scarcity of suitable water
sources in most countries in the region.
In the case above, the performance
benefits are unmistakable and the plant
is currently washed on average once a
month during the summer season.
In addition to soiling, haphazard
sandstorm behaviour is another signifi-
cant weather anomaly common to
the region and one that site operators
must closely monitor. With its desert
conditions, the Middle East region is
prone to harsh sandstorms that often
last for days and may reappear at
random intervals. This poses a particu-
lar challenge to site operators, who will
need to actively analyse area-specific
weather forecasts and track sandstorm
behaviour. This may be an alien task to
operators in other parts of the world
but is extremely relevant to site opera-
tors in the Middle East. To manage the
impact of sandstorms on performance,
local O&M operators use multiple site
reference cell data gathered from the
site coupled with weather forecasts
to decide when it is best to clean. As
sandstorms often appear haphaz-
ardly, site operators in Jordan refrain
from washing solar panels in the days
immediately following a sandstorm in
order to avoid adverse further escala-
tion of soiling.
As mentioned earlier, whilst soiling
may not pose a significant operational
challenge elsewhere, it is a main concern
for local operators in the Middle East.
MASE’s experience is summarised as
follows:
• On average, module washing in
intervals not exceeding 30 days will
maintain soiling losses to below 2%.
Longer intervals may result in signifi-
cant impacts on performance by up to
40%;
• Tracking sandstorm behaviour is
essential and must be evaluated
by site operators when scheduling
washing sequences to avoid adverse
impacts;
• Dry cleaning is not recommended,
unless coupled with advanced clean-
ing robots, which are generally yet to
prove their effectiveness in the Middle
East.
Power limitation and equipment
design
Whereas soiling is mostly an operator-
managed concern, equipment manufac-
turers are responsible for thoroughly
evaluating how their products perform
when operating in harsh Middle Eastern
weather conditions. The case for
region-tailored equipment may require
commercial evaluation, but PV module
and inverter manufacturers need to
consider that while their products may
be suitable for one region they may not
be for others.
Unsuitable inverter design and
inadequate heat management have
been flagged as two of the main issues
curtailing the performance of solar
plants in the Middle East. Inverter
stations, which are typically designed to
Figure 3. An
event of Inverter
shutdown due
to high tempera-
ture
Figure 1. Impact of soiling on daily energy production
Figure 2. A solar
PV plant in the
midst of a severe
sandstorm in
Jordan

Solar Expo is the event to exhibit at to unlock opportunities in the GCC region's major investments in solar. Meet the key buyers in MENA and position your brand as a leader in solar technologies. Solar Expo is a major opportunity to develop relationships with the region's government authorities and utilities.
Here is a selection of organisations that were represented by senior decision makers in our hosted buyer programme in 2017:
Abu Dhabi Water & Electricity Authority
Dubai Electricity & Water Authority
Al Ain Distribution Company
GASCO
Dubai World Central
Dubai Municipality
Emirates National Oil Company
Holy Makkah Municipality
Saudi Aramco
Saudi Electricity Company
Moroccan Agency for Solar Energy
BOOK YOUR STAND TODAY
attendees
exhibiting companies178+
6,900+
23+ countries
Under the Patronage of H.H. General Sheikh Mohammed bin Zayed Al Nahyan, Crown Prince of Abu Dhabi and Deputy Supreme Commander of the U.A.E. Armed Forces
For exhibition space booking and sponsorship opportunities at Solar Expo 2018
+971 50 616 8926 [email protected] Singh
•
•
•
•
•
•
•
•
•
•
•
Co-located withPart of Organised by
Strategic Partner Hosted by
Strategic Sponsor

70 | December 2017 | www.pv-tech.org
plant performance Technical Briefing
withstand predictable weather condi-
tions of Europe, perform poorly in the
Middle East. Consequentially, site opera-
tors have had to cope by implement-
ing intuitive but temporary solutions
to overcome cooling and ventilation
complications.
Data has shown that inadequate
internal cooling results in daily plant
shutdowns of up to 15 minutes per day
during the summer season. For develop-
ers and plant owners, this translates to
a bearing on their revenue stream and
may on occasion hamper their ability to
meet financial and contractual obliga-
tions. For operators, inverter downtime
will directly impact their performance
indicators and decrease plant avail-
ability.
Inverter stations typically operate
within a set range of internal tempera-
ture parameters and are also designed
to tolerate temperature levels slightly
beyond those limits. The power trend
in Figure 3 corresponds to a standard
inverter station with an internal temper-
ature tolerance of 65 degrees Celsius,
after which the inverter shuts down to
protect itself and its ancillary equipment
from overheating.
The inverter station to which the
graph corresponds is of the enclosed
type and utilises air flow cooling, which
may be adequate in some regions but
has proven to be impaired when faced
with Jordan’s hot summer climate. The
graph demonstrates that once the
internal cabin temperature reaches 65
degrees Celsius, the inverter shuts down
for up to 15 minutes until its internal
equipment cools down. On some
occasions, the inverter stations shuts
itself down more than once a day as
demonstrated by the excerpt from the
plant’s SCADA shown in Figure 4.
For this particular plant, the recorded
losses of power due to inadequate
temperature tolerances add up to
460kWh per day or 2% of the plant’s
daily power, a significant concern when
it is a daily occurrence.
To overcome this issue, MASE
site operators installed separate air
conditioning units which feed off the
inverter’s auxiliary power supply and
are only triggered during times of
peak heat as recorded by the plant’s
weather stations. While this solution
has eliminated losses due to inverter
downtime for the time being, it is
understandably temporary and not
ideal. A permanent solution requires
proper inverter design that takes into
account the Middle East’s harsh condi-
tions and excessive high temperatures
during summer periods. Some inverter
manufacturers have taken steps to that
end and now offer inverter stations with
more powerful cooling systems and
also outdoor solutions that are meant
to eliminate excessive heat resulting
from the containerised enclosure. The
benefits of these bespoke solutions
include better performance, lower O&M
costs and higher plant availability. When
properly designed to withstand the
region’s specific weather conditions, the
inverter would otherwise operate as
demonstrated by the trend illustrated
in Figure 6.
In addition to the inverter stations,
ancillary equipment such as array boxes
and string combiner boxes also suffer
from excessive heat and dust build-up
as a result of poor design. Typically, array
boxes and ancillary containers ventilate
through standard mesh filtration as
shown in Figure 7 on the following page.
This has been found to be ineffective
in harsh desert conditions. Oftentimes,
significant amounts of pulsed sands
have been recorded, causing the follow-
ing:
• Array box overheating, thus damag-
ing string monitoring sensors and
burning fuses;
• Dust accumulation, requiring more
frequent cleaning;
• Degrading of IP protection features.
To solve this significant problem, MASE
has worked with array box suppliers
on a more potent filtration system that
is aimed at avoiding the accumulation
of pulsed sand in and around the array
boxes. The solution, which is shown in
Figure 4. Two subsequent events
of inverter shutdown due to high
temperature
Figure 5. Inverter operation data
and curtailment analysis
Figure 6. Inverter operation when
properly cooled and ventilated
xxx
Period 1 Period 2
Time Power (kW) Time Power (kW)
14:25 718.5 15:45 693.8
14:30 0 15:50 0
14:35 0 15:55 0
14:40 0 16:00 0
14:45 0 16:05 0
14:50 0 16:10 0
14:55 700.4 16:15 661.7
Total 20 minutes Total 20 minutes Downtime Downtime
Energy Lost 236.4 Energy Lost 225.9 (kWh) (kWh)
Total Energy Lost per Day: 462.3 kWh

71 www.pv-tech.org | December 2017 |
plant performanceTechnical Briefing
the images shown in Figure 7, is perma-
nent and has proven to be eff ective in
protecting the delicate contents of the
array boxes.
In conclusion, the following recom-
mendations form the outcome of these
technical concerns:
• Inverter manufacturers and ancillary
equipment suppliers must account
for extreme weather conditions and
topography of the Middle East when
designing the equipment;
• Inverter and balance of system suppli-
ers should work on enhancing fi ltra-
tion components to protect equip-
ment from severe sandstorms and the
accumulation of pulsed sand;
• Inverter behaviour must be improved
to optimise performance and behav-
iour during periods of excessive heat.
Grid instability
Data recently analysed by MASE has shown
that the Jordanian grid is considerably
unstable, with frequency fl uctuations
recorded on a daily basis. This has been
found to adversely impact the daily perfor-
mance of solar PV plants as the Jordanian
grid code currently applied to renewable
energy generating units requires compli-
ance with certain active power control
covenants as shown in Figure 8.
As shown in this fi gure, renewable
energy generating units (whether solar or
wind) are required to gradually reduce their
active power, while in operation, in cases
of grid frequency exceeding 50.2Hz and
disconnect from the grid in cases of grid
frequency exceeding 51.5Hz.
Compliance with these grid requirements
under Jordan’s current grid conditions has
resulted in power limitations of up to 15%
on a daily basis, the reason being Jordan’s
unstable grid frequency as demonstrate by
the trend in Figure 9. The grid frequency
data shown in Figure 9 is recorded by a solar
PV plant’s SCADA over two days of normal
operation.
Site operators have little to no control
over the grid frequency. On the other hand,
grid management is the exclusive responsi-
bility of the grid operator, the entity which
also determines the grid code and operating
requirements.
The recommendations arising out of the
observations summarised in this section are:
• When assessing the technical feasibil-
ity of introducing renewable energy
generating units into their network,
grid operators need to understand the
coherent operational characteristics of
these generating units and their poten-
tial impact on the behaviour of the grid;
• Project developers and operators must
actively evaluate the relevant grid codes
and regulations as part of their overall
technical due diligence and engage in
a discussion with grid operators on the
susceptibility of operational parameters
and regulations;
• As part of their overarching approach
towards renewable energy infi ltration,
regulators and grid owners must develop
long-term plans to ensure the grid’s
technical sustainability by implementing
supplementary projects such as energy
storage aimed at stabilising and upgrad-
ing the grid.
On p.72 Fraunhofer CSP researchers describe how to
determine soiling losses on PV modules in desert regions
Tareq Khalifeh is director of
operations at MASE, a utili-
ty-scale solar energy devel-
oper, operator and asset
manager based in Jordan
(www.mase-energy.com). He has over
seven years’ experience in originating,
developing, operating and managing
utility PV plants across the Middle East
region. Tareq is an engineer, holds a mas-
ter’s degree in energy trade and finance
and has a professional background in
management consulting, utilities, project
finance and solar asset management.
In September 2016, the Middle East
Solar Industries Association (MESIA) and
Intersolar Middle East awarded Tareq
the highest-category Solar Pioneer gold
award in recognition of his achievements
in advancing solar across the Middle East
region.
Ady Almadanat has over
three years’ experience
in the areas of solar plant
operations, maintenance
and management. He is
currently responsible for operating solar
PV assets of over 15MW in cumulative
capacity and manages an array of tasks
including preventive, corrective and con-
ditional maintenance as well as analysis
and reporting. Ady has a university
degree in renewable energy engineer-
ing and is a principal member of MASE’s
O&M team.
Omar Baker is experienced
in the design, engineering
and construction of solar
PV plants with a focus on
distributed and utility solar.
He operates and maintains a portfolio
of over 400 distributed solar PV plants
across Jordan and manages their peri-
odical maintenance, troubleshooting,
reporting and analysis tasks. Omar has a
university degree in electrical engineer-
ing and is a principal member of MASE’s
O&M team.
Haya Shahatit is involved
in the origination, imple-
mentation and operations
of MASE’s diverse portfolio
of retail and utility solar PV
plants under management. She holds a
degree in electrical power and energy
engineering and has extensive experi-
ence in project management, technical
analysis and reporting. She is an active
member of MASE’s O&M team.
Authors
Figure 7. Standard versus enhanced array box fi ltration
Figure 8. Active power control requirements – Jordanian Grid
Code
Figure 9. Recorded grid frequency

72 | December 2017 | www.pv-tech.org
plant performance Technical Briefing
Determining soiling losses on PV modules in a desert climate
Irradiation losses due to external causes,
such as soiling or shading, remain the
prominent source of a PV module’s
energy yield cutback. Consequently, effort
and investment to mitigate them becomes
essential, especially in cases of maintaining
a large-scale PV plant. This can be simpli-
fied by identifying and analysing the key
parameters related to external losses and
developing a method to estimate them
based on the former.
Dust, dirt, sea salt and pollen, originat-
ing from air pollution caused by mining
activities, construction, agricultural
activities and other natural phenomena,
can lead to accumulation of particulate
matter on the surface of solar panels.
This is termed as soiling. Soiling leads to
current reductions in the PV module which
further affects the power and energy yield,
especially in dry or arid areas. In general,
these losses are referred to as soiling losses.
Existing soiling can only be removed by
cleaning events, which can either occur
naturally (heavy rainfall) or manually
(maintenance cleaning). Previous studies
on soiling have focused on desert or dry
regions, which are susceptible to large
aerosols in air, but also occur consistently
with large solar resources. A recent study
[1] by Mejia et al. reported an efficiency
loss of 7.4% for a PV panel operated for an
average of 145 days during a dry period
in California; this is an order of magnitude
higher than the losses due to cell degrada-
tion. Similar case studies have supported
the significant impact of soiling losses
on energy yield for different regions, but
efficient methods of quantitative predic-
tion of soiling is still a challenging task
for researchers in PV modelling. The most
important factor influencing the level
of soiling losses are the dust properties
(e.g. shape and size), moisture, humidity,
frequency and intensity of precipita-
tion, wind speed and the installation
configuration of PV panels [2, 3]. A study
by Haeberlin et al. [4], demonstrated the
reversible effects of soiling losses before
and after manual cleaning on a 60kW
array. In addition, a recent work in Italy [5]
reported a 6.9% reduction in performance
for one site and 1.1% for another site not
far from each other due to eight weeks of
soiling. It can therefore be interpreted that
large variability of soiling can occur even
over short distances.
This article explains a method to
determine soiling losses and to classify
the soiling state of PV modules in desert
climates, which can then be adapted for
other climates based on PV plant system
data.
Methods
The impact of soiling on a running PV
system depends on the local conditions,
as described before. In order to determine
the meaningful local soiling behaviour and
to be able to make statements about the
cleaning intensity, an understanding of
the relationship between environmental
factors and PV performance is necessary.
The following approach extends from
outdoor measurements (performance
data) to extensive data analysis. Figure 1
structures the approach of this article.
In the first part, PV modules were
characterized at standard test conditions
(STC: 1000 W/m², 25°C, spectrum AM1.5)
and tested under outdoor conditions
with different cleaning cycles in a desert
environment. This data contains detailed
information about the state of natural
soiling of the modules and relevant
environmental influences over time.
The collected data was then filtered in
Soiling | Understanding the impact of soiling on PV modules and thus the most appropriate cleaning regime, is critical to preventing losses in module power and plant yield. David Daßler, Stephanie Malik and Akshayaa Pandiyan of Fraunhofer CSP describe a statistical method they have developed for accurately characterising the losses from soiling in desert conditions
Figure 1.
Flowchart of the
investigations [8]

plant performanceTechnical Briefing
with
www.kippzonen.com/DustIQ
the second step in order to achieve valid
information for further data evaluation.
Finally, the soiling losses were deter-
mined based on fi ltered data, taking into
account the mean ratio between irradi-
ance and module short circuit current.
The current is only slightly dependent
on the temperature and is directly
infl uenced by transmission losses due
to dust deposition on the module glass.
In addition, the days were clustered due
to diff erent infl uencing environmental
conditions such that the soiling losses can
be characterised by cluster information.
These steps are described in detail further
in this article.
Outdoor measurements
Several months of outdoor data was
measured (see Picture 1) to receive data
about the module performance and
environmental conditions. The measure-
ments were made at the outdoor research
platforms of photovoltaic modules at
“Green Energy Park” (GEP) in Ben Guerir,
Morocco (near Marrakech), implemented
in a partnership with Fraunhofer CSP. GEP
is a solar testing, research and training
platform, in the green town of Ben Guerir,
Figure 2. Deter-
mination of daily
mean ratio using
slope of linear
regression: E.g.
relationship
between ISC
and
irradiance for one
module on one
day (09.06.2017)
[8]
developed by IRESEN with the support of
the Ministry of Energy, Mines, Water and
Environment and the OCP Group [6] to
develop and provide the access to research
infrastructures and expertise at optimum
costs. IRESEN (Research Institute for Solar
Energy and New Energies) was established
in 2011 in order to lead and promote

74 | December 2017 | www.pv-tech.org
plant performance Technical Briefing
R&D in Morocco in the field of renewable
energy.
For this investigation, four PV modules
were measured individually. The PV
modules were built at Fraunhofer CSP
Module Technology Centre, Germany.
Apart from the front glass, the modules
have the same layout and the same materi-
als (solar cells, encapsulation, backsheet).
Two different types of front glass (ARC
and non-ARC) were used to study the
soiling behaviour due to the glass type.
The modules’ performance at STC lies close
to each other: ARC modules (Mod_1 and
Mod_2) show 245Wp, 37V and 8.9A and
non-ARC modules (Mod_3 and Mod_4)
244Wp, 37.1V and 8.8A.
The module measurements (IV-curves
and module temperature) were measured
synchronously in a time interval of 10
seconds and between the measurements,
every module is operated at maximum
power point (MPP). The weather data,
however, was measured every 60 seconds
and dust particle concentration were
measured with an interval of 10 minutes.
Different cleaning approaches were
applied for each glass type: twice per
week and twice per month. This results in
a “clean” and a “soiled” group containing
both glass types.
Data quality analysis
The measured module data was synchro-
nised and filtered for further evalua-
tion to avoid misinterpretations. The
measured data have different intervals
for various acquisition systems, therefore
the weather data and the dust particle
concentration were assumed as constant
for the subsequent 60 s and 10 min inter-
val, respectively. The data was processed
for plausibility by imposing physical
limits and statistical three-sigma limits
[7]. This ensures that the quality of the
analysing data used for characterising
soiling losses is least affected by noise
and outliers.
Characterisation of soiling
behaviour
Soiling losses
To determine module or system soiling
losses, the linear relationship between
short circuit current (ISC
) and irradiance (G)
was used (see Figure 2).
After linear regression in a specific time
period, a representative average relation-
ship can be approximated. Due to the
fact that the current is zero without any
irradiation, it is assumed to use the linear
regression model (ISC
) intercepting at the
origin: ISC
= sd G.
The resulting slope of the regression
coefficient (sd) characterises the quantita-
tive conversion of irradiation energy into
electrical current. In sense of this objective,
the slope sd determines the soiling state of
the PV module.
The slope can be variably applied in
terms of time period and PV module
samples. In this case, the slope per day
(sufficient data for a regression) and per
module is determined to obtain a valid
linear regression process. The slope sd can
be calculated as shown for any day (d):
Changes in the inclination of the regres-
sion slope from one day to another can be
interpreted as changes in the soiling state
Table 1. Maximum and average soiling
rate [%/day] for each module.
Soiling rate [%/day]
Module Mean Max (abs.)
Mod_1 -0.27 -0.57
Mod_2 -0.23 -0.36
Mod_3 -0.31 -1.16
Mod_4 -0.22 -0.34
Table 2. Characteristic parameters for
clustering.
Parameter Aggregation per day
Irradiance Irradiance yield sum
[kWh/m²]
Dust particle (air) PM total sum
[10³ μg/m³]
Relative humidity RH mean [%]
Ambient Tamb
mean [°C]
temperature
Wind speed WS mean [m/s]
Picture 1. Outdoor measuring set-up and installed PV modules in Green Energy Park of IRESEN, Ben Guerir, Morocco [8]

75 www.pv-tech.org | December 2017 |
plant performanceTechnical Briefing
of the module (cleaning or soiling effect).
This approach does not take in to account
any degradation or malfunction of the PV
module, the measuring equipment or the
irradiance sensor (regular cleaning of the
sensor was performed).
The daily slope differences (Δsd) were
calculated between one day and the day
before. If Δsd is positive, a cleaning event
has occurred (natural or manual); other-
wise, the soiling effect has increased.
Δsd
= sd - s
d-1
Using this approach the resulting
slopes per day for each module in the
given period are displayed in Figure 3.
This includes manual cleaning events
for comparison. The soiling behaviour
per module can be considered as the
decreasing slopes, and the various clean-
ing events can be deciphered from the
abruptly increasing slope.
An average soiling rate can be calculat-
ed by linear regression of the decreasing
slopes (normalised to the cleaned state of
the module) until the next cleaning event.
Table 1 shows the averaged soiling rate
for the four modules. Due to changes in
cleaning cycles and samples, this average
soiling rate was determined individually
per module, according to their soiling
behaviour between two cleaning events.
Nevertheless, Mod_1 and Mod_3 were
cleaned more frequently than Mod_2 and
Mod_4. Taking the results into account,
Mod_1 and Mod_3 show a higher soiling
rate than the more heavily soiled samples
(see Table 1). The soiling rate of the
cleaned modules is close to each other
and this also applies to the group of
soiled modules. On the contrary, a strong
effect between both glass types can’t be
seen.
Classification of environmental data
In order to classify the environmental
parameters with their day profile and
their possible interaction with each
other, the k-mean clustering method
was used, which is generally known for
cluster analysis in data mining. k-mean
clustering means that N observations for
n parameters are divided into k clusters,
with each observation belonging to the
nearest-distance (absolute difference) to
the cluster centre (centroid). These cluster
centres were determined iteratively by
reassigning the observations to the next
nearest center in each step. After which
the mean for each cluster defines a new
Figure 3. Variation
of daily slopes
between ISC
and
irradiance for four
modules with
different cleaning
cycles [8].
Figure 4. Results of five-dimensional clustering of environmental data into three clusters based
on daily values (cluster 1: red; cluster 2 green; cluster 3: blue) [8]

76 | December 2017 | www.pv-tech.org
plant performance Technical Briefing
cluster centre for the subsequent step.
The set of observations to be grouped is
75 days (N = 75). A suitable cluster solution
for this N with three or four clusters can
be selected to avoid a very small cluster
division of less than 10 days per cluster.
This work shows the estimation of three
clusters (k = 3). The parameters used for
clustering (n = 5), aggregated per day
(including night values) as sum or average,
are listed in Table 2.
The quality of the standard k-mean
method also depends on the randomly
chosen initial cluster centres before the
first iteration. To ensure a reliable minimum
sum of distances within each cluster, a
large number of repetitions (~10,000) of
the k-mean cluster were realised.
The results of the five-dimensional
clustering applied to the daily aggregated
environmental parameters (listed in Table
2), are shown in Figure 4. Both graphs are
based on the same data and clustering
process, in which the colours represent the
clusters. The difference between them is
due to the chosen environmental param-
eters and their dependency on each other
in their respective clusters.
From Figure 4 it can be seen that for this
particular site:
• Cluster 1 is concentrated at high RH and
moderate temperature.
• Cluster 3 is widely spread referring to RH
and Tamb
.
• The amount of cumulated air dust
increases with increasing Tamb
and
decreasing RH.
• The influence of wind speed shows no
clear tendency.
The ranges between the different
clusters in terms of minimum, maximum
and average values are listed in Table 3.
Referring to these values, because of the
multi-dimensional relationship, the clusters
overlap for several parameters. The clearest
distinction between the clusters is shown
in the accumulated dust (PM total), whose
values do not overlap.
Based on these results, each further day
(past/future) can be assigned to one of the
three clusters, if these five parameters are
known for this day.
Combination of soiling losses and
clustered environmental data
In the final step, the classified days can be
combined with the determined Δsd, from
one day to the other of each module. The
manual cleaning events must be excluded
in order to interpret the results based only
on environmental impact. These results are
shown in Figure 5 and in Figure 6.
In each cluster the soiling effects (Δsd<0)
have the main emphasis, but natural
cleaning effects (Δsd>0) also occur. A
different soiling behaviour with respect to
the cluster can be seen. Cluster 2 shows
the highest level of soiling followed by
cluster 3 and 1. Different soiling behaviour
between the cleaned and soiled modules,
as well in comparison to different types of
glass can be seen in Figure 6. This figure
shows the mean Δsd per module, per
cluster, with its corresponding uncertainty
(U(Δsd), error bars), to interpret the signifi-
cance of the results. The relative mean of
U(Δsd) is approximately 5.4% with respect
to all modules and clusters. The soiling
behaviour of the more frequently cleaned
Mod_1 and Mod_3 (ARC and non-ARC) in
each cluster is worse than their corre-
sponding soiled sample. This underlines
the results of Table 1. When comparing the
types of glass, the results are not as clear
in the three clusters (Figure 6). In cluster 1,
the non-ARC Mod_3 and Mod_4 show an
advantage in contrary to cluster 2 and 3.
Which deviation in short circuit current
corresponds to the determined Δsd? Table
4 tries to answer that, by assuming differ-
ent irradiance levels.
Final explanations
It is not trivial to decipher the effects of
soiling based on the type of glass chosen,
cleaning cycles and weather parameters.
The proposed approach tries to relate
them to each other. The results shown are
examples of possible relationships and
represent the measured site in Morocco.
Other locations worldwide may have
different results. The explanations before
showed how the results can be handled.
The results show a different soiling
behaviour between the cleaned and dirty
modules and a comparison of both types
of glass in the different clusters of environ-
mental conditions per day. It is also impor-
tant to note that the mean values of slope
differences of each module are found by all
clusters in the first quadrant ‘Soiling effect’,
which implies the decreasing slopes for all
modules. The manual cleaning events are
excluded in order to interpret the results
only because of environmental impacts;
Table 3. Characterisation of clusters: minimum, maximum and
mean values for each parameter and cluster
Parameter Cluster 1 Cluster 2 Cluster 3
Irradiance
[kWh/m²]
5.5 – 8
(Ø 7.1)
1 – 7.8
(Ø 6.6)
4 – 7.4
(Ø 6.6)
PM total
[10³ μg/m³]
10.7 – 100.7
(Ø 59.1)
108.6 – 198.7
(Ø 155.5)
206.8 – 381
(Ø 262.7)
RH [%] 26.5 – 68
(Ø 55.1)
28.1 – 76.9
(Ø 55.5)
14.9 – 71.4
(Ø 40.9)
Tamb
[°C] 18.2 – 27.1
(Ø 21.6)
17.9 – 30.4
(Ø 23.7)
18.8 – 35.7
(Ø 28.6)
WS [m/s] 2.2 – 6.5
(Ø 4.1)
2.2 – 5.2
(Ø 3.5)
2.5 – 4.8
(Ø 3.4)
Figure 5. Slope difference Δsd between two consecutive days;
box plots (extreme values, quartile (25, 50, 75%) and mean)
for each module and each cluster [8]
Figure 6. Mean of slope difference Δsd
between two consecutive days per
module and cluster [8].
Table 4. Deviation in ISC
determined per cluster by using mean
value of slope differences (one day to the other) at different
irradiances
Cluster 1 Cluster 2 Cluster 3
1000 -11.3 -43.7 -26.5
800 -9.0 -35.0 -21.2
500 -5.6 -21.9 -13.3
250 -2.8 -10.9 -6.6
Deviation in short circuit current [mA]Irradiance
[W/m²]

[1] F. A. Mejia, J. Kleissl, “Soiling losses for solar photovoltaic systems in California”, Solar
Energy Volume 95, September 2013, Pages 357-363.
[2] A. Sayyah et al. “Yield loss of photovoltaic panels caused by depositions”, Solar Energy,
September 2014.
[3] T. Sarver et al. “A comprehensive review of the impact of dust on the use of solar
energy: History, investigations, results, literature, and mitigation apparoaches”,
Renewable and Sustainable Energy Reviews 22, 2013, pp. 698-733.
[4] H. Haeberlin, J.D. Graf, 1998, “Gradual reduction of PV generator yield due to
pollution”, Second World Conference on Photovoltaic Solar Energy Conversion.
[5] A.M. Pavan, A. Mellit, D. De Pieri, “The effect of soiling on energy production for large-
scale photovoltaic plants”, Solar Energy, 85 (2011), pp. 1128-1136.
[6] Malik, S., Ebert, M., Naimi Z., Ikken, B., “Development of outdoor research platforms
and tests on photovoltaic modules in the green energy park in Morocco”, Proc. of
1st Africa Photovoltaic Solar Energy Conference and Exhibition Africa PVSEC 2014,
Durban; WIP Renewable Energies; pp.19-23.
[7] Malik, S. et al, “Outdoor data evaluation of half-/full-cell-modules with regard
to measurement uncertainties and the application of statistical methods“, 29th
European Photovoltaic Solar Energy Conference and Exhibition, P. 3269-3273, 2014,
Amsterdam.
[8] Daßler, D., Malik, S., Pandiyan, A., Benazzouz, A., Ikken, B., Ebert, M., “Advanced
Method for Determining Soiling Losses on PV Modules in Desert Climate”, 33rd
European Photovoltaic Solar Energy Conference and Exhibition, Amsterdam 2017,
DOI 10.4229/EUPVSEC20172017-5DV.3.31.
References
David Daßler received his MSc in applied mathematics from
Leipzig University of Applied Sciences. Since 2012, he has
worked in Fraunhofer CSP’s “Reliability of Solar Modules and
Systems” group, specialising in yield analysis. In 2015 he began
his PhD about yield modelling in desert climates.
Stephanie Malik has worked as an engineer in the “Reliability of
Solar Modules and Systems” group at Fraunhofer CSP since 2012,
focusing on outdoor measurements and yield analysis. Before
joining Fraunhofer, she was active in the R&D department of
Q-Cells, now Hanwha Q CELLS, for five years.
Akshayaa Pandiyan is currently working as a research assistant
at Fraunhofer CSP, after obtaining her MSc in renewable energy
engineering from the University of Freiburg. She shares an inter-
est for research in renewable energy, computational program-
ming and system modelling.
Authors
this could have resulted in higher slope diff erences. The soiling behaviour of
the more frequently cleaned Mod_1 and Mod_3 is worse for both modules
types in every cluster than their corresponding soiled sample, which underlines
a hypothesis that a cleaned module surface is particularly more susceptible to
soiling eff ects than an already soiled layer of particulate matter to attract more
dust and dirt until a saturated soiled state is reached.
Another interesting point to highlight is the higher slope diff erences (day-to-
day) of cluster 2 than those of cluster 3, despite the higher concentration of
dust in cluster 3. Although cluster 2 has a lower dust concentration than cluster
3, the mean humidity in cluster 2 is higher (Table 3). On the other hand, it is
assumed that increasing the density of the aerosol particles suspended in the
atmosphere results in more sedimentation of dust particles on the module
surface. This is an illustration of the complicated relationship between the
various environmental parameters that infl uence soiling and the importance
of the proposed method by clustering various environmental parameters
and examining their soiling eff ects towards energy loss. Afterwards, the most
important infl uencing parameters can be determined more precisely and then
used to model the soiling eff ects on PV modules.
However, the end estimation of soiling losses is derived as a function of
environmental parameters. Therefore, this work has the additional advantage
that it can be used anywhere, if the environmental conditions are known. In
a precision-based comparison, this method is very accurate in distinguishing
between the module properties and the state of soiling of the modules.

78 | December 2017 | www.pv-tech.org
plant performance
A blackout forced by hackers from
rogue states or criminal gangs may
sound like a plot from a James
Bond movie but the issue is high on the
agenda of governments and electricity
utilities worldwide.
Just last month – November 2017 –
thousands of people working in industry
or government in the US, Canada and
Mexico took part in a large-scale exercise
that simulated a cyber attack on electrical
networks. Grid Ex IV was the fourth event
of its kind run by the North American
Electric Reliability Corporation (NERC) and
is designed to test participants’ preparation
for such an event happening in reality.
Over in Europe, the EU Agency for
Network and Information Security has
co-ordinated similar exercises since
2010. The most recent simulation in 2016
imagined a blackout in a European country
over the Christmas period, and used actors
and social media to make the scenario
more realistic. Over 300 organisations had
to deal with a series of problems caused
by malware, ransomware, drones and the
Internet of Things.
It is not just governments that are
seeing the threat. In a survey of senior
utility executives worldwide published
by consultancy EY in November, 82% of
respondents ranked business interruption
from cyber attacks and storms in their top
three threats.
Examples of cyber attacks specifically
targeted against an electricity network so
Cyber security | The digitalisation and distribution of the energy system is creating potentially more points of vulnerability for hackers to exploit. Catherine Early looks at how the PV industry is responding to ensure plants are kept safe from attack
Cyber security: how prepared is the PV industry?
The risk of cyber attacks on PV power plants and other smart
grid infrastructure is attracting growing attention from indus-
try and government
Cre
dit
Flic
kr/b
log
trep
ren
eur.c
om
/tec
h

79 www.pv-tech.org | December 2017 |
plant performance
far are rare. According to the International
Energy Agency, the first such incident was
in the Ukraine in 2015. Attackers accessed
substations’ supervisory control and data
acquisition (SCADA) system and firmware
with a combination of malware, person-
nel credentials obtained through of email
phishing, and Denial of Service (DoS) to
prevent customers from obtaining call
centre information about the blackout.
Around a quarter of a million people lost
power. A similar attack followed in 2016.
The threat specifically to solar PV equip-
ment is small, but should not be ignored,
according to experts. Duncan Page, a cyber
security specialist at consultancy PwC,
says that at the most basic level, someone
could take a site offline, preventing it
from generating electricity and therefore
earning revenue. Taking it a step further,
they could corrupt the system, blocking
the utility from getting it back up and
running, he says.
This becomes more serious if a utility has
contracts with a grid operator to provide
services such as balancing or frequency
response, he adds. In future, solar farms are
likely to also incorporate storage equipment
and batteries with local control systems,
making them more complex. This not only
increases the risk of an attack occurring, but
also its potential impact.
“As the grid becomes smarter and more
interrelated and utilities enter into more
relationships that earn money from their
assets, the implications of being hacked
will become greater and more compli-
cated,” Page says.
Cyril Draffin, a cybersecurity expert
who advises the Massachusetts Institute
of Technology energy initiative, says that
hackers wanting to take down a whole
grid are most likely to be acting on behalf
of nation states, as major attacks take time
and resources to execute. Experts estimate
that hackers would have spent around
six months developing the attack in the
Ukraine, which the country blamed on
Russian security services.
Cyber security has been a concern in the
wider energy sector for some time, but the
growing use of renewable energy, batteries
and electric vehicles has heightened the
risks. By connecting such assets to their
networks, utilities are effectively expos-
ing them to third-party access, explains
Daniel Arnold, researcher and engineer at
the US-based Lawrence Berkeley National
Laboratory (LBNL). “These devices could be
co-opted to introduce problems into the
electricity grid,” he says.
A vulnerability hackers could exploit is
the inverters used in PV systems, Arnold
says. “There are autonomous control
functions on these devices that are meant
to regulate their power output for system
safety and reliability. They can be changed
in a way that could cause problems for
the grid in terms of voltage oscillations if
enough devices were affected,” he says.
However, Arnold also sees the connec-
tion of third-party devices to the grid as an
opportunity as well as a risk. He is leading
a major government-funded project at
the LBNL which is developing ways to use
these devices to fight off attacks (see box,
next page).
Detlef Beister, business development
manager at German inverter manufacturer
SMA Solar Technology, says that distrib-
uted energy systems have advantages over
traditional centralised power stations in
terms of cyber security. “It’s much harder
for hackers to damage distributed supply
as they would have to attack a large
number of devices, which would take a lot
of time and money to do,” he says.
However, having multiple small sites can
also be a challenge to protect, Page warns.
When dealing with attacks, companies
tend to fall down on the application of
security, rather than lacking security
tools and technologies, he says. For
example, solar farms tend to be small and
unmanned, so it is harder to keep up to
date with security patches.
“Operators need to make sure that their
security frameworks are just as good at
protecting small sites as they are at control-
ling the central IT estate,” he says. Once a
vulnerability has been identified, it would
be relatively easy to scale up an attack with
a large number of small sites, he adds.
“There is no substitute for think-
ing about security at the design stage;
then there should be enough tools and
techniques available,” he says. This is
one advantage the solar power industry
has over more traditional energy plants,
since most equipment has been installed
relatively recently, he says.
Industry and government action
Manufacturers also have a part to play.
SMA has several strategies to deal with
cyber security, according to its information
security manager Marek Seeger. It has a
team of people who work on ensuring that
its products are certified to security stand-
ards and pass security tests. They are also
tested by independent companies who
employ hackers to test for vulnerabilities.
The company’s products were recently
criticised by Dutch cyber security engineer
Willem Westerhof, who claimed that its
inverters were vulnerable to attack. SMA
acknowledges some problems exist with
four older models of inverter, the Sunny
Boy models TLST-21 and TL-21, and Sunny
Tripower models TL-10 and TL-30.
However, the company stresses that
even if operators use these inverters, a
potential hacker would need to have
extensive expertise to hack. It denies
Westerhof’s claims that there are a poten-
tial 17GW of solar inverter power at risk,
saying that this figure represents its entire
sales, not sales of the affected products,
which is a fraction of this.
“We see absolutely no danger to grid
stability even in the extremely unlikely
event that all inverters should be success-
fully attacked at the same time,” the
company states.
The company publishes guidance for
its customers to help them implement
robust security measures. According to
the guidance, when a PV system is being
connected to the internet, the system
operator or network administrator must
have knowledge of all devices active in the
network, including their communication
requirements and features and possible
vulnerabilities. They should also know all
accounts that access the systems, how to
limit access to the network and devices,
and they should have installed all security
tools such as a firewall and proxy server.
“Manufacturers and customers need
to work together to stay up to date and
secure on cyber security,” Seeger says.
String inverter manufacturer SolarEdge
says it is also taking the threat seriously.
Lior Handelsman, vice president of market-
ing and product strategy at the company,
explains that it embeds information
“There are autonomous control functions on inverters that are meant to regulate their power output for system safety and relia-bility. They can be changed in a way that could cause problems for the grid in terms of voltage oscil-lations if enough devices were affected”

80 | December 2017 | www.pv-tech.org
plant performance
security into all product development,
runs stress tests on its security systems and
encrypts and authenticates communica-
tion channels. If an attack did take place,
it has backup protection and restoration
plans to minimise potential damage, he
says.
However, Handelsman believes that
more needs to be done industry-wide. “The
entire energy industry, including solar,
needs to view cyber security as a necessity.
As such, we have called for the creation
of an industry-wide body that includes all
stakeholders to share information in order
to prevent attacks and help prevent PV’s
collective brand from being damaged,” he
says.
Such a body would mean that the whole
sector was working together to identify
risks, and could create unified standards
and regulations on encryption, backup,
reporting breaches, protocols, endpoint
security, penetration testing, server
security and hardening, hosting security
and database security, he says.
Other industry players have also been
thinking about standards and regulations
on cyber security. In Europe, PV trade
association Solar Power Europe has set up
a task force on digitalisation covering all
aspects of how smart grids, buildings and
meters will affect the sector’s operations.
The task force is being led by SMA, and its
30 members include manufacturers ABB,
Siemens and utilities Centrica and RWE.
The task force has called on policy
makers to support the PV industry in its
transition to full digitalisation, and has
highlighted cyber security as one of the
10 aspects of regulation that it wants
addressed.
A lack of internationally binding stand-
ards or requirements mean that it is up
to manufacturers how seriously they take
cyber security and whether their products
adhere to any of these standards, the task
force says. It therefore wants internation-
ally binding, consistent and modern cyber
security regulation.
In turn, the task force has produced
seven commitments on digitalisation that
its members have signed up to, including
championing data protection and putting
in place stringent cyber security measures.
Meanwhile, the EU is working on
strengthening its cyber security strategies
and policies. The bloc’s first legislation on
cyber security, the Network and Informa-
tion Security (NIS) Directive, was adopted
by the European Parliament in July 2016. It
requires member states to adopt a national
strategy for NIS security and to designate
responsibility for the issue to a national
authority. It also enhances cooperation
on cyber security among member states
through a dedicated group on the issue.
In September 2017, the European
Commission stepped up its action by
proposing an EU cyber security agency
to help member states in dealing with
attacks, as well as a new European certifica-
tion scheme to ensure that digital products
and services are safe to use.
In the US, multiple organisations have
responsibilities for cyber security, ranging
from the Federal Bureau of Investigation
to individual state government. Cyber
security in the energy sector is led by
the Department of Energy (DoE). It has
developed strategies to coordinate public
and private initiatives for resilient energy
systems, and in 2013, launched public-
private partnership the Cybersecurity Risk
Information Sharing Programme to provide
the electricity sector with near-time cyber
threat information and analysis. The US
also works with Canada on standards to
maintain critical infrastructure within the
North American Electric Reliability Corpo-
ration (NERC).
Some countries obligate organisa-
tions that provide critical infrastructure
to comply with standards such as ISO/
IEC 27001, which sets out best practice
for management of information security.
Product standards include ISO/IEC 27032,
PAS 555, UL 2900 and IEC 62443. There is
also the US National Institute of Standards
and Technology (NIST) Cybersecurity
Framework, which comprises voluntary
guidance to organisations on reducing
cyber security risks.
“There is a well organised overall
direction, but responsibility for cyber
security and response to attacks resides
with companies, individual government
agencies and organisations, and some are
much better prepared than others,” Draffin
says.
Large solar PV systems owned by
electric utilities do have to meet NERC
critical infrastructure protection standards,
but there are no regulations that apply to
small solar PV. Draffin believes that regula-
tions should be mandated for all solar PV
systems connected to the grid, and all
should use best practice.
However, he warns: “Just as it is impos-
sible to stop all crimes, it is impossible
to have fully effective cyber defences,
because adversaries are constantly improv-
ing their attacks and approaches, and new
software with vulnerabilities are being
introduced.”
Catherine Early is a freelance journalist
specialising in energy and the environment
“Utilities connecting third-party devices to their systems are simultaneously creating a vulnerability and
an opportunity for better defence,” says Daniel Arnold, a researcher in the Grid Integration Group at the
Lawrence Berkeley National Laboratory in America.
Arnold is exploring ways to use this theory to develop defences against cyber attacks on inverter
technology. In September, his project was one of 20 awarded up to US$2.5 million funding by the US
Department of Energy, which is seeking innovative, scalable and cost-effective solutions to deal with cyber
security issues. The three-year project will test ways of enabling electricity grids to resist cyber attacks by
developing adaptive control algorithms for distributed energy resources, voltage regulation and protection
systems.
Industry and government are developing standards for how solar inverters communicate with the grid
so that the PV modules can adjust their power levels accordingly. “It is this standardisation that presents a
vulnerability,” says Arnold.
The project will develop algorithms to use the system in the same way the hackers might do, but will
nullify the attack by sending the opposite signals. “If an attacker tries to manipulate the settings in a
number of PV inverters, we’ll observe these manipulations, then identify the settings in PV inverters that
have not been hacked, and finally, dispatch the appropriate settings to the inverters deemed safe in order
to counter that attack,” explains Arnold.
LBNL’s approach is to consider what would happen if all existing cyber defence tools such as encryption
fail and a hostile entity gains control of a PV system. “We’re putting ourselves in the perspective of the
hacker to understand what defences we should deploy to fight off these attacks,” he says.
The team has discovered several methods by which control systems could be manipulated to create a
problem, and it has also discovered ways in which it could counteract these attacks. One challenge for the
project will be how to fully test the algorithms, Arnold says.
“It’s very difficult to trial on a real system as we’d have to fall victim to an attack, and defend against it, or
we’d have to simulate an attack ourselves, which utilities aren’t exactly keen to do. So although we’re going
to deploy this on real networks, we’ll have to be creative in how we test it,” he says.
Partners on the project include trade bodies the SunSpec Alliance and HDPV Alliance, manufacturers
SolarEdge and Siemens, and Arizona State University.
The ultimate aim is to develop algorithms that can monitor the grid to provide advanced warning to a
utility operator of a possible emerging attack.
Inverters the focus of efforts to beat hackers at their own game

storage & smart power
8483 News Round-up of the biggest stories in energy
storage
84 Distributed energy technologies challenge conventional thinking around grid planning Storage as an alternative to new transmission and distribution infrastructure
89 Blockchain in the future energy system Hype meets reality
92 Life at the frontier of green investment Clean energy finance pioneer Jigar Shah on his hopes for energy storage
Presented to you by:

82 | December 2017 | www.pv-tech.org
Storage & smart power
www.energy-storage.news
Welcome to this sophomore edition of Storage & Smart
Power, brought to you by the team at Energy-Storage.
News.
As we approach the end of 2017, without even looking
through the statistics I can tell you that we’ve had our
busiest year ever, and while much of the action has been
concentrated in the key markets you might expect, there
have been a fair few surprises too.
Over the past year or so we’ve seen institutional
investment start to trickle into the sector, we’ve seen
commercial and industrial markets really open up in the
US and Canada, we’ve seen grid services markets launch
in Europe. We’ve seen battery storage projects delivered
in record time, we’ve seen third-party project financing
kick off and we’ve seen behind-the-meter systems
coordinated to create virtual power plants in numerous
territories.
Yes, we still see the same lack of understanding in
the mainstream press, when a story occasionally breaks
through. The public is still hungry to learn more about
what energy storage can do, especially in its relationship
with renewables, but as we’ve seen in solar before, it
takes some time, a lot of deployment and a fair bit of
money to come in before potentially world-changing new
technologies gain acceptance.
With this in mind, we hope that the three special
feature articles we’ve brought you this quarter each touch
on or confront some of the biggest talking points in
energy storage today:
Navigant Research analyst Alex Eller, whom some
of you will know from previous contributions on the
importance of energy storage software and other
topics, has written about the case for energy storage as
an alternative to transmission and distribution (T&D)
infrastructure spending. At utility or grid-planning level,
‘non-wires alternatives’ could have a big impact on
network modernisation. Alex writes about exploring this
use case.
There’s not been a ‘buzzier’ buzzword this year
in energy – or in fact, in IT and a few dozen other
sectors – than “blockchain”. The digital ledger system is
transforming the use of data across the world, seen as a
near-foolproof way to create and document thousands
of transactions every minute. Dr. Carsten Reincke-Collon
of Younicos writes about how it can be used – and what
its limitations are. Also contributing to that piece is
Sonnen’s new chief of e-services, Jean-Baptiste Cornefert,
who writes about the German company’s first-hand
experiences with the technology.
Finally, who better to reflect on the changing ways
in which storage and other clean energy technologies
are funded and deployed than solar finance guru Jigar
Shah? We interviewed Shah, who says a recent US$200
million investment gives his company, Generate Capital,
“complete freedom” to invest, from the “misunderstood”
frontier of clean energy.
Whether you’ve picked this journal up at a trade show,
you’ve been sent it in the post or you’re reading online,
we hope you enjoy our exclusive content and find it
informative and useful.
See you next year!
Andy Colthorpe
Solar Media
Introduction
Visit the site and subscribe free to the Energy-Storage.News
newsletter today. Technology with the capacity to change the world.

NEWS
83 www.pv-tech.org | December 2017 |
Tesla makes good on ‘100 day’ battery promise
Tesla’s work on a 129MWh energy storage system in South Australia
appears on track to be completed in time.
South Australia’s government turned to the idea of a giant
lithium-ion battery storage system backed with diesel following
major blackouts in September 2016.
Tesla CEO Elon Musk famously ended up promising to deliver a
100MW/129MWh project within 100 days of contracts being signed
or deliver it for free.
Tesla switched from its usual battery cell supplier Panasonic to
Samsung SDI, in order to expedite deliveries and construction. At
the time of going to press, the system was about to enter a phase of
regulatory testing ahead of it being put into use.
Australia’s first unsubsidised grid-scale battery helped by CEFC
debt-financing
Australia’s Clean Energy Finance Corporation (CEFC) will help finance
the country’s first “unsubsidised large-scale grid-connected battery”,
co-located with a wind farm in South Australia.
Lincoln Gap wind farm is currently being developed in Port
Augusta, South Australia and will host a 10MW/10MWh battery
energy storage system, which is expected to assist the integration of
renewable energy and perform some grid-balancing services.
CEFC will provide AU$150 million in debt financing for the first
phase of construction – including a portion of the storage system’s
costs. Stage one of construction is worth about AU$300 million and
comprises 126MW of the wind farm’s generation capacity.
Chinese government’s strategic push for energy storage to yield
large flow battery projects
A project demonstrating the integration of energy storage onto grid
networks in Hubei, China, will see the first phase of a 10MW/40MWh
project built by Pu Neng, a vanadium flow battery manufacturer.
According to Pu Neng, the 40MWh project itself will soon be
superseded in size in Hubei by a mammoth 100MW/500MWh
energy storage system that is expected to “be the cornerstone of a
new smart energy grid” in the province.
In September the China National Development and Reform
Commission (NDRC) called for more investment in energy storage,
including flow batteries. A 200MW/800MWh vanadium energy
storage project is being built in Dalian, by Rongke Power and
UniEnergy Technologies.
Centrica reveals early stage plans for a 100MW battery in Ireland
Utility Centrica has revealed plans to build a single 100MW battery
energy storage system in Ireland to take advantage of capacity market
and grid services opportunities currently under development.
The project is said to be at the early stages of development, with
planning documents submitted in three locations – Kilkenny, Athlone
in Westmeath and Cahir in Tipperary – by Bord Gáis, the previously
state-owned power and gas company bought by Centrica in 2014.
Centrica’s project manager Chris Read explained that one of the
sites could see the huge battery built, with the potential for a recip-
rocating gas engine and gas turbine at the others.
‘World’s tallest’ wind turbine gets 70MWh of pumped storage
The world’s tallest wind turbine to date will be paired with 70MWh of
pumped hydro energy storage onsite.
Four turbines of 3.4MW rated capacity each are being installed in
Gaildorf, near Stuttgart in southern Germany, by Max Bögl Wind.
The wind farm includes one turbine with a height of 246.5 metres,
to date the world’s largest on-shore wind turbine. This impressive
height was only achievable due to the incorporation of a pumped
hydro storage into the wind farm, because its foundations stand
inside a natural reservoir used to store water before it is dropped
down a hill through more turbines into another pool, generating
electricity in the process. The depth of this reservoir adds another 40
metres to the height of the turbine.
Dominican Republic energy storage stayed resilient during Hurri-
canes Irma and Maria
AES claims that 20MW of energy storage it deployed in the Domini-
can Republic just a few weeks before Hurricane Irma assisted the
island nation in keeping power supplies running even as devasta-
tion struck.
In late August, local subsidiary AES Dominicana commissioned
two 10MW energy storage facilities using lithium-ion batteries. Both
are able to store energy for 30 minutes duration.
AES said the Andres and Los Mina DPP projects, “played a key role
in maintaining grid stability” as Hurricanes Irma and Maria struck.
The plants provide frequency control services. They also support the
operation of the Republic’s interconnected electricity system, SENI.
AES said no outages were experienced at either array, with both
maintaining their full operational capacity throughout.
Mahindra wins India’s first large-scale solar-plus-storage auction
Indian state-run coal mining and power firm NLC India auctioned
a 20MW solar PV project to be combined with 28MWh of energy
storage capacity in the Andaman and Nicobar Islands in October.
This is the first time such an auction for utility-scale storage has
been completed in India with bids announced.
The NLC tender includes EPC and O&M services for 25 years and
Indian firm Mahindra Susten won by quoting a price of INR2.99
billion (US$46 million). Other bidders included Adani, Sterling &
Wilson, Ujaas, Exide, Hero and BHEL.
Cre
dit
Tesl
a
Tesla has promised to deliver a 100MW li-ion battery in
South Australia within 100 days
The ‘world’s tallest’wind
turbine has been completed
along with 70MWh of
pumped hydro storage
Cre
dit
Ma
x Bö
gl W
ind

84 | December 2017 | www.pv-tech.org
Storage & smart power
Innovations in new distributed energy
technologies are challenging conven-
tional thinking around the most effective
ways to serve electricity customers and
utilise grid infrastructure. These innovations
in hardware, software and business models
are helping to drive the overall transition
to a more resilient and intelligent energy
system that aims to deliver cleaner and
more efficient electricity to an increasingly
engaged customer base.
Maintaining and upgrading transmission
and distribution (T&D) networks represents
one of the most significant expenses for
electric utilities and traditionally there were
few alternatives to costly investments in
expanded capacity. The new generation
of less expensive and more intelligent
distributed energy resources (DER) and
energy storage technologies located on
both the T&D grid and customers’ proper-
ties has opened the door to a compelling
array of new options for how to best utilise
existing infrastructure. These technologies
will disrupt the conventional T&D industry
by maximising the value and efficiency
of existing grid assets while empowering
customers to participate in the manage-
ment of the grid. This article will explore
the overall drivers of T&D upgrades and the
challenges facing these projects as well as
new alternatives, with a focus on diverse
non-wire alternative (NWA) projects, their
benefits and challenges and the emerging
trend of using purely energy storage to
defer costly upgrades [1].
A need for upgrades
The electric T&D system is a constantly
evolving machine that requires continual
monitoring, maintenance and upgrades.
Traditionally, the required upgrades to the
T&D system were relatively easy to predict
and could utilise a consistent and standard
set of grid equipment and infrastructure
to meet growing electricity demand.
Rapidly evolving technologies and evolving
customer demands have made predicting
and performing grid upgrades much more
complex in recent years. There are three
primary issues driving the need for T&D
upgrades:
• Congestion and generation curtail-
ment: The growing amounts of variable
renewable generation have exacerbated
Distributed energy technologies challenge conventional thinking around grid planning
Cre
dit
Sco
tt D
reg
er/S
ou
ther
n C
alif
orn
ia E
dis
on
Energy storage is
among the emerg-
ing technologies
challenging
conventional
thinking on grid
improvements
Grids | New storage and renewable energy technologies offer a potentially disruptive alternative to costly, unpopular investment in grid infrastructure improvements. Alex Eller looks at the opportunities for non-wire alternatives to maintaining transmission and distribution networks

SOLARPOWERINTERNATIONALSeptember 24-27, 2018Anaheim Convention Center Anaheim, CA
Showcase Your Technical & Scientific ExpertiseThe Technical Symposium at Solar Power International offers professionals from the academic, R&D, technical and scientific disciplines in photovoltaics, energy storage and ‘smart’ energy the opportunity to submit abstracts for peer review, presentation and discussion, and publication at the largest gathering of the solar community in North America.
The deadline to submit an abstract is on February 9, 2018
Learn more at solarpowerinternational.com/the-technical-symposium
POWERED BY

86 | December 2017 | www.pv-tech.org
Storage & smart power
congestion challenges in many areas,
leading to the curtailment of energy.
Actual rates of curtailment vary consid-
erably in markets around the world.
The highest average curtailment rates
have been seen in China, where some
provinces have wasted nearly 39% of
wind generation due in part to limited
transmission capacity [2].
• Load and peak demand growth:
Typically, increasing demand for electric-
ity and load growth has closely followed
overall economic development. However,
load growth rates have decreased
or remained flat in many developed
economies in recent years, while the
dynamics of peak demand periods on
the grid continue to evolve. Some utilities
are experiencing decreasing overall load
growth rates, yet increasing growth in
their peak demand. New sources of load,
notably EVs, are expected to reverse
the trend toward decreasing electricity
demand growth over the coming years.
This new load growth will be variable
and often concentrated in specific areas,
providing an advantage for more flexible
NWA-type solutions.
• Reliability: Improving reliability is a
particular concern for commercial and
industrial (C&I) customers, which often
place a premium on reliability as they
risk significant financial losses from an
outage. Utilities are increasingly focused
on improving reliability in the face of
competition from third-party energy
service providers targeting C&I custom-
ers. Furthermore, the overall resilience
of the grid is becoming a greater focal
point for governments and regulators
in the face of both natural disasters and
physical and cyber security threats. The
diversification and expansion of the grid
can reduce the potential effects of these
events.
Building new T&D infrastructure has been
the default solution to issues facing the
electricity grid for decades. However, there
are many challenges to upgrading grid
infrastructure, particularly large-scale trans-
mission projects. These challenges include
concerns from local communities, the time
required to develop and build projects,
uncertainty around future load growth
and demand patterns, and the rising costs
to build new infrastructure in both urban
and remote areas. Given these challenges,
the falling costs of energy storage and DER
technologies are presenting an increasingly
economical alternative to conventional T&D
projects.
Innovations in grid management and
DER technologies have presented a new
set of possibilities to maximise the use of
existing grid infrastructure and defer or
entirely avoid costly upgrades. At the same
time, many utilities are seeking to engage
customers and provide more value-added
services in response to growing competi-
tion. Creative solutions to address infrastruc-
ture needs at a lower cost with greater
customer and environmental benefits,
known as NWAs, are being tested around
the world. Navigant Research defines an
NWA as:
“An electricity grid investment or project
that uses non-traditional T&D solutions, such
as distributed generation, energy storage,
energy efficiency, demand response (DR), and
grid software and controls, to defer or replace
the need for specific equipment upgrades,
such as T&D lines or transformers, by reducing
load at a substation or circuit level.”
Overall, the major advantage is the
greater flexibility provided by NWAs
compared to traditional investments. A
DER-based approach to meeting load
growth can more closely match actual
conditions on the grid without unnecessary
investments. The graphic below illustrates
how a DER approach can better match
growing demand and defer a much larger
investment.
Driving growth
Although there is a wide range of specific
factors leading to the development of NWA
projects, there are five primary drivers in the
market which also represent some of the
fundamental changes underpinning the
shifts in this industry and the challenges to
the traditional utility business model. These
drivers include:
• Regulatory policies: Regulations and
policies can provide incentives to utilities
to implement more NWAs, such as allow-
ing the sharing of economic benefits
between customers and shareholders
rather than all savings going to custom-
ers. Many of these policies are designed
to reduce the environmental impact of
electricity generation and usage by limit-
ing the need for new power plants and
T&D infrastructure.
• Economics: By far the most significant
economic benefit of an NWA is the defer-
ral benefit of the large capital investment.
Traditional T&D upgrades have risen in
cost and complexity in recent years, while
DER technologies and grid management
software and communications have seen
dramatic price decreases.
• Utility customer engagement: Faced
with competition from customer-owned
DER technologies and third-party energy
service providers, utilities are working
to offer new solutions and improve
customer engagement.
• Load growth uncertainty: Short-term
investments in NWAs can defer much
larger infrastructure investments, giving
a utility time to assess whether the infra-
structure investment is truly required and
to investigate other potential options.
To date, most NWA projects developed
have been in the US and the list of projects
is expected to grow quickly. New York utility
Consolidated Edison (Con Edison) was one
of the early pioneers of NWA strategies.
The utility began geographically targeting
energy efficiency investments in 2003 when
growing demand caused several distribu-
tion networks to approach peak capacity.
These efforts evolved into the well-known
Brooklyn Queens Demand Management
Programme (BQDM) [3]. This programme
intends to use many forms of DER to defer
or avoid costly T&D infrastructure projects,
specifically a new US$1 billion substation
for the Brooklyn/Queens area, a region
Figure 1. The value of a non-wire alternative or energy storage/DER approach to defer T&D upgrade
Sou
rce:
Co
nso
lida
ted
Ed
iso
n

Storage & smart power
27-28 February 2018 LONDON, UK
Our 2017 event sold out so
BOOK NOW
to secure your place
This year introducing an international stream
storage.solarenergyevents.com [email protected]
Would/would likely attend Energy Storage Summit again
100%In terms of face-time with company representatives on stands, as well as networking opportunities, this was the best storage related event that I have been to over the last year or so.Trevor Hunter, Coriolis Energy
2017 CONTENT PARTNER:
investment. PG&E in California has also
been experimenting with NWAs for many
years, with a focus on targeted DSM efforts.
Using DSM to defer investments in T&D
capacity frees up constrained capital to fund
other, more valuable projects for its system.
Furthermore, PG&E believes that engage-
ment with a DSM programme significantly
increases customer satisfaction.
Risk aversion hinders widespread
adoption
Despite the advantages and growing
popularity of NWA programmes, signifi-
cant barriers remain to more widespread
adoption. As with many new electrical grid
technologies, the level of confidence utili-
ties have in the new programmes is crucial.
Although early results have been promising,
many utilities do not yet have enough faith
in NWA programmes to overcome the tradi-
tional preference and expertise with T&D
investments. This lack of faith is the result of
both an institutional resistance to change
within many organisations and the fact that
prevailing rate recovery mechanisms for
utilities typically do not encourage alterna-
tives and innovation. If there is no regula-
tory pressure in place, there are few reasons
why a utility would pursue an NWA. There
is a higher perceived risk associated with
these types of short measure life projects
expected to see significant demand growth.
The BQDM programme is expected to
spend US$200 million on demand-side load
management (DSM) programmes to shed
52MW of load – 41MW from the customer
side and 11MW from non-traditional, utility-
side measures. Figure 2 illustrates the antici-
pated resource portfolio of the programme
in 2018, highlighting the diversity of DER
being utilised.
On the West Coast of the US, two of
the largest grid operators and electricity
providers, Bonneville Power Administration
(BPA) and Pacific Gas & Electric (PG&E), are
also exploring NWAs [4]. While BPA has been
evaluating NWA options for many years, its
first commercial project was announced in
May 2017, aiming to avoid replacing a large
and expensive transmission line in Oregon
and Washington. After almost 10 years of
planning the upgrade with strong public
opposition and increasing project costs, BPA
decided instead to implement various NWA
options, including energy efficiency, DR,
rooftop solar and possibly energy storage
to avoid the large transmission system
Figure 2. Anticipated BQDM 2018 Portfolio.
Sou
rce:
Co
nso
lida
ted
Ed
iso
n

88 | December 2017 | www.pv-tech.org
Storage & smart power
are several barriers standing in the way of
energy storage being widely used to defer
T&D investments. Despite recent advances,
the technology and market remain quite
new and immature, resulting in a conserva-
tive approach from often risk-averse
utilities. Fully understanding and analysing
the value of these energy storage projects
is also challenging as the complex nature
of the technology –including its ability to
provide multiple services at different times
– is not captured in many grid modelling
and simulation systems. Furthermore, there
is a major variation in the costs to upgrade
T&D infrastructure. Energy storage and
NWAs are typically only a cost-effective
alternative when T&D projects face high
costs due to challenging terrain, popula-
tion density, real estate costs, weather
constraints and other issues.
While barriers to widespread growth
remain, both NWAs and storage-specific
projects to defer T&D investments are
gaining significant momentum with a
variety of new projects being developed
around the world. In addition to the
NWA projects already discussed, energy
storage projects for T&D deferral are
growing in popularity and have recently
been announced in Arizona, California,
Massachusetts and Australia. These new
projects are utilising several different
business models to match the necessary
technical and financial solutions with a
customer’s needs and available resources.
The innovations happening in this market
are helping drive the overall transition to a
more intelligent, dynamic and distributed
energy system the promises to improve
efficiency, empower customers, and reduce
environmental impact.
compared to a traditional equipment
upgrade that is built to last 20 years or more.
In addition, a T&D upgrade aligns with the
historical experience of a utility. Thus, they
may be more comfortable implementing a
poles and wires upgrade.
Much of the hesitation to embrace NWAs
stems from the challenges with engaging
customers and being able to effectively
guarantee a necessary amount of load
reduction. Investments in energy efficiency,
DR and solar PV have proven effective at
reducing load in select areas; however, they
do not guarantee the level of reliability and
control that utilities demand. Although
customers may typically respond to a DR
signal to reduce demand, they often can
override that signal and continue their
normal operations. Due to this inherent
unreliability, new technologies such as
distributed generation and energy storage
have emerged as more expensive but
advantageous components of an NWA
portfolio.
The increasing popularity of energy
storage in NWA programmes and as a
single-technology alternative to conven-
tional T&D investments stems from the
reliability and flexibility of storage systems
on the grid [5]. Utilities prefer direct control
over critical assets that are used to serve
peak demand and ensure the capacity
of grid infrastructure is not exceeded. As
a result, energy storage is typically seen
as a more reliable form of load reduction
compared to NWAs composed of customer-
side DER. Centralised, utility-scale energy
storage systems (ESSs) in particular fit more
with traditional utility investment models
and technical expertise. ESSs provide added
flexibility with the variety of services they
can provide when not needed to support
T&D infrastructure, including frequency
regulation, voltage support, spinning
reserves, outage mitigation and effectively
integrating renewable generation. Another
advantage of energy storage is that the
technology can be sized appropriately
to meet grid needs and can be sited in
numerous locations to deliver maximum
benefits—either in front of customers’
meters on the T&D grid or behind-the-
meter (BTM).
Transmission-level ESSs designed to
relieve congestion have been relatively
rare to date due to the large storage
capacity required to alleviate these issues.
Distribution-level ESSs have been the most
common type of T&D deferral projects to
date. These systems are frequently built at
substations or specific points of congestion
on the distribution grid to defer investments
and improve reliability by isolating outages.
Many distribution-level systems have been
relatively small pilot projects initially, but
utilise modular designs allowing for storage
capacity to be expanded over time.
BTM energy storage to defer T&D invest-
ments is more complex and dynamic than
transmission or distribution-level systems,
although it has the potential to be far more
disruptive to the industry. BTM energy
storage for T&D deferral includes systems
located in both C&I and residential buildings
that utilise advanced software and virtual
aggregation to provide targeted conges-
tion relief for grid operators. The primary
advantages of BTM storage providing T&D
deferral are potentially lower costs to utili-
ties and the ability to offer more visibility
and control at the edges of the grid. BTM
storage for these applications is currently a
nascent market, with several key challenges
including:
• Relatively high upfront costs for customer
acquisition in some situations
• Small amount of storage capacity per
system
• Concerns regarding the reliability of load
reduction with customer or third-party
owned systems.
Momentum evident, despite barriers
As with NWA programmes in general, there
[1] https://www.navigantresearch.com/research/non-wires-alternatives
[2] https://www.chinadialogue.net/article/show/single/en/8965-
Blowing-in-the-wind
[3] https://conedbqdmauction.com/
[4] https://www.utilitydive.com/news/non-wires-alternatives-whats-up-
next-in-utility-business-model-evolution/446933/
[5] https://www.navigantresearch.com/research/energy-storage-for-
transmission-and-distribution-deferral
References
Alex Eller is a research analyst in Navigant Research’s
energy technologies programme, leading syndi-
cated research for a suite of energy storage research
services, as well as supporting the advanced bat-
teries, microgrids, distributed renewables and DER
strategies research services. Prior to joining Navigant research he
served as an account manager at Energy Acuity, where he was
also the lead analyst for a research project on the investment
strategies of US power utilities.
Author
Figure 3.
Transmission
and distribution
breakdown
Sou
rce:
Na
vig
an
t Res
earc
h

89 www.pv-tech.org | December 2017 |
Storage & smart power
Look beyond the hype: to really disrupt the energy world, we need a Yin to blockchain’s Yang
Not a day goes by without another
article, conference, LinkedIn post
or tweet, praising the revolution-
ary nature and countless blessings of
introducing “blockchain” into the energy
sector. And yes, the technology behind the
Bitcoin cyber-currency has the potential
to fundamentally alter the way energy is
being procured and traded. But for all its
potential, blockchain is, and always will be,
limited to the purely commercial aspect of
any energy transaction. To be truly trans-
formative, the $-bits need to be matched
by software that links it the other side of
the proverbial energy coin: the physical
world of electrons.
What blockchain does do is bring the
market much closer to the electrons – and
thus the economic and physical dimen-
sions of the energy world closer together.
Remember that essentially the energy
world is split in two. First, it has a physical
dimension, in which electricity is being
generated and distributed through an
infrastructure we call the power grid. For
electricity to be transported safely, this grid
must be kept in balance at all times, which
essentially means that power produc-
tion needs to equal load demand every
instance.
On the other hand, there is a market – or
some other arrangement – by which those
that consume power pay for its production
and safe transport. Generally, payments
are made to a utility. This utility in turn
either produces power or procures it – and,
depending on where you are in the world,
either pays a grid operator or maintains
grid stability itself.
Today, the commercial transaction is
only very indirectly linked to what happens
in the physical world. That’s because
electricity is essentially being traded via
the great “ocean” that is the grid. Yes,
producers feed an agreed amount into
that ocean at any given time, typically in
hourly intervals, and consumers pay for the
amount of energy they use, but it’s impos-
sible to say where the kilowatt-hour (kWh)
of power that just kept your lights on really
came from. Most likely it just comes from
the closest power plant.
Blockchain changes that – to a degree.
The ABCs of blockchain
What is blockchain? Well, it’s basically a
continuously growing list of records, or
“blocks“, which are linked and secured
using cryptography. Each block typically
contains a link to a previous block, a
timestamp and transaction data. That
makes blockchains inherently resistant to
modification of the data.
A blockchain can serve as “an open,
distributed ledger that can record transac-
tions between two parties efficiently and in
a verifiable and permanent way” according
to the Wikipedia definition [1]. “For use as a
distributed ledger, a blockchain is typically
managed by a peer-to-peer network
collectively adhering to a protocol for
validating new blocks. Once recorded, the
data in any given block cannot be altered
retroactively without the alteration of all
subsequent blocks, which requires collu-
sion of the network majority.”
Blockchain became famous as the
technology behind the Bitcoin digital
currency. But its decentralised nature, fault
tolerance and security also make it suitable
for many other applications, ranging from
identity management to food traceability.
Smart grid | Blockchain technology is being touted as the next big step forward in the digitalisation of the energy system. But storage and storage management software are the critical pieces of the puzzle needed to maximise its potential, writes Carsten Reincke-Collon
Cre
dit
dea
vmi/
Wik
imed
ia C
om
mo
ns
Blockchain has
been greatly
talked up for its
use in the future
energy system

90 | December 2017 | www.pv-tech.org
Storage & smart power
“hold back” power in some way, you’re
required to sell it (or lose it) at the moment
it’s produced. Conversely, if you don’t
need to sell at the exact moment you
produce, you have a lot more control over
the market. This flexibility allows you to
exactly match a given customer’s demand
profile, for example, and likely extract a
higher price for such precise targeting and
delivery.
Of course, having this level of control
in turn requires software that manages
both the storing and provision of power
within milliseconds. But that is only the
beginning. The real value of storage and
distributed energy resources management
systems software (DERMS) is that they
enable applications like blockchain-based
trading in the first place. DERMS provides
blockchain applications with an interface
into the physical world, which they need
to translate the cyber revolution into
the real world. DERMS is the Yin to the
Yang of blockchain – or indeed any other
automated energy trading protocol.
Both technologies, or rather types
of software, have high value in and of
themselves. But only when you take them
together can they become truly disruptive
– and dramatically increase the efficiency
of how energy is being supplied. Put
these pieces of the puzzle together and it
becomes possible to trade energy peer-to-
peer and keep the grid stable at the same
time. That combination, indeed, has the
potential to set off a “chain” reaction that
will transform the utility industry.
[1] See https://en.wikipedia.org/wiki/
Blockchain
[2] see http://www-formal.stanford.edu/jmc/
harmful.html
References
Energy trading is a great fit too. Blockchain
allows for the creation of an automated
trading platform that links producers and
consumers in real time and lets them
engage – via “smart contracts” – in a
(quasi-) direct transaction.
The electrons thus sold still don’t go
straight to the buyer, but both parties
know that at the (exact) time in question,
one party is producing just the amount
of energy that the other party needs.
Provided both parties are also physically
close (which is a big if ), this transaction has
relatively little impact on the grid.
As almost all contributions on the
subject point out, blockchain has the
potential to make a utility redundant by
enabling consumers and (independent)
producers or prosumers to trade directly
without any intermediary.
While it’s hard to argue with that,
sceptics try to temper the hype around
blockchain by pointing to (i) the volume
of data storage required, (ii) the corre-
spondingly huge requirement for energy
that would be needed, as well as (iii) the
absence of any industrial standards. There’s
also the ubiquitous complaint that “the
current legal and regulatory framework
in no way matches the requirements of a
decentralised energy grid”.
And, indeed, at present the energy
aspect of blockchain is, unfortunately, a
reality. To be disruptive, blockchain will
have to become a lot leaner: right now a
single transaction “costs” the equivalent
of a full charge of an electric vehicle.
Obviously, “paying” in energy the equiva-
lent of a full Tesla charge is not sustainable.
But the good news is that there are many
promising avenues to significantly reduce
the energy cost of using blockchain in grid
transactions. It’s much easier to limit and
validate participants, for instance. Given
sufficient interest, it seems certain that
blockchain will scale – just as emails did –
even though there were many that warned
sending an email would prove to be much
costlier than sending a fax [2].
Blockchain’s stumbling block
There is a much bigger obstacle out
there, however, that gets far less atten-
tion. Someone – or something – needs
to make sure that the energy being
transacted actually moves from A to B –
and that it doesn’t tear down the “roads”
it travels on, i.e., the grid, in the process.
So, yes, blockchain might make the utility
superfluous – but only insofar as the
utility acts as a commercial intermediary
between consumers and producers. While
blockchain brings the physical and the
economic dimensions of electricity much
closer together, it doesn’t – and will never
– “fuse” them in any shape or form, even if
some would have us believe that.
To truly link kilowatt-hours to dollars
(or euros or renminbi) in the same virtual
dimension, another piece of equally ingen-
ious code is required: energy management
software in general – and energy storage
management software in particular.
Why? Think about it: in a way, the ability
to store something has always been a
pre-requisite for trading it. If you have to
pass the “hot potato” immediately, you’re
not in a very good position to make
demands about price. In fact, that’s the
reason the shortest interval in energy
markets today tends to be 15 minutes –
because that is exactly the time it takes a
(warm) gas turbine to power up to cover
added demand. In deregulated energy
markets, anything less than 15 minutes
is usually organised in balancing markets
or through “re-dispatch”, where those
resources that – either via power up or
down – provide short-term grid stability
get compensated by some type of grid
operator or regulator. In monopolies, the
incumbent utility balances supply and
demand directly, but of course that’s not
really a market at all.
Gas turbines used to be the fastest units
in the energy system. But just as email
has replaced fax machines, we now have
much faster units for moving energy. The
power electronics embedded in solar PV
and wind turbines allow for partial – that
is, “downward” or limiting, but nonetheless
real-time – control of these decentralised
clean energy generation assets. Add
battery energy storage to that mix and it
becomes possible to balance short- and
medium-term fluctuations within millisec-
onds, and do so fully automatically.
This ability to effectively stop and
control electrons or, in more common
terminology, store them, enables us to
trade energy in real time. Unless you can
Dr. Carsten Reincke-Collon
is senior vice president
engineering of Younicos
and responsible for an
interdisciplinary team of
experts working on system designs
and software controls for hybrid energy
systems and large-scale battery stor-
age solutions. Before establishing
battery storage as key asset class for
a successful energy transition with
Younicos, Carsten worked as a consult-
ant on quality assurance for embedded
software in the German automotive
industry and received his Dipl.-Ing.
(2005) and Dr.-Ing. (2011) degree in
Electrical Engineering from TU Dresden,
Germany.
Author
“The real value of storage and distributed energy resources management systems software is that they enable applications like blockchain-based trading”

91 www.pv-tech.org | December 2017 |
Storage & smart power
A quick view into the future: it is the year 2030 and Paul, a homeowner
with his own photovoltaic system and battery storage, checks his
electricity bill. His neighbour Sam got 12kWh of solar power from Paul’s
house roof today. Amanda, the elderly lady a few blocks away, has consumed
5kWh of solar power from Paul. Both charges Paul sees on his online portal. The
transactions are registered with a blockchain and the compensation is immedi-
ately credited to Paul’s bank account.
Those energy transactions happen thousands of times every second, and
are continuously and consistently registered on a myriad of single comput-
ers around the world with a blockchain. A blockchain is a database that is
organised decentrally. A main server that stores all operations is no longer
needed. All distributed computers store the information that Sam got 12kWh of
solar power from Paul. After a certain time, all accumulated information is then
combined into a block and provided with a kind of checksum. This checksum
is then included in the data of the next block. This makes the blockchain
very secure against subsequent manipulation. If an individual transaction is
subsequently modified on a computer, this is immediately noticeable because a
whole chain of checksums is no longer correct.
For the energy supply of the future, the blockchain is the key technology.
It digitally links up millions of decentralised generators of clean energy and
documents their output, even at the smallest level between Paul’s PV system
and his neighbour Sam.
Finally, Paul produces and consumes his electricity himself and sells the
surplus energy that he does not need himself. Miles of transmission networks
that transport electricity over long distances are needed in a much lower scale.
Electricity is more and more being produced in decentralised and climate-
friendly ways. Instead of individual large power plants, energy is generated
where it is being consumed: for example on private houses with photovoltaic
systems. Of course, there are also wind turbines, on land and at sea, hydroelec-
tric power plants and biogas plants. All contribute to the sustainable electricity
mix that supplies society, industry and consumers.
This decentralised generation has a positive effect on our energy system in
many ways. Electricity is produced and consumed directly or stored in batteries
for later use. As a result, the necessary basic supply in the power grid is drasti-
cally reduced, which in turn means only a few central power plants are needed.
Nevertheless, the switch to renewable energy also has its own challenges.
A nuclear or coal-fired power plant can theoretically deliver constant power
around the clock. Wind and solar power, on the other hand, are influenced by
external circumstances. If there is a lot of sun, the share of solar power is corre-
spondingly high. At night, this will disappear completely. Wind energy depends
on the weather. This wind is sometimes constant, sometimes it fades and in a
storm, a lot of electricity is produced.
Such fluctuations are referred to in the jargon as volatility. The energy transi-
tion, and thus the change to a decentralised supply, is still a few years away.
But the more renewable energy is integrated into the electricity mix today,
the greater the need for solutions, so-called grid services, for this new form of
electricity production.
A pilot project for offering grid services in whole new way has just started in
Germany. In a cooperation between IBM, German transmission system operator,
TenneT, and battery supplier, sonnen, decentralised home storage systems are
being integrated into the power grid with a blockchain for the first time.
What does a grid service via blockchain look like? Imagine a windy day over
the North Sea that makes the wind turbines in the area rotate heavily and
produce large amounts of electricity. Now there are two problems: the power
consumption in northern Germany is not high enough to take all that electric-
ity. Secondly, the power lines to southern Germany or other parts of Europe
are not strong enough to transport that huge excess of energy. To bridge that
bottleneck the grid operators have to act with the so-called ‘redispatch’. Usually
they turn off the wind turbines in the north and activate gas or coal fired plants
in the south for keeping the balance.
The pilot project with TenneT and sonnen has found a new approach. If too
much wind energy is produced in the north it is stored in the virtual connected
battery storage systems in that region. At the same time, decentralised storage
systems in the south discharge energy into the grid for compensating the lack
of energy from the north. So the bottleneck is bypassed via a virtual power line
that is by the way the first green solution for the redispatch.
The amount of energy each individual decentralised battery has charged
or discharged is registered and stored by a blockchain. The process starts
automatically within seconds, no phone calls between grid operator and power
plants have to be made. The collected information is encrypted and stored on
thousands of computers. Every participating party, such as storage providers or
grid operators, has full access to all data, making it very transparent.
sonnen is providing its virtual battery pool that can deliver exact forecasts
how much energy will be available in a certain region and within a certain time.
For the grid and society, this form of redispatch has significant advantages.
On the one hand, the decentralised storage units are already available to
homeowners and serve as a battery for their own energy supply. In addition, all
people benefit. Less wind energy has to be wasted and the costs for grid opera-
tions like the redispatch can be reduced significantly.
In addition to their own, clean and free electricity production, the individual
owners of the storage are looking forward to additional revenue they can
obtain by participating in those scenarios.
Blockchain in action: stabilising the grid in Germany and the Netherlands
Cre
dit
Ten
neT
German TSO, TenneT, is one of the partners in the blockchain trial
Jean-Baptiste Cornefert is managing director of sonnen eSer-
vices. Before joining sonnen, he managed the demand-side
management activities of E.ON as head of the virtual power
plant & renewable marketing business unit. In this role, he
led an international team responsible for the aggregation
and commercialisation of flexibility from decentralised demand-side and
renewable assets.
Author
Case study | Blockchain technology is being put to the test in northern Europe, writes John-Baptiste Cornefert

92 | December 2017 | www.pv-tech.org
InterviewStorage & smart power
Storage finance | Clean energy entrepreneur Jigar Shah, one of the pioneers of solar finance, is turning his attentions to other low-carbon energy technologies such as storage. He tells Andy Colthorpe about his latest equity round and the freedom he enjoys to back projects he thinks will have greatest impact
Life at the frontier of g
ogy that has proven itself on a technology basis but has not proven
itself on an institutional infrastructure basis.”
Gradually we have seen banks and other financiers starting to
become comfortable with solar PV, especially in North America. Yet
according to Shah that reluctance still exists when it comes to more
advanced technologies and Generate Capital sees itself as a conduit
for cashflow into less traditional areas of clean infrastructure invest-
ment.
“Generate is really about serving the market, before sort of the
commodity capital sources start streaming in,” he explains. “Once
you feel you can get 5% money from Deutsche Bank, Generate is no
longer as competitive. Right now, there are a lot of applications of
storage that continue to be misunderstood by the broader finance
community.”
Examples where the funder stepped in where banks feared to
tread have included solar-plus-storage projects, behind-the-meter
applications, or even energy storage projects in Ontario planned
to mitigate the effects of the Canadian region’s Global Adjustment
Charge, payable by electricity ratepayers to finance conservation
and demand management programmes.
Institutionalised?
As for the advent of institutional investment in energy storage,
there have only been one or two blips on the radar until now. Swiss
group SUSI Partners created SUSI Energy Storage Fund, reaching
its first closing in April this year at just over US$70 million, with
backers including pension funds and insurance companies. While it’s
obvious that just as with banks, institutional investors will start to get
comfortable with energy storage, Generate’s opportunity to work
with the Alaska Permanent Fund’s capital is one of only a handful of
other examples.
There has been little pressure on pension funds and others to see
energy storage, or even solar-plus-storage, as a viable divestment
option from fossil fuels. While it might seem also that institutional
investors would err on the side of conservatism in deploying their
capital, this isn’t necessarily the reason why many haven’t bought
into the storage revolution yet.
At Energy-Storage.News, we have seen the industry rise and
rise, driven on by specific geographies and higher-value
applications. Analysts tracking energy storage, such as
Mercom Capital, which issues quarterly reports on mergers and
acquisitions and venture capital funding, have found significant
sums of capital being put forward for new technologies and latterly
for project financing, with increasing frequency.
As solar PV went through the learning curve of its boom years,
capital first came mostly from private investors and risk-hungry
venture capitalists. Only as the market matured did longer-term,
institutional investors start to get involved. While the likes of
superstar clean-tech VC investor Nancy Pfund have told us that the
energy storage space is getting ripe for big money, with institutional
investors eyeing opportunities closely, hands have not yet gone into
pockets on a grand scale.
In late October, Generate Capital, led by an executive team that
includes SunEdison founder Jigar Shah, raised about US$200 million
in equity investment, with input from the Alaska Permanent Fund
Corp (APFC).
Both the sum of money and the fact that a large chunk of it was
sourced from an institutional investment group – APFC is a sover-
eign fund for the state of Alaska – are notable. Generate prides itself
on finding opportunities across the whole spectrum of clean energy.
While best known for his pioneering work in solar finance, Shah
and the Generate board appear just as excited these days about the
potential for other technologies too, from batteries to anaerobic
digestion, fuel cells for forklifts, to low carbon solutions for purifying
drinking water.
Speaking to Shah over the phone, it’s obvious that he relishes
what he calls the “complete freedom” to invest where Generate
thinks it can make the most impact, be it “water, agriculture, waste,
battery storage” or other options.
It’s a question of being trusted to take calculated risks, Shah says,
of negotiating a frontier that is littered not just with potentially ‘good’
deals and ‘bad’ deals but more commonly also includes “misunder-
stood” technologies or business ideas. He explains that, for example,
through the recent history of the energy storage industry, the
thought of funding the technology had “traditional finance provid-
ers very scared, initially”.
Generate, on the other hand, was experienced with renewables
and clean tech and convinced of their potential. This has led to the
company “providing a lot of capital” to a series of solar-plus-storage
and behind-the-meter energy storage projects already.
For Generate Capital, there will always be a “frontier of deals that
are misunderstood”, Shah says.
“That problem will never get solved. There will always be
someone that has to go first, or second, or third, in helping a technol-
“There will always be someone that has to go first, or second, or third, in helping a technology that has proven itself on a technology basis but has not proven itself on an institutional infra-structure basis”

93 www.pv-tech.org | December 2017 |
Interview Storage & smart power
reen investment“[Institutional investors] invest in hedge funds, private equity
funds. They invest in a lot of things that you might privately think
are risky. The hook at this point is that for many of these companies,
or investors, they’re really focused on oil and gas investing. And you
know, oil and gas investing has been quite volatile as of late,” Shah
says.
‘Energy as infrastructure’
The point is that oil and gas, while risky, can make 25% returns;
wind and solar typically create closer to 6% to 10% returns, on the
proverbial good day. Investing in renewables, Shah says, is closer
to infrastructure investing – “if they buy an airport, they might get
a 6% to 10% return” – than it is to the traditional fossil fuel market
gamble. The money institutional investors would put into wind, solar
or latterly energy storage projects therefore would probably not
therefore represent a divestment and would come from separate
funds to those oil and gas holdings, Shah argues. As he showed
through years of reinventing solar finance, however, it’s still all about
scaling up.
“The big thing for these institutions is that they can’t dive in to
deals unless it’s a large cheque. So if someone comes to them with
a US$25 million opportunity in battery storage, they just can’t do a
US$25m deal. They really need to put their money out the door in
larger quantities. So if they’re going to do deals directly, they’ll do
solar and wind where they might be able to do a US$100 million
deal, so they’re not going to smaller deals directly. So I don’t think it’s
about risk as much as it is about comfort, and size.”
Shah remains passionate about solar. He says Generate is one of
very few financiers investing in community solar, a state of affairs
that he says he finds “weird”.
“Every community solar deal today has been forced to find insti-
tutional off-takers. Why don’t you get Walmart, or this local school
district to actually buy the power? Well, because those guys are not
the ones the community solar statute was written for. Something as
simple as that was basically blacklisted by the entire finance industry,
and it wasn’t until we started coming in and funding it that people
started opening their eyes.”
While there is some risk associated with low-income customers
and residential renters who may not live in one place for the long
haul, this calculable risk can be built into the business proposition.
Of course, in energy storage, the long-term value of a deal can be
harder to figure out.
“It’s about figuring out what we can charge for,” Shah explains. “It’s
saying, ‘What benefits will the industrial customer, or commercial
customer pay for?’ Will they pay for it as a fixed payment because
they believe it’s real and will occur every month? Or are they paying
for it on a performance basis, where they say, prove to me at the end
of the month that you’ll save me demand charges and then I’ll pay
you 80% of what you show me.
“Those are two different risk profiles. In one case they’ve agreed
that it works and they’re just paying us a fixed payment every
month. In another application, like if the software fails to operate
correctly, then we don’t get paid.”
Separate to that risk, Shah says, is regulatory risk. Many markets
do not yet value the services batteries
can provide, meaning that even where the
demand exists, the regulatory space is yet to catch up.
Modelling the risk
Evaluating and finding ways around these risks is tricky. UK transmis-
sion network operator National Grid recently said developers should
not bank on revenues from providing frequency regulation services
and should find ways to ‘stack’ multiple revenues for providing differ-
ent services, behind and in front of the meter.
“If someone calls us up now and says they’ve included X number
of dollars for grid services, we’re going to say ‘wait a second, we don’t
think you’re going to get them until 2019 or 2020, and when you do
get them it’s going to be this amount, not that amount’. We’re not
miracle workers. We can’t just assume that these revenues are going
to magically appear.
“You have to be able to model it. You certainly can get frequency
regulation revenues for two years and those are pretty lucrative and
could give you almost half your money back, which is great, or more.
But then the question is what do you do next? What markets do you
participate in next? And you just have to keep revenue stacking and
modelling it.
“The other alternative with battery storage is that you could also
potentially afford to just pick it up and move it! You could say for
two years I’ll get this revenue and then move it to another place.
So I certainly believe there is a rational way to finance projects with
short-term revenues – but then the returns have to be similar to
independent power producer returns, which are more in the 20%
range.”
2018: The year utilities break through?
Asked what next year might hold, Shah’s answer is perhaps surpris-
ingly downbeat, although laced with his usual fighting spirit. Utilities
are quickly becoming wise to the value of energy storage, Shah
says. It took many North American utilities several years of the solar
market boom to realise they could not ignore it and hope it would
go away. Nowadays utilities are presenting a multitude of approach-
es to encouraging, accommodating or in some cases even pushing
aside PV. Some utilities are now keen to own solar assets. Jigar Shah
is expecting to see a similar dynamic in energy storage next year.
“Energy storage has broken through such that utilities [in the US]
admit that their value is very high, at least to a 3.5% penetration. The
fight now is really about who owns the storage – I am inclined to
believe that the utility companies will win that battle,” Shah says.
“They will make sure that private owners of batteries don’t get
paid a fair return – similar to what has happened to the demand
response markets.”
While Shah thinks utilities will not be able to achieve a takeover of
the market in 2018, they will “all decide that is the strategy”, he says.
Yet he is not defeatist. I ask if that means it will be harder for the likes
of Generate to keep making plays for the projects and technologies
it wants to.
“It means that we have to innovate on our side to be able to
continue to put our money to work,” he says.

regulars
94 | December 2017 | www.pv-tech.org
| advertisers & web indexAdvertiser Web address PAGE No.
Asia Solar www.asiasolar.net 39
EGing Photovoltaic Technology Co., Ltd. www.egingpv.com 40, 41, 42
Energy Storage Summit storage.solarenergyevents.com 87
Gantner Instruments Environment Solutions GmbH www.gantner-environment.com 24, 25
Green Energy Expo Korea - Daegu www.energyexpo.co.uk 15
HT-SAAE en.ht-saae.com 31
Huawei solar.huawei.com 5
Intersolar www.intersolarglobal.com 9
Large Scale Solar Europe: The transition to subsidy free subsidyfree.solarenergyevents.com 21
Kipp & Zonen www.kippzonen.com/DustIQ 73
LONGi Solar en.longi-solar.com Inside Front Cover
Managing European Solar Assets assets.solarenergyevents.com 11
PV Expo www.pvexpo.jp/en/ 62, 63
SNEC www.snec.org.cn Inside Back Cover
Solar & Storage Finance Asia fi nanceasia.solarenergyevents.com 33
Solar Finance and Investment Europe fi nance.solarenergyevents.com 49
Solar Power International www.solarpowerinternational.com 85
Solargis s.r.o. solargis.com 77
S’Tile www.silicontile.fr 56, 57
TÜV Rheinland www.tuv.com/solar 7
World Future Energy Summit/Solar Expo Abu Dhabi solarexpo.ae 69
Wuxi Suntech Power Co Ltd www.suntech-power.com Outside Back Cover
SUBSCRIBE TODAY! www.pv-tech.org
| next issue• Floating PV special report
• Improving PV yield assessments
• Japan market report