Embed Size (px)
Citation preview

Verstehen. Handeln.
Volatility Risk
Premium: Stylized Facts and
Portfolio Implications
CBOE Risk Management
Conference Europe 2015
Geneva, Switzerland
Dr. Bernhard Brunner
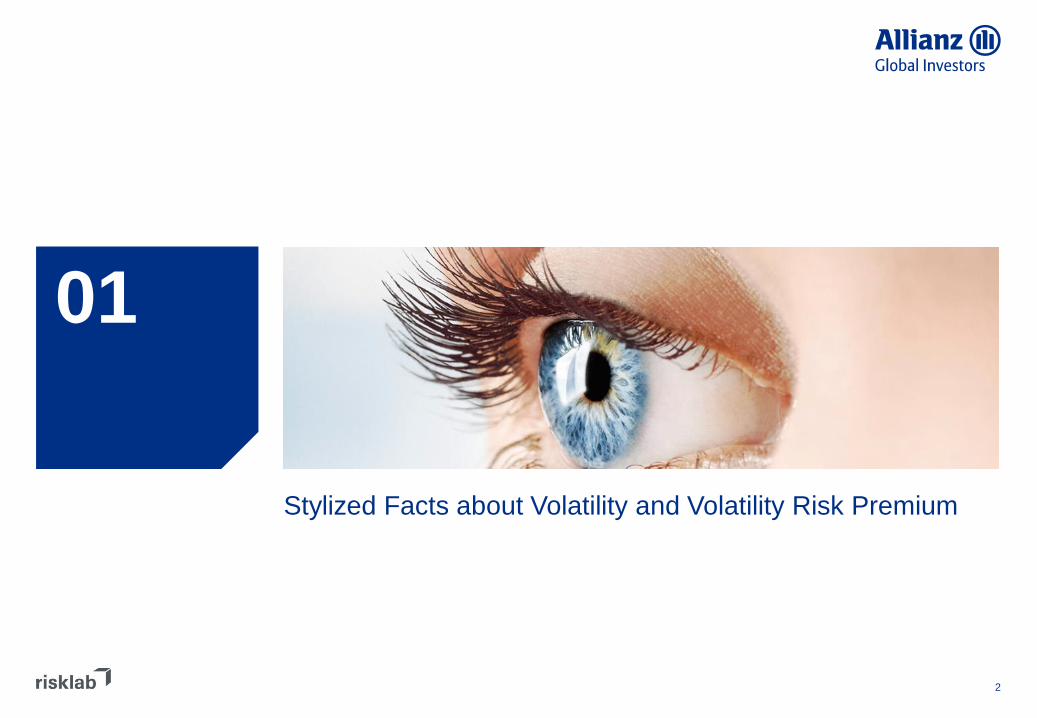
01
Stylized Facts about Volatility and Volatility Risk Premium
2

Volatility Risk Premium compared to Equity Risk Premium
Volatility risk premium follows the same logic as equity risk premium but is much more attractive over the last 15 years
Equities
Math Interpretation
Investment Realized return over a time
period (e.g. 1 year)
Riskfree (or low risk)
opportunity cost
Riskfree rate over the same
period (e.g. money market)
Risk premium Equity risk premium
(return over money market)
(Equity-)Volatility
Math Interpretation
Realized variance over a
time period (e.g. 1 year)
Implied variance over the
same period
Variance risk premium
-40%
-20%
0%
20%
40%
60%
20
00
20
02
20
04
20
06
20
08
20
10
20
12
20
14
-40%
-20%
0%
20%
40%
60%
20
00
20
02
20
04
20
06
20
08
20
10
20
12
20
14
18%
82% 41%
59% ø 1.6% ø 3.9%
Source: Bloomberg and risklab. Based on EuroStoxx50 and VSTOXX data over the period 01.01.2000-31.08.2015. For further information please see the risklab disclaimer at the end of the presentation.
Equity risk premium Variance risk premium
3

4
The Distribution of Volatility Risk Premium is Skewed!
Distribution of the variance premium:
Manage downside risk when harvesting volatility risk premium
Source: Bloomberg and risklab. Based on EuroStoxx50 and VSTOXX data over the period 01.01.2000-31.08.2015. For further information please see the risklab disclaimer at the end of the presentation.
0%
2%
4%
6%
8%
10%
12%
14%
16%
18%
20%
-19
%
-15
%
-11
%
-7%
-3%
1%
5%
9%
13
%
17
%
21
%
25
%
29
%
33
%
37
%
18% occurrence of losses 82% occurrence of gains

5
Components of Volatility Risk Premium
Additional risk
premium,
depending on
the steepness
of the volatility
smile/skew
Volatility risk
premium
=
Realized
volatility
–
Implied
volatility
Risk premium,
depending on
implied volatility
of at-the-money
options Realized volatility
(e.g. over 30 days)
Implied atm Volatility
(e.g. over 30 days)
Implied Volatility
(e.g. over 30 days)
Volatility risk premium consists of two components:
1 atm = at the money
Received via sale of
Variance Swaps
(held to expiry)
Received via
sale of (delta
hedged) atm
Options
(„Gamma“)
approx. 2/3 of the
historical
realized
volatility risk
premium
approx. 1/3 of the
historical
realized
volatility risk
premium
*
*
Source: Bloomberg and risklab. Based on EuroStoxx50 and VSTOXX data over the period 01.01.2000-31.08.2015. For further information please see the risklab disclaimer at the end of the presentation.
1

Conclusion naive investment approach through rolling of future
contracts
Significant impact of implied volatility
Effect can be reduced by overlapping investments:
What is different between Equity and Volatility Risk Premium?
Equities Volatility
Risk Premium Equity Risk Premium Volatility Risk Premium
Derivative to
capture premium e.g. equity future variance swap
Influencing factors equity return, interest rate, (possibly dividends) implied volatility, realized volatility or (equity return)²
Sensitivity
analysis
0,00%
0,02%
0,04%
0,06%
0,08%
0,0%
0,5%
1,0%
1,5%
1 5 9 13 17 21 25 29 0
0,2
0,4
0,6
0,8
1 5 9 13 17 21 25 29
equity return +1%
rates +1%
Impact on risk premium over 30 days
(equity return +1%)²
implied
volatility +1%
Impact on risk premium over 30 days very low impact!
0
0,2
0,4
0,6
0,8
1 5 9 13 17 21 25 29
Impact on risk premium assuming daily (overlapping) investments
(equity return +1%)²
implied volatility +1%
6
Source: risklab. For further information please see the risklab disclaimer at the end of the presentation.
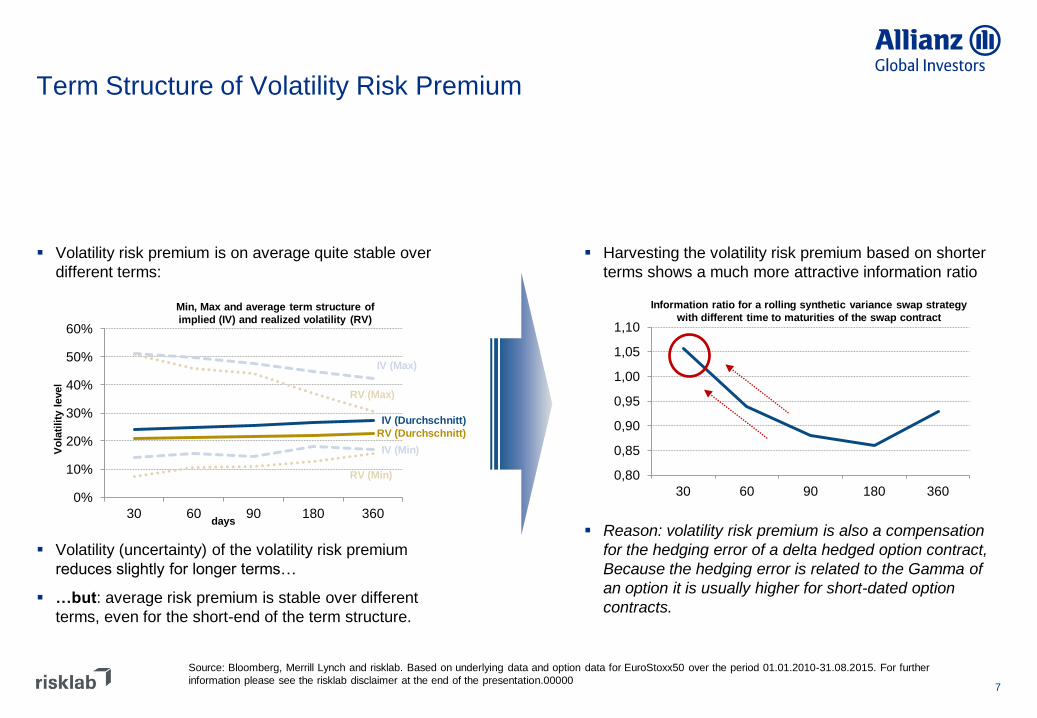
Term Structure of Volatility Risk Premium
Volatility risk premium is on average quite stable over
different terms:
Volatility (uncertainty) of the volatility risk premium
reduces slightly for longer terms…
…but: average risk premium is stable over different
terms, even for the short-end of the term structure.
Harvesting the volatility risk premium based on shorter
terms shows a much more attractive information ratio
Reason: volatility risk premium is also a compensation
for the hedging error of a delta hedged option contract,
Because the hedging error is related to the Gamma of
an option it is usually higher for short-dated option
contracts.
0,80
0,85
0,90
0,95
1,00
1,05
1,10
30 60 90 180 360
Information ratio for a rolling synthetic variance swap strategy
with different time to maturities of the swap contract
7
0%
10%
20%
30%
40%
50%
60%
30 60 90 180 360
IV (Durchschnitt)
RV (Durchschnitt)
RV (Min)
RV (Max)
IV (Max)
IV (Min)
Min, Max and average term structure of
implied (IV) and realized volatility (RV)
days
Vo
lati
lity
level
Source: Bloomberg, Merrill Lynch and risklab. Based on underlying data and option data for EuroStoxx50 over the period 01.01.2010-31.08.2015. For further
information please see the risklab disclaimer at the end of the presentation.00000

-15%
-10%
-5%
0%
5%
10%
20
04
20
05
20
06
20
07
20
08
20
09
20
10
20
11
20
12
20
13
20
14
20
15
-40%
-20%
0%
20%
40%
60%
20
04
20
05
20
06
20
07
20
08
20
09
20
10
20
11
20
12
20
13
20
14
20
15
Volatility Risk Premium for different Asset Classes Equities and FX
0,80
0,85
0,90
0,95
1,00
1,05
1,10
30 60 90 180 360
1,50
2,00
2,50
3,00
3,50
4,00
30 60 90 180 360
Volatility risk premium
European equities
Eurostoxx50
Information ratio for a rolling synthetic variance swap strategy
with different time to maturities of the swap contract Volatility risk premium over 30 days
Volatility risk premium
FX
USD/EUR
76%
24% ø 3.4% IR 1.06
73%
27% ø 1.1% IR 3.67
Source: Bloomberg, Merrill Lynch and risklab. Based on underlying data and option data for EuroStoxx50 and USD/EUR over the period 01.01.2004-31.07.2015. For further
information please see the risklab disclaimer at the end of the presentation.

-30%
-20%
-10%
0%
10%
20%
30%
40%
20
04
20
05
20
06
20
07
20
08
20
09
20
10
20
11
20
12
20
13
20
14
20
15
-40%
-30%
-20%
-10%
0%
10%
20%
30%
40%
20
04
20
05
20
06
20
07
20
08
20
09
20
10
20
11
20
12
20
13
20
14
20
15
1,60
1,80
2,00
2,20
2,40
2,60
30 60 90 180 360
0,50
0,55
0,60
0,65
0,70
0,75
0,80
0,85
30 60 90 180 360
Volatility Risk Premium for different Asset Classes Commodities: Gold and Oil
Volatility risk premium
Commodities
Gold
Information ratio for a rolling synthetic variance swap strategy
with different time to maturities of the swap contract Volatility risk premium over 30 days
Volatility risk premium
Commodities
Oil
70%
30% ø 1.9% IR 0.80
73%
27% ø 3.7% IR 2.49
Source: Bloomberg, Merrill Lynch and risklab. Based on underlying data and option data for Gold and Oil over the period 01.01.2004-31.07.2015. For further information please see
the risklab disclaimer at the end of the presentation.

-30%
-20%
-10%
0%
10%
20%
20
10
20
11
20
12
20
13
20
14
20
15
-8% -6% -4% -2% 0% 2% 4% 6% 8%
10%
20
04
20
05
20
06
20
07
20
08
20
09
20
10
20
11
20
12
20
13
20
14
20
15
0,50
0,70
0,90
1,10
1,30
1,50
1,70
1,90
30 60 90 180 360
1,00
1,10
1,20
1,30
1,40
1,50
1,60
1,70
1,80
30 60 90 180 360
Volatility Risk Premium for different Asset Classes Rates and Credit
Volatility risk premium
Rates
US Treasuries 10y
Information ratio for a rolling synthetic variance swap strategy
with different time to maturities of the swap contract Volatility risk premium over 30 days
Volatility risk premium
Credit
US HY Corporate
65%
35% ø 0.4% IR 1.24
85%
15% ø 3.9% IR 1.69
Source: Bloomberg, Merrill Lynch and risklab. Based on underlying data and option data for US Treasuries and US HY Corporate over the period 01.01.2010-31.07.2015. For further
information please see the risklab disclaimer at the end of the presentation.

Further Characteristics of Volatility …
1. In contrast to other asset classes, volatility does not pay interest or dividends
2. Volatility always returns to its long-term mean (mean reversion effect)
3. Volatility tends to jump (usually when the stock market slumps), followed by lengthier downward trends
4. Volatility forms volatility clusters (regimes)
11
10
20
30
40
50
60
70
80
90
2000 2001 2002 2003 2004 2005 2006 2007 2008 2009 2010 2011 2012 2013 2014
VS
TO
XX
in
%
Long-term
average (2)
(3) (3)
(4)
Source: Bloomberg and risklab. EuroStoxx50 and VSTOXX data over the period 01.01.2000-31.08.2015. For further information please see the risklab disclaimer at the
end of the presentation.

… and their Effect on Volatility Risk Premium …
Observation:
Stable and attractive risk premium across all
volatility regimes
-30%
-10%
10%
30%
-30% -20% -10% 0% 10% 20% 30%
0%
20%
40%
60%
-30% -20% -10% 0% 10% 20% 30%
Volatility Cluster (regimes):
Observation:
Strong increase in volatilities negatively impacts the
volatility risk premium
In contrast, a decrease in volatility makes risk
premium even richer
Sensitivity to volatility (regime-switch):
Volatility Risk Premium
Volatility Risk Premium
Imp
lied
Vo
lati
lity
C
han
ge i
n I
mp
lied
Vo
lati
lity
Source: Bloomberg and risklab. EuroStoxx50 and VSTOXX data over the period 01.01.2000-31.08.2015. For further information please see the risklab disclaimer at the end of the
presentation.
Volatility risk premium is richer in a high volatility
environment but its volatility (uncertainty) is also
higher, et vice versa

… are especially attractive when considered together
Ho
he
Vo
latilit
ät
Nie
dri
ge
Vo
latilit
ät
4. 3.
4.
Langfristiges
Mittel
Erwartete Prämie ist niedrig aber
Unsicherheit der Prämie ist
ebenfalls niedrig
Verringerung der Prämie durch
Anstieg der Volatilität
1.Erwartete Prämie ist hoch aber
Unsicherheit der Prämie ist
ebenfalls hoch
Erhöhung der Prämie durch
Abnahme der Volatilität
1.
2.
3.
4.
2.
Mean-reversion effect causes the impact of increasing and decreasing volatilities to cancle out
and enables a stable harvesting of an attractive risk premium over a full volatility cycle
hig
h v
ola
tili
ty
low
vo
lati
lity
long-term
average
1.
3.
4.
2.
risk premium is expected to
be significant but risky
risk premium increases
further through decrease in
market volatilities
risk premium decreases
through increase in market
volatilities
risk premium is expected to
be low but stable (less risky)

Stylized Facts of Volatility and its Risk Premium have to be considered
• Sell volatility (short volatility) Volatility risk premium is negative
• Only variance swaps are able to fully exploit the volatility risk premium Significant part of the risk premium is
related to the steepness of volatility skew
• Focus on shorter end of risk premium term structure Risk premium is more attractive over
shorter time periods
• Consider overlapping investments and reduce timing effects Significant impact of implied volatility when
entering into a new trade
• Adjust exposure according to the current volatility regime Risk/return-ratio depends on the current
volatility regime (cluster)
• Further adjustment of exposure under consideration of the full volatility cycle Mean-reversion effect introduces volatility
cycles
• Include risk management components to reduce significant downside risk when volatility jumps
Volatility often jumps which negatively impacts risk premium
e.g
. riskla
b V
aria
nce P
rem
ium
Tra
din
g
(VP
T) In
dex (B
B: R
LA
BV
PT
<In
dex>
)
Alte
rnativ
e B
eta
A
ltern
ativ
e S
mart B
eta

02
Harvesting Volatility Risk Premium in a Portfolio Context
15

Correlation Analysis Equities
Correlation < 0.5
0.5 ≤ Correlation ≤ 0.75
Correlation > 0.75
Non-Linear Correlation to Equities:
Diversification benefits in normal market periods but correlation increases in market downturns
Source: Bloomberg and risklab.
EuroStoxx50 Index data and VPT Index
data over the period 01.01.2000-
31.08.2015. For further information
please see the risklab disclaimer at the
end of the presentation.

Correlation Analysis Fixed Income
Correlation < 0.5
0.5 ≤ Correlation ≤ 0.75
Correlation > 0.75
Negligible Correlation to Fixed Income:
Diversification benefits in all markets and particularly in rising interest rate markets
Source: Bloomberg and risklab. JPM
Government Bond Index data and VPT
Index data over the period 01.01.2000-
31.08.2015. For further information
please see the risklab disclaimer at the
end of the presentation.

Correlation Analysis Commodities
Correlation < 0.5
0.5 ≤ Correlation ≤ 0.75
Correlation > 0.75
Low Correlation to Commodities:
Diversification benefits in nearly all markets but beware of commodity crisis
Correlation < 0.5
0.5 ≤ Correlation ≤ 0.75
Correlation > 0.75 Source: Bloomberg and risklab.
Bloomberg Commodity Index data and
VPT Index data over the period
01.01.2000-31.08.2015. For further
information please see the risklab
disclaimer at the end of the
presentation.

2,0%
2,5%
3,0%
3,5%
4,0%
4,5%
5,0%
5,5%
4% 9% 14% 19% 24%
Retu
rn
Risk (CVaR, 1y, 95%)
SAA SAA Including Volatility
31%
38% 5%
26%
Fixed Income
Equities
Commodities
Volatility
Volatility as an Asset Class improves Risk/Return-
Characteristics of a Portfolio
50%
43%
7%
Fixed Income
Equities
Commodities
45% 28%
4% 23%
Diversification benefits in a portfolio context:
Replacing equities with volatility reduces risk, replacing fixed income with volatility adds return
Source: Bloomberg and risklab. Robust optimization using based on risklab analytics framework. For further information please see the risklab disclaimer at the end of the presentation.

Disclaimer
Investing involves risk. The value of an investment and the income from it may fall as well as rise and investors may not get back the full amount invested.
The volatility of fund unit prices may be increased or even strongly increased. Past performance is not a reliable indicator of future results. If the currency in which the past
performance is displayed differs from the currency of the country in which the investor resides, then the investor should be aware that due to the exchange rate fluctuations the
performance shown may be higher or lower if converted into the investor’s local currency.
Back-testings and hypothetical or simulated performance data has many inherent limitations only some of which are described as follows:
It is designed with the benefit of hindsight, based on historical data, and does not reflect the impact that certain economic and market factors might have had on the decision-making
process, if a client’s portfolio had actually been managed. No back-testings, hypothetical or simulated performance can completely account for the impact of financial risk in actual
performance.
It does not reflect actual transactions and cannot accurately account for the ability to withstand losses.
The information is based, in part, on hypothetical assumptions made for modeling purposes that may not be realized in the actual management of portfolios.
No representation or warranty is made as to the reasonableness of the assumptions made or that all assumptions used in achieving the returns have been stated or fully considered.
Assumption changes may have a material impact on the model returns presented. The back-testing of performance differs from actual portfolio performance because the investment
strategy may be adjusted at any time, for any reason.
Investors should not assume that they will experience a performance similar to the back-testings, hypothetical or simulated performance shown. Material differences between back-
testings, hypothetical or simulated performance results and actual results subsequently achieved by any investment strategy are possible.
This is for information only and not to be construed as a solicitation or an invitation to make an offer, to conclude a contract, or to buy or sell any securities. The products or securities
described herein may not be available for sale in all jurisdictions or to certain categories of investors. This is for distribution only as permitted by applicable law and in particular not
available to residents and/or nationals of the USA. The investment opportunities described herein are not guaranteed. The views and opinions expressed herein, which are subject to
change without notice, are those of the issuer and/or its affiliated companies at the time of publication. The data used is derived from various sources, and assumed to be correct and
reliable, but it has not been independently verified; its accuracy or completeness is not guaranteed and no liability is assumed for any direct or consequential losses arising from its
use, unless caused by gross negligence or willful misconduct. The conditions of any underlying offer or contract that may have been, or will be, made or concluded, shall prevail.
Contact the issuer electronically or via mail at the address indicated below for a free copy of the sales prospectus, the incorporation documents, the latest annual and semi-annual
financial reports and the key investor information document in English. Please read these documents - which are solely binding - carefully before investing.
This is a marketing communication. Issued by risklab GmbH, www.risklab.com, a wholly owned subsidiary of Allianz Global Investors Holding GmbH. risklab GmbH is a limited liability
company, incorporated in Germany, with its registered office at Seidlstrasse 24-24a, D-80335 Munich, authorized and regulated by Bundesanstalt für Finanzdienstleistungsaufsicht
(www.bafin.de). The duplication, publication, or transmission of the contents, irrespective of the form, is not permitted.
The risklab brand name is used according to the trademark license agreement between risklab GmbH, Seidlstrasse 24-24a D-80335 Munich, Germany (licensee) and Algorithmics
Trademarks LLC, having its principal place of business at 1209 Orange St., Wilmington, Delaware, USA and Algorithmics Incorporated, having its principal place of business at 185
Spadina Ave., Toronto, Ontario, Canada (licensor). risklab is not affiliated with RMS® or RISKLINK®. The following names are registered trademarks of risklab GmbH: risklab
Dynamic Surplus Return Management™, risklab Variance Premium Trading Index™, risklab Commodity Variance Premium Trading Index™, risklab Variance Premium Trading
Stable Index™, risklab Commodities 4 Seasons Index™, risklab Commodities 4 Seasons Long Short Index™.
20

Understand. Act.
Thank You!