Embed Size (px)
Citation preview
APPLIED MICROBIOLOGY, Feb. 1973, p. 244-252Copyright 0 1973 American Society for Microbiology
Vol. 25, No. 2Printed in U.S.A.
Spiral Plate Method for Bacterial DeterminationJ. E. GILCHRIST, J. E. CAMPBELL, C. B. DONNELLY, J. T. PEELER AND J. M. DELANEY
Division of Microbiology, Food and Drug Administration, Cincinnati, Ohio 45226
Received for publication 18 August 1972
A method is described for determining the number of bacteria in a solution bythe use of a machine which deposits a known volume of sample on a rotatingagar plate in an ever decreasing amount in the form of an Archimedes spiral.After the sample is incubated, different colony densities are apparent on thesurface of the plate. A modified counting grid is described which relates area ofthe plate to volume of sample. By counting an appropriate area of the plate, thenumber of bacteria in the sample is estimated. This method was compared tothe pour plate procedure with the use of pure and mixed cultures in water andmilk. The results did not demonstrate a significant difference invariance between duplicates at the a = 0.01 level when concentrations of 600 to12 x 105 bacteria per ml were used, but the spiral plate method gave counts thatwere higher than counts obtained by the pour plate method. The time andmaterials required for this method are substantially less than those required forthe conventional aerobic pour plate procedure.
Agar pour plate procedures are used rou-tinely for the quantitative determination ofaerobic bacteria. Koch introduced the tech-nique in 1880 with the development of agarmedia, and by 1895 it was a recognized proce-dure. Analysis of the procedure by Breed andDotterer (2) in 1916 resulted in the proceduresused today. In the aerobic pour plate proce-dure, an unknown sample is diluted many-foldand a known sample of each dilution is mixedwith liquid agar in a petri dish. After incuba-tion, that plate which has between 30 and 300colonies is counted, and the resultant count ismultiplied by the appropriate dilution to ob-tain the bacterial concentration in the sample.All other plates that did not have between 30and 300 colonies are discarded. This procedureis simple, can cover a large concentrationrange, and at present is probably the mostprecise method for determining those bacteriathat will grow in the agar media.Much research has been done to find a better
method than the pour plate, primarily becauseit is time-consuming and costly. The drop plateand the surface plate are two methods in usetoday for mesophilic aerobes in which liquidsare deposited on the surface of an agar plate.The surface plate method is widely used inEurope but is not officially recommended inthe United States. Both methods offer costsavings over the pour plate method. Several ofthe advantages and disadvantages as listed by
Thatcher and Clark (12) appear to be applica-ble to the method presented in this paper.Some new methods have found applications inspecific areas of bacterial enumeration or iden-tification, such as particle counting (6), meta-bolic production of radioactive 14CO0 (5),measurements of various enzyme concentra-tions, bacterial growth in capillary tubes (1),microscopic scanning of stained organisms (8),and gas chromatography of bacteria. Some ofthese methods have been discussed by Mitz(7). Generally, the results are obtained morequickly by these methods than by the pourplate technique, but in each instance, disad-vantages have prevented them from beingroutinely used in most bacteriological laborato-ries.There are numerous aids for preparing agar
pour plates, such as automatic dispensers ofagar, automatic diluters, and various pipettingaids. There are also aids for inoculating thesurfaces of a prepared agar plate. There aremotors (Lab Line Instruments, Inc., MelrosePark, Ill.) that rotate a prepared agar platewhile a hand-held loop is used to inoculate thesurface. Trotman (13) has developed an auto-matic plate streaker with which the inoculumis placed on the surface of the agar with apipette and a mechanically moved loop streaksthe inoculum over the surface of the plate.The basic concept of our plating machine is
to deposit continuously a small amount of244
VOL. 25, 1973 BACTERIAL DETERMINATION BY SPIRAL PLATE METHOD
undiluted sample on the surface of a rotatingagar plate. The resultant track on the agarsurface is in the form of an Archimedes spiral.The amount of sample is controlled and de-creased while the dispensing stylus is movedfrom the center to the edge of the rotating agarplate. On incubation, the colonies developalong the lines where the liquid was originallydeposited. The number of colonies per unitlength of line or per unit area on the agar sur-face is dependent upon the bacterial concentra-tion in the deposited liquid. Because of the dif-ferent densities from the center to the edge ofthe plate, some area of each plate can becounted with ease.
MATERIALS AND METHODSThe parts of the plating machine are numbered in
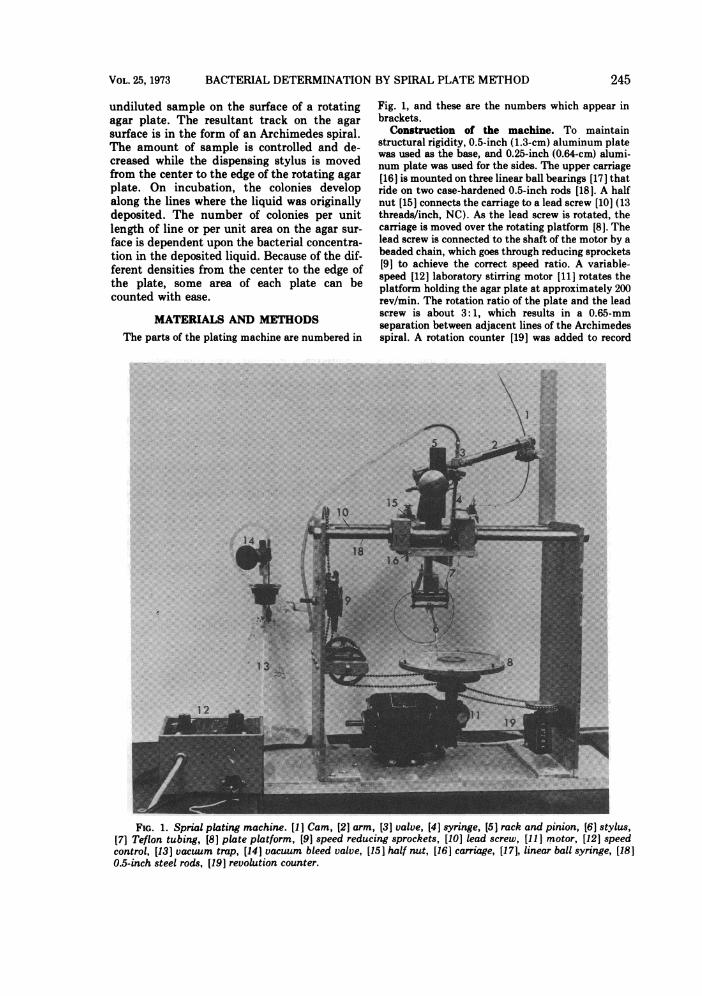
Fig. 1, and these are the numbers which appear inbrackets.
Construction of the machine. To maintainstructural rigidity, 0.5-inch (1.3-cm) aluminum platewas used as the base, and 0.25-inch (0.64-cm) alumi-num plate was used for the sides. The upper carriage[16] is mounted on three linear ball bearings [17] thatride on two case-hardened 0.5-inch rods (18]. A halfnut [15] connects the carriage to a lead screw [10] (13threads/inch, NC). As the lead screw is rotated, thecarriage is moved over the rotating platform [8]. Thelead screw is connected to the shaft of the motor by abeaded chain, which goes through reducing sprockets[9] to achieve the correct speed ratio. A variable-speed [12] laboratory stirring motor [11] rotates theplatform holding the agar plate at approximately 200rev/min. The rotation ratio of the plate and the leadscrew is about 3: 1, which results in a 0.65-mmseparation between adjacent lines of the Archimedesspiral. A rotation counter [19] was added to record
FIG. 1. Sprial plating machine. [1] Cam, [2] arm, [3] valve, [4] syringe, [5] rack and pinion, [6] stylus,[7] Teflon tubing, [8] plate platform, [9] speed reducing sprockets, [10] lead screw, [11] motor, [12] speedcontrol, [13] vacuum trap, [14] vacuum bleed valve, [15] half nut, [16] carriage, [17], linear ball syringe, [18]0.5-inch steel rods, [19] revolution counter.
245
GILCHRIST ET AL.
the position of the rotating agar plate, and tofacilitate finding the beginning and ending points ofthe Archimedes spiral. The rack and pinion [5] ismounted on the carriage and attached to an arm [2]that follows the shape of the cam [1]. The movableportion of the rack and pinion is attached to thehollow plunger of the backflow syringe [4]. The barrelof the syringe is fixed to the carriage and connected tothe thin-walled Teflon spaghetti tubing [7] whichextends through the stylus [6] to the surface of theagar plate. The stylus is mounted on pin pivots thatgive it free vertical movement but minimal lateralmovement. The vertical movement of the stylusallows the tip of the Teflon tubing to maintaincontact with the surface of the agar while the plate isrotating.
Operation. A liquid sample is introduced into thetip of the Teflon tubing by applying a vacuum to thetwo-way valve [3] and pulling the liquid up throughthe tubing and syringe. This flushes any residualsample from the Teflon tubing as the liquid moves inthe reverse manner into the vacuum trap [13]. Ableed valve [14] controls the vacuum applied to thesystem. When the tubing and syringe are filled withliquid, the valve attached to the syringe [3] is closed.An agar plate is placed on the platform [8 ], the Teflontip is placed on the agar surface, and the motor isstarted. As the platform moves, gravity causes thearm to follow the contour of the cam. Since the armis connected to the rack and pinion which controlsthe syringe, the fall of the arm is proportional to themovement of the plunger in the syringe. The armdrops rapidly at first and then more slowly as thecarriage moves over the agar plate. This results inmost of the sample being deposited close to thecenter of the plate, with a decreasing volume towardthe edge of the plate. When the operation reaches the80th revolution as shown by the rotation counter [19 ],the operator lifts the stylus from the agar surface,elevates the arm from the surface of the cam, andopens the two-way Teflon valve to remove residualsample from the system. The inoculated agar plate isremoved from the rotating platform. The direction ofthe motor is reversed, causing the carriage to moveback to the starting position. There the system isflushed with a 5% solution of sodium hypochloriteand rinsed with sterile water, after which the nextsample is drawn into the Teflon tubing and theoperation is repeated.
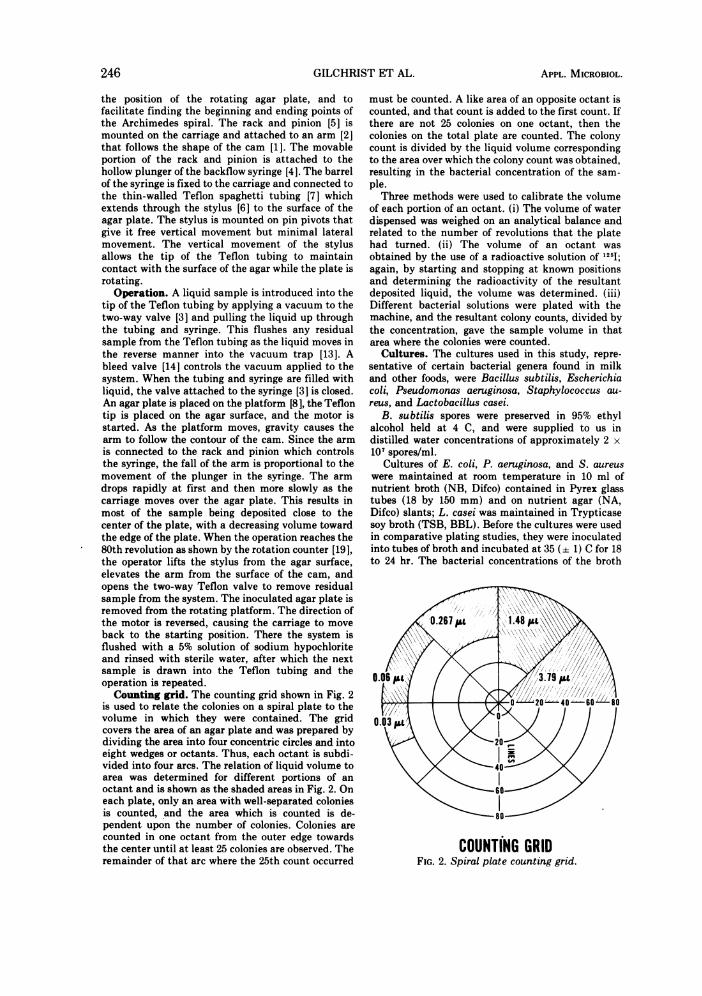
Counting grid. The counting grid shown in Fig. 2is used to relate the colonies on a spiral plate to thevolume in which they were contained. The gridcovers the area of an agar plate and was prepared bydividing the area into four concentric circles and intoeight wedges or octants. Thus, each octant is subdi-vided into four arcs. The relation of liquid volume toarea was determined for different portions of anoctant and is shown as the shaded areas in Fig. 2. Oneach plate, only an area with well-separated coloniesis counted, *and the area which is counted is de-pendent upon the number of colonies. Colonies arecounted in one octant from the outer edge towardsthe center until at least 25 colonies are observed. Theremainder of that arc where the 25th count occurred
must be counted. A like area of an opposite octant iscounted, and that count is added to the first count. Ifthere are not 25 colonies on one octant, then thecolonies on the total plate are counted. The colonycount is divided by the liquid volume correspondingto the area over which the colony count was obtained,resulting in the bacterial concentration of the sam-ple.
Three methods were used to calibrate the volumeof each portion of an octant. (i) The volume of waterdispensed was weighed on an analytical balance andrelated to the number of revolutions that the platehad turned. (ii) The volume of an octant wasobtained by the use of a radioactive solution of 1251;again, by starting and stopping at known positionsand determining the radioactivity of the resultantdeposited liquid, the volume was determined. (iii)Different bacterial solutions were plated with themachine, and the resultant colony counts, divided bythe concentration, gave the sample volume in thatarea where the colonies were counted.
Cultures. The cultures used in this study, repre-sentative of certain bacterial genera found in milkand other foods, were Bacillus subtilis, Escherichiacoli, Pseudomonas aeruginosa, Staphylococcus au-reus, and Lactobacillus casei.
B. subtilis spores were preserved in 95% ethylalcohol held at 4 C, and were supplied to us indistilled water concentrations of approximately 2 x10⁷ spores/ml.
Cultures of E. coli, P. aeruginosa, and S. aureuswere maintained at room temperature in 10 ml ofnutrient broth (NB, Difco) contained in Pyrex glasstubes (18 by 150 mm) and on nutrient agar (NA,Difco) slants; L. casei was maintained in Trypticasesoy broth (TSB, BBL). Before the cultures were usedin comparative plating studies, they were inoculatedinto tubes of broth and incubated at 35 (-+ 1) C for 18to 24 hr. The bacterial concentrations of the broth
COUNTiNG GRIDFIG. 2. Spiral plate counting grid.
246 APPL. MICROBIOL.
VOL. 25, 1973 BACTERIAL DETERMINATION BY SPIRAL PLATE METHOD
cultures (or, in certain instances, growth from an NAslant of E. coli suspended in NB) were adjusted bydiluting the culture with phosphate-buffered dilutionwater to a specific optical density known to corre-spond to the desired concentration. This concentra-tion was diluted to give 10 serial dilutions of eachculture at equal intervals ranging in count fromapproximately 107 to 102 cells/ml. These 10 dilutionswere plated in duplicate by directly inoculating thesurface of prepared agar plates (Standard Methods[SMA, BBL] contained in plastic petri dishes [150 by25 mm]) with the spiral plating machine. Whenexamined by the agar pour plate method, furtherdilutions were made when necessary and plated induplicate (SMA, BBL) in plastic petri dishes (100 by15 mm). Two or more comparative plating studieswere made with each culture, and in two studies thecultures (E. coli and S. aureus) were mixed and thendiluted and plated as described for single cultures.
All plates were incubated at 35 (±+ 1) C. The spiralplates were counted after 16 to 24 hr of incubation,with the exception of L. casei cultures, which wereincubated for 40 to 44 hr. The agar pour plates werecounted after 48 (0 3) hr of incubation (with theexception of E. coli plates, which were counted after18 to 24 hr).
In addition to the comparative studies with purecultures, 14 split milk samples (4) consisting of inocu-lated raw milk, cream, and pasteurized milk productswere compared for bacteria by the agar plate and thespiral plate methods.
RESULTSSixty-five replicate platings were made of a
spore suspension of B. subtilis to test theprecision of the spiral plating method on repli-cate counts, and to determine whether thecounts were normally distributed under thelogarithmic transform. Pearson and Hartley(10) have presented the test and tables used toexamine the assumption of normality. A valueof a = 0.782 was computed for the 65 replicateobservations obtained in this experiment, andthe assumption of normality under logarithmictransform could not be rejected at the a = 0.01level. The variance as given by Ostle (9) was0.00196 in log10 units, and the percent coeffi-cient of variation was 9.97 as computed fromthe raw counts per milliliter of B. subtilisculture.Table 1 compares the bacterial concentra-
tions obtained by the spiral and pour platemethods for different concentrations of P.aeruginosa. In this comparison, as in all com-parisons, blanks of sterile water were platedwith the spiral plating machine immediatelyafter the most concentrated samples to checkfor contamination between samples; none wasfound. The variance between duplicate platesat all concentration levels is given for each
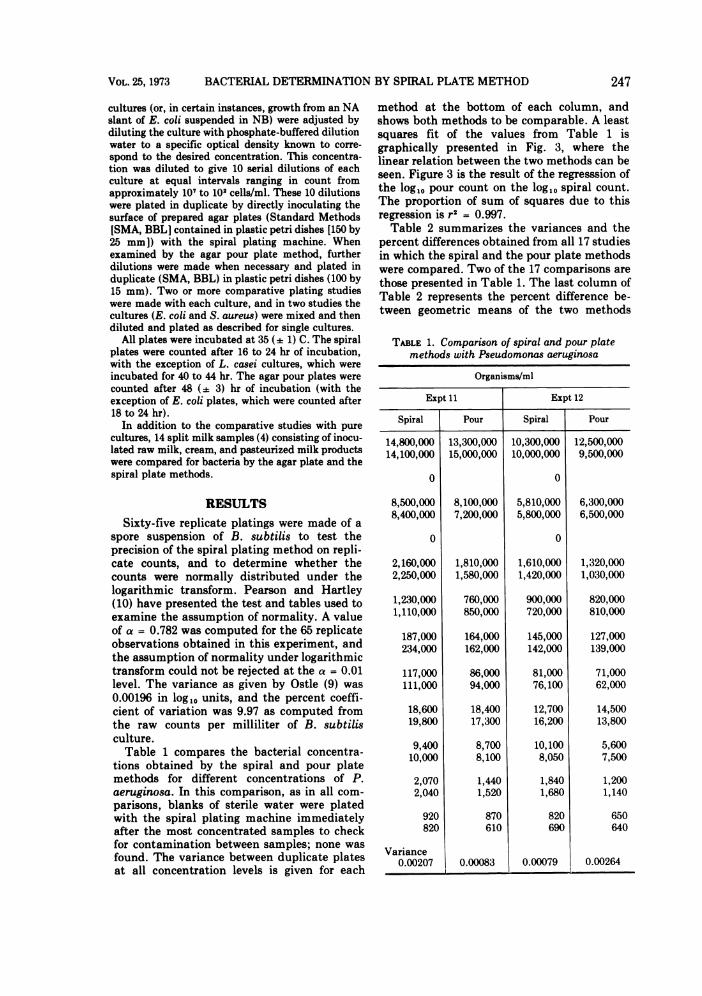
method at the bottom of each column, andshows both methods to be comparable. A leastsquares fit of the values from Table 1 isgraphically presented in Fig. 3, where thelinear relation between the two methods can beseen. Figure 3 is the result of the regresssion ofthe log,0 pour count on the log10 spiral count.The proportion of sum of squares due to thisregression is r2 = 0.997.Table 2 summarizes the variances and the
percent differences obtained from all 17 studiesin which the spiral and the pour plate methodswere compared. Two of the 17 comparisons arethose presented in Table 1. The last column ofTable 2 represents the percent difference be-tween geometric means of the two methods
TABLE 1. Comparison of spiral and pour platemethods with Pseudomonas aeruginosa
Organisms/ml
Expt 11 Expt 12
Spiral Pour Spiral Pour
14,800,00014,100,000
0
8,500,0008,400,000
0
2,160,0002,250,000
1,230,0001,110,000
187,000234,000
117,000111,000
18,60019,800
9,40010,000
2,0702,040
920820
Variance0.00207
13,300,00015,000,000
8,100,0007,200,000
1,810,0001,580,000
760,000850,000
164,000162,000
86,00094,000
18,40017,300
8,7008,100
1,4401,520
870610
0.00083
10,300,00010,000,000
0
5,810,0005,800,000
0
1,610,0001,420,000
900,000720,000
145,000142,000
81,00076,100
12,70016,200
10,1008,050
1,8401,680
820690
0.00079
12,500,0009,500,000
6,300,0006,500,000
1,320,0001,030,000
820,000810,000
127,000139,000
71,00062,000
14,50013,800
5,6007,500
1,2001,140
650640
0.00264
7-
-
247
GILCHRIST ET AL.
lo 2 lo 3 10 4 lo 5 l0 6 10 7
[organisms/ml)SPIRAL PLATE METHOD
FIG. 3. Graphic comparison of spiral and pour plat-ing methods with solutions of Pseudomonasaeruginosa.
TABLE 2. Statistical summary of 17 comparisons ofthe spiral and pour plating methods
No. of Variance Per centOrganism observa-
tions Spiral Pour plate differencea
S. aureus 18 0.00186 0.00170 4.818 0.00084 0.00093 9.016 0.00196 0.00050 14.7b16 0.00174 0.00355 -6.5
L. casei 18 0.00332 0.00597 25.lb20 0.00306 0.00409 24.6b
B. subtilis 18 0.00307 0.00562 34.7b18 0.00287 0.00060 17.7b
E. coli 18 0.00413 0.00750 5.518 0.00618 0.00424 36.6b18 0.00285 0.00180 11.5b18 0.00319 0.00275 7.518 0.00184 0.00130 11.0b
E. coli and S. 18 0.00280 0.00102 0.5aureus 18 0.00184 0.00174 21.5b
P. aeruginosa 20 0.00207 0.00083 17.9b20 0.00079 0.00264 13.2
a Per cent difference = geometric mean (spiral -
pour/pour) 100.bSignificant at a = 0.01 level.
compared to the pour plating method. Thecounts of the spiral plating method averaged17% higher than those of the pour platemethod. The replicate variances obtained by
both methods were about the same, indicatingthat both methods produce duplicate plateswith less than 0.003 variance (about 13% co-efficient of variation).A comparison of the spiral and pour plating
methods, performed with split milk samples,shows (Table 3) that the counts obtained bythe spiral plating method were 14% higher thanthose obtained by the pour plating method.The variances between duplicate plates for thetwo methods were again comparable, as theywere with the counts obtained from the purecultures in buffer solutions. The plates of thesplit milk samples were counted after 18 and 44hr of incubation at 35 C. A few colonies(presumably E. coli) were counted after 18 hr,but the pinpoint colonies of micrococcus ap-peared only after the longer incubation time.Many microbiological tests are affected by
the technique of the analyst. Therefore, anexperiment was designed to determine whetherthe variation among analysts would affect theresults obtained by the spiral plating method(Table 4). Five analysts were chosen for thestudy, three of whom were totally unfamiliarwith the operation of the spiral machine. Thesethree were given 15 min of instruction inoperational procedure, and then each of the fiveanalysts examined three samples in duplicate.An analysis of variance was used to test thenull hypothesis that results for analysts wereequal, and no significant difference amonganalysts was found.Typical plates as prepared by the spiral
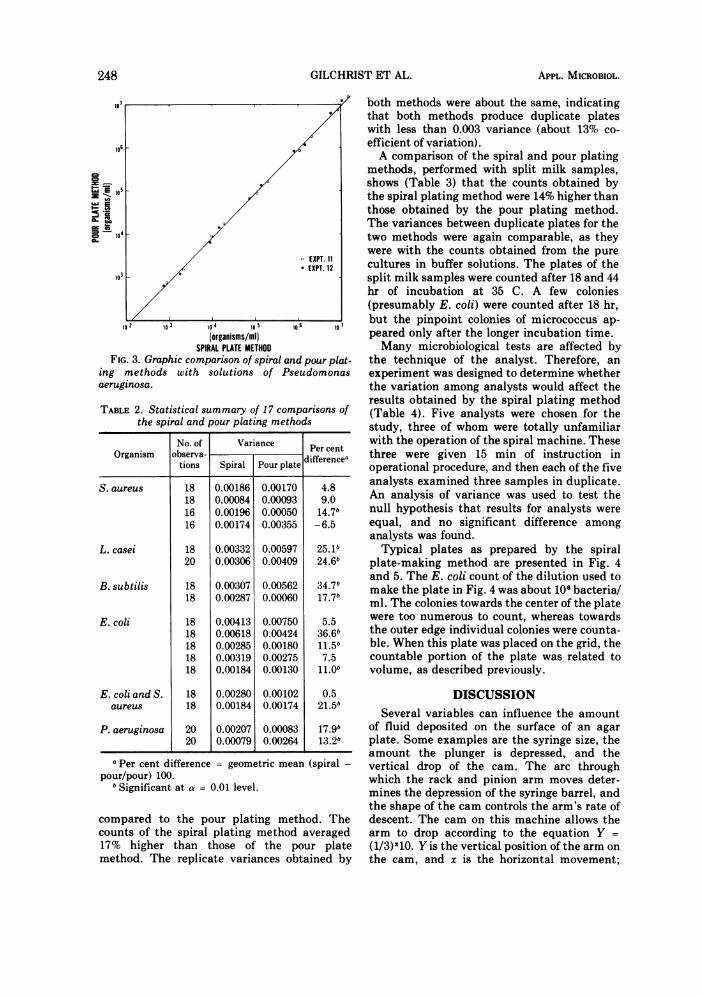
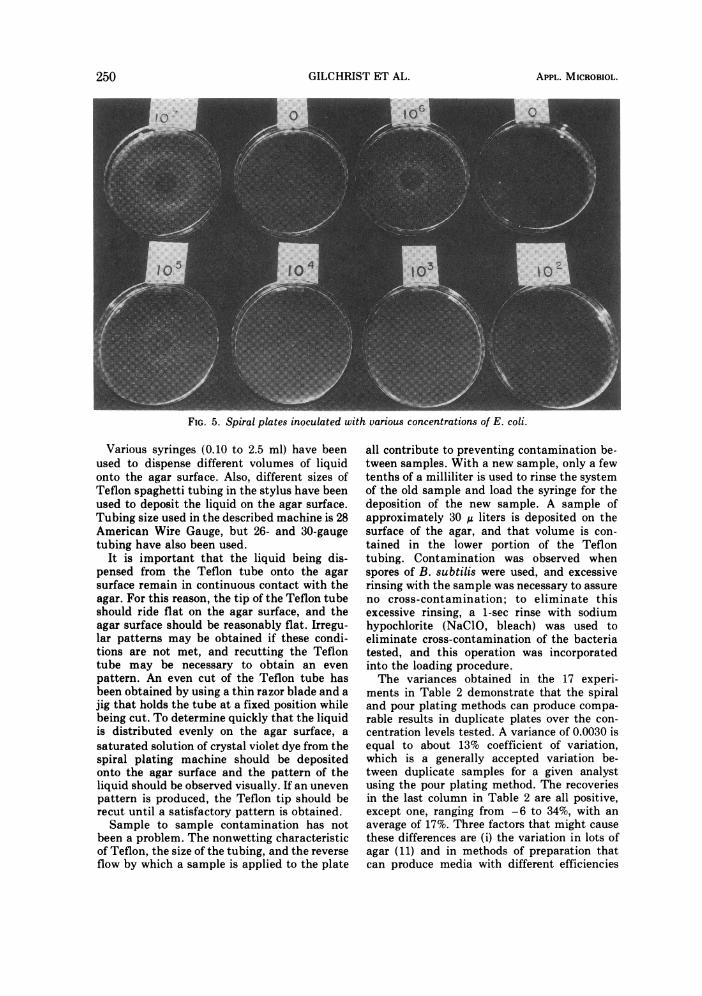
plate-making method are presented in Fig. 4and 5. The E. coli count of the dilution used tomake the plate in Fig. 4 was about 106 bacteria/ml. The colonies towards the center of the platewere too numerous to count, whereas towardsthe outer edge individual colonies were counta-ble. When this plate was placed on the grid, thecountable portion of the plate was related tovolume, as described previously.
DISCUSSIONSeveral variables can influence the amount
of fluid deposited on the surface of an agarplate. Some examples are the syringe size, theamount the plunger is depressed, and thevertical drop of the cam. The arc throughwhich the rack and pinion arm moves deter-mines the depression of the syringe barrel, andthe shape of the cam controls the arm's rate ofdescent. The cam on this machine allows thearm to drop according to the equation Y =(1/3)x10. Y is the vertical position of the arm onthe cam, and x is the horizontal movement;
248 APPL. MICROBIOL.
VOL. 25, 1973 BACTERIAL DETERMINATION BY SPIRAL PLATE METHOD
TABLE 3. Analysis of split milk samples by spiraland pour plating methods
Culture Organisms/ml,,Sample Milk type added ir
1 Homogenized L. casei 14,500 14,0008 + vitamin D 14,200 15,000
2 Chocolate Micrococcus 10,000 8,1504 A 9,800 9,200
3 Homogenized, Micrococcus 17,400 17,0007 18% creamb B 20,000 16,100
5 Homogenized, Micrococcus 24,000 19,80015% cream" B, L. casei
6 Homogenized, Micrococcus 13,500 15,9002% cream A
9 Raw,6%cream L. casei 125,000 115,00011 170,000 108,000
10 Raw, 6% cream Micrococcus 105,000 101,00013 B 106,000 79,000
12 Raw, 6% cream Micrococcus 155,000 154,00014 A 155,000 142,000
Variance 0.00342 0.00281Average difference 14%
Analysis of variance
Sum of Degrees MeanSource ofF-ratiosquares freedom square
A, Methods .... 0.04067 1 0.04067 13.04cB, samples .... 12.79446 13 0.98419 315.45cAB ...... 0.08812 13 0.00678 2.17cError ...... 0.08722 28 0.00312 -Total ...... 13.01047 55 -
a Average of duplicates.b Homogenized milk + sterile 30% cream.c Significant at a = 0.01.
thus, when x = 0, y = 10 cm, and when x = 1, y= 3.3 cm, etc. Since the counting grid is fixed,the area of the plates over which bacteria canbe deposited must conform to the limits set bythe area of the counting grid. The stylus mustbegin at the same place on the surface of eachplate and cover the same horizontal distancewhile moving across the plate. Each of theseparameters has been set in the machine as it isdescribed; if other conditions are desired,however, each parameter could be altered ac-cordingly. For example, a cam could be de-signed to allow deposition of the same volume
TAMLE 4. Analysis of three B. subtilis suspensions bydifferent operators of the spiral plating machine
Organisms/ml found by
Suspension Labo-Laoratory Secre- Stock Chemisttech- tary clerk rator hmsnician drco
A 2,770 2,900 3,170 3,040 3,1702,770 3,300 2,900 3,430 2,770
B 24,000 22,700 25,600 31,200 30,00026,400 26,400 26,000 24,000 29,200
C 276,000 424,000 301,000 242,000 272,000229,000 250,000 280,000 263,000 310,000
Analysis of variance
Sum of Degrees MeanSource of F-ratiosquares freedom square
Operator ..... 0.01081 4 0.00270 0.85Sample ...... 19.39731 2 9.69866 3,069.20aOperator-sample .... 0.02071 8 0.00259 0.82
Error .... 0.04736 15 0.00316 -
Total .... 19.47619 29 -
a Significant at a = 0.01 level.
FIG. 4. Spiral plate inoculated with 106 organismsof E. coli/ml.
of liquid per unit area on the entire agar surfaceinstead of the density gradient that is now
used.
249
GILCHRIST ET AL.
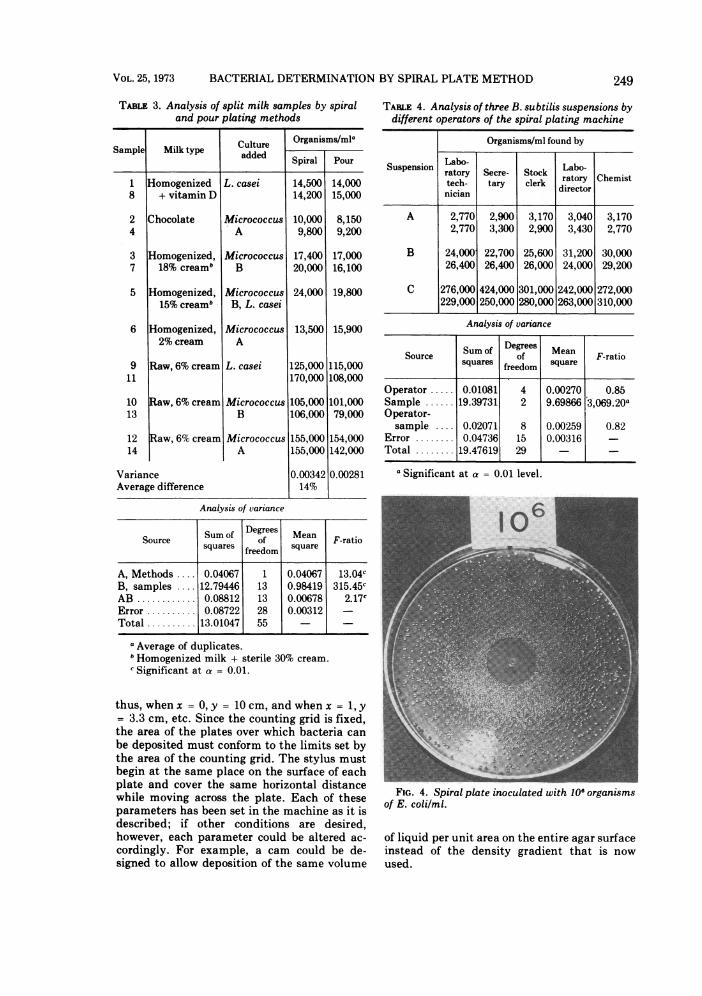
FIG. 5. Spiral plates inoculated with various concentrations of E. coli.
Various syringes (0.10 to 2.5 ml) have beenused to dispense different volumes of liquidonto the agar surface. Also, different sizes ofTeflon spaghetti tubing in the stylus have beenused to deposit the liquid on the agar surface.Tubing size used in the described machine is 28American Wire Gauge, but 26- and 30-gaugetubing have also been used.
It is important that the liquid being dis-pensed from the Teflon tube onto the agarsurface remain in continuous contact with theagar. For this reason, the tip of the Teflon tubeshould ride flat on the agar surface, and theagar surface should be reasonably flat. Irregu-lar patterns may be obtained if these condi-tions are not met, and recutting the Teflontube may be necessary to obtain an evenpattern. An even cut of the Teflon tube hasbeen obtained by using a thin razor blade and ajig that holds the tube at a fixed position whilebeing cut. To determine quickly that the liquidis distributed evenly on the agar surface, asaturated solution of crystal violet dye from thespiral plating machine should be depositedonto the agar surface and the pattern of theliquid should be observed visually. If an unevenpattern is produced, the Teflon tip should berecut until a satisfactory pattern is obtained.Sample to sample contamination has not
been a problem. The nonwetting characteristicof Teflon, the size of the tubing, and the reverseflow by which a sample is applied to the plate
all contribute to preventing contamination be-tween samples. With a new sample, only a fewtenths of a milliliter is used to rinse the systemof the old sample and load the syringe for thedeposition of the new sample. A sample ofapproximately 30 u1 liters is deposited on thesurface of the agar, and that volume is con-tained in the lower portion of the Teflontubing. Contamination was observed whenspores of B. subtilis were used, and excessiverinsing with the sample was necessary to assureno cross-contamination; to eliminate thisexcessive rinsing, a 1-sec rinse with sodiumhypochlorite (NaClO, bleach) was used toeliminate cross-contamination of the bacteriatested, and this operation was incorporatedinto the loading procedure.The variances obtained in the 17 experi-
ments in Table 2 demonstrate that the spiraland pour plating methods can produce compa-rable results in duplicate plates over the con-centration levels tested. A variance of 0.0030 isequal to about 13% coefficient of variation,which is a generally accepted variation be-tween duplicate samples for a given analystusing the pour plating method. The recoveriesin the last column in Table 2 are all positive,except one, ranging from -6 to 34%, with anaverage of 17%. Three factors that might causethese differences are (i) the variation in lots ofagar (11) and in methods of preparation thatcan produce media with different efficiencies
250 APPL. MICROBIOL.
VOL. 25, 1973 BACTERIAL DETERMINAION BY SPIRAL PLATE METHOD
of growing bacterial colonies, (ii) error in theamount of liquid dispensed from the spiralplating machine, and (iii) a greater breaking upof clumps of bacteria as a result of spreading asmall volume of liquid on a surface (14) com-pared to mixing a solution with melted agar, asin the pour plating method. Clark (3) found 70to 80% higher colony counts from chickenprocessing samples when surface plating wascompared to pour plating. The difference wasrelated to both type and strain of bacteria.The split milk samples (4) were part of a
group of replicate samples that were dis-tributed nationally to various laboratories aspart of a laboratory certification program. Theanalyzed samples included raw milk, homoge-nized milk, cream, and chocolate milk, andwere of unknown cultures and concentrations.The samples containing 15 and 18% cream weremore viscous than the other samples and tooklonger to be pulled into the Teflon tube, but noother difficulties were encountered.
In contrast to pour plates, the spiral plate-making procedure uses all plates; no plates arethrown away. Each plate is put onto the gridand counted. In most cases, between 50 and 100colonies will be counted, but the position of thearea on the grid over which the 50 to 100colonies are distributed will vary with thesample concentration. A lower limit of 20colonies per plate (600 bacteria per ml) wasimposed, because the average variance ob-tained with fewer than 20 colonies per plate inthe 17 experiments was 0.00503 compared to0.00261 when plates with fewer than 20 colonieswere excluded. An arbitrary upper limit of 100colonies per one-fourth of the outer arc (about10 million bacteria per ml) was set for conven-ience in counting; however, the variance wasnot altered when more than 100 colonies werecounted.The operator's time for the spiral plating
machine is about 2 min per plate, which is fivetimes as fast as for the pour plating procedure.Much of the saving in time is achieved becauseno dilution of the sample is made in the spiralplating procedure, thus making the use ofpipette, dilution bottle, and sterile water un-necessary. The machine shown in Fig. 1 isbeing modified to reduce operator time byautomating some of the functions now per-formed by the operator. Counting spiral platesis somewhat faster and easier than countingpour plates, primarily because of the equalsize of the colonies.The technique of depositing bacteria on an
agar surface along the fixed lines of an Ar-chimedes spiral has advantages not found in
the pour plate procedure. The growth rate ofthe same species is the same, resulting incolonies of about the same size. In many cases,colonies of different species may be visuallydifferentiated and counted while using thecounting grid. Another advantage of spiralplating is that the Archimedes spiral stopsbefore the meniscus of the agar is reached.Thus, colonies are counted only on the clear,level portion of the agar. These factors areimportant not only in visual counting but alsoin developing an electronic counter. We arecurrently investigating, with apparent success,an electronic laser system for counting spiralplates.The short preparation time, the speed with
which the sample is applied to the plates, thebroad concentration range, and the probabilityof automating the spiral plating machine andhaving an electronic counter, all make thefuture of the spiral plating method appear verypromising.
ACKNOWLEDGMENTS
Initial concepts of the spiral plating machine and goals fordevelopment were conceived in discussions with K. H.Lewis, Bureau of Foods, and R. B. Read, Jr., Division ofMicrobiology, Food and Drug Administration. In addition,R. P. Martin, J. G. Bradshaw, A. A. Swartzentruber, D. W.Francis, A. L. Reyes, A. J. Wehby, and R. G. Crawford of theBacteriological Branch, Division of Microbiology, suppliedmany services which were of great value in developing thismachine.
LITERATURE CITED1. Bowman, R. L., P. Blume, and G. G. Vurek. 1967.
Capillary-tube scanner for mechanized microbiology.Science 158:78.
2. Breed, R. S., and W. D. Dotterrer. 1916. The number ofcolonies allowable on satisfactory agar plates. NewYork Agricultural Experimental Station TechnicalBulletin No. 53.
3. Clark, D. S. 1967. Comparison of pour and surface platemethods for determination of bacterial counts. Can. J.Microbiol. 13:1409-1412.
4. Donnelly, C. B., E. K. Harris, L. A. Black, and K. H.Lewis. 1960. Statistical analysis of standard platecounts of milk samples split with state laboratories. J.Milk Food Technol. 21:315-319.
5. Deland, F. H., and H. N. Wagner. 1969. Early detectionof bacterial growth with carbon-14 labeled glucose.Radiology 92:154.
6. Mansberg, H. P. 1957. Automatic particle and bacterialcolony counter. Science 126:823.
7. Mitz, M. A. 1969. The detection of bacteria and virusesin liquids. Ann. N.Y. Acad. Sci. 158:651.
8. Nelson, S. S., 0. E. A. Boldman, and W. A. Schurcliff.1962. The partichrome analyzer for the detection andenumeration of bacteria. Ann. N.Y. Acad. Sci. 99:290.
9. Ostle, B. 1963. Statistics in research, 2nd ed. Iowa StateUniversity Press, Ames.
10. Pearson, E. S., and H. 0. Hartley (ed.). 1962. Biomet-rika tables for statisticians, vol. 1 Cambridge Univer-sity Press, Cambridge, England.
11. Read, R. B., Jr., and A. L. Reyes. 1968. Variation in
251

GILCHRIST ET AL.
plating efficiency of salmonellae on eight lots ofbrilliant green agar. Appl. Microbiol. 96:746-748.
12. Thatcher, F. S., and D. S. Clark, editors. 1968. Microor-ganisms in foods. University of Toronto Press, To-ronto, Canada.
APPL. MICROBIOL.
13. Trotman, R. E. 1971. The automatic spreading ofbacterial culture over a solid agar plate. J. Appl.Bacteriol. 34:615-616.
14. van Soestberge, A. A., and H. L. Chingo. 1969. Pourplates or streak plates. Appl. Microbiol. 18:1092.
252