Embed Size (px)
Citation preview

URBAN FORESTSScientists and community planners are partnering to protect our vital
city canopies.
Houston’s Rare Winter Thundersnow
Aerosol Scientists Pivot to COVID
Sea Cucumber Heroes
VOL. 102 | NO. 6JUNE 2021


SCIENCE NEWS BY AGU // Eos.org 1SCIENCE NEWS BY AGU // Eos.org 1
©2021. AGU. All Rights Reserved. Material in this issue may be photocopied by individual scientists for research or classroom use. Permission is also granted to use short quotes, figures, and tables for publication in scientific books and journals. For permission for any other uses, contact the AGU Publications Office.
Eos (ISSN 0096-3941) is published monthly by AGU, 2000 Florida Ave., NW, Washington, DC 20009, USA. Periodical Class postage paid at Washington, D.C., and at additional mailing offices. POSTMASTER: Send address changes to Member Service Center, 2000 Florida Ave., NW, Washington, DC 20009, USA
Member Service Center: 8:00 a.m.–6:00 p.m. Eastern time; Tel: +1-202-462-6900; Fax: +1-202-328-0566; Tel. orders in U.S.: 1-800-966-2481; [email protected].
Submit your article proposal or suggest a news story to Eos at bit.ly/Eos-proposal.
Views expressed in this publication do not necessarily reflect official positions of AGU unless expressly stated.
Randy Fiser, Executive Director/CEO
Vice President, Communications, Marketing,and Media Relations
Amy Storey
Production & Design
EditorialManager, News and Features Editor
Science EditorAssociate Editor
News and Features WriterNews and Features Writer
Caryl-Sue MicalizioTimothy OlesonAlexandra ScammellKimberly M. S. CartierJenessa Duncombe
AGU Staff
Editor in Chief Heather Goss, [email protected]
Communications SpecialistAssistant Director, Marketing & Advertising
Maria MuekaliaLiz Zipse
Marketing
AdvertisingDisplay Advertising
Recruitment Advertising
Steve West [email protected]@wiley.com
Science AdvisersGeomagnetism, Paleomagnetism,
and ElectromagnetismSpace Physics and Aeronomy
CryosphereStudy of the Earth’s Deep Interior
GeodesyHistory of Geophysics
Planetary SciencesNatural Hazards
Volcanology, Geochemistry, and PetrologySocietal Impacts and Policy Sciences
SeismologyTectonophysics
Near-Surface GeophysicsEarth and Space Science Informatics
Mineral and Rock PhysicsOcean Sciences
Global Environmental ChangeEducationHydrology
TectonophysicsPaleoceanography and Paleoclimatology
Atmospheric SciencesNonlinear Geophysics
BiogeosciencesHydrology
Diversity and InclusionEarth and Planetary Surface Processes
Atmospheric and Space ElectricityGeoHealth
Julie Bowles
Christina M. S. CohenEllyn EnderlinEdward J. GarneroBrian C. GunterKristine C. HarperSarah M. HörstMichelle HummelEmily R. JohnsonChristine KirchhoffKeith D. KoperJian LinJuan LorenzoKirk MartinezSébastien MerkelJerry L. MillerHansi SinghEric M. RiggsKerstin StahlCarol A. SteinKaustubh ThirumalaiMika Tosca Adrian TuckMerritt TuretskyAdam S. WardLisa D. WhiteAndrew C. WilcoxYoav YairBen Zaitchik
Manager, Production and OperationsProduction and Analytics Specialist
Assistant Director, Design & BrandingSenior Graphic DesignerSenior Graphic Designer
Graphic Design Intern
Faith A. IshiiAnaise AristideBeth BagleyValerie FriedmanJ. Henry PereiraClaire DeSmit
Heather Goss, Editor in Chief
FROM THE EDITOR
Growing Healthy City Canopies
When asked to imagine Washington, D.C., where AGU is headquartered, people who don’t live here prob-ably think of all our large, marble columns and
monuments surrounded by lots and lots of concrete. But run-ning right down the middle of the city is Rock Creek Park, nearly 710 hectares (1,754 acres) of trees, trails, and streams that were designated a national park in 1890. This is an “urban forest” of perhaps the most obvious kind—a beautiful, pro-tected piece of nature in the middle of a city.
These ecosystems are hugely important to city dwellers, but they don’t need to be nearly as large as Rock Creek Park to pro-vide benefits. Single trees planted along a street, small neigh-borhood parks, and shrubs lining a thoroughfare can have sig-nificant impact on human health, local air quality and water systems, and even the economy.
In our June issue of Eos, we look at the growing body of research on this vital city greenery. Courtney L. Peterson and colleagues walk us through the canopies of three U.S. cities—Albu-querque, N.M.; Austin, Texas; and Durango, Colo.—and how local government is starting to work with researchers to better manage and adapt their green spaces. As climate change exac-erbates the urban heat island effect, among other issues, protecting local trees and their cool-ing benefits is essential. Read more on page 20.
Cities are, of course, made up of a complex amalgam of privileged and underserved com-munities, with different levels of access to urban benefits. (Rock Creek Park, which runs through the northern half of the city, is an excellent example; the households in D.C. with the lowest median incomes are in the south and across a river.) If you’re wondering what that has to do with science, turn to page 34, where we report on researchers doing the hard work in communities to create green infrastructure using equity- focused development strategies.
Urban forests also face unique, city- dwelling dangers. On page 26, we report on trees in Boston, Mass., that neighborhood residents realized were dying from gas leaks in the pipes under the street. Scientists partnered with local activists and have made real, legislative change that’s not only keeping their streets greener but playing a part in greening the state’s entire energy system.
We’re going to be talking more about scientists’ role in our communities this year—“Science Is Society” is the theme of AGU’s Fall Meeting 2021. Turn to page 18 to read about Raleigh Mar-tin’s experience as a geoscientist fellow on the Select Committee on the Climate Crisis in the U.S. House of Representatives. You don’t need to roll up to one of D.C.’s marble- columned buildings to be part of effective change though—Martin offers several recommendations for anyone interested in talking to their local policymakers about making good decisions sup-ported by scientific evidence.
Is the weather nice where you are today? If so, I recommend heading outside and finding a lovely tree to read our June issue underneath.

2 Eos // JUNE 2021
CONTENT
26 The Surprising Root of the Massachusetts Fight Against Natural GasBy Jenessa Duncombe
This is how activism gets turned into science and codified into state law.
34 Growing Equity in City Green SpaceBy Kimberly Cartier
Urban forest management requires a deep understanding of the complex relationship residents have with green spaces.
Features
20 Community Forests Prepare for Climate ChangeBy Courtney L. Peterson et al.
In three U.S. cities, city managers are working with scientists to keep their trees alive and thriving.
On the CoverCredit: Claire DeSmit
34
26
20

SCIENCE NEWS BY AGU // Eos.org 3
AmericanGeophysicalUnion company/american-geophysical-union@AGU_Eos AGUvideos americangeophysicalunion americangeophysicalunion
CONTENT
Columns
From the Editor 1 Growing Healthy City Canopies
News 4 Turf’s Dirty Little Secret 5 Ancient Acidic Lakes May Have Harbored Life 6 Scientists Map Africa’s Groundwater Recharge
for the First Time 8 A Reminder of a Desert’s Past, Before Dingo Removal 9 Rare Wintertime Thunderstorms Recorded
over the U.S. Gulf Coast 10 Aerosol Scientists Try to Clear the Air
About COVID- 19 Transmission 11 Making the Universe Blurrier 13 Oak Trees Offer a Continuous Climate Record
for Central Europe 14 Sea Cucumbers: The Excremental Heroes of Coral
Reef Ecosystems 15 Aerial Photographs Uncover Bogotá’s Indigenous
Hydraulic System 17 A Space Hurricane Spotted Above the Polar Cap
Opinion 18 How Scientists Can Engage to Solve the Climate Crisis
Research Spotlight 40 A 50,000-Year History of Current Flow Yields New
Climate Clues 41 An Innovative Approach to Investigating
Subduction Slip Budgets | Global Warming Causes Uneven Changes in Heat Stress Indicators
42 The Gaps in Environmental Networks Across Latin America 43 How Did Diatoms Evolve to Swap Zinc
for the Toxic Metal Cadmium? | The Space Dust That Causes Zodiacal Light Might Come from Mars
44 The First Angstrom- Scale View of Weathering | Earthquakes Can Acidify Groundwater
45 Parsing Routes to Aquifer Recharge Along Mountain Fronts
Editors’ Highlights 46 Dawn Storms at Jupiter | Cellular Radio Signals
Provide New Data on Smoke Particulates
Positions Available 47 Current job openings in the Earth and space sciences
Postcards from the Field 48 Modern analogues for ancient stromatolites
436
5 11

4 Eos // JUNE 2021
NEWS
Opp
osite
: Uns
plas
h/La
rs B
o N
iels
en
Turf’s Dirty Little Secret
A ustralian scientists have found that grassy sports fields used for soccer, cricket, and baseball can release a
potent greenhouse gas into the environment. A yearlong study at La Trobe University in Melbourne, suggests that mowing, fertilizing, and applying herbicides to turfgrass sports fields contributes to the release of large amounts of nitrous oxide.
“This study is another indication that urbanization has complex impacts on our environment,” said Amy Townsend- Small, a biogeochemist who was not involved with the research. “Even though most cities are work-ing toward increasing their amount of green space, this doesn’t always help meet climate goals.”
A Greenhouse Gas That Eats Away at the Ozone LayerNitrous oxide is the third most emitted greenhouse gas, after carbon dioxide and methane. Although it makes up only 7% of greenhouse gas emissions in the United States, it has 265 times the global warming capacity of carbon dioxide. The gas is also the largest source of ozone- depleting substances from humans.
In soil, nitrous oxide is emitted by microbes digesting chemical compounds for energy. Although the process is natural, humans have cultivated soil conditions that encourage
more gas production. Agriculture emits the most nitrous oxide of any sector.
As the world urbanizes, scientists are studying how nitrous oxide emissions are concentrated outside the agricultural realm. A better understanding of how sports fields contribute to emissions could help mitigate those emissions. Although the problem is relatively small, turf’s footprint may be large. In one study by Cristina Milesi of the NASA Ames Research Center, it was calculated that turfgrass covers an area 3 times larger than any other irrigated crop in the United States (bit . ly/ turf - grass - cycle).
Emissions Similar to High- Intensity FarmingIn the latest study, David Riches, a research fellow at La Trobe, and his colleagues installed instruments to measure nitrous oxide and methane on campus fields used for soccer and cricket.
“What we found was, we got really quite high emissions in the sports field soils which were comparable to [those] of the high- intensity vegetable production systems we’ve previously been working in,” said Riches. The team monitored conditions for 213 days from autumn to spring on one sports field and intermittently on two others.
Applying herbicide to the field caused the largest jump in nitrous oxide emissions. Her-
bicide likely prohibits new growth and frees up more soil nitrogen for hungry microbes, researchers said.
Aerating, fertilizing, and watering for the oncoming sports season also increased nitrous oxide emissions. Watering decreases the microbes’ access to oxygen, making them produce more nitrous oxide.
Notably, the three sports fields’ emissions were 2.5 times higher than those of an unused lawn nearby. Nitrous oxide averaged around 38 grams of nitrogen per hectare per day at the continuously monitored sports field (data at the other two were intermittent) versus about 9 grams of nitrogen per hectare per day at the lawn.
“You do get these peaks of high emissions in the sports field, which you just don’t get in the lawn,” Riches said.
More Careful Management Could Cut EmissionsOne way to reduce emissions could be to water only when a field needs it, Riches said. Another idea might be to dial back the amount of fertilizer and use a slow- release or nitrogen- inhibiting product.
The study was published in Science of the Total Environment (bit . ly/ sports - fields - emission).
Extrapolating to the rest of Australia, Riches figures that grass playing fields alone do not have a significant impact on green-house gas emissions. But the effect could be greater if lawns, parks, gardens, turf farms, roadside vegetation, and other intensively managed green spaces are shown to emit as much as sports fields.
“If you look at all the intensively managed turf in total, then it might start to become more significant,” Riches said. “Then you might want to do something to mitigate it when you can.”
By Jenessa Duncombe (@jrdscience), Staff Writer
The field’s emissions were 2.5 times higher than those of an unused lawn nearby.

SCIENCE NEWS BY AGU // Eos.org 5
NEWS
Opp
osite
: Uns
plas
h/La
rs B
o N
iels
en
Ancient Acidic Lakes May Have Harbored Life
For the early microbial colonists of Earth, land was rather uninviting. In the ocean, chemistry and temperatures
were relatively stable, and seawater provided a shield against ultraviolet radiation. In com-parison, the low- oxygen atmosphere of freshly exposed land offered little protection. Microbes had to deal with fluctuating levels of light, heat, minerals, and moisture.
Scientists have found what appears to have been a suitable refuge from the harsh terres-trial landscape: an acidic lake. In a recent study, researchers identified sediments dat-ing back billions of years that suggest a com-munity of microbes that adapted to life in an acidic lake that filled an ancient volcano. The volcano’s hydrothermal waters could have provided energy and minerals needed to sus-tain life, according to the study, published in Earth and Planetary Science Letters (bit . ly/ volcanic - lakes).
The researchers identified “a new environ-ment for early life—that is, acidic volcanic lakes—and could pinpoint specific organisms based on their metabolisms,” said lead author Andrea Agangi, a professor in the Graduate School of International Resource Sciences at Akita University in Japan.
The findings could help scientists under-stand more about ancient life on Earth, as well as aid in the search for extraterrestrial life in the solar system. Similar volcanic lakes that formed during the wetter, volcanically active part of Mars’s early history, for example, may too have harbored life—giving astrobiologists a promising new location to look.
Identifying WonderstoneContinental land emerged during the late Archean, between 3 billion and 2.5 billion years ago. There are a number of microfossils from this period in Earth’s early history—Archean microfossils are much rarer than animal fossils—mostly in the form of stro-matolites, ancient reefs formed by cyanobac-teria. Similar evidence of ancient life on land, however, is very rare: Aside from the poten-tial rarity of terrestrial- based life, tectonic activity and the rock cycle have altered many of the terrestrial rocks from the Archean.
Some of the world’s oldest crust lies in the Kaapvaal Craton in South Africa, which dates to around 3 billion years ago and is home to the Witwatersrand Basin, a vast gold deposit that has drawn miners since the late 19th century. Here lies the Dominion Group, a sequence of mostly volcanic rocks, inter-
spersed with layers of sediment rich in pyro-phyllite, known locally as wonderstone, a fine- grained mixture of light sandstone and soft, black, carbon- rich shale.
One of the first things Agangi’s group did was identify the Dominion Group sediments as terrestrial. They analyzed samples of won-derstone taken from three sites.
Distinguishing between ancient marine and nonmarine sediments is tricky, but the positioning of volcanic rocks within the Dominion Group offered clues. When lava cools quickly in seawater, it hardens into tubular formations known as pillow struc-tures. The wonderstone is sandwiched between layers of volcanic rock that do not have pillow structures, which suggests that the lava erupted outside of the ocean, in the open air. The sandwiched sediment was deposited out of the ocean, too, the authors argued, washed down by a turbidity current to settle at the bottom of a lake.
In addition to being terrestrial in origin, the South African wonderstone has properties commonly found in hydrothermal pools in
modern volcanic environments such as the Yellowstone caldera complex. These proper-ties include high levels of aluminum- rich vanadium, arsenic, and nickel.
“These are minerals you would associate with rocks that have been heavily altered by acids,” said Eva Stüeken, a lecturer in the School of Earth and Environmental Sciences at the University of St Andrews who was not involved in the research. If the South African rocks were deposited in a marine setting, sea-water would have likely neutralized the acidity.
Taken together, evidence offered by nearby volcanic rock and mineral composition sug-gests that the sediments studied were depos-ited in an acidic lake.
Looking for LifeThe hot, low-pH waters of an acidic lake may have leached minerals from the rocks, Agangi and his colleagues suggested. This process would dissolve into water nutrients necessary for biotic life, such as phosphorus and boron, and trace metals such as copper, selenium, and zinc.
Ancient acidic lakes in volcanic cones, like this one at Ijen volcano in Indonesia, may have harbored microbial
life, a new study suggests. Credit: CEphoto, Uwe Aranas/Wikimedia, CC BY-SA 3.0 (bit . ly/ ccbysa3-0)

6 Eos // JUNE 2021
NEWS
“You have water, nutrients, energy—these are the basic components people usually look for when looking for life,” said Agangi.
To search for signs of life, the researchers used carbon isotopes. They found high ratios of lighter isotopes in the wonderstone shale. This isotopic signature suggested that the carbon is organic, the authors concluded, as it matches the signature of the modern pro-duction of methane by single- celled organ-isms known as Archaea. Today these hardy microbes are found in extreme environments such as hydrothermal vents, Antarctic lakes, and even the human digestive system.
“I would think that low- pH acidic environ-ments would be hostile to life, but these researchers found good trends of carbon iso-topes,” said Ilya Bindeman, a professor of stable isotope geochemistry at the University of Oregon who was not involved in the research.
“From all of this, we can say that it is very possible—though not conclusively proven—that methane- cycling microbes were living in volcanically influenced lakes on Earth 3.1 billion years ago,” said Alexander Brasier, a senior lecturer in geology at the University of Aberdeen not involved in the research.
Like Earth, Mars went through a wetter volcanic period during its early life, and sim-ilar acidic lakes may have formed on its sur-face. Not only does this correlation present a new ecological niche where researchers can search for past life on Mars, but also it estab-lishes the Dominion Group as a good place to study the history of both planets.
“What makes [the Dominion Group] a good analogue is that it was deposited under an anoxic atmosphere,” Stüeken said. “The entire environmental setting was probably more similar to Mars than the modern Earth. That’s very compelling.”
By Richard Kemeny (@rakemeny), Science Writer
Scientists Map Africa’s Groundwater Recharge for the First Time
The majority of people in rural Africa and a large proportion in its urban areas rely on groundwater for drinking,
hygiene, and development. The rate at which groundwater is replenished is often unknown, however, making regional water security dif-ficult to assess.
Now, for the first time, a study showing the continent’s groundwater recharge rates may help policymakers decide how much water can be drawn from aquifers without causing substantial depletion and impact on the envi-ronment.
“Groundwater recharge is like your monthly or annual income,” said Alan Mac-Donald, a hydrogeologist with the British Geological Survey who led the study. “It determines the amount of water that you can draw from your bank. If you draw more than your income, you draw from your savings.”
With an international team from France, Nigeria, South Africa, the United Kingdom, and the United States, MacDonald examined more than 300 different studies from 1970 to 2019 and developed a data set of 134 existing recharge studies for Africa to create an over-view of recharge patterns across the entire continent.
“This effort brought together extensive African knowledge with expertise from other
countries to provide information to sustain-ably develop water resources and overcome some of the most pressing issues countries often face, such as drought, deprivation, and starvation,” said Seifu Kebede Gurmessa, a hydrologist at the University of KwaZulu- Natal, South Africa, and a study coauthor.
“We estimate that the long- term ground-water recharge in Africa is approximately 15,000 cubic kilometers per decade and that recharge can occur even in arid and semiarid areas,” said MacDonald. “This is equivalent to more than half the annual rainfall in Africa, which is replenishing the groundwater every decade.”
So although long- term average rainfall generally predicts groundwater recharge, the new study uncovers distinctions at local scales due to differences in land cover. It also reveals year- to- year differences associated with vari-ability in the intensity of rainfall. The study was published in Environmental Research Letters (bit . ly/ africa - groundwater - recharge).
High Storage or High Recharge—Rarely BothThe new maps show that the majority of Afri-can countries have either high groundwater storage or high groundwater recharge—rarely both and rarely neither.
“You have water, nutrients, energy—these are the basic components people usually look for when looking for life.”
Men and women collect water at a secured borehole in Moyale, Kenya, in 2019. Water security varies across
ecosystems in Kenya, often depending on groundwater storage and recharge rates. Credit: Munyaradzi Makoni

SCIENCE NEWS BY AGU // Eos.org 7
NEWS
North African countries with little rainfall, including Algeria, Egypt, and Libya, have considerable groundwater storage but very low recharge rates. These regions are gener-ally resistant to short- term drought but vul-nerable to long- term depletion of ground-water resources. “In these areas, we can see the groundwater is not connected to current climate and that groundwater pumping slowly depletes a finite reserve,” MacDonald said.
African countries with smaller groundwa-ter storage capacity but heavier rainfall and a more reliable recharge rate include Burundi, Côte d’Ivoire, and Liberia. These regions are more vulnerable to drought but more resil-ient to long- term depletion.
Of the 50 African countries studied, five have both groundwater storage and recharge rates above the African average: Angola, the Democratic Republic of the Congo, Guinea- Bissau, Nigeria, and the Republic of the Congo. These nations are generally consid-ered water secure.
Five of the countries studied have storage and recharge rates below the African average: Eritrea, Eswatini, Lesotho, Zambia, and Zim-babwe. These nations are often water insecure and vulnerable to short- term climate hazards and long- term depletion. Extra care is needed
to monitor and develop their groundwater resources, the study authors said.
Calculating Groundwater RechargeArnaud Sterckx, a researcher at the Interna-tional Groundwater Resources Assessment Centre in the Netherlands, explained that estimating groundwater recharge is difficult.
MacDonald said his team estimated recharge from multiple data sets, including long- term variations in groundwater level measured in aquifers, the concentrations of modern gases found in groundwater, ratios of different water isotopes, and the differences in chloride concentrations between rainfall and groundwater. The researchers also had to find a method to scale up the individual stud-ies to provide maps that were useful for all of Africa.
“The authors of this study have been cau-tious, and they kept only the most reliable estimates available in Africa,” Sterckx said.
Considering the uncertainty inherent in the measurements, the results of this study are meant not to directly guide local or national applications but to provide an interesting pic-ture of how resilient groundwater resources are across the continent, Sterckx said.
Eelco Lukas, director of the Institute for Groundwater Studies, University of the Free
State, in South Africa, agreed that although the creation of a recharge map for the whole of Africa has merit when it comes to the avail-ability of groundwater, “the recharge is not uniform for the whole of each country, as it is highly dependent on the rainfall amount and intensity and on the geology.” Lukas was not involved in the new study.
Next Steps“This study calls for more local- scale studies of groundwater recharge, and it calls for decisionmakers at all levels to adopt appro-priate groundwater management measures in line with the storage versus recharge prop-erties of aquifers,” Sterckx said.
For MacDonald, the study provides a useful quantification of what researchers think long- term average groundwater recharge is. However, he admitted, it doesn’t tell much about the reasons for high and low recharge, particularly at a catchment scale. To answer such questions, he said, several studies are now looking at “what local factors affect groundwater recharge, for example, forest cover and agricultural practice.”
By Munyaradzi Makoni ( @MunyaWaMakoni), Science Writer
Read it first onArticles are published on Eos.org before they appear in the magazine.
Visit Eos.org daily for the latest news and perspectives.
Reimagining STEM Workforce Development as a Braided Riverbit.ly/Eos-STEM-workforce
A Massive Methane Reservoir Is Lurking Beneath the Seabit.ly/Eos-methane
Geomojis Translate Geoscience Across Any Languagebit.ly/Eos-geomojis
Zooming In on Small Fires in Africabit.ly/Eos-Africa-fires
Rethinking Oceanic Overturning in the Nordic Seasbit.ly/Eos-overturning
What Happens When Six Sea Turtles Go Roguebit.ly/Eos-rogue-turtles

8 Eos // JUNE 2021
NEWS
A Reminder of a Desert’s Past, Before Dingo Removal
A s ecologist Mike Letnic trudged up and down the red- orange dunes of the Strzelecki Desert in South Aus-
tralia, he noticed that his boots sank deep into the sand and his equipment was more likely to be covered in sand when he was on the northern side of what’s known as the Dingo Fence. A 5, 614- kilometer barrier, the fence stretches across southeastern Australia and protects sheep flocks from the wild dogs—dingoes are plentiful on the northern side of the fence, but very few exist on the southern side.
The contrast intrigued Letnic, a professor at the University of New South Wales’s Centre for Ecosystem Science, and he has studied how the fence and the resulting lack of din-goes on the southern side have affected the desert’s ecosystem. He has documented, for example, how the absence of the large pred-ator has allowed populations of feral cats and foxes to explode, which, in turn, has deci-mated native herbivore populations. One such creature is the hopping mouse, which eats the seeds and seedlings of the native shrubbery.
In a 2018 study, Letnic and a coauthor flew drones over the dunes and found that the absence of mice on the southern side had allowed shrubs to grow more densely, which altered the dunes’ shapes and sizes (bit . ly/ trophic - cascades). The denser shrub coverage slows the velocity of the wind at ground level and causes the dunes to become taller and the sand to be more compact. “It’s a very windy place,” Letnic said. “And once the shrubs get to a certain density, the wind actually skates across the top of the shrubs.”
Abundant Kangaroos Gobble Up GrassLetnic’s new study showed that the fence has also caused a different vegetation change—one that is so pronounced it can be seen from space (bit . ly/ removal - predator). Using 32 years’ worth of satellite imagery, Letnic and Adrian Fisher, a remote sensing special-ist at the University of New South Wales, found that native grasses on the southern side had poorer long- term growth than veg-etation on the northern side.
The difference stems from the overabun-dance of kangaroos on the southern side, which has put tremendous grazing pressure on the native grasses. Kangaroos are the pre-ferred prey of dingoes. Letnic and Fisher compared the satellite images with weather data and found that after rainfall, vegetation
grew on both sides of the fence, but it did not grow as much or cover more land on the southern side.
“It’s a desert, so there’s not much growth in plants. And then it will rain occasionally, and you get a lot of growth, and that’s when we were able to see the difference in the graz-ing pressure on each side of the fence,” said Fisher.
Reminder of the Past LandscapeMost dingo research has been conducted using either drone imagery or field studies, but the U.S. Geological Survey Landsat pro-
gram has allowed for further analyses. A NASA satellite has been taking continuous images of the Dingo Fence since 1988. Satel-lite imagery, often used for crop or forest studies, traditionally looks strictly at photo-synthesizing vegetation, such as plants, trees, and grass.
Here Fisher used a model to factor in non-green vegetation, like shrubs, dry grasses, twigs, branches, and leaf litter. According to Fisher, considering nongreen vegetation was necessary for an arid ecosystem. “Australia is mostly desert, and so to look at all that land-scape, we need a good way to factor in the brown vegetation, the dry stuff,” he said.
The dynamics of how humans alter the food webs of ecosystems is an urgent topic and one that’s becoming even more difficult to predict because of climate change, said Sinéad Crotty, an ecologist and project man-ager at the Yale Carbon Containment Lab who was not involved in the new study. Letnic and Fisher, she said, “do a great job of utilizing multiple lines of evidence across spatial scales to demonstrate the effect of removing apex predators on vegetation and geomor-phology.”
Letnic and Fisher said their work is an important reminder of how the area’s ecosys-tem used to be—one that’s easy to overlook because the fence has been around since the 1880s. “In Australia, we’ve been pretty suc-cessful at suppressing dingo numbers for more than 100 years,” said Letnic. “And that memory of what it was like before is nearly gone.”
By Nancy Averett (@nancyaverett), Science Writer
“In Australia, we’ve been pretty successful at suppressing dingo numbers for more than 100 years. And that memory of what it was like before is nearly gone.”
A dingo trots by the Dingo Fence. Credit: Nicholas
Chu

SCIENCE NEWS BY AGU // Eos.org 9
NEWS
Rare Wintertime Thunderstorms Recorded over the U.S. Gulf Coast
A s fierce winter storms pummeled much of North America in February, lightning danced over the Gulf Coast.
“Thundersnow”—thunderstorm activity during a winter snowstorm—is rare, and researchers are now poring over data from the Houston Lightning Mapping Array network to better understand this elusive phenome-non.
Most thunderstorms tend to occur in spring and summer, and atmospheric sci-ence provides an explanation: Warmer con-ditions are conducive to lifting parcels of air, which transport water vapor upward. This convection is critical to the formation of thunderclouds, said Tim Logan, an atmo-spheric scientist at Texas A&M University in College Station. “Storms need energy to develop.”
A Boost from the ColdBecause temperatures are lower in winter, there’s less convection, and that makes for far fewer wintertime thunderstorms. But they’re possible if something physically forces air upward, said Logan. Advancing cold fronts can provide that boost because they tend to shove air out of the way—and upward—via dis-placement, he said. “Winter season thunder-storms need dynamical lifting.”
When a winter storm spawns a thunder-storm, the result is known as thundersnow or thundersleet, depending on the type of pre-cipitation. Wintertime thunderstorms are
elusive, said Christopher Schultz, an atmo-spheric scientist at Marshall Space Flight Center in Huntsville, Ala., not involved in the new research. A “very conservative” guess is that they’re about a thousand times less com-mon than their warm- weather counterparts, he said. “It’s a rare phenomenon.”
But earlier this year, Logan and his col-leagues had the opportunity to study thun-dersnow occurring nearly in their own back-yards.
Thundersnow in the Lone Star StateStarting just before Valentine’s Day, winter storms swept over a wide swath of North America. They dumped record amounts of snow and ice, sent temperatures plummeting to unprecedented lows, and left hundreds of thousands of people without power. The Houston area was hit on 14 and 15 February. Logan, who was working from home in Col-lege Station, monitored reports of thunder-snow in the area. “There was lightning observed within 5 miles of my house,” he said.
Logan and his colleagues are keen to understand how wintertime thunderstorms differ from the storms more commonly observed in the spring and summer. To do so, they’ve been analyzing data from the Hous-ton Lightning Mapping Array.
The network, directed by Logan, consists of 12 solar- powered sensors spread around Houston. Antennas detect radio frequency emissions from lightning, and the measure-
ments are then fed into software that pin-points the altitude, latitude, and longitude of the lightning. “It gives you a three- dimensional view of where the lightning ini-tiates and how it moves through the atmo-sphere,” said Logan.
Logan and his collaborators focused on 835 flashes of lightning detected during the Feb-ruary storms by the Houston Lightning Map-ping Array. The researchers found that the flashes originated at an altitude of roughly 9 kilometers. That’s surprisingly high, said Logan. Ice, a critical ingredient of thunder-storms, would have been forming at lower than normal altitudes during February’s storm, so it would make sense if lightning were also occurring at lower altitudes. “It was actually at what’s considered a normal height,” said Logan.
More Positive in the WinterThe team also investigated the thunder-storms’ electrical nature using data from both the Houston Lightning Mapping Array net-work and the National Lightning Detection Network. Lightning can be classified as neg-ative or positive: Negative lightning, by far the most common, transfers a net negative charge. Positive lightning does the opposite.
Logan and his colleagues found that roughly 30% of the lightning they analyzed was positive. That’s significantly higher than the normal fraction of about 10%. However, that result isn’t wholly surprising, Logan and his collaborators suggested. Wintertime thunderclouds often contain more ice crystals than usual, and those particles tend to take on a positive charge.
But there are downsides to positive light-ning. It’s more likely to be associated with severe weather like hail and tornadoes, and it also often delivers a stronger punch, said Schultz. “Positive flashes are generally more powerful.”
The Houston Lightning Mapping Array—and other lightning detection networks—will continue to stand sentry for thundersnow. It’s a fascinating phenomenon, said Logan, but it’s unlikely to be spotted again over the Houston area this century. “To see something like this here over the Gulf Coast is a treat.”
By Katherine Kornei (@KatherineKornei), Science Writer
Thundersnow is rare; this artist’s rendering shows a thunderstorm occurring during a winter snowstorm. Credit:
Jeremy Bishop and Todd Helmenstine

10 Eos // JUNE 2021
NEWS
Aerosol Scientists Try to Clear the Air About COVID- 19 Transmission
A tmospheric chemist Kimberly Prather wants her day job back.
As a professor at Scripps Institu-tion of Oceanography, she usually spends her days looking at pollution in the ocean and its effects on human health. But since the out-break of the coronavirus, Prather has dedi-cated herself to understanding the airborne spread of the virus.
Because the airborne droplets that spread coronavirus are chemically similar to sea spray, Prather was well poised to pivot her work. “We’re very interested in viruses and bacteria that start out in the ocean, but when waves crash, they get enriched into the atmo-sphere,” explained Prather.
“I’ve been contacted by people in the health care industry, including dental assis-tants,” she said. “They’re desperate.”
In response, Prather and others created an open- source document of frequently asked questions (FAQ) about airborne spread (bit . ly/ faq - aerosol - transmission). They’ve written letters to officials and called out medical sci-ence that they say is at odds with physics. They’ve also repurposed their labs or work spaces for COVID-19 research, like one scien-tist in Colorado who repurposed instruments from his team’s airplane and coughed on them in the lab.
“I’ve gotten a ridiculous number of thank- you letters from all over the world saying how many lives I’ve saved,” Prather said. “That’s nice, but…I want this thing to end.”
Help to the Public, Appeals to Agencies“We think that unfortunately, [the World Health Organization (WHO)] and CDC are being too slow to accept aerosol transmission,
hence the need for these FAQs directly from the scientists” begins the 62-page document written by Prather and 11 other scientists. The FAQ sheet answers questions on ride- sharing, elevators, masks, and air filtration, among other topics.
The WHO and Centers for Disease Control and Prevention (CDC) did not respond to requests for comment on this article.
In February, Prather and 11 colleagues sent a letter warning the Biden administration that workers in health care, food processing, security, and prison populations aren’t ade-quately protected from the virus (bit . ly/ letter - biden).
They claim that although the CDC has acknowledged that people could contract COVID-19 through inhaling particles, it has been slow to update its guidance. In April 2021, the WHO changed its guidance to acknowledge that transmission of the virus can occur through inhalation at distances more than 6 feet from its source. The CDC fol-lowed suit one week later.
At Odds with Basic ScienceMedical textbooks have descriptions of virus transmission that are not consistent with
basic physics, said Jose- Luis Jimenez, an atmospheric chemist at the University of Col-orado Boulder.
The WHO says that big droplets of human exhalations are the primary mode of trans-mission for the virus. The agency calls them respiratory droplets and defines them as any-thing larger than 5 micrometers, about the size of a red blood cell.
But WHO’s definition of respiratory drop-lets is wrong, said Jimenez. Cloud droplets are around 20 micrometers, and they don’t fall to the ground, he said. That means that droplets of larger size could be airborne longer than the WHO acknowledges.
“It’s just absurd,” said Jimenez. “This still is the official statement of the WHO, and they have refused to correct it for a year.”
The break in identifying transmission droplets should be 100 micrometers, argued Prather in a letter published in Science last year (bit . ly/ airborne - transmission - letter). The argument isn’t just semantics: It directly affects safety measures.
But CDC and WHO guidelines emphasize that most transmission is passed through close contact, not airborne transmission. “The balance of attention must be shifted to
Because the airborne droplets that spread coronavirus are chemically similar to sea spray, Prather was well poised to pivot her work.
Kim Prather stands next to a wave tank in San Diego, Calif. She pivoted from pollution research to COVID-19 last
year. “It’s so frustrating because we’re all scrambling…. We cannot keep doing this,” she said. Credit: UC San
Diego Publications/Erik Jepsen

SCIENCE NEWS BY AGU // Eos.org 11
NEWS
Making the Universe Blurrier
W hen the European Southern Observatory (ESO) selected Cerro Paranal, a 2, 664- meter- high
mountain in Chile’s Atacama Desert, to host its Very Large Telescope (VLT), it touted the location as “the best continental site known in the world for optical astronomical obser-vations, both in terms of number of clear nights and stability of the atmosphere above.”
Cerro Paranal remains one of the best observing sites on the planet. Yet it’s not as pristine as it was at the time of its selection, in 1990. A study released last September showed that temperatures have climbed and jet streams are more troublesome, making the VLT’s observations of distant stars, gal-axies, and exoplanets a tiny bit fuzzier (bit . ly/ astronomical - observations).
“The main motivation of this study was to raise awareness among the astronomical community that climate change is impacting the quality of observations,” said Faustine Cantalloube, an astrophysicist at Laboratoire d’Astrophysique de Marseille and lead author of the report.
“As atmospheric conditions influence the astronomical measurements, it is important to be prepared for any changes in the cli-mate,” agreed Susanne Crewell, a coauthor and a professor of meteorology at the Uni-versity of Cologne. These preparations are
especially relevant as ESO is building the Extremely Large Telescope (ELT), a 39-meter behemoth that will be the largest telescope in the world, on a peak about 20 kilometers from Paranal. ELT is expected to be a “workhorse” for decades, said Crewell.
Astronomers are just beginning to consider how those changes are affecting observations or might affect them in the years ahead. Potential problems include reduced “see-ing”—the clarity with which a telescope observes the universe—plus greater risk from forest fires and a need for more power- consuming air- conditioning to keep tele-scope mirrors cool.
“Long term, we’re concerned about how climate change will affect the viability of cer-tain observing sites,” such as Paranal and others in Chile, said Travis Rector, an astron-omer at the University of Alaska Anchorage and chair of the American Astronomical Soci-ety Sustainability Committee. “Will we enjoy the same quality observing conditions many years down the road?”
Evaluating the VLT as a Test CaseParanal is the first observatory for which sci-entists have studied that question. Can-talloube’s team compiled more than 3 decades of weather observations made at the site, including temperature, wind speed and direc-tion, and humidity. The study also included a
protecting against airborne transmission,” Prather wrote.
Concerned for FamilyAt the start of the pandemic, atmospheric scientist Jorgen Jensen repurposed a sensor from an aircraft that his team uses to mea-sure cloud particles. He wanted to know how humidity in the air affected aerosols, so he exhaled and coughed onto microscope slides in his lab at the National Center for Atmo-spheric Research in Boulder, Colo. He then tweaked the humidity in the air surrounding the slides.
He found that humidity affects the sizes of droplets over time. Droplets from human exhalations are salty, and drying them out makes them increasingly uninhabitable to viruses. But if a droplet dries out completely, the virus can remain viable for much longer.
While doing his research, Jensen thinks of his father, living in a poorly ventilated nursing home in Denmark. He wants to know what humidity range nursing homes could use to minimize person- to- person transmission. He said his preliminary research shows that there is a Goldilocks spot of air—not too humid and not too dry—that could thwart airborne viruses faster.
Jensen partnered with aerobiology engi-neer Mark Hernandez at the University of Colorado Boulder to test the viability of virus particles.
“We were all baffled that [public health agencies] didn’t take aerosol transmission as being more serious to begin with,” said Jen-son.
“There were people who were hammering that, and they were not being heard for many, many months,” said Jenson. “And my per-sonal feeling is that was a tragedy.”
By Jenessa Duncombe (@jrdscience), Staff Writer
Medical textbooks have descriptions of virus transmission that are not consistent with basic physics.
The domes of the Very Large Telescope and smaller telescopes are reflected in the aftermath of an infrequent
rainfall atop Mount Paranal in Chile. Climate change could make the telescopes’ observations a little less crisp.
Credit: A. Ghizzi Panizza/ESO, CC BY 4.0 (bit . ly/ ccby4-0)

12 Eos // JUNE 2021
NEWS
reanalysis of information from two European climate databases that date to 1980.
The records revealed a temperature increase of 1.5°C over the study period. The change is important because the VLT’s domes are cooled during the day to match the expected ambient temperature at sunset. If the telescope mirrors are warmer than the air temperature, heat waves ripple above them like those above a desert highway on a sum-mer afternoon, blurring the view.
The VLT’s current cooling system was designed to maintain a temperature no higher than 16°C because when the telescopes were designed, sunset temperatures exceeded that value roughly 10% of the time. In 2020, though, they did so roughly 25% of the time. As a result, Cantalloube said, air- conditioning capacity, as well as cooling capacity for many telescope instruments, will need to be increased in the future as the temperature continues to rise (perhaps by up to 4°C by the end of the century, according to some mod-els).
The study also found that changes in the jet stream cause periodic increases in wind shear in the upper troposphere, particularly during El Niño events, creating a blurring effect known as a wind- driven halo. The VLT’s four component 8-meter telescopes are equipped with adaptive optics, which use lasers and deformable mirrors to create and focus an artificial “guide star” in the upper atmosphere, compensating for most of the blurring. But turbulence from the wind shear is making it tougher for the system to work. That’s particularly troublesome for efforts to image exoplanets, which require both high resolution and high contrast, the study noted.
“Monitoring meteorological parameters on site is one way to make the best out of the telescope time, thanks to an adapted observ-ing schedule,” said Cantalloube. For example, “some observations are less affected by humidity and some more, so if we know in
advance the atmospheric humidity content, we can schedule observing programs accord-ingly.”
Cantalloube said her team is continuing to evaluate the Paranal data while expanding its work to study conditions at major obser-vatories in Hawaii, Arizona, and the Canary Islands.
Threats on the GroundRector noted that climate challenges aren’t limited to the quality of the view. “The most obvious threat is forest fires,” he said. “In recent years we’ve seen several major fires come near observatories, especially in Cali-fornia.”
Last August, for example, a fire on Califor-nia’s Mount Hamilton burned one residence and damaged others at Lick Observatory and barely missed some of the telescopes. A month later, another fire threatened Mount Wilson Observatory, near Pasadena. Siding Spring Observatory in Australia lost its lodge for visiting astronomers and other structures in 2013, and the country’s Mount Stromlo Observatory lost several major telescopes in 2003.
“Many observatories are remote, they have limited access, so defending them against
forest fires can be very difficult,” Rector said. “They’re the most vivid threat.”
Proposed SolutionsOne proposed solution to climate change could actually cause more problems for astronomy, Rector said. Some climate scien-tists have suggested that injecting aerosols into the upper atmosphere could reduce the amount of sunlight reaching the surface, per-haps reversing the warming trend. However, that would also reduce the amount of light from stars and other astronomical objects reaching Earth’s surface. “Aerosols are prob-ably best saved as a last- ditch Hail Mary,” Rector said.
Cantalloube and others said that astrono-mers also must reduce their own carbon foot-print by reducing travel, cutting back their reliance on energy- guzzling supercomputers, and taking other steps. “Technological devel-opments can cope with these subtle effects due to climate change,” Cantalloube said. “I’m more concerned about the way round: How can we make our observatories greener?”
By Damond Benningfield (damond5916@ att .net), Science Writer
“Long term, we’re concerned about how climate change will affect the viability of certain observing sites.”
The aftermath of a fire at Siding Spring Observatory in Australia shows up as brown in this false- color image
from NASA’s Terra satellite. The observatory forms a small patch of red speckled with white dots near the center.
The image was snapped in February 2013, 3 weeks after the fire. Credit: NASA Earth Observatory image by
Jesse Allen; data from NASA/METI/ERSDAC/JAROS, U.S./Japan ASTER Science Team

SCIENCE NEWS BY AGU // Eos.org 13
NEWS
Oak Trees Offer a Continuous Climate Record for Central Europe
For decades, the widths of tree rings have offered a precise window into past regional environmental conditions. The
oxygen (δ18O) and carbon (δ13C) isotopic sig-natures of wood cellulose provide an addi-tional, nuanced environmental fingerprint that records subtle shifts in temperature, precipitation, and drought conditions.
Despite the power of this approach, ques-tions remain as to how tree species, site ele-vation, tree age, and preservation techniques could affect the stable isotopic values cap-tured in the individual samples.
“To reconstruct multimillennial chronol-ogies, samples from living trees, historical timbers, archaeological remains, and sub-fossil materials have to be combined,” said Otmar Urban, a scientist at the Global Change Research Institute, Czech Academy of Sci-ences, and lead author of a new study on the value of stable isotopes in individual trees. “It could bring problems, because [this informa-tion] is usually unknown.”
To address these uncertainties, the researchers developed a new method to eval-uate the variability in the stable isotopic record in individual trees. They leveraged a multimillennial tree ring chronology estab-lished in the Czech Republic consisting of about 4,000 core samples obtained from liv-ing oaks and historical timbers of the same species. This database provides a mechanism to reconstruct climate conditions across central Europe over the past 1,500 years. The results of the study were published in Dendro-chronologia (bit . ly/ oak - stable - isotopes).
Worst Summer Droughts in 2,000 YearsThe team obtained 21 cores from living oak trees from seven locations across the Czech regions of western Bohemia and eastern Moravia.
The samples consisted of two species of oak, English oak (Quercus robur) and sessile oak (Q. petraea), spanning the natural elevations of each species across central Europe. The researchers grouped samples at low elevation (170-250 meters above sea level) and high ele-vation (450-495 meters above sea level). In addition, samples were grouped at young (<98 years old) and old (149-198 years old) ages. Finally, the team examined how a common preservation method, polyvinyl acetate, could
affect the stable isotopic signatures preserved in the tree samples.
The researchers found that the sta-ble carbon and oxy-gen isotopic values recorded in the two oak species were similar despite dif-ferences in eleva-tion and age. They also found that the polyvinyl acetate did not bias the iso-topic results when the cellulose is suit-ably extracted.
Unlike pooled samples, which reduce cost and analysis times, nonpooled samples, like the method detailed in this study, reflect the nuance of the stable isotopic record in indi-vidual trees. The team found that older oak wood samples can be combined to improve stable isotope chronologies for long- term, isotope- based paleoclimatic reconstruc-tions.
“Such multimillennial reconstruction would be impossible without previous confir-mation of the suitability to combine separate wood samples,” said Urban. “Our data set can further be used as a part of a larger archive for regional to large- scale dendroclimatic inves-tigation with the possibility to extend the data set into the past when new samples are avail-able.”
To prove this point, the researchers applied this approach in a subsequent study in Nature Geoscience using 147 samples from living and dead European oaks (bit . ly/ recent - drought). They were able to reconstruct hydroclimate conditions in central Europe over the past 2,110 years. In particular, they found that recent summer droughts, between 2015 and 2018, have been the most severe throughout the past 2 millennia.
“The study from Otmar Urban contributes valuable methodological insights in the development of nonpooled chronologies of tree ring stable isotopes. From my personal perspective, by combining carbon and oxygen isotopes from tree rings, it is possible to infer how atmospheric humidity and the vapor pressure deficit have changed in the past,” said Hugo de Boer, an assistant professor of global environmental change at Utrecht Uni-versity, Netherlands, who did not contribute to the project. “If we can develop better chronologies of trees in terms of carbon and oxygen isotopes, we can also reconstruct changes in photosynthesis and transpiration to better understand how trees responded to more recent climate change during the 20th century.”
By Stacy Kish (@StacyWKish), Science Writer
uRead the latest news at Eos.org
“To reconstruct multimillennial chronologies, samples from living trees, historical timbers, archaeological remains, and subfossil materials have to be combined.”
Researchers studied oak samples (Q. robur and Q. petraea) taken from seven loca-
tions across the Czech Republic. Credit: Otmar Urban

14 Eos // JUNE 2021
NEWS
Sea Cucumbers: The Excremental Heroes of Coral Reef Ecosystems
On its own, a single sea cucumber may not be very impressive. But get enough of these floppy, faceless
creatures together, and they—or, more spe-cifically, their poop—can physically and bio-chemically reshape a coral reef habitat.
In a recent study, an Australian research team used drone surveys, satellite imagery, and observations of individual sea cucumbers to estimate how much poop the sea cucum-bers of Heron Island Reef produced per year (bit . ly/ sea - cucumber - poop). Heron Island Reef is part of the southern Great Barrier Reef system off the coast of Queensland, Australia.
Historically, one of the major problems scientists have faced when trying to assess the importance of sea cucumbers (and their excrement) in the reef ecosystem is the dif-ficulty in assessing just how many sea cucum-bers there are in a given area, said Jane Wil-liamson, the study’s lead author and head of the Marine Ecology Group at Macquarie Uni-versity.
Previous research used footage from boats or information collected by divers to estimate
sea cucumber numbers, said Williamson. But boats stir up the water, making it difficult to see the animals, and divers can collect infor-mation over only relatively small areas, resulting in a high degree of uncertainty when their observations were used to extrapolate the population of the entire reef.
So Williamson and her team, which included coral reef geomorphologist Stepha-nie Duce, remote sensing expert Karen Joyce, and marine ecologist Vincent Raoult, wanted to try a different method. Using images cap-tured by drones, the team surveyed sea cucumbers over tens of thousands of square meters in two different geomorphic zones (the inner and the outer reef flats). Research-ers then used satellite imagery to determine the area of each of these geomorphic zones and extrapolate the number of sea cucumbers present on the entire reef. These methods indicated that there were more than 3 million sea cucumbers on the flats surrounding Heron Island Reef.
The team also collected dozens of individ-ual sea cucumbers to observe their biotur-
bation rates—that is, how much each sea cucumber pooped in a given day. On average, each sea cucumber produced about 38 grams of poop in 24 hours. Using this information, along with their estimates of the reef’s sea cucumber population, the researchers deter-mined that on a single reef, sea cucumbers produced more than 64,000 metric tons of poop per year—more than the weight of five Eiffel Towers.
The Importance of ExcrementScientists think that all of that poop plays an important role in ecosystem health and in the biogeochemical cycles of the reef.
“Sea cucumbers can be considered like a long sausage, almost,” said Williamson. “Sediment goes in and sediment comes out…. By eating the sediment and then pooping it out again, they’re actually aerating the sedi-ment, which makes the sediment a healthier place for other animals to live, like small crabs or polychaetes, which are worms, or small mollusks that live inside the sediment in the surface layer.”
Sea cucumbers are also involved in the nitrogen cycles of the reef ecosystem. As sea cucumbers eat and excrete sediment, “they’re releasing nitrogen that’s trapped in between the sediments,” said Williamson. “So this is really important because nitrogen in partic-ular is a limiting nutrient on coral reefs…. The corals need nitrogen, and the algae need nitrogen, everything sort of locks it up really quickly when it’s available, so the sea cucum-bers are doing them a big favor in terms of the growth rate of these organisms.”
Sea cucumbers could even help protect coral reefs against one of the harmful side effects of climate change: ocean acidifica-
Sea cucumbers could even help protect coral reefs against one of the harmful side effects of climate change: ocean acidification.
By measuring how much individual sea cucumbers pooped per day and estimating the number of sea cucum-
bers on the reef using drones and satellite images, researchers determined how much poop sea cucumbers con-
tributed to the Heron Island Reef. Credit: Williamson et al., 2021, https:// doi . org/ 10.1007/ s00338 -021 - 02057-2

SCIENCE NEWS BY AGU // Eos.org 15
NEWS
Aerial Photographs Uncover Bogotá’s Indigenous Hydraulic System
The wetlands of Bogotá—humedales in Spanish—are one of the most import-ant and biodiverse ecosystems in
Colombia’s sprawling capital city. They are the backbone of many conservation efforts, as they contribute to the improvement of water and air quality, mitigate floods, and provide habitat to endemic and migratory species.
The wetlands are the product not only of the ecological conditions of the area but also of the construction and later deactivation of a complex hydraulic system established by Indigenous groups that populated the ter-ritory in the pre- Columbian period, as explained in a paper published in SPAL- Revista de Prehistoria y Arqueología by Lorena Rodrí-guez Gallo, a history professor and researcher at Universidad Nacional de Colombia ( bit . ly/ pre - Hispanic - Andes). Rodríguez’s work describes how humans have transformed this landscape over thousands of years.
Today several parts of the Bogotá region, which occupies a high- altitude plateau (aver-aging 2,550 meters) in the Colombian Andes known as the Bogotá savanna, are flooded during the rainy season every year. The region’s clay soil has low permeability, and the floods routinely damage roads, homes, and businesses.
Five hundred years ago, however, the city looked very different. Although the region surrounding Bogotá was, according to Rodrí-guez, “a highly floodable plain with difficult [natural] drainage,” Indigenous groups developed and operated a sophisticated sys-tem that used the region’s floods to their advantage.
Who Are the Muiscas?The first humans to arrive in the Bogotá region did so around 12,000 years ago. The domestication of such animals as guinea pigs and construction of hydraulic engineering projects described in Rodríguez’s analysis allowed some groups to settle permanently around 3,000 years ago. Archaeological and historical evidence suggests that the inhabi-tants of the region were culturally diverse, describing a series of densely populated set-tlements without a single political unity.
Early European colonialists, who arrived in the Bogotá region in 1537, named these pop-ulations the Muisca. It is traditionally believed that the word comes from moxiga in the Chib-
cha language, which loosely translates to “people that live in the mountain.” However, the linguistic descriptions used by the first Europeans to arrive in the area are problem-atic; they translate from their own cultural equivalences, which do not respect or reflect the reality of Indigenous groups.
In this article, we refer to the Muisca as the Indigenous groups that Europeans first encountered in the Colombian Andes, who shared a language that belongs to the Chibcha family and embody a heterogeneous cultural identity.
Channels and CamellonesAncient Bogotá’s highly complex hydraulic system consisted of channels and camellones developed by the Muisca. Channels were designed as drainage to “control high vol-umes of water that might come during a flood,” Rodríguez said, and to transport the excess water into mitigation zones, areas that were created to be cultivated and intention-ally flooded. The mitigation zones provided a habitat for animals that could be hunted by Indigenous communities.
Camellones were elevated agricultural fields. These land platforms rose approxi-mately 50-70 centimeters from the ground and were 20-50 meters long × 2-5 meters wide. “The Muisca used camellones to culti-vate crops such as corn, beans, pumpkins, and potatoes and engineered the camellones to provide suitable moisture to plant roots,” said Rodríguez.
Rodríguez’s work documenting the engi-neered landscape of pre- Colombian Bogotá challenges the idea that Indigenous groups
tion. “The oceans are becoming more acidic, which means that the calcium carbonate which makes the skeletons of the corals and things is less available and in some cases is actually dissolving off the corals.” In addition to releasing nitrogen, sea cucumbers also increase the availability of calcium carbonate as they eat their way through the sediment, said Williamson. “So for the sea cucumbers to release more calcium carbonate that’s been trapped in the sediments into the environ-ment that the corals and other animals can use is super important.”
“These little sausages are playing a really key role that people just don’t think about,” said Williamson.
Steven Purcell, a marine scientist at South-ern Cross University in Lismore, N.S.W., who was not associated with the study, said that more than 70 countries harvest sea cucum-bers. Because these animals are of great eco-logical value, it’s important to keep tabs on their numbers to make sure they’re not being overharvested. He noted that drone surveil-lance techniques like the one used in this paper could also be used to assess populations of other exploited shallow- water reef species, like giant clams.
By Hannah Thomasy (@HannahThomasy), Science Writer
Black sea cucumbers play an important role in coral
reef ecosystems. Credit: Jane Williamson
The connection between the Muisca worldview and natural systems is more of a dialectical, interdependent relationship found in ancient Indigenous systems around the world.

16 Eos // JUNE 2021
NEWS
lived in equilibrium with nature. In fact, she said, the connection is more of a dialectical, interdependent relationship, where the Indigenous groups and nature were part of a give and take that benefited humans and encouraged biodiversity as they transformed their environment.
The Muisca hydraulic system, for instance, was a response to the constant floods of the region. The system let the Muisca produce large quantities of food and create mitigation zones with high biodiversity: terrestrial and wetland plants, as well as animals such as white- tailed deer, birds, fish, ducks, and freshwater mollusks. This relationship is not unique and can be found in ancient Indige-nous systems around the world. The Ma’dan people, for example, made elevated platforms for cultivation in the southern wetlands of Iraq.
The Hydraulic System’s DisappearanceThe Bogotá region’s channels and camellones are hardly mentioned in historical records. Rodríguez thinks that the “deactivation of the hydraulic system was practically imme-diate,” following the cultural genocide of the Muisca and their loss of access to land. This idea is supported by Carl Langebaek, an anthropologist, archaeologist, and professor at Universidad de Los Andes in Bogotá.
Langebaek said that Conquistadors had nei-ther the cultural background nor the interest to understand or care about the Indigenous hydraulic system.
“[Europeans] came from a society that depended on livestock and seasonal crops, like olives and viticulture,” Langebaek said. The Muisca hydraulic system, dependent on floods and multiple crops, was unknown to them. The first Europeans also “had an extractive mentality to get rich fast with gold.”
The Interdisciplinary Method: Aerial Photos and InterpretationDuring the second half of the 20th century, Bogotá grew rapidly and chaotically, changing from a city of 700,000 inhabitants in the 1950s to the more than 7 million today. This rapid expansion destroyed many ecosystems
and archaeological sites. To overcome this difficulty in studying the region’s geographic past, Rodríguez used aerial photos of Bogotá taken from the 1930s to the 1950s and com-pared them with archaeological and historical sources.
These photos “give the impression that camellones resemble a chessboard, con-structed in different directions,” said Rodrí-guez. She was able to contextualize, document, and detect the “transformation processes of the same human group through time” thanks to the geographic and historic differences in the color of the soil and vegetation, identify-ing erosion and human presence from the vestiges of camellones.
Rodríguez complemented aerial photo-graph analysis with interdisciplinary meth-ods. She used paleobotany sources to describe “how the ecological space was at that point in time…and what they were cultivating.”
Historical cartography and toponymy (the study of place names and naming) also pro-vided essential resources. For example, Rodrí-guez found that in Soacha, a municipality in the Bogotá metropolitan area, “there were a lot of words derived from chucua, the Chibcha word meaning lagoon. There is no lagoon in the area, but the word appears so much that it suggests that in the past there was a lagoon or a mitigation zone.”
Langebaek agreed: “The value of water is very significant.” All the sacred sites in the Bogotá area are “related to water, while other Muisca sacred sites from other regions are related to the Sun. They understood the importance of water for their survival, an important lesson for us today.”
The mitigation zones created by the Muisca to protect their crops from floods became wetlands supporting some of the most diverse ecosystems in the city. However, since the 1940s, Bogotá has lost more than 90% of these wetland areas as the city contin-ues to build new roads and residential areas to keep up with population growth and other challenges.
Developing Bogotá’s humedales has sparked fierce debate in the city. Developers cite the need for increased infrastructure to support the local economy, whereas grass-roots movements are working to preserve ecosystem benefits that are the product of a long history of human- influenced landscape change.
By Camilo Garzón ( @CamiloAGarzonC) and Santiago Flórez ( @rflorezsantiago), Science Writers
A visual reconstruction informed by Lorena Rodríguez Gallo’s research shows how the Bogotá savanna looked
about 600 years ago, when the Muisca people modified the wetland environment. The savanna is illustrated
from the observation point of Cerro de Suba (Suba’s Hill) overlooking the area where the Bogotá River runs
through the landscape, from the northwest to the southeast. Credit: Santiago Flórez
The Bogotá region’s channels and camellones are hardly mentioned in historical records.

SCIENCE NEWS BY AGU // Eos.org 17
NEWS
A Space Hurricane Spotted Above the Polar Cap
The spectacular light displays of the polar aurorae are no great mystery. When solar wind hits Earth’s magne-
tosphere, electrons rain down into the upper atmosphere, which causes bursts of color across the sky in high- latitude belts around the planet. But aurorae over the north polar cap, especially during periods when the solar wind is quiet, have puzzled space weather experts for decades. Now an international team of researchers has found an explana-tion: space hurricanes.
In a recent paper published in Nature Com-munications (bit . ly/ space - hurricane), the team described an event that looked remark-ably like lower atmosphere storms that slam into our coasts. On 20 August 2014, arms of plasma more than 965 kilometers (600 miles) across spun around a calm center, raining electrons into Earth’s upper atmosphere above the magnetic North Pole.
“The whole concept is surprising and exciting,” said Larry Lyons, a professor at the University of California, Los Angeles and one of the study’s authors. “I never conceived of the possibility that there would be a spiral- shaped, circular bright aurora in the middle of the polar cap.”
Lead author Qing-He Zhang of Shandong University and his students spent 2 years combing through thousands of auroral images taken by the low- Earth- orbiting satellites of the U.S. Defense Meteorological Satellite Pro-gram. They found dozens of cases of what looked like space hurricanes in images col-lected over the past 15 years, but none was as clear as the one that occurred in 2014 and lasted about 8 hours.
John Foster, a research scientist at the Massachusetts Institute of Technology’s Hay-stack Observatory who was not involved in the study, recalls spotting a similar phenom-enon over the pole some 50 years ago, but experts couldn’t explain what they were see-ing at the time. “In those days, the spacecraft, even though there were a lot of them up in space, they did not have the kind of instru-mentation that you would need to really understand what was taking place,” he said. “What makes this event really special is the wide variety of instrumentation that was available in space to look at the characteris-tics of this phenomenon.”
Zhang’s team was able to combine a wealth of aurora, plasma, and magnetic field data from the space hurricane with a powerful 3D simulation to reproduce the space hurri-cane using the solar wind and magnetic field conditions on that day in 2014.
A Tale of Two Types of HurricanesFoster cautions that it’s important to remem-ber that although the space hurricane may look a lot like its tropospheric counterpart, the forces driving the two types of hurricanes are totally different.
Space hurricanes are also much less of a risk to humans than the more familiar vari-ety, although “we do have some evidence that it did cause strong and unusual scintil-lations,” Zhang said. “These are fluctuations of radio waves passing through the iono-sphere.” These disturbances could garble sat-ellite communications or navigation. The storm may also heat up and expand the upper atmosphere, changing the density of the
highly trafficked region; the change could cause drag and alter the orbit of any satellites or pieces of space debris that pass through it, according to Lyons.
“If you want to know where the space sta-tion is going to be a few hours from now, you have to know what kind of an atmosphere it’s going through,” Lyons explains.
For Zhang and his colleagues, the identifi-cation of the space hurricane is only the beginning.
“There are several open questions remain-ing,” he said. “What controls the rotation of space hurricanes? Are these space storms seasonal like their tropical counterparts, per-haps limited to the summer when the Earth’s magnetic dipole is tilted just the right way? And can space hurricanes be forecasted like weather events on Earth?”
By Kate Wheeling (@katewheeling), Science Writer
Researchers have spotted a space hurricane above Earth’s polar cap, in which a shower of electrons (shown here in orange) rains down into the upper atmosphere, creating
a tight, spiral- shaped aurora. Credit: Qing-He Zhang
“I never conceived of the possibility that there would be a spiral- shaped, circular bright aurora in the middle of the polar cap.”

18 Eos // JUNE 2021
OPINION
How Scientists Can Engage to Solve the Climate Crisis
On 14 September 2020, the U.S. Gulf Coast, still reeling from the after-math of category 4 Hurricane Laura,
was bracing for the landfall of Hurricane Sally. At the same time, active fires burned across more than 5 million acres in the United States, choking the air in the West with haz-ardous smoke. To scientists, it is clear that climate change is worsening these hazards by, for example, intensifying hurricane rain-fall and creating hotter and drier conditions that accelerate fire spread [Emanuel, 2017; Littell et al., 2016]. Yet despite being sur-rounded by clear signs of the climate crisis, President Donald Trump that day dismissively remarked to California officials, “I don’t think science knows, actually.”
The gap between scientific consensus and political action on the unfolding climate crisis can be frustrating. For decades, geoscientists have been warning about the dangers of unmitigated climate change. Synthesis doc-uments, such as the Intergovernmental Panel on Climate Change’s (IPCC) 2018 Global Warming of 1.5°C report, express the consen-sus scientific view that immediate and dra-matic reductions in carbon emissions are needed to avert climate catastrophe. But
translating this alarm into tangible policy action can feel daunting when some political leaders continue to deny the science of cli-mate change. To counter this pessimism, I offer here a motivating example of science- driven work by the U.S. Congress to solve the climate crisis, and I describe ways in which scientists can be partners in advancing cli-mate action.
The Select Committee on the Climate CrisisIn early 2019, the U.S. House of Representa-tives established the Select Committee on the Climate Crisis. Unlike a permanent House committee, the Select Committee does not have jurisdiction over a specific area of legis-lative development. Instead, the Select Com-mittee is empowered to develop comprehen-sive recommendations for policies on climate mitigation, adaptation, and science that cut across the full legislative purview of Con-gress.
Throughout its existence, Select Committee members and staff have consulted with a wide range of stakeholders, including community and business leaders, policy experts, activists, and scientists. The committee has held more
than 20 hearings and 6 roundtables, reviewed hundreds of responses to a request for infor-mation (RFI), and engaged in over a thousand stakeholder meetings and calls.
Science and scientists played an important role throughout this process. For example, an April 2019 hearing titled “Solving the Cli-mate Crisis: Drawing Down Carbon and Building Up the American Economy” fea-tured a scientist author of the Global Warming of 1.5°C report, and scientists served as wit-nesses for other Select Committee hearings as well. RFI responses included a joint state-ment from scientific societies on needs for climate change research and assessment. Committee staff also engaged directly in meetings and calls with scientists and scien-tific groups, both for their specific subject matter expertise and for their insight into approaches for developing science- informed climate policy.
An Action Plan for Solving the Climate CrisisUsing the input it received from stakeholders, in June 2020 the majority staff of the Select Committee issued a comprehensive climate report, Solving the Climate Crisis: The Congres-
House Speaker Nancy Pelosi ( D- Calif.) speaks in front of the U.S. Capitol Building in Washington, D.C., during the June 2020 release of the majority staff report of the Select
Committee on the Climate Crisis. Pelosi is joined by Rep. Kathy Castor ( D- Fla.; in white), chair of the committee. Credit: Raleigh L. Martin

SCIENCE NEWS BY AGU // Eos.org 19
OPINION
sional Action Plan for a Clean Energy Economy and a Healthy, Resilient, and Just America. Across more than 500 pages, the report provides leg-islative recommendations addressing many aspects of climate policy, including infra-structure, clean energy, environmental jus-tice, public health, natural resources, and resilience. Though focused on the U.S. federal role, the report also acknowledges the impor-tance of partnerships with local, state, and international efforts.
It is beyond the scope of this article to describe the full breadth of Select Committee report recommendations, so I focus here on two primary areas of climate science recom-mendations: (1) the need for strong and sus-tained federal investment in foundational climate research and education and (2) the need to organize and ramp up federal efforts, in coordination with nonfederal partners, to develop and deploy actionable climate risk information to guide planning decisions in response to the mounting impacts of climate change.
On foundational climate science, Select Committee recommendations to Congress include the following:
• Bolster federal support for climate assessments, including IPCC reports and National Climate Assessments by the U.S. Global Change Research Program, and ensure that these assessments factor in high-warming climate scenarios
• Strengthen and sustain federal funding for basic research to understand Earth’s cli-mate system and the impacts of climate change on intersecting natural and human systems
• Increase federal investments in climate literacy, education, and workforce training, prioritizing broadening participation in sci-ence, technology, engineering, and mathe-matics for underrepresented groups
• Strengthen scientific integrity policies at federal agencies and ensure that the best available science informs federal decisions
• Support careful study of governance frameworks for atmospheric climate inter-vention, also known as “geoengineering”
On applied climate risk information, Select Committee recommendations include the following:
• Create a federal Climate Risk Informa-tion Service to maintain a centralized portal for decisionmakers to access trustworthy planning- scale climate risk projections to guide planning decisions
• Establish mechanisms for coordination among federal and nonfederal partners to ensure that a Climate Risk Information Ser-
vice leverages the full capacities of academia, the private sector, and existing federal pro-grams and that it works closely with federal efforts to support state, local, tribal, and ter-ritorial climate adaptation planning
• Strengthen investments in monitoring, mapping, and forecasting climate- influenced hazards
• Ensure that high- quality projections of future climate change are made available to guide the development of codes and stan-dards that inform long- term infrastructure and land use planning
• Direct federal agencies to account for the full value of climate mitigation and adaptation project alternatives in benefit- cost analyses (BCA), including full consideration of nature- based approaches, and to invest in research to improve the scientific basis for BCA
These and other recommendations in the report provide a high- level road map for needed policies to address climate change. In many cases, members introduced bills in the 116th Congress that would advance Select Committee report recommendations; some of these bills have been reintroduced in the current 117th Congress. Legislative packages recently passed by the House of Representa-tives, such as the Moving Forward Act and the Clean Economy Jobs and Innovation Act, also advance these ideas. However, many Select Committee policy ideas have not yet been translated into legislation. Engagement with outside stakeholders, including scien-tists, will play a key role in how Select Com-mittee policy recommendations become reality.
Scientist Engagement in Climate PolicyThe active engagement of scientists will be critical for thoughtful advancement of cli-mate policy, including of policy recommen-dations put forward in the Select Committee majority staff report. Here are three sugges-tions for how scientists can engage in the cli-mate policy process:
First, be proactive in reaching out to elected officials and decisionmakers to com-
municate policy- relevant scientific findings. Consider connecting not only with federal- level officials but also with state and local officials on the front lines of the climate cri-sis. Many scientific societies, including AGU, organize activities to facilitate this outreach.
Second, when communicating with poli-cymakers, work from points of mutual inter-est. If you are planning to meet with elected officials or their staff, educate yourself on who they represent and what their interests are. Connecting with them on common expe-riences can be especially beneficial. Speaking collectively on behalf of organizations and partnerships that include a diverse coalition of stakeholders can help to amplify your message.
Third, consider career paths in policy. Science policy fellowships are a great oppor-tunity for immersion in the policy process, either as a temporary experience or as a full career pivot. My own career has been trans-formed through policy fellowships orga-nized and sponsored by the American Asso-ciation for the Advancement of Science (AAAS) and the American Geosciences Insti-tute (AGI).
Ultimately, solving the climate crisis will require an all- hands- on- deck approach that includes government, academia, business, activists, scientists, and community groups working together on local to international solutions. Regardless of your career stage and scientific specialization, there are many ways, large and small, to engage, that can harness your passions and expertise to advance climate action. Though the climate policy process can often seem frustratingly messy and divisive, there’s no alternative but to dive in, engage as you are able, and learn iteratively from the experience.
AcknowledgmentsThe views expressed here do not necessarily represent those of AGI or AAAS.
ReferencesEmanuel, K. (2017), Assessing the present and future probability of
Hurricane Harvey’s rainfall, Proc. Natl. Acad. Sci. U. S. A., 114(48), 12, 681– 12,684, https:// doi .org/ 10 .1073/ pnas .1716222114.
Littell, J. S., et al. (2016), A review of the relationships between drought and forest fire in the United States, Global Change Biol., 22, 2, 353– 2,369, https:// doi .org/ 10 .1111/ gcb .13275.
By Raleigh L. Martin (@raleighlmartin), 2019– 2020 AGI William L. Fisher Congressional Geo-science Fellow and professional staff with the Select Committee on the Climate Crisis
uRead the article at bit.ly/Eos-engage
Science policy fellowships are a great opportunity for immersion in the policy process.

Opp
osite
Pag
e: X
XX
XX
X; T
his
Page
: Top
Rig
ht: X
XX
X
COMMUNITY FORESTS PREPARE
FOR CLIMATE CHANGE
20 Eos // JUNE 2021

Opp
osite
Pag
e: X
XX
XX
X; T
his
Page
: Top
Rig
ht: X
XX
X
SCIENCE NEWS BY AGU // Eos.org 21
Cities across the United States are feeling the heat as they struggle to integrate climate science into on-the-ground decisionmaking regarding urban tree planting and management.
By Courtney L. Peterson, Leslie A. Brandt, Emile H. Elias, and Sarah R. Hurteau
Msh
ake/
Dep
ositp
hoto
s.co
m

22 Eos // JUNE 2021
Trees benefit residents in communities around the world by mitigating pollution and other environ-mental impacts of contemporary society and by broadly improving livability in cities and towns.
However, many locales are feeling the heat as urban, or community, forests—defined by the U.S. Forest Service as “the aggregate of all public and private vegetation and green space within a community that pro-vide a myriad of environmental, health and economic benefits”—struggle against a multitude of stressors stemming from cli-mate change.
An Underappreciated ResourceForest pests and diseases are expanding their ranges, for example, and heat, mega-droughts, and shifts in the amounts and timing of precipitation are changing water
availability—all contributing to a looming urban tree crisis. To maintain the many benefits that community forests provide for people and wildlife, we urgently need clear strategies to respond to such challenges and to help community forest managers adapt these unique and valuable ecosystems to current and anticipated effects of climate change.
The importance of urban trees is often overlooked. In the United States, commu-nity forests save an estimated $18.3 billion annually by providing ecosystem services like air and water pollution removal, carbon sequestration, carbon storage, energy sav-ings for buildings, heat reduction, and avoided stormwater runoff [Nowak and Greenfield, 2018]. But urban trees do more than provide these ecological necessities.
Urban trees provide human health bene-fits by promoting increased physical activ-ity, improved mental health, enhanced community walkability, and improved safety of public transit [Nesbitt et al., 2017]. For example, attractive trees and landscap-
ing encourage increased social interaction among neighbors and create a sense of ownership and safety.
An estimated 12,000 people—mostly from vulnerable populations, such as socio-economically marginalized groups, the elderly, and people with existing health conditions that are worsened by high heat—die globally each year from heat- related causes, and this number will increase to an estimated 260,000 deaths over the next 30 years. Heat also exacerbates chronic health issues such as diabetes, heart dis-ease, lung disease, and obesity [Ebi et al., 2018]. Studies show that trees can provide localized cooling of up to 2.8°C because of increased shade and effects on evapotrans-piration, mitigating health risks during extreme heat [McDonald et al., 2016]. Yet urban trees are not equitably distributed across neighborhoods or communities. Those most vulnerable to and at risk from high heat, who are most in need of the eco-logical and human health benefits commu-nity forests provide, are least likely to have
Volunteers plant trees in Albuquerque, N.M. The Nature Conservancy engages youth in nature- based solutions to promote health and climate resilience in New Mexico’s
most populous urban area. Credit: Roberto Rosales
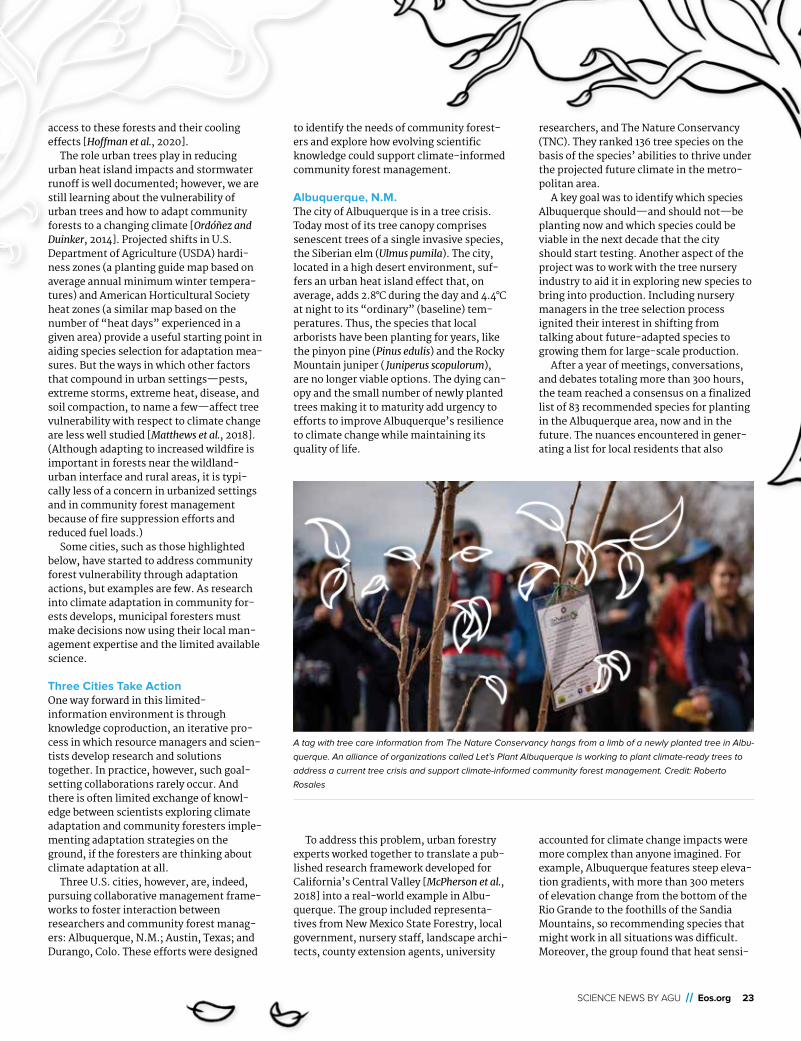
SCIENCE NEWS BY AGU // Eos.org 23
access to these forests and their cooling effects [Hoffman et al., 2020].
The role urban trees play in reducing urban heat island impacts and stormwater runoff is well documented; however, we are still learning about the vulnerability of urban trees and how to adapt community forests to a changing climate [Ordóñez and Duinker, 2014]. Projected shifts in U.S. Department of Agriculture (USDA) hardi-ness zones (a planting guide map based on average annual minimum winter tempera-tures) and American Horticultural Society heat zones (a similar map based on the number of “heat days” experienced in a given area) provide a useful starting point in aiding species selection for adaptation mea-sures. But the ways in which other factors that compound in urban settings—pests, extreme storms, extreme heat, disease, and soil compaction, to name a few—affect tree vulnerability with respect to climate change are less well studied [Matthews et al., 2018]. (Although adapting to increased wildfire is important in forests near the wildland- urban interface and rural areas, it is typi-cally less of a concern in urbanized settings and in community forest management because of fire suppression efforts and reduced fuel loads.)
Some cities, such as those highlighted below, have started to address community forest vulnerability through adaptation actions, but examples are few. As research into climate adaptation in community for-ests develops, municipal foresters must make decisions now using their local man-agement expertise and the limited available science.
Three Cities Take ActionOne way forward in this limited- information environment is through knowledge coproduction, an iterative pro-cess in which resource managers and scien-tists develop research and solutions together. In practice, however, such goal- setting collaborations rarely occur. And there is often limited exchange of knowl-edge between scientists exploring climate adaptation and community foresters imple-menting adaptation strategies on the ground, if the foresters are thinking about climate adaptation at all.
Three U.S. cities, however, are, indeed, pursuing collaborative management frame-works to foster interaction between researchers and community forest manag-ers: Albuquerque, N.M.; Austin, Texas; and Durango, Colo. These efforts were designed
to identify the needs of community forest-ers and explore how evolving scientific knowledge could support climate- informed community forest management.
Albuquerque, N.M.The city of Albuquerque is in a tree crisis. Today most of its tree canopy comprises senescent trees of a single invasive species, the Siberian elm (Ulmus pumila). The city, located in a high desert environment, suf-fers an urban heat island effect that, on average, adds 2.8°C during the day and 4.4°C at night to its “ordinary” (baseline) tem-peratures. Thus, the species that local arborists have been planting for years, like the pinyon pine (Pinus edulis) and the Rocky Mountain juniper ( Juniperus scopulorum), are no longer viable options. The dying can-opy and the small number of newly planted trees making it to maturity add urgency to efforts to improve Albuquerque’s resilience to climate change while maintaining its quality of life.
To address this problem, urban forestry experts worked together to translate a pub-lished research framework developed for California’s Central Valley [McPherson et al., 2018] into a real- world example in Albu-querque. The group included representa-tives from New Mexico State Forestry, local government, nursery staff, landscape archi-tects, county extension agents, university
researchers, and The Nature Conservancy (TNC). They ranked 136 tree species on the basis of the species’ abilities to thrive under the projected future climate in the metro-politan area.
A key goal was to identify which species Albuquerque should—and should not—be planting now and which species could be viable in the next decade that the city should start testing. Another aspect of the project was to work with the tree nursery industry to aid it in exploring new species to bring into production. Including nursery managers in the tree selection process ignited their interest in shifting from talking about future- adapted species to growing them for large- scale production.
After a year of meetings, conversations, and debates totaling more than 300 hours, the team reached a consensus on a finalized list of 83 recommended species for planting in the Albuquerque area, now and in the future. The nuances encountered in gener-ating a list for local residents that also
accounted for climate change impacts were more complex than anyone imagined. For example, Albuquerque features steep eleva-tion gradients, with more than 300 meters of elevation change from the bottom of the Rio Grande to the foothills of the Sandia Mountains, so recommending species that might work in all situations was difficult. Moreover, the group found that heat sensi-
A tag with tree care information from The Nature Conservancy hangs from a limb of a newly planted tree in Albu-
querque. An alliance of organizations called Let’s Plant Albuquerque is working to plant climate- ready trees to
address a current tree crisis and support climate- informed community forest management. Credit: Roberto
Rosales

24 Eos // JUNE 2021
tivity for the species of interest was less well documented than their cold hardiness.
In the end, this process generated buzz in the community about climate change impacts, about how tree selection at the metropolitan area scale involves more plan-ning than simply choosing something to plant in one’s front yard, and about chal-lenges in caring for aging trees. Albuquer-que is now in the process of creating a video series to encourage community stewardship of local trees. And the local water authority is exploring the idea of building a demon-stration site to showcase climate- ready trees so local residents can see for them-selves which species they like and to moni-tor which trees will really thrive in Albu-querque’s arid climate.
Austin, TexasThe city of Austin has developed a citywide urban forest vulnerability assessment that is informing adaptation actions in both developed and natural areas. This central
Texas city, located in a transition zone between the deserts of the American South-west and the wetlands of the Southeast, lost about 10% of its tree canopy following extreme drought in 2011. This canopy loss led the urban forestry community there to seek opportunities to reduce future risks.
Austin was one of the first cities in the country to complete its first full 5- year cycle of urban forest inventory and analysis
[Nowak et al., 2016], providing an estimate of the species distribution across the city. The forest inventory, along with emerging concern regarding future climate risks, prompted stakeholders in Austin to seek support for climate change adaptation solutions.
Partners from the city of Austin, the Northern Institute of Applied Climate Sci-ence (NIACS), the USDA Forest Service, the USDA Southern Plains and Northern Forests Climate Hubs, Texas A&M Forest Service, and TNC came together to assess the vul-nerability of the city’s urban forests and to develop adaptation strategies.
The group based its work on the Urban Forestry Climate Change Response Frame-work, developed originally for Chicago and now expanded to other regions. This frame-work has three main components: regional vulnerability assessments, local- scale assessments, and planning to help local managers adapt to the effects of climate change [Brandt et al., 2016, 2017].
The partners assessed the vulnerability of 105 urban tree species present in Austin’s developed and natural areas. They put the regional results into a more localized con-text by assessing the vulnerability of spe-cific natural community types and neigh-borhoods using a collaborative expert panel approach [Brandt et al., 2017]. Upon com-pleting the assessment, urban forest and natural area managers from Austin and sur-
rounding areas attended a 2- day workshop based on the NIACS Adaptation Workbook, a five- step process for incorporating adapta-tion strategies that address key climate change vulnerabilities while aligning with locally specific goals and objectives [Swan-ston et al., 2016] to develop actionable adap-tation projects.
One outcome of the workshop was an adaptation project for the Balcones Canyon-lands Preserve. This 12, 000- hectare (30, 000- acre) system of habitats northwest of the city is jointly managed by the city of Austin and Travis County and has in recent years experienced intense heat and drought and erosion by heavy rains. The adaptation project involves selecting more heat- and drought- adapted native trees for south fac-ing slopes, building berms of organic matter to capture rainwater, and making use of larger trees to shade vulnerable seedlings. The city of Austin is currently working to incorporate information from this effort into other projects, such as revising its rec-ommended planting lists and developing interactive tools to visualize vulnerable areas on the landscape.
Durango, Colo.In Colorado, the city of Durango, a high- altitude town of warm, dry summers and cold, snowy winters, is working with local partners to test the suitability of tree spe-cies native to areas farther south, anticipat-ing that Durango’s climate will become increasingly warm and arid. The collabora-tion also looks to arm local resource manag-ers with new information and resources and to improve the adaptive capacity of local community forests.
Urban forestry stakeholders, including the city’s Parks and Recreation Department and Sustainability Division and the USDA Southwest Climate Hub, also used the NIACS Adaptation Workbook process [Swanston et al., 2016] to identify climate change impacts and potential adaptation strategies that can be integrated into real- world, on- the- ground forest management projects.
The resulting Durango Community Forest Management Plan aims to increase diversity in tree species and ages to improve the long- term health of the city’s community forests. The plan includes a provision to plant enough trees to keep pace with com-munity growth and to offset tree removal. However, climate change impacts pose sig-nificant challenges to meeting these local community forest management goals [U.S.
At Balcones Canyonlands Preserve, managed by the city of Austin, adaptation measures to reduce erosion and
increase water infiltration and storage include the use of berms and swales, application of organic matter and
mulch, and seeding with native grasses and heat- adapted woody plants. Credit: Leslie Brandt

SCIENCE NEWS BY AGU // Eos.org 25
Global Climate Change Research Program, 2017]. Such impacts include an increase in mean temperatures of about 1.1° C– 5.6°C, a projected 10%- 20% increase in heavy- precipitation events, and a lengthening of its frost- free season—from late March through early November to early March through late November (that is, changing from USDA hardiness zone 6b to 7b)—by the end of the century.
Durango’s community forestry managers have realized that tree- planting efforts must consider future- adapted species and that business- as- usual management prac-tices will not be enough to maintain a diverse forest canopy that provides social and economic benefits to the city under projected future climate conditions.
In addition, local partners in the city, including the city of Durango, the Durango Botanical Society, and the Mountain Studies Institute, are revising tree and shrub guides to include species like Pinus ponderosa geno-types from southern seed zones that are adapted to warmer future climates and using seed mixtures to account for uncer-tainty. The partners are also working with the city parks department and schools to test the suitability of such future- adapted tree species.
A Work in ProgressThese three examples highlight how practi-tioners and scientists are beginning to work collaboratively to implement urban forest climate change adaptation strategies. Many other communities can similarly pursue climate- adaptive strategies, building on the examples from Albuquerque, Austin, and Durango and creating partnerships between practitioners and scientists. However, even in communities where such work has begun, many scientific knowledge gaps and uncertainties about future- adapted urban tree species still need to be addressed to adequately support climate- informed planting.
For example, practitioners need more information about the heat and drought tol-erance of specific urban tree species and how habitats of urban trees will shift in the future. They also need to know more about how urban forest disturbances, such as pests, pathogens, and extreme storms, may uniquely affect different species and culti-vars planted in urban settings.
Nursery managers and growers need to be more involved in the discussions around future tree needs, as cities are often limited in what they can plant on the basis of what
is locally available. Offering a new tree spe-cies commercially requires a long lead time to establish production. Particularly for cit-ies along the southern U.S. border, growers may need to explore source seed collections internationally to keep pace with the geo-graphical shift of increasing temperatures and drought.
One rapid solution to support community forest climate adaptation is to learn from similar cities that have already begun the process. Documenting urban forestry suc-cesses and failures in peer- to- peer knowl-edge exchange is one means of sharing the knowledge. A three- pronged approach of filling scientific knowledge gaps, supporting knowledge exchange, and capitalizing on collaborative practitioner- scientist adapta-tion efforts will help communities maintain
the ecological, social, and economic benefits that their forests provide and ensure stew-ardship of the forests into the future.
AcknowledgmentsWe are grateful to Rachel Swanteson- Franz, Jennifer Dann, Judith Phillips, Marisa Thompson, Carol Baca, Will Pockman, Joran Viers, George Koch, Andrew Lisignoli, Amos Arber, and Hunter Ten Broeck for their con-siderable contributions of time and knowl-edge to the Albuquerque climate-ready tree project and the National Fish and Wildlife Foundation and The Nature Conservancy for funding this project. We thank the USDA Office of the Chief Economist for supporting the workshop and Imogen Ainsworth, Scott McClain, and Greg Sykes for their contribu-tion of leadership, expertise, and time to the climate change adaptation workshop and ongoing efforts in Durango, Colo. We thank Austin project contributors, Caitlin Rottler, Wendy Gordon, Stacey Clark, Lisa O’Don-nell, April Rose, Annamarie Rutledge, and Emily King, as well as the municipal forest-
ers, park district representatives, natural areas managers, and others who partici-pated in the vulnerability and adaptation workshops. This project was supported by the city of Austin, The Nature Conservancy, Texas A&M Forest Service, and the USDA Northern Forests and Southern Plains Cli-mate Hubs.
ReferencesBrandt, L., et al. (2016), A framework for adapting urban forests
to climate change, Environ. Sci. Policy, 66, 393– 402, https:// doi .org/ 10 .1016/ j .envsci .2016 .06 .005.
Brandt, L. A., et al. (2017), Integrating science and management to assess forest ecosystem vulnerability to climate change, J. For., 115(3), 212– 221, https:// doi .org/ 10 .5849/ jof. 15- 147.
Ebi, K. L., et al. (2018), Human health, in Fourth National Climate Assessment, vol. 2, Impacts, Risks, and Adaptation in the United States, edited by D. R. Reidmiller et al., pp. 539– 571, U.S. Global Change Res. Program, Washington, D.C., https:// doi .org/ 10 .7930/ NCA4 .2018 .CH14.
Hoffman, J. S., et al. (2020), The effects of historical housing poli-cies on resident exposure to intra- urban heat: A study of 108 US urban areas, Climate, 8(1), 12, https:// doi .org/ 10 .3390/ cli8010012.
Matthews, S. N., et al. (2018), Assessing potential climate change pressures across the conterminous United States: Mapping plant hardiness zones, heat zones, growing degree days, and cumulative drought severity throughout this century, Rep. RMAP- NRS- 9, 31 pp., North. Res. Stn., For. Serv., U.S. Dep. of Agric., Newtown Square, Pa., https:// doi .org/ 10 .2737/ NRS- RMAP- 9.
McDonald, R., et al. (2016), Planting healthy air: A global analysis of the role of urban trees in addressing particulate matter pollu-tion and extreme heat, 136 pp., The Nat. Conservancy, Arlington, Va., www .nature .org/ healthyair.
McPherson, E. G., A. M. Berry, and N. S. van Doorn (2018), Perfor-mance testing to identify climate- ready trees, Urban For. Urban Greening, 29, 28– 39, https:// doi .org/ 10 .1016/j .ufug .2017 .09 .003.
Nesbitt, L., et al. (2017), The social and economic value of cultural ecosystem services provided by urban forests in North America: A review and suggestions for future research, Urban For. Urban Greening, 25, 103– 111, https:// doi .org/ 10 .1016/ j .ufug .2017 .05 .005.
Nowak, D. J., and E. J. Greenfield (2018), US urban forest statis-tics, values, and projections, J. For., 116(2), 164– 177, https:// doi .org/ 10 .1093/ jofore/ fvx004.
Nowak, D. J., et al. (2016), Austin’s urban forest, 2014, Resour. Bull. NRS- 100, 55 pp., North. Res. Stn., For. Serv., U.S. Dep. of Agric., Newtown Square, Pa., https:// doi .org/ 10 .2737/ NRS- RB- 100.
Ordóñez, C., and P. N. Duinker (2014), Assessing the vulnerability of urban forests to climate change, Environ. Rev., 22(3), 311– 321, https:// doi .org/ 10 .1139/ er- 2013- 0078.
Swanston, C. W., et al. (2016), Forest Adaptation Resources: Climate Change Tools and Approaches for Land Managers, 2nd ed., Gen. Tech. Rep. NRS- GTR- 87- 2, 161 pp., North. Res. Stn., For. Serv., U.S. Dep. of Agric., Newtown Square, Pa., http:// dx.doi .org/ 10 .2737/ NRS- GTR- 87- 2.
U.S. Global Climate Change Research Program (2017), Fourth National Climate Assessment, vol. 1, Climate Science Special Report, edited by D. J. Wuebbles et al., 470 pp., Washington, D.C., https:// doi .org/ 10 .7930/ J0J964J6.
Author InformationCourtney L. Peterson (courtney .peterson @colostate .edu), Forest and Rangeland Stew-ardship Department, Colorado State Univer-sity, Fort Collins; Leslie A. Brandt, Northern Institute of Applied Climate Science, Northern Research Station, Forest Service, USDA, St. Paul, Minn.; Emile H. Elias, Southwest Climate Hub, Agricultural Research Service, USDA, Las Cruces, N.M.; and Sarah R. Hurteau, The Nature Conservancy, Albuquerque, N.M.
uRead the article at bit .ly/Eos-community-forests
There is often limited exchange of knowledge
between scientists exploring climate adaptation and
community foresters implementing adaptation strategies on the ground.

26 Eos // JUNE 2021
Dav
id L
. Rya
n/Th
e B
osto
n G
lobe
via
Get
ty Im
ages

SCIENCE NEWS BY AGU // Eos.org 27
Dav
id L
. Rya
n/Th
e B
osto
n G
lobe
via
Get
ty Im
ages
THE SURPRISING ROOT OF THE
MASSACHUSETTS FIGHT AGAINST
NATURAL GASTree lovers are hunting down
the cause of arboreal deaths—and may remake the regional energy system in the process.
By Jenessa Duncombe

28 Eos // JUNE 2021
Ania Camargo’s Beacon Hill street in Boston was once so beautiful that Logan International Airport hung a photo of it on a welcome banner.
It had all the makings of a postcard: Cobblestone alleys. Red brick row houses. Flickering gas lamps. Tall, broad- leaved linden trees.
Camargo misses the way her street used to look. Although the gas lamps in the his-
toric photo are still standing, many of the trees have grown ill and died in the past several years. “I do not believe a photo of our street as it looks, with sickly trees and baby trees, would be in the airport now.”
Camargo and many others blame natural gas leaks as a driving cause of the trees’ afflictions. The city has thousands of gas leaks in old, cracked pipes and joints under sidewalks and streets.
Today Massachusetts has some of the most progressive laws in the country regu-lating gas leaks. They’re largely thanks to a powerful coalition of organizations and researchers called Gas Leaks Allies taking the state’s energy system to task. The movement to plug leaks has gained steam over the past 2 decades and evolved into a campaign to quit natural gas altogether.
Although the campaign has broad ambi-tions, the movement started with protect-ing community trees.
The fight in Boston over the future of nat-ural gas is also playing out across the coun-try. Municipalities like San Francisco have banned gas in new buildings, and President Joe Biden singled out gas leaks in an execu-tive order on combating climate change.
The United States and other countries have just decades to drastically slash emis-sions to avoid the worst consequences of climate change, according to a 2018 report by the Intergovernmental Panel on Climate Change. The United States is the second- largest producer of methane emissions in the world, behind Russia. These emissions primarily come from leaking oil and from gas production and distribution. To get off gas, whole cities must be redone from the inside out.
“It’s like trying to fix the airplane while you’re in flight,” said Nathan G. Phillips, a tree biologist at Boston University and activist who advocates for moving to renew-able fuels.
The WhistleblowerThe way a tree dies from natural gas poison-ing is essentially like drowning: It suffo-cates, unable to access oxygen. Tree roots need oxygen to convert nutrients into energy in a process called respiration. While leaves use carbon dioxide to photosynthe-size and give back oxygen to our atmo-sphere, roots take the sugars produced by photosynthesis and break them down into energy using oxygen.
But if the roots can’t access oxygen—if natural gas fills up tiny soil pores instead—the tree can’t break down its food. Even mature trees can survive for only so long.
Whereas a person might drown in mere minutes, a tree dies over many months, first losing its leaves, then ceding its twigs and branches, and finally sprouting unusual shoots and leaves directly from its trunk in a final desperate gasp to survive.
Bob Ackley, a member of Gas Leaks Allies, has seen it all. “I’ve got pictures of hun-dreds, thousands of trees, gone.” He began work with gas companies in 1979 after leav-ing college for a lucrative summer job scout-ing gas leaks. That job stretched into a career of surveying gas leaks for utilities up and down the Eastern Seaboard. “I was
In 2010, Ania Camargo’s tree-lined street was so picturesque a springtime view was used to welcome visitors at Boston’s Logan Airport. By the winter of 2020–2011, 11 of
the trees had died, a phenomenon Camargo associated with the natural gas leaks consistently reported and repaired on the street. “There are other factors that also affect
trees, like salt and lack of water, but I believe the reason they have been dying so quickly on our street is because of the gas.” Credit: Ania Camargo
THE CITY HAS THOUSANDS OF UNCHECKED NATURAL GAS LEAKS FROM OLD, CRACKED PIPES.

SCIENCE NEWS BY AGU // Eos.org 29
taught how to find the leaks by looking at the grass, trees, and shrubs.” It was a sure sign of a leak, he said, if trees were losing leaves irregularly, the grass was brown, or other vegetation was dying.
Ackley said the utilities told him to look for dying trees as a clue to gas leaks, but they refused to publicly acknowledge that gas leaks harm trees. He also worried about the human health effects of gas leaks inside people’s homes.
Spurred by growing concerns about leaks and the fact that working as a contractor was getting “laborious,” Ackley left the gas industry in 2006. Ever since, he’s been try-ing to get the word out.
He’s reached out to legal groups, mayors, city councils, and environmental organiza-tions in Massachusetts and across the country to warn them of the dangers of leaking gas. Eventually, Ackley founded Gas Safety USA, a Southborough, Mass.– based company with a mission to protect trees and human health from leaking gas.
Gas companies in the area have repeat-edly emphasized that they are doing the best they can to protect human lives and property.
Spokesperson Christine Milligan of National Grid, one of the two major gas companies operating in Boston, said, “while safety is our biggest priority, we do also work to minimize the impacts of our system on the environment, and we include environ-mental considerations in our main replace-ment planning and in our repair programs.”
National Grid declined to comment on whether the company was responsible for the loss of street trees, and the other pri-mary gas company operating in Boston, Eversource, did not respond to a request for comment on this story.
An AllianceOne November day in 2010, Phillips was out for a walk with his son in his Newton neigh-borhood. The pair happened upon Ackley, who was probing the soil around trees along the street to test for methane.
The men struck up a conversation, and Phillips realized that looking at leaks was an important research and policy question that happened to cross over deeply into his work.
Gas leaks are a threat to the state’s cli-mate goals, after all: Natural gas is com-posed almost entirely of methane, a green-house gas 84 times more effective at warming Earth’s surface than carbon diox-ide. Despite this, it has been touted as a bridge to renewables.
Phillips asked Ackley whether he’d be interested in working together, using the cavity ring-down spectroscopy instrument on top of Phillips’s university building. Phillips and his colleagues used the instru-ment to survey carbon dioxide and other gases—including methane—24 hours a day, and he thought it could be a perfect, high-precision device for finding gas leaks. If leaks were as ubiquitous as Ackley claimed they were, then use of natural gas in Boston might not be as efficient as people had thought.
A year after they met, the pair took a newly designed roving gas spec-trometer and drove more than a thou-sand kilometers of Boston’s streets in Ackley’s Pontiac, measuring meth-ane as they went.
They found a whopping 3,356 leaks across the city. Most were small, but one methane reading reached 14 times higher than background levels.
While most gas leaks aren’t dangerous, they can be costly: Customers pay for lost natural gas through their rates. Scientist Kathryn McKain estimated that a little less
Natural gas can leak from crumbling cast-iron pipes under the city’s streets. Cast- iron and steel pipes and joints
are more than 50 years old in some places in Boston, and their sealants are cracking. Credit: Audrey Schulman
Sign up for AGUniverseAGUniverse offers the latest news, events and announcements from AGU and the broader Earth and space sciences community via email every Thursday.
Sign up for your free AGUniverse e-newsletter today!
agu.org/aguniverse

30 Eos // JUNE 2021
than 3% of natural gas delivered to eastern Massachusetts leaks into the atmosphere, equivalent to about $90 million per year (using 2012 and 2013 gas prices).
Ackley and Phillips published their work in the journal Environmental Pollution, and it had an immediate impact (bit.ly/urban -pipeline-leaks-boston). The next year, the Massachusetts state legislature passed a law requiring utilities to disclose a list of their leaks each year for all to see.
Their work continued in the years follow-ing, gaining national media coverage and catching the attention of local climate
groups and activists, including Camargo, who volunteered with the climate advocacy group Mothers Out Front. The success of Phillips and Ackley’s work “galvanized us to be more focused on what we were going to be working on and really to get into gas leaks,” she said.
In 2015, Camargo formed Gas Leaks Allies, a coalition of more than 25 organiza-tions and researchers with a mission to slash methane emissions from the state’s natural gas distribution system. The group included mostly local organizations—arborists, climate activists, and social
justice groups—as well as national partners like the Sierra Club and Clean Water Action.
Three StrikesIn the years that followed, the collaboration between scientists and activists in the state deepened, much of it at the hands of, or partnered with, members of Gas Leaks Allies. Three big breakthroughs have since changed the region’s understanding of gas leaks—and spurred those involved to take even more drastic action.
First, Ackley worked with Phillips and his graduate student Margaret Hendrick to hunt down environmentally damaging leaks. They found that the city could cut its methane emissions from leaks in half by just plugging the worst offenders. The results were published in Environmental Pollution in 2016 and quickly made their way to members of the state legislature (bit .ly/ fugitive-methane).
Because of the research, the Massachu-setts legislature passed a law in 2016 ordering gas companies to develop a new classification system to fix environmen-tally harmful leaks more quickly than before. In 2019, the Massachusetts Depart-ment of Public Utilities adopted the new classification, and the changes may slash the state’s emissions by approximately 4% in as little as 3 years, said Audrey Schulman, a climate activist with the Boston nonprofit the Home Energy Effi-ciency Team (HEET) and member of the Gas Leaks Allies. This reduction is roughly equivalent to stopping emissions from half of the state’s stores and businesses.
Second, a first- of- its- kind study in Chelsea, Mass., challenged an argument from supporters of natural gas—namely, that gas leaks don’t commonly harm trees. After the survey by Ackley and Phillips exposed thousands of leaks in the city in 2013, for instance, Tom Kiley, head of the Northeast Gas Association, said that while methane can damage vege-tation, it isn’t a regular occurrence. “There certainly are a lot of potential causes to the damage to trees and vegeta-tion. That can include insect infestation, vehicular damage, disease, storm dam-age, drought, salt,” he said.
Milligan of National Grid said some-thing similar when responding to ques-tions for this article: “We know there can be a variety of factors—such as restricted root growth, disease, preda-tory insects, age, exposure to road salt, motor vehicle hits, and other environmen-
Bob Ackley ( just out of frame) probes the root zone of an oak tree in Jamaica Plain in Boston. He has been
known to roam grocery stores and cross property lines with a cavity ring- down spectroscopy backpack to mea-
sure gas concentrations and anomalies. Credit: Bob Ackley
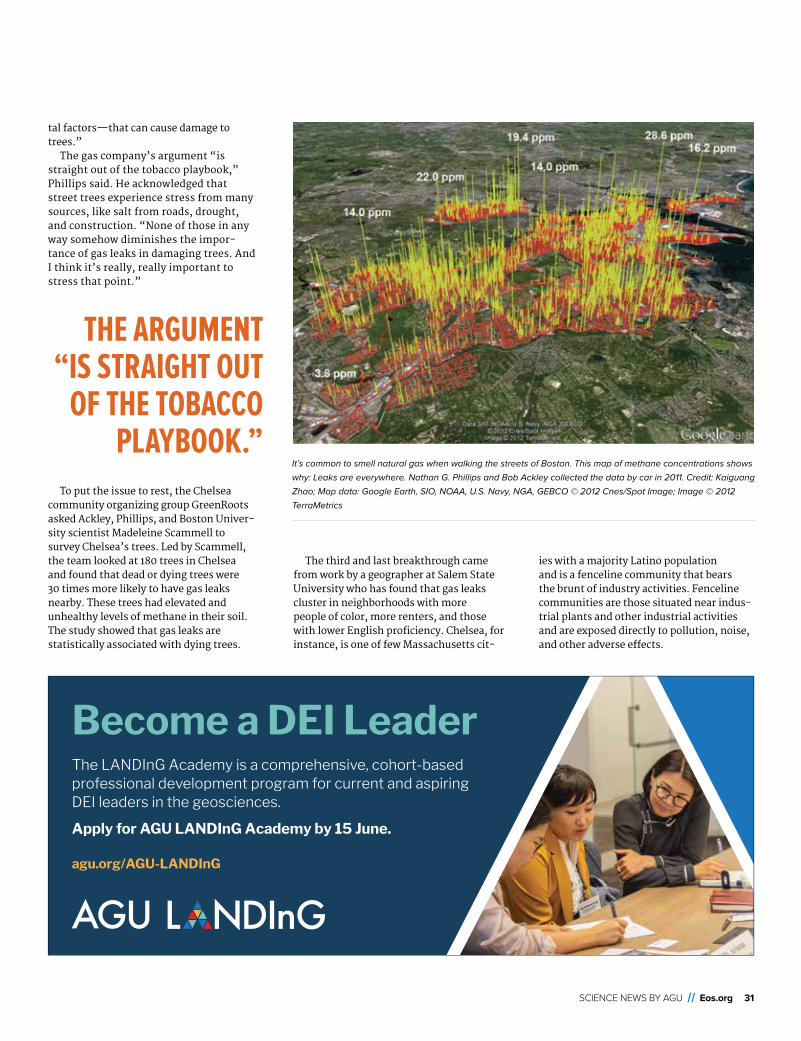
SCIENCE NEWS BY AGU // Eos.org 31
tal factors—that can cause damage to trees.”
The gas company’s argument “is straight out of the tobacco playbook,” Phillips said. He acknowledged that street trees experience stress from many sources, like salt from roads, drought, and construction. “None of those in any way somehow diminishes the impor-tance of gas leaks in damaging trees. And I think it’s really, really important to stress that point.”
To put the issue to rest, the Chelsea community organizing group GreenRoots asked Ackley, Phillips, and Boston Univer-sity scientist Madeleine Scammell to survey Chelsea’s trees. Led by Scammell, the team looked at 180 trees in Chelsea and found that dead or dying trees were 30 times more likely to have gas leaks nearby. These trees had elevated and unhealthy levels of methane in their soil. The study showed that gas leaks are statistically associated with dying trees.
The third and last breakthrough came from work by a geographer at Salem State University who has found that gas leaks cluster in neighborhoods with more people of color, more renters, and those with lower English proficiency. Chelsea, for instance, is one of few Massachusetts cit-
ies with a majority Latino population and is a fenceline community that bears the brunt of industry activities. Fenceline communities are those situated near indus-trial plants and other industrial activities and are exposed directly to pollution, noise, and other adverse effects.
It’s common to smell natural gas when walking the streets of Boston. This map of methane concentrations shows
why: Leaks are everywhere. Nathan G. Phillips and Bob Ackley collected the data by car in 2011. Credit: Kaiguang
Zhao; Map data: Google Earth, SIO, NOAA, U.S. Navy, NGA, GEBCO © 2012 Cnes/Spot Image; Image © 2012
TerraMetrics
THE ARGUMENT “IS STRAIGHT OUT
OF THE TOBACCO PLAYBOOK.”
Become a DEI LeaderThe LANDInG Academy is a comprehensive, cohort-based professional development program for current and aspiring DEI leaders in the geosciences.
Apply for AGU LANDInG Academy by 15 June.
agu.org/AGU-LANDInG

32 Eos // JUNE 2021
Marcos Luna compared census data with a public map of leaks and found that gas leaks are an unequal burden statewide. Whiter, home- owning neighborhoods have fewer leaks, and their leaks are fixed faster than those of others.
Taken together, local action by scien-tists and community organizers spurred legislation, revealed the relationship between gas leaks and tree death, and exposed the unequal burden of gas leaks on people of color and immigrants. But the next
fight was already underway—one to dismantle the state’s gas system altogether.
The Way of the ArboristEver the biologist, Phillips thinks getting off of gas is like cutting down a tree.
When arborists fell a tree, they start by trimming the uppermost
branches. Little by little, they remove each branch down the tree’s trunk. Finally, they cut the bare trunk to the ground.
Phillips said it’s important to prune nat-ural gas in the same way, starting with the thinnest branches—transitioning to electric or geothermal heating, then moving to bigger and bigger branches until the original natural gas system is gone. The leaks will go with it.
Gas Leaks Allies is now hard at work dis-cussing what should be planted in place of natural gas. Several pilot projects for geo-thermal energy are underway.
Although the most well- known use of geothermal is in Iceland, geothermal infra-structure doesn’t require being near a vol-cano. Passive geothermal technology, for example, merely uses the heat of the Earth to create a heat exchange with the surface. In Europe, many cities heat and cool their buildings with this form of geothermal heat.
In one geothermal model that Boston is considering, homes and businesses along a
In this geothermal loop, pipes carry water up and down boreholes to exchange
heat. The ground a few feet below Boston stays near 50°F year- round, so the
water pumped through the boreholes moves the ambient temperature up to the
buildings, where heat pumps can use it to heat or cool buildings. Credit: HEET
This dot graph compares the relative risks of exposure to unrepaired leaks by different groups in 2019. Black and African American people have a relative risk of 1.8 (for all
leaks), which means their exposure to unrepaired gas leaks was 1.8 times (80%) higher than that of the general population. By contrast, white people have a relative risk
of 0.8, meaning their exposure was 20% lower than that of the general population. HH=household, HU=housing unit HS=high school Credit: Marcos Luna
Bob
Ack
ley

street would share a circulation loop oper-ated by the local gas utility. Water would travel up and down 150- meter- deep bore-holes spaced every 6 meters along the street. The water would flow into custom-ers’ homes and into their heat pumps before progressing on to their neighbors.
Gas companies don’t have to go out of business with this model, said HEET’s Schulman.
Utilities could capitalize on the knowl-edge and infrastructure they already have to transition to geothermal. They could use the same pipes, keep the same customers, and use the right of way on the street.
In a feasibility study, HEET found that the proposed geothermal system would work for all but the most densely populated parts of Boston, where they’d need to dig more bore-holes. The study calculates that customers would pay less on geothermal than on gas.
The idea may be put to the test soon: In Massachusetts, two separate pilot programs are in various stages of development, and another is awaiting approval. New York and Connecticut are also piloting shared geo-thermal loops. (These are distinct from uni-versities running their own geothermal sys-tems, which several schools in the United States already do.)
The passage of sweeping climate legis-lation in March of this year will make it easier for companies to pilot projects and provides $12 million for workforce retraining. “Everything about this new law [Senate Bill 9—An Act Creating a Next-Generation Roadmap for Massachu-setts Climate Policy] makes the first pilots and scaling up from the pilots easier,” Schulman said.
Roseann Bongiovanni, executive director of GreenRoots, supports the efforts to get off of gas. But she said that the neighborhood Chelsea has more immediate concerns, like developing its own source of energy. By doing this, she said, the community can disconnect from the larger grid and still power up if there were a catastrophic event.
With more legislation in the pipeline, notably the Future of Heat bill introduced by state senator Cynthia Stone Creem (D) and state representative Lori Ehrlich (D), the work of Gas Leaks Allies continues. In 5 years, “we’d like to see people transition-ing to electric appliances with well- insulated homes,” Camargo said.
She has similar hopes for her street.Her house is already all- electric, and ide-
ally, in the next decade, the houses along her block will switch away from gas too. The beautiful historic lamps have been con-verted to electric power, and the trees grow strong and healthy.
Above all, Camargo sees the future of her street summed up in three words.
“Absolutely no leaks.”
Author InformationJenessa Duncombe (@jrdscience), Staff Writer
u Read the article at bit . ly/ Eos - Mass - gas
IN ONE GEOTHERMAL
MODEL BOSTON IS CONSIDERING, GAS COMPANIES DON’T
HAVE TO GO OUT OF BUSINESS.
Bob
Ack
ley
SCIENCE NEWS BY AGU // Eos.org 33

34 Eos // JUNE 2021
iSto
ck.c
om/p
apal
ok
Growing Equity in City Green Space
By Kimberly M. S. Cartier

SCIENCE NEWS BY AGU // Eos.org 35
iSto
ck.c
om/p
apal
ok
Growing Equity in City Green Space
City residents don’t all have the same access to the
benefits of green space. Addressing that inequity
requires community engagement at every
stage from planning to development to
management.

36 Eos // JUNE 2021
As the COVID- 19 pandemic stretched into the summer months of 2020, people around the world began to flock to outdoor green spaces in and around cities. For
some, safe and socially distanced relief from indoor lockdowns came from picnicking in nearby parks, walking through tree- shaded neighborhoods, hiking along trails through the mountains and forests, or simply get-ting fresh air in their own backyards. How-ever, not all city residents have the same access, geographically and historically, to nearby green space.
This tumultuous time has “put every-thing in really high relief about the impor-tance of having a safe green space in every neighborhood,” said Sharon Hall, who researches the intersection of ecosystem management, environmental quality, and human well- being at Arizona State Univer-sity (ASU) in Tempe. “We know that nature brings mental health benefits, physical benefits, spiritual and community connect-edness, and all sorts of recreation benefits and cultural benefits, but not all people feel the same way about nature. There are popu-lations that have really long histories, prob-lems, and challenges with nature and what nature means to them.”
Developing new urban green space—places covered with grass, trees, shrubs, or other vegetation—and infrastructure that
works with it is a priority in many cities these days. But experts agree that the solu-tion is more complicated than simply plant-ing more trees in certain spots. Done right, adding new green space in and around our cities can improve human health, revitalize ecosystems, and boost a region’s economy. Done wrong, it can worsen existing socio-economic and ecological problems or even create new ones.
Urban Forests Benefit City ResidentsGreen spaces in and around cities, collec-tively known as urban forests, can mitigate
regional and local flooding from storms, reduce water scarcity, improve air and water quality, regulate temperature, and aid soil nutrient cycling, all while sequestering car-bon.
Each tree in that forest is important. With all of their steel, asphalt, and con-crete, cities are typically a few degrees hot-ter on average than the surrounding unde-veloped land, a phenomenon known as the urban heat island effect. The same phe-nomenon occurs on a subcity scale to a degree that depends on a neighborhood’s green space. “Trees are a really important contributor to reducing heat in neighbor-hoods,” explained Fushcia- Ann Hoover, an urban hydrologist whose research is informed by environmental justice. She is a postdoctoral researcher at the National Socio- Environmental Synthesis Center in Annapolis, Md. “If a tree shades part of your home or much of your neighborhood, it’s going to be cooler than neighborhoods where you don’t have trees on the block at all.”
Moreover, “there are cultural benefits of having green space in and around your com-munity,” said John- Rob Pool, “for leisure and for recreation, which has been proven to improve health and well- being of people, and for creating streets that are more livable and more accessible.” Pool is the imple-mentation manager of Cities4Forests, an international program that helps cities con-
serve, manage, and restore their forests.
Combined, these ecosystem services “are the broader benefits of green spaces,” said Ayushi Trivedi, gender and social equity research analyst at
the World Resources Institute, “but to have a socially equitable impact, they need to be distributed in a way that all communities derive benefits from them. This is especially important for vulnerable communities—marginalized communities, low- income populations, racial minority communities—that live in neighborhoods that are more exposed to heating, stormwater flooding, and pollution.”
Where the Green Spaces AreEnvironmental justice affirms that all peo-ple have the right to land, water, and air
that are clean and safe; it requires environ-mental policy that is free from discrimina-tion and bias and is based on mutual respect and justice for all people. In assessing whether all residents of a city have equitable access to urban forests, the first question to answer is, Where does the city have green space? To tackle this on a citywide scale, most researchers either collect satellite or aerial imagery, which can measure down to only a certain scale, or conduct laborious on- the- ground surveys.
Because of the limitations of data collec-tion methods, most studies that look at the distribution of urban green space focus on just one or two cities at a time, which can hinder analysis of nationwide trends. “The amount of work it takes to generate an urban forest cover map of a single city is so incredi-ble that to do something on a larger scale can be quite difficult,” explained Shannon Lea Watkins, a public health researcher focused on health equity at the University of Iowa. “We know that the urban forest is different across the country because the ecosystem is different. So we would expect a different amount of tree canopy cover in Philadelphia than we would in Tulsa.”
Watkins and her colleagues aggregated many individual studies into meta- analyses in which they combined data from both ver-dant and sparsely forested U.S. cities. Trivedi said such methods can help researchers and city planners identify which groups benefit the most from an existing or planned green space. “What is their race? Where do they live? What [relationships] is their household composed of? If you disaggregate by demo-graphic social characteristics, then you are able to see what the social implications can be. Whether it is mapping or doing a statisti-cal study, the simple act of disaggregating your data and then seeing the patterns that come up…will be very helpful in telling you what the gaps are, who is benefiting the most, who is impacted by the costs the most, and who is taking the most risks.”
For instance, “in most studies there’s a demonstrated pattern between income and urban forest cover; that is, higher income is associated with more urban forest cover,” explained Watkins. What’s more, across the nation, race- based inequity in urban forest cover is higher on public land than on pri-vate land: Private residences with yards and tree- lined streets are more common in higher- income and predominantly white neighborhoods, and the same is true to an even greater degree for publicly owned parks and forested areas.
Done right, adding new green space in and around our cities can improve human health, revitalize ecosystems, and boost a region’s economy.

SCIENCE NEWS BY AGU // Eos.org 37
The Type of Green Space MattersAfter you know where the urban forests are, it’s helpful to analyze what form they take, because not every type of green space pro-vides nearby residents with the same bene-fits. Hoover, who coauthored a recent paper that examines race and privilege in green spaces, explained that “[historically] red-lined neighborhoods have less green space, and the green space that they have is also not as high quality.”
Parks, for example, look very different in urban areas that are more heavily policed, which tend to be neighborhoods with more people of color, more housing- insecure people, or more people with lower incomes. “If a tree is blocking the line of sight for a police camera, for example, the tree gets cut down or drastically trimmed so that it’s no longer effectively providing shade” and cooling the area, Hoover said.
In these neighborhoods, “parks aren’t necessarily made to be places where people sit or relax,” Hoover explained. “They are places to be passed through. I think that is also reflective of the way that housing- insecure individuals are criminalized and the way that cities often respond to folks who are housing insecure by wanting to prevent them from setting up camp or being able to lie down on a bench.”
Vacant lots that have been renaturalized can contribute green space, said Theodore Lim, but the benefits of that space to the surrounding community are going to be far less strategic than the benefits of a planned park. “One is developed under conditions of growth and proactive planning, and one is developed in conditions of decline and reac-tive planning,” he explained. “You’re often being opportunistic about where you can get ecosystem services.” Lim researches con-nections between land, water, infrastruc-ture, and people in sustainability planning at Virginia Polytechnic Institute and State University in Blacksburg.
“In cities, I think we need to be more expansive with how we think about green spaces,” Hall said. “Green spaces can occur anywhere…. It’s these in- between, acci-dental spaces that are sometimes the more creative ways to think about green space.”
Whether proactive or reactive, for them to benefit a community “urban green spaces should be designed on a case- by- case basis depending on the climate, the geography, the soil conditions, and the water supply needs of that area,” said Kimberly Duong, a water resources engineer and executive director at Climatepedia. “In an agricultural
region, for example, a sustainable green space would likely rely on seasonal cycles of precipitation. In a drought- prone region, a green space might also consider water reten-tion strategies.”
“I was designing a green street for [an area near the Univer-sity of California, Los Angeles] that incor-porates sustainabil-ity concepts, storm-water capture concepts, and green space concepts,” Duong said. “That region has a lot of clay soil,” which meant that installing pervious pavement wasn’t an option because water would soak through the sidewalk but not into the soil. “But for other regions with sandier soil, where water can absorb more readily, a pervious pave-ment might be a strategy for a parking lot [to capture stormwater on site].”
“There are strategies at many different geographic scales,” Duong said, from rain barrels to bioswales and from rain gardens to watersheds.
Community Ownership Is KeyGreen spaces should be intentionally designed to meet needs that the community has identified so that residents will be com-fortable using them. Such a design strategy requires engagement and dialogue between communities and project managers.
“People theoretically may have the same amount of access to acres of park space but still may not feel welcome or safe in that park space,” Lim said. “It’s about recogniz-ing that there are systemic issues that shape people’s experiences and that those have really historical roots.”
For example, “a white man might go off by himself in the woods and get all sorts of spir-itual benefits from being alone there,” Hall said. But for people who have been made to feel unwelcome or unsafe in the outdoors on the basis of their gender, race, or other aspect of their identity, she continued, that historic experience may be very different.
There are positive historical relationships to consider as well, she added. “You might think about Latinx populations who are liv-ing in the Southwest; the desert might have a different sort of meaning to them if they have history with the desert through their families and through generations.”
“When a city, for example, plans a new train station, they engage with residents
about where they should put it, who needs it, are residents going to use it if they put it here versus if they put it there,” Pool said. “ Nature- based solutions need to be treated
like all other infrastructure and deserve the same participatory approach during plan-ning stages. I think the reason that this is not as commonplace yet is that it’s an emerging field.”
Many Detroit residents, for instance, expressed the belief that the city had neglected or mismanaged the green spaces and trees in their neighborhoods. Because of that historical precedent, people were distrustful when a local nonprofit offered them free trees to plant in front of their houses. Despite wanting greener neighbor-hoods, a quarter of residents rejected the planting of new trees, anticipating that the city would neglect that green space too.
“There’s not going to be a one- size- fits- all approach” to creating new urban green spaces or for ensuring equity in those spaces, Hall said. “What’s going to be good for pollinators or people in Washington, D.C., may be very different from what’s going to work in the Sonoran Desert in Phoenix. And even still, the history of Phoe-nix is very different than the history of Albuquerque or Los Angeles.… Approaches are going to need to be locally determined, about what types of plants you’re going to plant and what’s going to be really good for the history of a community.”
What Community- Driven Solutions Look LikeLet’s say you’re a geoscientist with an idea of how to improve an urban neighborhood by adding more green space, and you want the project to be a participatory process. How do you then get the community on board? “Nobody really trains you on how to be a community researcher. You learn by doing,” said Marta Berbés- Blázquez. “You scan the news, you scan Facebook, you start following activists in a region, you start fig-uring out who’s who. That takes a little bit
“Green spaces can occur anywhere…. It’s these in- between, accidental spaces that are sometimes the more creative ways to think about green space.”

38 Eos // JUNE 2021
Opp
osite
Pag
e: X
XX
XX
X; T
his
Page
: Top
Rig
ht: X
XX
X
of time, and a lot of it is very subtle.” Berbés- Blázquez researches the human dimensions of social- ecological transfor-mations in rural and urban ecosystems as an assistant professor at ASU.
“I might go to a random community event,” she continued. “I might go to a webinar or go to community meetings. And I would just sit in the background and listen and not talk.” By doing so, a researcher learns what issues are at the forefront of a community’s agenda, who key leaders are, and what historical or systemic issues that community is facing.
After so many residents rejected free trees, for instance, that Detroit nonprofit shifted its approach to include communities in the decisionmaking process regarding the types of trees and where to plant them. It also expanded its youth employment program to maintain the trees and teach residents about them.
“I think the tendency is for geoscientists to focus on data analyses,” Duong said, “and then point to them and say, ‘This makes sense for scientific purposes. We have this much water deficit, therefore car-rying out this strategy [would provide] 200% of the amount of water that we need.’” Such analyses are necessary ingredients in any green infrastructure project, but there are
other consider-ations that go out-side the scope of a geoscientist’s expertise. “That doesn’t take into account the politi-
cal considerations, the budget required, the maintenance required, or the disruption to the community during construction. Those are nontrivial components of implementing green space projects.”
By taking a step back and learning about the community before initiating a project, a geoscientist will be able to evaluate neighborhood- specific risks, such as attrac-tive new green space pushing rents up, and have steps in place to protect residents from harm. “Having those mechanisms in place has shown that you can reduce some of these green gentrification crises that are happen-ing,” Trivedi said.
Consider, for example, Washington, D.C.’s 11th Street Bridge Park project, a recreational park bridge that will cross the Anacostia River at Ward 7 and Ward 8, areas that are majority Black and have incomes lower than the D.C. average. Green infrastructure proj-ects in neighborhoods with similar demo-graphics have, in the past, created gentrifica-tion crises that ultimately harmed residents. Residents of Wards 7 and 8 initially pushed back against development of a bridge park in their neighborhoods for exactly those rea-sons. In response, the project managers partnered with community leaders to create equity- focused development strategies: set-ting up community land trusts, safeguarding
affordable housing investments, providing skills training and jobs for local residents, and investing in local small businesses.
The process of codeveloping solutions isn’t easy, Berbés- Blázquez said, and the structure of academic research, such as grant cycles or tenure clocks, can often get in the way. “The speed at which projects have to happen, be it academically or politi-cally, doesn’t necessarily give enough time to foster true, genuine, trusting relation-ships between the different actors who are involved,” she said. “Don’t bring your own agenda, but if you do have one, then be very clear about it. And then be patient” and be willing to recognize and acknowledge when you make mistakes.
Community- led organizations focused on regreening cities are working across the country, Hoover said, and each one knows how scientists can best help them achieve their goals. “I would really encourage other scientists, planners, practitioners, and researchers to start listening and to start reaching out,” she said, “to just learn and to really push the boundaries of their own fields and their own assumptions within their science.”
“Environmental justice is not only equita-ble distribution of resources but also equita-ble access to decisionmaking,” Watkins said.
Author InformationKimberly M. S. Cartier (@AstroKimCartier), Staff Writer
uRead the article at bit.ly/Eos-green -equity
“Nobody really trains you on how to be a community researcher. You learn by doing.”
Serve as an Earth and space sciences volunteerVisit AGU’s Volunteer Central to sign up for opportunities that fit your interest, expertise and time commitment.
connect.agu.org/volunteeropportunities

Join or renew your AGU membership today!
When you join AGU, you join a worldwide community of 130,000 enthusiasts to experts in Earth and space sciences.
As an AGU member, you are
• Supporting future generations of Earth and space scientists.• Helping to make the Earth and space science community more diverse and inclusive.• Expanding your professional network.• Sharing your research and insights.• Learning from others to stay up to date on the latest news and research.• Engaging in Fall Meeting, Chapmans and other meetings and scientifi c events.
Join or renew your AGU membership now!
www.agu.org/join

40 Eos // JUNE 2021
RESEARCH SPOTLIGHT
A 50, 000- Year History of Current Flow Yields New Climate Clues
From 50,000 to 15,000 years ago, during the last ice age, Earth’s climate wobbled between cooler and warmer periods
punctuated by occasional, dramatic ice- melting events.
Previous research has suggested that these oscillations were likely influenced by changes in the Atlantic Meridional Overturning Circu-lation (AMOC), a pattern of currents that carry warm, tropical water to the North Atlantic, where it cools, sinks, and flows back south. However, the precise role played by the AMOC in ancient climate fluctuations has been unclear.
Now Toucanne et al. have reconstructed the historical flow of a key current in the upper part (the northward flow) of the AMOC, the Glacial Eastern Boundary Current (GEBC),
shedding new light on how the AMOC can drive sudden changes in climate.
The GEBC flowed northward along Europe’s continental margin during the last ice age (it persists today as the European Slope Cur-rent). To better understand the GEBC’s role in the AMOC, the researchers collected six seafloor sediment cores off the coast of France. Analysis of grain sizes and isotope levels in the core layers revealed the current’s strength when each layer was deposited, yielding the first high- resolution, 50, 000- year historical record of the current.
This new historical record shows that the GEBC flowed faster during warmer intervals of the last ice age but weakened during the coldest periods. The timing of these changes aligns well with previously established
records on AMOC speed and the southward return flow of deep waters to the west.
Comparing the history of the GEBC with other records also shows that major ice- melting events, in which ice age glaciers released huge amounts of freshwater into the Atlantic, correspond with periodic weakening of the current and of the AMOC in general.
Drawing on these findings, the researchers outline a mechanism by which the GEBC could have carried cold glacial meltwater northward and contributed to changes in the AMOC that may have driven warm- cold cli-mate oscillations in the North Atlantic. Fur-ther research could help clarify these dynam-ics. (Paleoceanography and Paleoclimatology, https:// doi .org/ 10 .1029/ 2020PA004068, 2021) —Sarah Stanley, Science Writer
New research confirms the central role of a major ocean circulation system in driving sudden climate changes during the last ice age. Here an iceberg floats off Baffin Island,
Nunavut, Canada, in the North Atlantic Ocean, a region that plays a key role in ocean circulation. Credit: National Snow and Ice Data Center, CC BY 2.0 (bit .ly/ ccby2- 0)

SCIENCE NEWS BY AGU // Eos.org 41
RESEARCH SPOTLIGHT
An Innovative Approach to Investigating Subduction Slip Budgets
The Nankai subduction zone hugs the southeastern curve of Japan and is one of the most seismically active regions on
the planet. The combination of the region’s short seismic cycle—great earthquakes (mag-nitude 8 or greater) occur roughly every 100- 150 years—and its history of superb geophys-ical observations makes it an attractive natural observatory for scientists looking to study the evolution of subduction zones during and between great earthquakes. The last major quakes in the region occurred in the mid- 1940s, and the decades since have offered opportunities for researchers to pursue inno-vative geodetic monitoring and modeling.
In a new study, Sherrill and Johnson provide the most complete 3D coseismic and post-seismic model yet of the Nankai subduction zone, using a new approach that relies on iteratively inverting vertical surface displace-ment data to characterize movement, or slip, along the fault. Slip at subduction zones dis-
plays a range of complex behaviors, such as slip during earthquakes, afterslip following major earthquakes, and episodic tremor and slow-slip (ETS) events. Understanding the distribution of these slip behaviors in space and time relative to the area of a fault where earthquakes occur is crucial for assessing seismic hazards at subduction zones.
For Nankai, the researchers teased apart the types of slip that have contributed most to the total slip budget (the amount of slip that must be accommodated in a subduction zone because of tectonic plate convergence). The model also offers new insights into the last large earthquakes at Nankai, allowing the researchers to estimate that the maximum slip during the 1940s events was 7.5 meters. Since then, afterslip has reached a maximum of 2.6 meters, they report.
The slip budget at Nankai comprises coseismic slip, afterslip, short- and long- term slow slip, and interseismic creep. Below
eastern Shikoku Island, the researchers report that the slip budget is nearly met. However, below western Shikoku, there is a considerable deficit—about half the total budget—implying the potential for signifi-cant future earthquakes in that area. The study also revealed that long- duration after-slip occurred in the same area of the fault as ETS, an observation that provides new con-straints on the frictional properties of this part of the subduction zone.
Beyond what the research reveals about Nankai specifically, the work also offers a state- of- the- art approach for modeling geo-detic data across a complete seismic cycle—a feat necessary for improving risk assess-ments and related policy decisions—that should be applicable to subduction zones around the world. ( Journal of Geophysical Research: Solid Earth, https:// doi .org/ 10 .1029/ 2020JB020833, 2021) —David Shultz, Science Writer
Global Warming Causes Uneven Changes in Heat Stress Indicators
A s the planet warms under the effects of human- caused climate change, prolonged periods of high temperatures are projected to become a significant public health challenge. The elderly are
often more susceptible than others to the effects of temperature extremes, so the rising average age of populations worldwide may exacerbate this challenge. To quantify the level of danger posed by particular weather conditions, researchers have developed a series of heat stress indicators (HSIs), the most commonly known of which is the NOAA Heat Index. This index and other HSIs measure how hot it feels when other factors, like relative humidity, are taken into account.
Despite myriad indicators, past work has suggested that no one indi-cator produces an overall better prediction than others of negative health outcomes for a given set of weather conditions. Rather, different HSIs can help quantify specific outcomes, such as an increase in mor-tality or a decrease in worker productivity due to occupational heat exposure. To better understand how these indicators may respond to the predictions of current- generation climate models, Schwingshackl et al. computed the evolution of eight prominent HSIs based on a series of models.
The authors selected indicators whose inputs consist of temperature, pressure, and humidity and computed the daily value of each HSI across 24 climate models from 1981 to 2100. To show changes in HSIs for differ-ent global warming levels, they used historical data and a high- emissions climate scenario to cover the full range of potential future warming.
All HSIs increased during the modeled period, with most increasing faster than the change in global mean temperature. There is, however, considerable spread in the projected magnitude of the growth, with some indicators increasing only a little and others changing signifi-cantly.
To indicate the potential risk to human health, the authors applied four levels of threshold values that are unique to each HSI and are based on existing literature assessments regarding the impacts of heat stress. The researchers calculated the frequency with which each indicator would exceed its outcome- defined thresholds. Because each HSI had its own unique threshold values, there was high indicator- to- indicator variance, but a trend of more days exceeding higher thresholds was clear. The amount of increase was also geographically divergent. For example, some regions, such as central Europe, experienced few addi-tional high- HSI days, whereas other places—like Southeast Asia—had many more.
The paper argues that a simple temperature- based indicator can be a good approximation for trends in HSIs. At the same time, the authors note that it is challenging to directly compare one HSI with another, especially on a global scale. Populations are acclimatized to heat in dif-ferent ways in various places, so it is important to select an indicator representative of what needs to be measured and where. (Earth’s Future, https:// doi .org/ 10 .1029/ 2020EF001885, 2021) —Morgan Rehnberg, Science Writer

42 Eos // JUNE 2021
RESEARCH SPOTLIGHT
The Gaps in Environmental Networks Across Latin America
Environmental monitoring is critical for both understanding the world and developing policies to protect it. Envi-
ronmental observatory networks (EONs) allow scientists to collect, share, and synthe-size data to make new discoveries and also informed policy decisions on regional to global scales. But observatory networks are not always evenly distributed; some regions of the world are better monitored than others. Therefore, researchers must assess the rep-resentativeness of EONs not only to increase their numbers in underrepresented regions but also to evaluate their applicability to research and policy questions.
In a new study, Villarreal and Vargas carried out just such an assessment of FLUXNET, an EON known as the “network of networks” that measures the exchange of matter—such as carbon dioxide, water, and methane—and energy between the land and the atmosphere. Although previous research has evaluated EONs using climate and vegetation parame-ters, here the authors assessed the represen-tativeness of eddy covariance sites within FLUXNET using species distributions models. The team focused on Latin America, a biodi-
verse region with large impacts on carbon and water cycles far beyond its borders.
Despite its outsized ecological impact, the density of FLUXNET sites in Latin America is lower than in the United States or Europe. The team identified 41 eddy covariance sites reg-istered with FLUXNET across Latin America as of 2018 and evaluated the network’s ability to monitor patterns of gross primary produc-tivity (GPP), evapotranspiration, and variabil-ity in multiple environmental factors, includ-ing climate, topography, and soil. The authors then used a multivariate statistical technique to determine how many more FLUXNET sites are necessary across Latin America to improve the representativeness of the network for GPP and evapotranspiration.
They found that the existing FLUXNET sites represented nearly half of GPP and more than a third of evapotranspiration patterns. For cli-mate, terrain, and soil properties, those num-bers were 34%, 36%, and 34%, respectively. Unfortunately, data from these sites are not widely available. Currently, the authors note, models must rely on data from FLUXNET sites outside of Latin America to make predictions about patterns within the region.
The multivariate analysis showed that add-ing 200 study sites across Latin America could nearly double the overall representativeness of both GPP and evapotranspiration. How-ever, with optimally located sites, the same increase could be achieved with just 60 sites, though the uncertainty would be much higher.
In the meantime, the authors call for more coordination and data sharing among researchers in Latin America and caution against “helicopter research,” in which researchers from institutions in developed countries collect data with little or no involvement from local researchers. Ulti-mately, local contributions will be critical for increasing the representativeness of FLUX-NET sites across the region. ( Journal of Geo-physical Research: Biogeosciences, https:// doi .org/ 10 .1029/2020JG006090, 2021) —Kate Wheeling, Science Writer
Despite their importance in global carbon and water cycles, many ecosystems across Latin America, including Argentina’s Pampas, above, are not represented by FLUXNET
sites. Credit: Eduardo Amorim/Flickr, CC BY- NC- ND 2.0 (bit.ly/ccbyncnd2-0)
uRead the latest news at Eos.org

SCIENCE NEWS BY AGU // Eos.org 43
RESEARCH SPOTLIGHT
How Did Diatoms Evolve to Swap Zinc for the Toxic Metal Cadmium?
W herever light penetrates the ocean, diatoms are sure to be found. These single- celled algae play a foundational role in the marine food web by converting carbon dioxide into
organic material. To function, the process involves an enzyme that requires the mineral zinc. However, when zinc is scarce, cadmium—a toxic heavy metal—can take its place.
To date, the geological circumstances that affected the evolution of this flexible biological pathway have been unclear. In a new study, Sri-vastava et al. use a mineral chemistry network analysis to provide fresh clues into the conditions that influenced diatoms’ unusual ability to use cadmium.
Network analysis is increasingly being applied to explore and visu-alize the diversity of minerals and their spatial distribution over time. Here the researchers used it to study the relationship between zinc and cadmium over billions of years of Earth’s history, including about 180 million years ago, when diatoms are thought to have evolved.
The analysis shows that whereas zinc can form minerals with a wider variety of other elements than cadmium can, both zinc and cadmium can form sulfur- containing minerals that are similar in their chemis-try. These zinc and cadmium sulfides are highly weatherable and were often found in the same locations over geological history. They were especially abundant throughout the past 500 million years.
On the basis of these insights, the authors suggest that weathering processes on land—perhaps enhanced by the rise of terrestrial plants—could have released abundant zinc and cadmium sulfides into coastal waters. Diatoms, known for their rapid consumption of nutrients, may have quickly depleted the available zinc, leaving behind plentiful cad-
mium. Such circumstances could have influenced the evolution of dia-toms’ ability to substitute cadmium for zinc.
These results highlight the crucial interplay between the geosphere and the biosphere in the evolution of primary producers in Earth’s oceans. ( Journal of Geophysical Research: Biogeosciences, https:// doi .org/ 10 .1029/ 2020JG005966, 2021) —Sarah Stanley, Science Writer
The Space Dust That Causes Zodiacal Light Might Come from Mars
Just before sunrise or after sunset, observers of the night sky might behold a faint column of light extending upward
from the horizon. Known as zodiacal light, this celestial glow results from sunlight reflecting off dust particles in the inner solar system. However, the source of the dust is unknown.
Many scientists have long assumed that the particles responsible for zodiacal light are delivered by comets and asteroids. Now Jor-gensen et al. suggest that the origins of this interplanetary dust are instead associated with Mars.
The particles in question are known to orbit the Sun in discrete bands near the ecliptic plane—the plane defined by Earth’s orbit. However, their scarcity has made them diffi-cult to observe in space; a sensor with a large collecting area is needed to detect an appre-
ciable number of them. In a serendipitous turn of fate, navigational cameras associated with the magnetometer instrumentation aboard the Juno spacecraft provided an unexpected opportunity to detect these particles and determine their distribution for the first time.
From 2011 to 2016, as Juno traveled through the solar system on its way to Jupiter, its cam-eras tracked tiny fragments of material knocked free from the spacecraft by collisions with interplanetary dust particles of the size associated with zodiacal light. Juno’s 60 square meters of solar arrays provided a large target for dust impacts, ultimately recording 15,278 such events. The researchers analyzed the amount and distribution of the detected particles in the context of Juno’s journey relative to the ecliptic plane, Mars, Jupiter, and the asteroid belt.
The analysis suggests that the dust likely originates from a source that shares orbital characteristics with Mars, including both the precise tilt of its orbit around the Sun and its eccentricity. Some of the dust is then scat-tered into an orbit with a higher angle of tilt, which can be explained by gravitational inter-actions with Jupiter.
A Martian origin for the dust would account for both the Juno observations and previous observations of zodiacal light, but for now these particles remain mysterious. Researchers have not yet identified a clear mechanism by which they might escape from Mars itself or from either of its two moons, Phobos and Deimos. ( Journal of Geophysical Research: Planets, https:// doi .org/ 10 .1029/ 2020JE006509, 2021) —Sarah Stanley, Science Writer
Single-celled diatoms, like those seen here, can use the toxic metal cadmium in
place of zinc in photosynthesis when zinc is scarce. Credit: NASA

44 Eos // JUNE 2021
RESEARCH SPOTLIGHT
The First Angstrom- Scale View of Weathering
Sedimentary rocks and water are both abundant on Earth’s surface, and over long stretches of time, their interac-
tions turn mountains into sediment. Researchers have long known that water weathers sedimentary rocks both physically, by facilitating abrasion and migration of rocks, and chemically, through dissolution and recrystallization. But these interactions never have been viewed before in situ at the angstrom scale.
In a new study, Barsotti et al. use environ-mental transmission electron microscopy to capture dynamic images of water vapor and droplets interacting with samples of dolos-tone, limestone, and sandstone. Using a cus-tom fluid injection system, the team exposed the samples to distilled water and monitored
the effects of the water on pore sizes over the course of 3 hours. Physical weathering was readily observable in the experiments with water vapor, and the chemical processes of dissolution and recrystallization were more pronounced in experiments with liquid phase water.
The researchers were able to observe a layer of adsorbed water that had formed on micropore walls of all three rock types. They found that as water vapor was added, the pore size contracted by as much as 62.5%. After 2 hours, when water had been removed, the pore sizes increased. Overall, with respect to the initial size, the final pore size of the dolo-stone decreased by 33.9%, whereas the size increased by 3.4% and 17.3% in the limestone and sandstone, respectively. The team sug-
gests that these changes in pore size were due to adsorption- induced strain. The liquid phase experiments revealed that dissolution rates were highest in limestone, followed by dolostone and sandstone.
The study supports previous work suggesting that dissolution and recrystallization can alter the size and shape of the pores in sedimentary rocks. It also provides the first direct evidence from an in situ experiment that adsorption- induced strain is a source of weathering. Ulti-mately, these changes to pore geometry could lead to changes in such rock properties as per-meability that influence water flow, erosion, and elemental cycling on broader scales. ( Jour-nal of Geophysical Research: Solid Earth, https:// doi .org/ 10 .1029/ 2020JB021043, 2021) —Kate Wheeling, Science Writer
Earthquakes Can Acidify Groundwater
The aboveground effects of earthquake ground shaking are often readily visible. If the shaking is strong enough, it can rend, tilt, and dislodge rock at Earth’s surface, resulting in cracks, mud-
flows, and landslides that are apparent for all to see.Below the surface, earthquakes open fractures that can release and
shift gases and fluids, discharging groundwater from aquifers and altering streamflow on the surface. In addition, quakes can, at least temporarily, expose groundwater to pollution and change its makeup. Such shifts typically correlate with earthquakes larger than magnitude 3.5. But what about weaker earthquakes?
Stillings et al. wondered how earthquakes of magnitude 1 or less, which naturally occur more frequently than larger quakes and which
can be driven by human activities, might affect groundwater. With expanding use of hydraulic fracturing, geothermal energy develop-ment, and underground carbon storage, humans are inducing more and more of such quakes each year, and their effects on groundwater, particularly in water- stressed regions, merit consideration, the authors say.
The researchers performed their research at the Grimsel Test Site in Switzerland, which comprises a series of tunnels and boreholes drilled into granite near Lake Räterichsboden. While the team was observing the site, draining and refilling of the reservoir triggered microearth-quakes. Pulses of groundwater propagated from the quake locations, through the local fracture network, and toward the tunnels.
Observations in tunnel boreholes showed that the earthquakes did not change groundwater pressure or solute chemistry. However, they did reveal that the small quakes made the groundwater temporarily more acidic, with a pH change equivalent to the difference between tap water and vinegar. Measurements suggested that the pH returned to its normal level within 24 hours, once the pulse of acidic water had passed. The results represent the first field evidence of earthquake- triggered groundwater acidification, the authors note.
The researchers further investigated the phenomenon in laboratory experiments by grinding and breaking rocks in water with chemistry similar to that at Grimsel. These experiments, in which the water’s pH dropped for several days, revealed that the increased acidity stems from silanols and silica radicals created on fresh mineral surfaces during the grinding process that concentrate hydrogen ions in the water.
Groundwater pH influences many geochemical reactions beneath the surface. The new findings, according to the authors, significantly con-tribute to understanding groundwater chemistry and water- rock interactions. (Geophysical Research Letters, https:// doi .org/ 10.1029/ 2020GL089885, 2021) —Aaron Sidder, Science Writer
This photo from a tunnel at the Grimsel Test Site in Switzerland was taken during a
geochemical sampling campaign to analyze changes in groundwater following
microseismic events. Credit: Richard Lord

SCIENCE NEWS BY AGU // Eos.org 45
RESEARCH SPOTLIGHT
Parsing Routes to Aquifer Recharge Along Mountain Fronts
In many semiarid and arid regions around the world, groundwater drawn from basin- fill aquifers sustains local agriculture and large cities. Such aquifers are typically replenished by high- elevation
precipitation and snowmelt along encircling mountain fronts via sev-eral pathways. These pathways include infiltration from streams, dif-fuse subsurface flow from the mountains to the basin, and focused subsurface flow along features like faults. Distinguishing among these various means of mountain front recharge is necessary to effectively manage aquifers’ limited water supplies, but it can be challenging because the waters moving through different paths can be difficult to sample and often have similar chemical fingerprints.
Now Markovich et al. show that a combination of techniques can be used to address these challenges. Because the various components of mountain front recharge can differ substantially in terms of flow veloc-ity, the distance the water travels, and the elevation at which recharge occurs, the team hypothesized that groundwater age dating, combined with thermometric methods and numerical modeling, could be used to distinguish between them. To test this approach, the team applied a
suite of techniques, including noble gas and isotopic tracers such as radiocarbon, krypton- 85, argon- 39, and tritium, to characterize the groundwater pumped from six wells in Arizona’s northern Tucson Basin.
The tracers indicated the presence of very old water in one well located in weathered bedrock near the mountain front, as well as mod-ern water mixed with a small percentage of older water in two basin production wells. Collectively, the authors say, the results indicate that this multifaceted approach can be used to characterize the sources of groundwater and dominant flow behavior in basin- fill aquifers and that this information can, in turn, be used to quantify both the sub-surface and surface components of mountain front recharge. Because climate change may affect the amount and timing of each recharge component in different ways, this approach represents an important step forward in obtaining the data needed to sustainably manage these crucial water sources in the present and future climates. (Water Resources Research, https:// doi .org/10 .1029/ 2020WR027743, 2021) —Terri Cook, Science Writer
Tucson, Ariz., seen here with the Santa Catalina Mountains in the background, is one of many large urban areas dependent on groundwater, a limited resource that must be
carefully managed to ensure adequate supplies as the climate changes. Credit: John Diebolt/Wikimedia, CC0 1.0 (bit.ly/cc01-0)
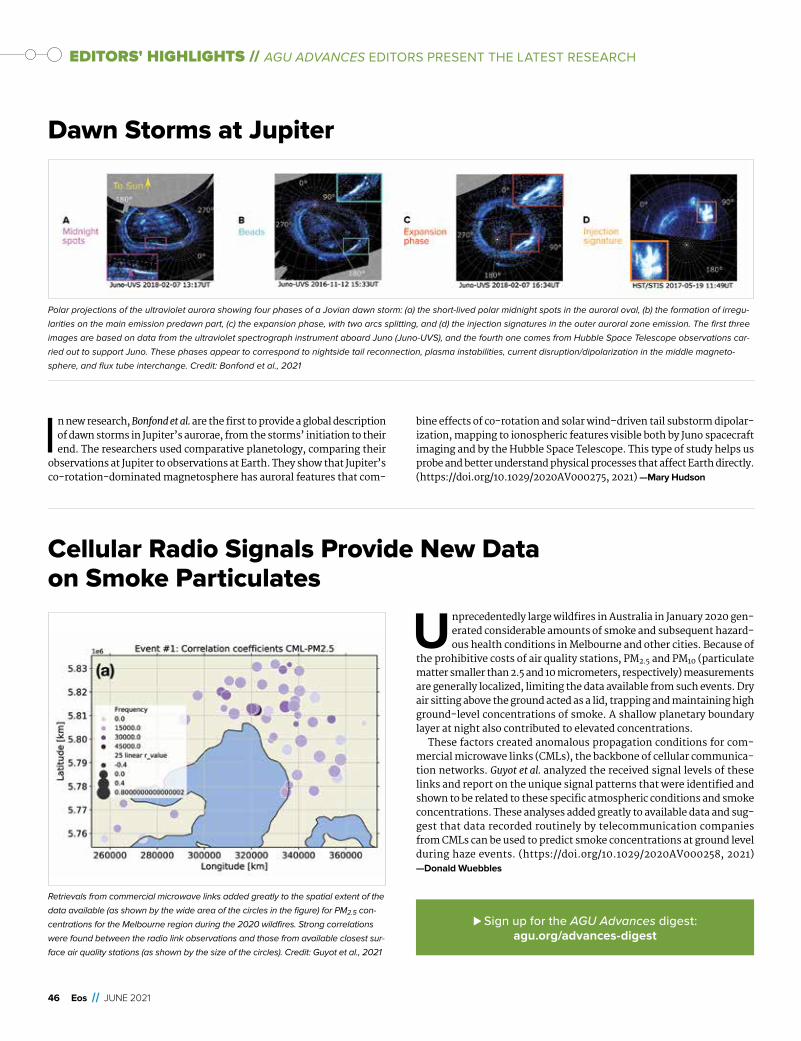
46 Eos // JUNE 2021
EDITORS' HIGHLIGHTS // AGU ADVANCES EDITORS PRESENT THE LATEST RESEARCH
Dawn Storms at Jupiter
In new research, Bonfond et al. are the first to provide a global description of dawn storms in Jupiter’s aurorae, from the storms’ initiation to their end. The researchers used comparative planetology, comparing their
observations at Jupiter to observations at Earth. They show that Jupiter’s co-rotation- dominated magnetosphere has auroral features that com-
bine effects of co-rotation and solar wind–driven tail substorm dipolar-ization, mapping to ionospheric features visible both by Juno spacecraft imaging and by the Hubble Space Telescope. This type of study helps us probe and better understand physical processes that affect Earth directly. (https:// doi .org/ 10 .1029/ 2020AV000275, 2021) —Mary Hudson
Cellular Radio Signals Provide New Data on Smoke Particulates
Unprecedentedly large wildfires in Australia in January 2020 gen-erated considerable amounts of smoke and subsequent hazard-ous health conditions in Melbourne and other cities. Because of
the prohibitive costs of air quality stations, PM2.5 and PM10 (particulate matter smaller than 2.5 and 10 micrometers, respectively) measurements are generally localized, limiting the data available from such events. Dry air sitting above the ground acted as a lid, trapping and maintaining high ground- level concentrations of smoke. A shallow planetary boundary layer at night also contributed to elevated concentrations.
These factors created anomalous propagation conditions for com-mercial microwave links (CMLs), the backbone of cellular communica-tion networks. Guyot et al. analyzed the received signal levels of these links and report on the unique signal patterns that were identified and shown to be related to these specific atmospheric conditions and smoke concentrations. These analyses added greatly to available data and sug-gest that data recorded routinely by telecommunication companies from CMLs can be used to predict smoke concentrations at ground level during haze events. (https:// doi .org/ 10 .1029/ 2020AV000258, 2021) —Donald Wuebbles
Retrievals from commercial microwave links added greatly to the spatial extent of the
data available (as shown by the wide area of the circles in the figure) for PM2.5 con-
centrations for the Melbourne region during the 2020 wildfires. Strong correlations
were found between the radio link observations and those from available closest sur-
face air quality stations (as shown by the size of the circles). Credit: Guyot et al., 2021
Polar projections of the ultraviolet aurora showing four phases of a Jovian dawn storm: (a) the short- lived polar midnight spots in the auroral oval, (b) the formation of irregu-
larities on the main emission predawn part, (c) the expansion phase, with two arcs splitting, and (d) the injection signatures in the outer auroral zone emission. The first three
images are based on data from the ultraviolet spectrograph instrument aboard Juno (Juno-UVS), and the fourth one comes from Hubble Space Telescope observations car-
ried out to support Juno. These phases appear to correspond to nightside tail reconnection, plasma instabilities, current disruption/dipolarization in the middle magneto-
sphere, and flux tube interchange. Credit: Bonfond et al., 2021
uSign up for the AGU Advances digest: agu.org/advances-digest

SCIENCE NEWS BY AGU // Eos.org 47
POSITIONS AVAILABLE
PLACE YOUR
AD HEREVisit agu.org/advertise to learn more
about employment advertising with AGU.
The Career Center (findajob.agu.org) is AGU’s main resource for recruitment advertising.
AGU offers online and printed recruitment advertising in Eos to reinforce your online job visibility and your brand. Visit employers.agu.org for more information.
Eos is published monthly.
Deadlines for ads in each issue are published at eos.org/advertise.
Eos accepts employment and open position advertisements from governments, individuals, organizations, and academic institutions. We reserve the right to accept or reject ads at our discretion.
Eos is not responsible for typographical errors.

48 Eos // JUNE 2021
POSTCARDS FROM THE FIELD
View more postcards at bit.ly/Eos-postcard
Hello, AGU!
This is a view of the Hamelin Pool stromatolites in Shark Bay in Western Australia against a sun-set over the Indian Ocean. This photo was taken during a 2015 student geology field trip run by the University of Western Australia in Perth. Stromatolites like these are modern analogues for ancient stromatolites (~3.5 billion years old), which represent some of the earliest evidence of life on Earth.
—Natasha Barrett, Postdoctoral Researcher, University of Copenhagen, Denmark

AGU Fall Meeting 2021 DeadlinesAGU Fall Meeting is a well-orchestrated event that will bring together thousands of researchers, scientists, educators, students, policymakers, science enthusiasts, journalists and communicators who are driven to better understand our planet and environment, and our role in preserving its future. Our meeting deadlines are set in advance to ensure everyone—from presenters to attendees to the Fall Meeting Program Committee (FMPC)— has a fantastic meeting experience. What happens once you submit your abstract?
Here’s a look at the process from start to finish.
agu.org/fallmeeting
1 March Call for proposals opens!
January 2021FMPC meetings start.
14 April Deadline for call for
proposals.
19 MayDeadline for FMPC to review/merge
proposals.
4 August Deadline for abstract
submissions.
9 June Session proposal
acceptance notification letters are sent. Abstract
submission site opens.
Late July Town hall and workshop
proposal notification letters are sent.
13 – 17 December AGU welcomes attendees from around the world to New Orleans and online
everywhere!
5 October Abstract acceptance
notifications are sent.
8 – 10 SeptemberFMPC meets to create the #AGU21 scientific
schedule.
Reminder: #AGU21 abstracts accepted
9 June—4 August
When you submit an abstract, you can share what “science” is for you!