Embed Size (px)
Citation preview
DOCUMENT RESUME
ED 374 328 CE 067 284
AUTHOR Medrich, Elliott A.; And OthersTITLE Vocational Education in G-7 Countries: Profiles and
Data. Research and Development Report.INSTITUTION MPR Associates, Berkeley, CA.SPONS AGENCY NatiLnal Center for Education Statistics (ED),
Washington, DC.REPORT NO ISBN-0-16-045219-8; NCES-94-005PUB DATE Sep 94NOTE 137p.
PUB TYPE Reports Research/Technical (143) StatisticalData (110)
EDRS PRICE MF01/PC06 Plus Postage.DESCRIPTORS Comparative Analysis; *Comparative Education;
Developed Nations; Foreign Countries; Job Skills;*Job Training; Labor Market; Postsecondary Education;Program Effectiveness; *Program Evaluation; SecondaryEducation; *Vocational Education
IDENTIFIERS Canada; France; Germany; Italy; Japan; UnitedKingdom; United States
ABSTRACTThis report examines data and data quality on
vocational education and training available from the seven highlydeveloped countries that make up the G-7: Canada, France, Germany,Japan, Italy, the United Kingdom, and the United States. Following anintroduction, chapter 2 describes the nature of vocational educationand training opportunities at the upper secondary level and beyond ineach country, emphasizing programs that fall under the jurisdictionsof education ministries. One-page descriptions of the vocationaleducation systems in each country are followed by extensivenarratives for each vocational education system that focus on theseareas: school-based vocational preparation and training, what thevocational system looked like during the most recent year for whichdata are available, and the most common ways of obtaining vocationalskills. Chapter 3 describes the following: international comparisonsof data on vocational education; contextual and programmaticdifferences; key indicators that one would want to compare acrossvocational systems; data that international organizations havecompiled regarding these indica'ors; degree to which these keycomparisons can be made using existing data; and data improvementsnecessary to prepare all these.key indicators. Appendixes include thefollowing: a description of surveys and studies in each G-7 countrythat contain information pertinent to assessments of vocationaleducation and training programs, and a vocational education datainformation sources contact list. Contains 118 references. (YLB)
*************************************.**********************************
Reproductions supplied by EDRS are the best that can be madefrom the original document.
***********************************************************************
mzeitigigialkk
NATIONAL CENTER FOR EDUCATION STATISTICS
Research and Development Report September 1994
Vocational Educationin G-7 Countries:Profiles and Data
Prepared byElliott A. MedrichSusan A. KagehiroMPR Associates, Inc.
James HouserProject OfficerNational Center for Education Statistics
U S. DEPARTMENT OF EDUCATIONDisco or Educahonai Research and imwoverneel
EDU ATIONAL RESOURCES INFORMATIONCENTER (ERIC)
This document has been reproduced asreceived from the person or organizationoriginating it.
0 Minor changes have been made toimprove reproduction quality.
Points el view or opinions staled in thisdocument do net necessarily representofficial 0E131 position or policy.
U.S. Department of EducationOffice of Educational Research and Improvement
BEST COPY AVAILABLE
n. - W
NCES 94-005
I.
U.S. Department of EducationRichard W. RileySecretary
Office of Educational Research and ImprovementSharon P. RobinsonAssistant Secretary
National Center for Education StatisticsEmerson J. ElliottCommissioner
National Center for Education Statistics
"The purpose of the Center shall be to collect, analyze, anddisseminate statistics and other data related to educationin the United States and in other nations."Section 406(b)of the General Education Provisions Act, as amended (20U.S.C. 1221e-1).
September 1994
Contact:James Houser(202) 219-1419
3
For sale by the U.S. Government Printing OfficeSuperintendent of Documents, Mail Stop: SSOP, Washington. DC 204(12-9328
ISBN 0-16-045219-8
Itieitaslarn
Foreword
The National Center for Education Statistics (NCES) collects and publishes information onthe condition of education in the United States. The Carl D. Perkins Vocational and AppliedTechnology Education Act Amendments of 1990 (Public Law 101-392, Section 421) mandatedthat NCES
carry out an assessment of data availability and adequacy withrespect to international competitiveness in vocational skills. To theextent practicable, the assessment shall include comparative policy-relevant data on vocational education in nations which are majortrade partners of the United States. The assessment shall at aminimum identify available internationally comparative data onvocational education and options for obtaining and upgrading suchdata.
In responding to this mandate, NCES focused on describing and presenting statisticalinformation about vocational education in the G-7 countriesCanada, France, Germany, Italy,Japan, the United Kingdom, and the United Stateswhich are among the most highly developedeconomies. These comparisons were believed to be especially useful, since they reflectcircumstances across countries that share many similarities but that use substantially differentearly vocational education and training strategies.
Several factors influenced the nature of the inquiry. First, there is no common definition ofwhat const4utes vocational education and training among countries. Because the nature andquality of data vary from system to system, efforts to compare vocational education systemsrequire an understanding of the vocational education and training systems in the countries beingcompared.
Second, this report is based on data from government ministries and selected internationalsources. The accuracy of the reporting systems from country to country, upon which the data inthis report are based, has not been assessed.
Third, because there is little agreement cross-nationally regarding the kinds of informationgovernments would like to have about each others' vocational education systems, most data aredesigned to serve national, rather than international, needs. As policymakers and practitionersexamine how best to confront issues associated with the school-to-work transition, obtaininginformation about vocational education structures, processes, and programs in other countries isof interest.
Fourth, the kinds of information included in this report were selected by a group of expertson vocational education in the United States and abroad. The report is not intended to beexhaustive or present information and data on all policy-relevant subjects involving vocationaleducation.
iii 4
NCES has become particularly involved in efforts to provide reliable cross-nationalcomparisons that can constructively enhance discussions about the future direction of oureducation system. To that end, NCES participates in a number of activities in the internationalforum that provide information central to building a world-class education system for the 21stcentury, including the Third International Math and Science Study (TIMSS) and theOrganization for Economic Cooperation and Development (OECD) International EducationIndicators Project (INES).
iv
ra.5,.v71 /U. -
Emerson J. ElliottCommissioner of Education Statistics
Acknowledgments
A number of individuals interested in both vocational education and cross-national datacomparisons helped to plan and organize this report.
James Houser and John Ralph of the Data Development Division in the National Center forEducation Statistics (NCES), which is under the direction of Jeanne E. Griffith, AssociateCommissioner, coordinated this project. In the Division, Mary Frase, Dawn Nelson, EugeneOwen, and Lois Peak offered comments.
Before work began, a meeting of experts was held to review and consider ways ofapproaching issues associated with the availability and quality of cross-national data onvocational education. David Baker (Catholic University), Ann Heald (University of Maryland),Alan Kerckhoff (Duke University), Sigurd Nilsen (U.S. General Accounting Office), Wayne.Riddle (Congressional Research Service), and Hong Tan (World Bank) participated in thismeeting.
A number of reviewers made suggestions that strengthened this report; Les Bell (Universityof Warwick, England), Norberto Boitani (Organization for Economic Cooperation andDevelopment), Jim Foti (Bureau of Apprenticeship and Training, U.S. Department of Labor),Douglas Hodgekinson (British Columbia Ministry of Education), Boyd Pe lly (Council ofMinisters of Education, Canada), David Raffe (University of Edinburgh, Scotland), David Stern(University of California, Berkeley), and Tom Rohlen (Stanford University).
v
Executive Summary
Reforms associated with the Carl D. Perkins Vocational and Applied TechnologyAmendments of 1990 (Public Law 101-392) have intensified U.S. interest in how other highlydeveloped countriessome with considerable commitments to vocational education andtrainingare addressing issues of education and labor force preparation. Despite differences in
education systems from country to country, in today's global economy all highly industrializednations are working to achieve an appropriate link between education and training.
This report describes and contrasts vocational education systems in the G-7 countriesCanada, France, Germany, Japan, Italy, the United Kingdom, and the United States. In addition,the report describes some key cross-national indicators of the status of vocational education and
compares data across countries. The G-7 countries are the most highly industrialized anddeveloped in the world. While the G-7 have many things in common, each country approachesissues of vocational education and training in a different way.
Vocational Education and Training in G-7 Countries
From country to country, the nature of vocational education and training reflects deepcultural roots, national predispositions, and historic traditions. Vocational program strategies areclosely linked to the priorities of each national education system. The general characteristics ofthe vocational effort in each G-7 country are as follows.
Canada. Responsibility for vocational education rests at the provincial level and for the
most part is concentrated at the postsecondary level in community colleges. Vocational education
is classified as short- or long-term. Short-term programs usually do not exceed 1 year, and focus
on entry-level job preparation. Long-term programs, often 2 to 3 years in duration, are moreadvanced and technical in nature. In 1991, 6 percent of 18-year-olds, 10 percent of 19-year-olds,
and 10 percent of 20-year-olds were enrolled full time in long-term vocational programs. In
addition to postsecondary vocational programs, there is also a registered apprenticeship program,which has grown substantially in recent years. Those completing apprenticeship programs have astrong record of obtaining jobs in their trade area.
France. Vocational education begins in grades 8 and 9 for those who are not preparing forpostsecondary education. At the cecondary level, a variety of programs and certificates areavailable that prepare students for either entry- or middle-level supervisory positions. In 1991-92, about 30 percent of students enrolled at the upper secondary level were attending vocationaltechnical programs. Upper secondary vocational programs are offered by several types ofinstitutions: vocational high schools, general or academic high schools, and apprentice trainingcenters. In 1989, about 11 percent of all full-time upper secondary students participated in 1- to
3-year apprenticeship programs.
Germany. Vocational education and training begins at the upper secondary level. In 1991,
74 percent of all upper secondary students were enrolled in a vocational education program,attending either full- or part-time vocational schools, or participating in the "dual system"apartnership between industry and the government that is designed to provide young people with
supervised on-the-job training supported by part-time general and vocational instruction.Approximately 90 percent of young people who complete lower secondary school eventually
enter dual system training. In 1986 (the last year for which data are available), 57 percent of 16-
vii

to 18-year-olds were participating in the dual system. The apprenticeships within the dual systemlast from 2 to 3.5 years.
Italy. Vocational education is focused on the upper secondary grades. Programs areprovided by both the schools and the labor ministry. In 1989-90, 47 percent of upper secondarystudents attended technical schools, which provide 2 years of academic education and 3 years ofoccupational training. In addition, 19 percent of upper secondary students attended vocationalschools, which generally provide 2- to 3-year occupational programs whose curricula are basedupon industry requirements. Outside the education system, a substantial apprenticeship programis designed for youth who have left school.
Japan. Most vocational education occurs at the upper secondary and postsecondary levels,and to an extent through businesses themselves. High schools and vocational training schoolsoffer specialized programs in particular occupational areas. In 1989, 26 percent of high schoolstudents pursued studies in a vocational field. "Miscellaneous schools," which are a type ofvocational training school, offer both upper secondary and postsecondary programs to preparestudents for national licensing examinations in certain fields. These schools enroll approximatelyone-third of all upper secondary graduates and are predominantly postsecondary.
United Kingdom. In England and Wales, vocational education and job training are availableto students at age 16. In 1992-93, 25 percent of 16-year-olds, 20 percent of 17-year-olds, and 11percent of 18-year-olds were enrolled in full-time vocational education. In 1990, 15 percent of16- to 18-year-olds participated in apprenticeship programs leading to vocational qualificationsoffered by the Department of Employment for school leavers. A variety of professional and tradeorganizations also offer vocational certificates, but there are no universally accepted credentials.
United States. Vocational education spans secondary and postsecondary levels in both thepublic and private sectors. At the secondary level, students are able to explore both academic andvocational curricula without being placed in a strict track. Most vocational education takes placein comprehensive high schools, and in 1987 about one-third of all high school graduatescompleted the equivalent of at least four courses in vocational subjects. At the postsecondarylevel, almost one-half of all vocational degrees and awards are granted at private-less-than-2-yearinstitutions. Public 2-year institutions are the next most prominent type of postsecondaryvocational institution, offering about one-third of all vocational degrees and awards.
Cross-National Comparisons
Assuring relatively comparable cross-national data requires care since the distinctivefeatures of vocational education and training systems make analytic equivalence difficult toachieve. Keeping this concern in mind, three indicators are discussed in this reportparticipation rates, vocational student supply and demand, and labor market outcomes forparticipants and completers.
Participation Rates. All G-7 countries produce data on vocational sector participation at theupper secondary and postsecondary levels. The data indicate that some countries focus theirvocational education and training at the upper secondary level, while others do so at thepostsecondary level. The United States and Japan, as compared with the rest of the 0-7, seem todefer vocational training to the postsecondary level and have a high proportion of young adultsparticipating in postsecondary vocational education.
Vocational Student Supply and Demand. This indicator describes the vocational educationand training priorities across countries, as they are reflected in the kinds of programs available,the extent of enrollment in different curricula, and the demand for workers in each field of study.
viii8
Across the G-7, little information can be found on unmet demand for student placement, oroversupply or undersupply of graduate and certificate holders by occupation and field. As aresult, it is difficult to determine whether or not countries encourage student enrollment inoccupational clusters that are in demand and how that demand differs from country to country.
Labor Force Outcomes. Comparisons of labor force outcomes represent ways of estimatingthe success of vocational education and training programs and the success of completers oncethey are in the labor force (especially employment outcomes and earnings). Some countries usenational household surveys (like the Current Population Survey in the United States) to analyzerelationships of employment and earnings to education. However, considerable detail isnecessary to link participation in particular vocational curricula and programs to labor forceoutcomes, and this is rarely available.
The concluding section of the report describes opportunities to improve the quality of dataon each of the indicators. Among the three indicators, data on participation rates in vocationaleducation are most amenable to improvement through cooperative efforts of internationalorganizations like the OECD. Given differences across countries, international organizationstepresent the appropriate forum in which to compare data on vocational education systems and tocontrast trends over time.
ix 9
Table of Contents
Page
Foreword iii
AcknowledgmentsExecutive Summary vii
List of Tables xiiiList of Figures xv
I Introduction 1
Secondary- and Postsecondary-Level Vocational Education and TrainingAcross the G-7: An Elusive Mosaic 2
Purpose of This Report 3Organization of This Report 3
2 Systems of Vocational Education and Training 5International Summaries of Vocational Education for the G-7 Countries 7International Narratives of Vocational Education for the G-7 Countries
Canada 14France 20Germany 28Italy 39Japan 44United Kingdom 52United States 62
Summary and Conclusion 69
3 Cross-National Comparisons of Data on Vocational Educationand Training 71
Factors Constraining Cross-National Comparisons 71Three Key Indicators for International Vocational Education Comparisons 72Status of Cross-National Comparisons for the Key VocationalEducation Indicators 75
Data Available on the Key Indicators 78Enhancing Data Collection and Improving the Quality and Availability of
Comparable Cross-National Data on Key Vocational Education andTraining Indicators 87
Conclusion 88
Appendix A: Sources of Information on Vocational Education andTraining: Panel and Cross-Sectional Studies in G-7 Countries 89
Appendix B: Vocational Education Data Information Sources Contact List 105
Bibliography 115
xr0
List of Tables
Table Page
2.1 Estimated median annual earnings of 1986 trade vocational graduates(short programs) and careertechnical graduates (long programs)working full time, by field of study: 1988 18
2.2 Percentage distribution of young people aged 16-25 in France,by current education or employment status: March 1986 20
2.3 Percentage of upper secondary students in France, by courses ofstudy: 1991-92 23
2.4 Number and percentage of school leavers in France, by participation inapprenticeship and level of certification, by age: 1985 27
2.5 Percentage of young people participating in the educational system inGermany, by age and school type: 1991 30
2.6 Number and percentage of upper secondary students in general and vocationaleducation and in vocational schools in Germany, by type of school: 1991 33
2.7 Percentage distribution of lower secondary graduates in Italy, by education,training status, and program type: 1987-88 40
2.8 Number and percentage of students enrolled in upper secondary vocationaland technical education in Italy, by type of program: 1990-91 41
2.9 Percentage of upper secondary school students in Japan, by type ofprogram: 1989 46
2.10 Percentage distribution of upper secondary students aged 18-19 in Japan,by activity immediately following graduation: 1989 49
2.11 Percentage distribution of students aged 16-18 in the United Kingdomparticipating in further education, by type of program certification:August 1989 55
2.12 Percentage of 16- through 18-year-olds in England, by participation ineducation: 1992-93 (estimated) 56
2.13 Percentage of 16- through 18-year-olds in Great Britain, by participationin education and training schemes: January 1990 57
2.14 Summary of vocational education and training options in G-7 countries 703.1 Selected enrollment and graduation characteristics at upper secondary and
postsecondary levels in educational systems in 0-7 countries: 1988 763.2 Percentage distribution of full-time upper secondary students in G-7
countries, by type of curriculum: 1991 773.3 Number of public and private upper secondary graduates per 100 persons
aged 17 in educational systems in G-7 countries: 1991 793.4 Entering students in full-time public or private postsecondary education per
100 persons aged 18, by type of curriculum: 1991 81
3.5 Rates of participation in vocational education and training in G-7 countries 82
3.6 Student vocational education concentration by type of program, and related
occupational demand in G-7 countries 84
3.7 Labor force outcomes for participants in vocational education and training
in G-7 countries86
xiv
List of Figures
Figure Page
2.1 France: Proportion of enrollments by school level and curriculum, andflows out of the education system at each school level: 1985 21
2.2 Germany: Proportion of enrollments by school level and curriculum 31
2.3 Italy: Education flows 39
2.4 Japan: Status of lower secondary and high school graduates 2 monthsafter graduation by school level: 1989 45
2.5 England and Wales: Participation of 1987 16-year-olds in educationand the !abor force: 1987-89 53
2.6 England and Wales: Status of 1986 16-year-olds 2 years later at age 18 60
2.7 United States: Percentage of 1990 public high school graduates, by numberof credits accumulated in vocational education coursework during grades 9-12 65
2.8 United States: Percentage of less than-4-year vocational degrees andcertificates awarded in 1988-89, by type and control of institution 66
xv 13
Chapter 1
Introduction
At the threshold of the 21st century, policymakers and educators are struggling to ensureAmerica's future economic, competitive strength. The problem was well-framed by the NationalCommission on Excellence in Education a decade ago:
The world is one global village. We live among determined, well-educated, andstrongly motivated competitors. We compete with them for international standingand markets, not only with products but also with the ideas of our laboratories andneighborhood workshops. America's position in the world may once have beenreasonably secure with only a few exceptionally well-trained men and women. Itis no longer. . . . Knowledge, learning, information and skilled intelligence are thenew raw materials of international commerce and are today spreading throughoutthe world. . . . If only to keep and improve on the slim competitive edge we stillretain in world markets, we must dedicate ourselves to the reform of our educationsystem for the benefit of all (National Commission on Excellence in Education1983, 6-7).
The implications of this changing global economy dramatize the increasingly importantlinkages between education and the economy, and raise many questions regarding what studentsare trained to do, and how they are prepared for the world of work.
How can students be best prepared for the rigors of a changing and demanding labormarket?
How can students' skills be harnessed in ways that best promote national economicprosperity?
How can the education system best support efforts to ensure that America can competesuccessfully in the future international marketplace of goods, services, and ideas?
One authority has captured the spirit of the current debate this way:
Over the past decade there has been an emerging consensus that the United Statesneeds to increase both the amount and the quality of education and training itsyoung people receive. It is with respect to the economy, in particular, thateducation is thought to be important: Education and training provide the "rawmaterials" for economic preservation and growth. Specifically, worries about theeducation and training system have to do with providing individual opportunity,promoting prosperity in the national economy, and strengthening the country'sability to compete internationally (Stern 1992, 9).
How are these many objectives to be achieved? The questions are daunting, and theanswers are unclear.
Recent reforms associated with the Perkins Act have invigorated a dialogue betweenvocational education policymakers and practitioners. These efforts have also piqued interest inhow other highly developed countriessome with considerable commitments to vocationaleducation and trainingare addressing issues of education and labor force preparation. Despitereal differences in education systems, in today's global economy all highly industrialized nations
1
14
are working to ensure a strong relationship between education and training and nationaleconomic objectives.
To achieve an appropriate link between schooling and training, developed countries havegenerally focused on postcompulsory educationthe years immediately following basicschooling, during which time students in most countries remain in school, and many at least intheory are preparing for the world of work. But in recent years, many developed countries haveexperienced significant increases in unemployment rates among recent school leavers, and effortsare being made to sharpen postcompulsory training strategies. So it is not surprising that theUnited States, like many of its trading partners, is interested in understanding programs andpolicies supporting the work force preparation of youth in other countries in order to determinehow its own programs and policies might be improved.
Secondary- and Postsecondary-Level Vocational Education and Training Across the G-7:An Elusive Mosaic
In G-7 countries, the majority of youth undergo their initial training for the labor marketafter completing compulsory education. (However, Germany is an exception since compulsoryeducation extends to age 18.) In most of these countries, postcompulsory education has, in fact,become a stage of transitionbetween school and work for many, school and higher educationfor some, and for a father large minority school and unemployment (OECD 1989).
Data from seven nations were reviewed for this report, and although each country is highlydeveloped, the vocational education and training landscape is characterized by very differentpolicies and program arrangements. In some countries, most of the vocational offerings areprovided through the educational system (Canada, France, and the United States). In othercountries, most young people enter apprenticeships, which involve both on-the-job training andpart-time education (Germany). In other countries, the system provides a mix of some school-based programs and some apprenticeship and training programs that are primarily outside theeducation system (Italy and the United Kingdom). In Japan, private businesses play a strong rolein training, although some school-based upper secondary programs are available to students whoare not bound for postsecondary education before they enter the labor market. Each system isdescribed in this report. The general point, however, is that different countries have approachedpostcompulsory education at the upper secondary and postsecondary levels in various ways,reflecting national traditions and culture and different ways of organizing vocational trainingopportunities. The complex structure of each vocational education and training system furtherreflects the fact that programs are serving multiple objectives. The Organization for EconomicCooperation and Development (OECD) notes:
In most countries opportunities for [16- to 19-year-olds] have been traditionallymore varied and scattered than at other levels, usually offered in diverse settings,under different administrations and with strong involvement of enterprises and theprivate sector (OECD 1985b, 43-44).
Vocational education and training are set primarily in schools in some countries, while inothers they are primarily based outside of the school and include a strong on-the-job trainingcomponent. In some countries, vocational education and training take place in formal programsthat provide well-recognized credentials, whereas in other countries such education and trainingare based on an informal arrangement with a school or employer. Selecting an analytical focuswhich sectors to describe (school or nonschool), which levels (upper secondary or uppersecondary and beyond), and which types of programs (formal or nonformal or both)effectivelydefines the complicated matrix of provision and opportunity that constitutes vocational educationand training at the postcompulsory level. To capture the breadth of vocational and training
2 1 5

opportunities across the G-7, one cannot be terribly rigid about each aspect of the analyticalfocus, because in doing so one might miss the essential nature of programs across countries.
Purpose of This Report
This report examines data and data quality on vocational education and training availablefrom the seven highly developed countries that make up the G-7. The Carl D. Perkins Vocationaland Applied Technology Amendments of 1990 (Public Law 101-392, Section 421) mandates thatthe U.S. Department of Education's National Center for Education Statistics (NCES) assessinternational data on vocational skills.
Because data from international sources are scarce, it is difficult to analyze thecompetitiveness of vocational skills. This report focuses on describing and comparing data on thestatus of vocational preparation cross-nationally. Within the limitations of existing datapublished by government sources, this report describes the vocational terrain and the datapertaining to vocational education and training among America and its G-7 partnersthe mosthighly developed, advanced economies in the world.
Moreover, this report describes data that are available through government ministries andrelated sources. It does not attempt any new data analyses and provides only minor reanalyses.Since the data reported here are primarily derived from government sources in each country, it isnot possible to assure that the quality of other countries' data meets the statistical standards ofNCES.
Organization of This Report
This report consists of three chapters and two appendices. Following this introduction,chapter 2 describes and characterizes the vocational education systems in each of the G-7countries. The purpose of the chapter is to describe how each country's vocational education andtraining system is organized and how it is linked to the general education system at the secondaryand postsecondary levels. This chapter is important because it provides a context for determiningwhat is actually being compared in comparisons of data from two countries providing vocationaleducation and training. Readers who only seek a basic understanding of vocational education andtraining in the G-7 countries might just refer to pages 7-13 of this chapter, which provide one-page descriptions of the system in each country. Chapter 3 describes international comparisons ofdata on vocational education between countries; the contextual and programmatic differencesbetween countries; some key indicators that one would want to compare across vocationalsystems; the data that international organizations have compiled regarding these indicators; thedegree to which these key comparisons can be made using existing data; and the dataimprovements that would be necessary to prepare all of these key indicators. Appendix Adescribes surveys and studies in each G-7 country that contain information pertinent toassessments of vocational education and training programs and student labor force outcomes.Although these data sets represent rich analytical opportunities, the results of these surveyswould not necessarily be comparable from country to country. Finally, Appendix B reports thesources of vocational education data that were identified during the course of this study. Giventhat many ministries and government agencies are involved in vocational education and trainingefforts in every G-7 country, this list may prove useful to others working on related comparativeissues.
31G
Chapter 2
Systems of Vocational Education and Training
The years immediately following compulsory education are a stage of transitionbetweenbasic schooling and higher education for some and between school and work for many. In tilt.;most developed countries, youths can take advantage of an array of upper secondary andpostsecondary educational and training options that include a bewildering mosaic of schools,training institutions, business training, and apprenticeship programs.
This chapter describes the vocational education and school-related training programs ineach of the G-7 countries, with a focus on options that are school based at least to some degree.The many programs offered in the United States and other countries by ministries of labor orsocial affairs, for instance, are not discussed in any detail. The common thread here is howprograms are linked to school. The reasons for restricting these narratives in this way are bothpractical and strategicpractical in order to bound the inquiry, and strategic in order to presentdiffering institutional structures across countries in a more uniform fashion.
From country to country, the nature of vocational education and training reflects deepcultural roots, national predispositions, and historic traditions. Vocational program strategies areclosely linked to the priorities of each national educational system.
These systems cannot simply be transplanted from one society to another. Thestrong social valuation of the craft traditions helps to explain why Germans choseto develop apprenticeship. . . . With the highly structured and all-encompassingnature of French formal education, vocational training naturally gravitated to it.The egalitarian values of American society underscore the preference for keepingstudents in the same school and offering vocational subjects to those who want topursue them (Alkin 1992, 1515).
In some G-7 countries, vocational education and training rests largely with the schools,which have acquired responsibility for teaching practical subjects and providing formal jobpreparation. In other 0-7 countries, the predominant training and apprenticeship systems areemployer based. While some countries have elaborate systems of formal vocational credentialingin place, others do not. In some countries, participating in vocational preparation is highlyrespected; in other countries, vocational education is viewed as decidedly inferior to academicpreparation.
This chapter describes the nature of vocational education and training opportunities at theupper secondary level and beyond, emphasizing programs that fall under the jurisdiction ofeducation ministries. The first part of the chapter offers brief descriptions of the vocationaleducation systems in each G-7 country (pages 7-13) for readers who do not need an in-depthdescription. The remainder of the chapter contains extensive narratives for each vocationaleducation system for readers who want more detailed information.
517
' '

Generally, these narratives focus on school-based vocational preparation and training,understanding that such discussions may miss programs for youth who have left school, or forthose who pursue other kinds of training alternatives. The narratives generally focus on what thevocational system looked like during the most recent year for which data are available. Thenarratives also tend to focus on the most common ways of obtaining vocational skills; they arenot intended to exhaustively detail all the methods of training in each country. For the most part,the narratives are organized in a parallel fashion. However, differences among educationalsystems inevitably necessitate different approaches, emphases, and descriptive strategies fromcountry to country.
6 lb

Vocational Education in CanadaSummary
Canadian provincial and territorial governments are solely responsible for education withineach of the ten provinces and two territories. Thus, in Canada there are essentially 12 different andautonomous systems of education. Compulsory education begins at age 5 or 6 and lasts until age15 or 16, varying across the provinces. The central government does not set national educationgoals or mandate a standardized curriculum. But despite decentralization and autonomy, provincialeducation systems share some common characteristics. Education systems consist of three levels:elementary education (serving students aged 5 or 6 to 11 or 13); secondary education (servingstudents aged 12 or 14 to 18); and postsecondary and higher education. Most public secondaryschools are comprehensive. However, in large cities, there are some vocational and occupationalsecondary schools. At the postsecondary level, universities offer degree programs, and communitycolleges offer certificate and diploma programs in both vocational and academic subjects.'
While the organization of vocational education differs among provinces, vocational educationprograms are primarily postsecondary options that are mainly available in community colleges.Postsecondary vocational programs can be classified as either short- or long-term programs. Theshort-term programs, usually not exceeding 1 year,2 focus on entry-level job preparation and basicskills. These programs usually include little or no academic coursewolc and lead to certificates ofcompletion. Long-term programs, usually 2 to 3 years in duration, lead mainly to a diploma.
In 1991, 6 percent of 18-year-olds, 10 percent of 19-year-olds, and 10 percent of 20-year-olds were enrolled full time in a long-term postsecondary vocational program. Over the past twodecades, the number of young people attending long-term vocational programs has grown alongwith the overall growth in postsecondary enrollments. However, the proportion of communitycollege students enrolled full time in vocational programs as opposed to university transferprograms has changed little.
After declining from 1984-88, total participation in short-term postsecondary vocationalprograms (not including apprenticeships) increased by 8 percent from 1989 to 1991. In addition,participation in registered apprenticeship programs increased by 26 percent from 1988 to 1990-91.In 1991-92, 58 percent of those who entered a short-term vocational program successfullycompleted it. It is estimated that two-thirds of registered apprentices complete their program andreceive a qualification, and of these completers, approximately 40 percent receive a "Red Seal"qualification. A "Red Seal" is a qualification recognized throughout Canada that allows its holder topractice that trade in any province. The job placement record of apprenticeship completers is fairlyhigh. Of those who completed an apprenticeship program, 96 percent held a job in their trade areaduring the first year after the program.
1In Canada, community colleges encompass a wide variety of postsecondary nondegree-granting institutions. Theseinstitutions may offer academic (university-transfer) programs, vocational and trade programs, or both.2The exception are apprenticeship programs that may last between 1-5 years.
7
is

Vocational Education in FranceSummary
The French educational system consists of five levels: 1) preschool; 2) primary school(grades 1-5); 3) lower secondary school (grades 6-9); 4) upper secondary/high school (grades10-12); and 5) higher education. Compulsory education extends from age 6 to 16. There is a rangeof widely recognized national certificates and qualifications associated with differing levels ofacademic and vocational attainment. Students begin preparing for the qualifying exams for thesecertificates and qualifications after grades 6 and 7.
In grades 8 and 9, students who are not preparing for postsecondary education have theoption of entering a technological curriculum. Students may begin study for an entry-levelVocational Aptitude Certificate (CAP) while in lower secondary education; for these students, theCAP takes 3 years. Students who have completed lower secondary education can earn a 2-yearCAP. The CAP is a specialized diploma awarded for skill in oneof over 200 trades, and requiresfull-time general and vocational coursework, including on-the-job training. Alternatively, studentswith a lower secondary diploma can enroll in the less specialized 3-year program in order toprepare for a Vocational Studies Certificate (BEP). Rather than being awarded in a specific trade,the BEP is awarded for skills required in one professional, industrial, commercial, administrative,or social sector. There are 40 to 50 BEP specialties.
At the upper secondary level, vocational programs are offered by several types ofinstitutions: vocational high schools, general or academic high schools, and apprentice trainingcenters. In 1991-92,71 percent of upper secondary students were enrolled in general or academicprograms, and 30 percent in vocationaltechnical programs. Among those students pursuingvocational studies at the upper secondary level, 69 percent wereenrolled in a program leading to aBEP certificate.
Within vocational high schools, students can prepare for either a CAP or a BEP certificateor a vocational high school diploma (BP). Both CAP and BEP certificates are designed to preparestudents for skilled blue- and white - collar jobs. The program leading to the BEP requires a lowersecondary diploma, and coursework usually takes between 2 and 3 years to complete. The BEPprepares students for middle-level or supervisory positions. Students who receive high marks onthe BEP examination can transfer to the second year of a general or academic high school to pursuea technical high school diploma (BT) or a technical high school certificate (BTn). The BP requiresa minimum of 4 years of vocational studies (including a 2-year BEP). BP students are required tospend 12-24 weeks working in their field of study with an "in-firm" trainer. The degree isdesigned to lead students directly into skilled white- or blue-collar jobs.
In 1989, the equivalent of 11 percent of all full-time upper secondary students participatedin an apprenticeship program. An apprenticeship contract can last from 1 to 3 years; the length ofthe contract depends upon the profession and the qualification an apprentice ..:s to achieve.Apprenticeships can prepare students for vocational or technological education certificates at boththe secondary and upper secondary levels.
8 20

Vocational Education in Germany3Summary
Responsibility for elementary and secondary education in (former) West Germany restsmainly with the 11 federal states, although they all share a common educational structure.Compulsory education begins at age 6 and lasts 12 years until age 18. Students are required toattend school full time for 9 years. During the last 3 years (or until an apprenticeship is completed),students are only required to attend school part time. Beginning in grade 5, students are trackedinto one of four different types of lower secondary schools: general, intermediate, grammar oracademic, or comprehensive. Since 1976, the first 2 years of lower secondary curricula (grades5 and 6) have been standardized across all schools, enabling students to transfer among the threetypes of schools.
In 1991, 30 percent of lower secondary students (age 10 to 15) attended general lowersecondary schools; 25 percent attended intermediate lower secondary schools; 31 percent attendedacademic or grammar secondary schools; 7 percent attended comprehensive lower secondaryschools; and 6 percent were enrolled in a prevocational (career exploration) program that w,,sindependent of a lower secondary school.
Vocational education and training begins at the upper secondary level (age 15 to 18 or 19). In1991, 74 percent of all upper secondary students were enrolled in a vocational education program.Students can pursue vocational education through full-time or part-time vocational schooling orthrough the dual system. The dual system is a partnership between industry and the governmentthat is designed to provide young people with supervised on-the-job training supported by part-time general and vocational instruction.
More upper secondary students are involved in the dual system than in any other educationalprogram. In 1986, 57 percent of 16- through 18-year-olds were participating in the dual system,compared with 23 percent of students in this age group who were enrolled in a full-time or part-time vocational program only and 21 percent who were enrolled in grammar school at the uppersecondary level. Apprentices and employers enter into a written contract, defining theresponsibilities of each party, the duration of the apprenticeship, and the wages to be paid.Employers release apprentices during the week or give them blocks of time so that they can attendvocational school or classes to fulfill the compulsory school requirement. Students whosuccessfully complete dual-system training emerge with journeyman or skilled worker certificates.The duration of apprenticeships varies from 2 to 3.5 years.
The largest proportion of students in the vocational education system attend part-timevocational schools. This is because these schools are the major provider of in-school training forthe dual system. It is estimated that approximately two-thirds of lower secondary schoolcompleters directly enter the dual system, and 90 percent of young people who complete lowersecondary school eventually participate in dual-system training.
3This summary describes the educational system of the former West German Republic.
219
Vocational Education in ItalySummary
In Italy, students are required to attend school for 8 years from age 6 to 14, and thecompulsory education system includes elementary grades 1 through 5, and lower secondary grades6 through 8. Despite periodic reforms, the education system has remained quite centralized at alllevels. During the compulsory grades, students fellow a national standardized academiccurriculum.
Upper secondary education includes a broad array of institutional typesacademic schools,art institutes, technical schools, and vocational schools. Vocational education and training beginsafter compulsory education. Within the education system, there are upper secondary vocational andtechnical schools administered by the State Ministry of Education. In 1987-88, 81 percent of lowersecondary graduates entered upper secondary school, and 71 percent of these students enrolled invocational and technical schools. Outside the education system, there are other vocational optionsfunded by the Ministry of Labor and administered by regional governments. Three of theseoptionsapprenticeships, trainingwork contracts, and basic vocational trainingare targeted atyoung people beyond compulsory schooling age.
Technical Schools: In 1989-90, nearly 47 percent of upper secondary school studentsattended one of nine types of technical schools. Technical school programs are 5 years in duration.During the first 2 years, the curricula are fairly similar to upper secondary classical academiceducation. During the last 3 years, while the curricula still contain some general education, thefocus is mostly on the student's area of technical concentration. Upon completion of the 5-yearprogram, students sit for an upper secondary technical school diploma examination. The diplomaenables a student to enter intermediate-level employment in the public and private sectors or inhigher education.
Vocational Schools: In 1989-90, 19 percent of upper secondary students attended one offive types of vocational schools. These vocational programs are tightly matched to labor marketrequirements and entry qualifications in each sector, and curricula are based upon industryrequirements. Programs usually last 2 to 3 years and are designed to train specialized workers incertain occupational areas. In order to obtain a qualifying certificate, students must take anexamination testing both general education skills and knowledge in the occupational area of study.The qualification certificate allows a student to enter the 4th year of the new 5-year vocationalprogram or a 2-year specialized vocational training course, but not a university or institution of
higher education.
The students in vocational and technical schools are in addition to youth who participate invocational training outside the education system. In 1987-88, 12 percent of lower secondaryschool graduates entered apprenticeships or regional vocational training programs; 35 percententered technical schools; and 22 percent entered vocational schools.
Of the 1.3 million young people participating in nonschool-based vocational programs,43 percent were apprentices; 39 percent held trainingwork contracts; and 18 percent were enrolledin vocational training courses.
10 2
Vocational Education in JapanSummary
Japan has a centralized educational system characterized by a uniform, substantially academiccurriculum. Japanese schools operate on the 6-3-3-4 model: 6 years of elementary school, 3 yearsof middle school, 3 years of high school, and 4 years of postsecondary education. The first 9 yearsof elementary and middle school are compulsory. During these years, students are not grouped byability, and they attend schools assigned to them based on their place of residence. At the highschool level, schools play a major role in placing students in the work force and postsecondaryschools.
Vocational education is predominantly a postcompulsory activity. Formal entry-level andadvanced-level training programs are offered within upper secondary and postsecondary schoolsthrough Department of Labor employment training programs and within businesses. In addition,private businesses play a strong role in providing training.
Vocational training occurs in two types of schools: high schools (comprehensive andvocational), and miscellaneous schools (vocational training schools), which offer specializedtraining in one or more occupational areas. Over the past decade, the overall proportion of highschool students pursuing studies in an occupational field has decreased slightly from 32 percent in1980 to 26 percent in 1989.
Miscellaneous schools offer both entry-level (upper secondary) and advanced-level(postsecondary) vocational programs in specific occupational fields, providing a type of trainingnot available in high schools and universities. Training is often fairly specific and aimed atpreparing students for national licensing examinations. The majority of these schools offer onlyadvanced-level (postsecondary) programs, and most are private. In 1990, 77 percent of thestudents enrolled in miscellaneous schools were taking advanced courses, and 88 percent of theseschools were private. These schools enroll approximately one-third of all upper secondarygraduates.
Special training schools, a type of miscellaneous school, have programs that must be at least1 year in duration, whereas other miscellaneous schools have programs that generally last fromseveral weeks to a year. Although there are special training schools at the upper secondary level,most of these schools offer postsecondary programs: 75 percent of students in special trainingschools are enrolled at the postsecondary level. Upper secondary special training schools offer3-year programs to lower secondary school graduates, while special training colleges (advanced-level special training s, hools) offer 2-year postsecondary vocational programs to high schoolgraduates.
The Ministry of Labor operates public training centers that offer basic training, skillimprovement training, programs offering retraining for new occupations, and instructor training.Most students in these centers are older workers who want to acquire a national trade certificate ortrain for new jobs. In addition, approximately 150 vocational schools are operated by otherministries.
Vocational Education in the United Kingdom4Summary
Compulsory education in England and Wales spans 11 years for students, from age 5 until
age 16. The education system is highly decentralized, with responsibility for management andcontrol resting mainly with the local education authorities (LEAs). Most LEAs adopt two-tieredgrade-level configurations, consisting of 6 years of primary school and 5 years of lower secondary
school. Approximately 90 percent of secondary students attend nonselective, comprehensivesecondary schools. The remaining students attend selective schools: grammar schools (foruniversity preparation), private institutions, grant-maintained schools, or secondary technicalschools (for transition to work).
Vocational education and training are available to students at age 16. Programs are offered
both within the educational system, through institutions of further education, and-outside the
system. (In England and Wales, postcompulsory education consists of further and highereducation. Further education takes place at the secondary and postsecondary levels and includes
both academic and vocational programs. These programs reach standards equivalent to A-level or a
BTEG National Diploma or Certificate. Higher education encompasses all coursework, leading to
standards above these qualifications.) For the most part, institutions of further education offer
programs that prepare students for vocational qualification examinations. However, they alsoprovide some academic programs that prepare students for university-qualifying examinations. In
1989-90, 15 percent of students aged 16-18 were enrolled in further education, with a majority of
full-time further education students preparing for vocational qualifications.
There are several vocational training programs outside the education system. For example,the Department of Employment administers Youth Training (YT), an apprenticeship programavailable to all 16- and 17-year-olds who are not enrolled in school. YT apprenticeships lead toNational Vocational Qualifications. In addition, trade guilds operate apprenticeship programs, and
some of the larger corporations and businesses provide on-the-job training.
In England and Wales, a number of government agencies and some professionalorganizations offer vocational certificates designed to parallel the academic certification system.Within this system, however, no single body confers a certificate that is predominant.
In 1992-93, 25 percent of 16-year-olds, 20 percent of 17-year-olds, and 11 percent of
18-year-olds in the United Kingdom were enrolled in full-time vocational education. In 1990,
15 percent of 16- to 18-year-olds were enrolled in Youth Training Schemes (YTS), the predecessor
to YT. Data show increasing participation in full-time education. In 1987, 41 percent of 16-year-
olds were enrolled full time in school, compared with 58 percent of 16-year-olds in 1991.
However, the participation of 16-year-olds in YT (or previously YTS) declined from 1987 to
1991.
4The various education authorities within the United Kingdom differ in the way they structure their education and
training systems and the way they collect education data. This narrative focuses on England and Wales, except when
noted.
12 24
.Ablannamarli-

Vocational Education in the United StatesSummary
Compulsory education requirements vary across the decentralized, state-run sy stems in theUnited States, but generally run from around age 6 to 16. There are various grade-level patterns inschools, two of which are particularly common: kindergarten plus 6 years of elementary school,followed by 3 years of junior high school, and 3 years of high school; or kindergarten plus 4 or 5grades, a 3- or 4-year middle school, and a 4-year high school. The vast majority of studentsattend publicly supported nonselective schools, while about 10 percent of elementary andsecondary students attend private institutions, mostly run by religious denominations.
Vocational education is an integral part of the larger education system in the United States,spanning secondary and postsecondary levels and public and private sectors. Secondary vocationaleducation is offered in grades 7 through 12, chiefly through the public school system. Secondarystudents are not generally placed in strict tracks, as is the case in other countries. Instead, they areable to explore various curricula in both vocational and academic education. A unique aspect of thevocational education system in the United States is that it provides students with a second chancethat is, the opportunity to change the course of their education from academic to vocational or viceversa. The number and type of vocational course offerings vary by district and even by school.However, general vocational courses (e.g., industrial arts, home economics) are usually taughtthroughout the secondary years, while occupationally specific courses are generally reserved forgrades 10 through 12.
At the secondary level, public vocational education is delivered through several differentinstitutional arrangements. The most common types include comprehensive high schools, areavocational schools, and full-time vocational high schools. Comprehensive high schools offer bothacademic and vocational courses, and serve students who have a broad range of academic andcareer goals. The vast majority of instruction in vocational education takes place in comprehensivehigh schools, although most of these schools focus on preparing students to pursue an academicpostsecondary degree after high school. Area vocational schools provide a centrally locatedvocational facility and are shared by two or more sending high schools. Students attend the areavocational school for part of the day in order to receive their vocational education, while pursuingtheir academic studies at their home high school. Full-time vocational high schools offer a completeprogram of academic and vocatio aal studies with a focus on vocational coursework.
Postsecondary vocational programs generally lead to an associate degree or certificate.Private, for-profit schools offer a variety of vocational programs generally ranging from very shortcertificate programs (6 weeks, for example) to 2-year associate degree programs. Public 2-yearinstitutions typically offer 2-year associate degree programs and certificate programs. PI!';lic
vocationaltechnical institutes generally do not award associate degrees and are more likely toprovide certificate programs lasting 1 year or less. Public 2-year institutions generally offerprograms of study in both academic and vocational areas, while vocationaltechnical institutes andprivate, for-profit schools almost exclusively offer vocational education.
In 1987, about 98 percent of all public high school graduates completed at least one course invocational education during their high school careers. About one-third of all 1987 ptfulic highschool graduates completed the equivalent of four courses in any vocational area that met for oneperiod per day for 1 year. In the fall of 1990, about 6 percelit of the entire U.S. population aged18-34 were taking vocational courses. Almost one-half of these students were studying at public2-year colleges.
13
Vocational Education in Canada
Canadian provincial and territorial governments are solely responsible for education withineach of the ten provinces and two territories. Thus, within Canada there are essentially12 different and autonomous systems of education. In this narrative, a general countrywidedescription is provided, and when available, countrywide data are presented. However, in order to
capture the distinctive qualities and differences between the provincial system of education andtraining, this narrative describes in detail the vocational education systems in the three mostpopulous provinces.
Compulsory education in Canada begins at age 5 or 6 and lasts until age 15 or 16, varyingacross the provinces. The central government does not set national education goals or mandate a
national standard curriculum. But despite decentralization and autonomy, provincial educationsystems share some common characteristics.5 Education systems consist of three levels:
elementary education (serving students ages 5 or 6 to 11 or 13); secondary education (serving
students ages 12 or 14 to 18); and postsecondary and higher education. In addition to public
elementary, secondary, and postsecondary institutions, there are a variety of special schoolsincluding private and proprietary schools and schools for Indians and Innuit. Within eachprovince, public education is administered by the Ministry of Education.
Most public secondary schools are comprehensive. However, in large cities there are somevocational and occupational secondary schools. At the postsecondary level, universities offer
degree programs and community colleges offer certificate and diploma programs in both vocational
and academic subjects.6
Organization of Vocational Education
While the organization of vocational education differs among provinces, vocational educationprograms are primarily postsecondary options that are mainly available in community colleges.Currently, however, there is a movement within secondary education to create linkages between
school and work or postsecondary education and to strengthen secondary vocational programs.
Postsecondary vocational programs can be classified as either short- or long-term programs.
The short-term programs, usually not exceeding 1 year,7 focus upon entry-level job preparation
and basic skills. These programs usually include little or no academic coursework in the curriculum
and lead to certificates of completion.8 Long-term programs, usually 2 to 3 years in duration, lead
mainly to a diploma.9 Both short- and long-term programs are usually provided in community
colleges.
5National organizations, such as the Canadian Education Association, share information on education issues which
has led to some uniformity across provinces. As part of the Council of Ministers of Education, Canada, the
ministers of education from each province and territory meet regularly to share information and undertake joint
projects.61n Canada, community colleges encompass a wide variety of postsecondary nondegree-granting institutions. These
institutions may offer academic (university-transfer) programs, vocational and trade programs, or both.
-/ the exception are apprenticeship programs that may last between 1-5 years.8These programs are often referred to as vocational and trade programs.9These programs are often referred to as careertechnical programs.
2 614
Short-term vocational programs include preemployment and preapprenticeship programs,registered apprenticeship programs, prevocational academic upgrading programs, skill upgradingprograms, basic job readiness training programs, vocational orientation programs, and specialtraining programs.
Preemployment or preapprenticeship vocational programs provide, on average,40 weeks of entry-level skill training in a particular occupational area or prepare students toenter an apprenticeship program.
Registered apprenticeship programs combine work experience with short periods ofclassroom instruction on a technical subject. Approximately 80 percent of apprenticeshiptraining occurs on site. Apprenticeships last between 1-5 years depending upon the trade.
Prevocational academic upgrading or basic training for skill developmentprograms are designed to enhance the math, science, and communication skills ofstudents to prepare them for entry into a training program or for employment. The durationof participation -"?..pends upon the students' skills upon entry.
Skill uk;grading programs are designed to keep workers up-to-date on new advancesin their fields. Programs range from 2 to 20 weeks in duration.
Basic job readiness training programs have multiple components and are designedfor people wanting to enter or reenter the labor force. The program combines basicacademic refresher courses with job readiness skills and career exploration. Theseprograms vary from 8 to 40 weeks in duration.
Vocational orientation programs are career exploration programs designed to assiststudents in selecting an occupational area. Programs vary from 8 to 12 weeks in duration.
Special training programs are industry-specific training programs customized to trainworkers for specific industry needs. The duration of training is usually short.
Vocational Education in Selected Provinces
Because education is a provincial responsibility, education and vocational training systemsdiffer among provinces. The following section describes vocational training systems in the threelargest provinces, British Columbia, Quebec, and Ontario, where 74 percent of Canada'spopulation live (Statistics Canada and the Council of Ministers of Education 1990). These briefnarratives serve as examples of training systems in Canada and show the variation amongprovinces.
British Columbia
In British Columbia, there are no provincial vocational or technical training programs at theelementary and secondary school level. However, local school districts have developed their owncareer preparation programs. To receive funding from the province, the programs must beapproved by the Board of Education and must include either a work-experience component or apreapprenticeship class. In 1992-93,90 percent of school districts had programs operating in their
district; 59 percent of all schools offered programs; and approximately 20 percent of 11th and 12thgraders participated in these programs.lo
At the postsecondary level, students can pursue vocational training in a work setting throughapprenticeships or within the education system in colleges. Apprenticeships lead to tradequalifications, and occupational programs in colleges lead to college diplomas)1 Students withcollege diplomas can pursue a 1-year advanced training program in an occupational subject. In1989-90, 21 percent of students in colleges in British Columbia were enrolled in occupationalprograms (Ministry of Advanced Education, Training, and Technology 1990).
In British Columbia, 78 percent of college graduates in occupational fields were employed9 months after graduation. Of those graduates who were seeking jobs (either unemployed oremployed), 91 percent had held a training-related job in the first 9 months following graduation(Ministry of Advanced Education, Training, and Technology, College Student Outcome Report1991).
Quebec
In Quebec, vocational programs are offered at both the secondary and postsecondary level.Following compulsory education (after age 16), stucents have two vocational program optionswithin comprehensive high schools. The longer program, averaging 1,350 hours of vocationaltraining, leads to a secondary school vocational diploma. In this program, students are prepared forhighly skilled trades that require theoretical knowledge and manual skills. Currently, there are 38programs leading to a secondary school vocational diploma, ranging from accounting to programsin allied health fields and automotive mechanics. The shorter program, usually providing less than900 hours of vocational training, leads to a secondary school vocational certificate. The emphasisin this program is on providing students with the manual skills required for a specific tradeoccupation. There are 12 vocational programs, ranging from home health aides to roofing andrestaurant services, that lead to a secondary school vocational certificate (Ministere de l'Education,1992-1993 Program Catalogue 1992). Students with vocational diplomas and certificates canregister for additional training in a related field and receive an "Attestation of VocationalSpecialization." Only a small proportion of students take vocational training at the secondary level.In 1991-92, of the students who completed the last year of secondary school or the 1 1 th grade,only 5 percent entered a vocational program.
At the postsecondary level, 3-year vocational programs are offered along with 2-yearacademic (pre-university) programs at community colleges.12 Students must possess asecondaryschool certificate or a secondary school vocational diploma to enter these programs, but thosewithout a diploma may be conditionally admitted, provided they pass certain courses. Technical orvocational programs usually last 3 years and lead to a diploma of college studies. The curricula ofthese programs involve both coursework in the occupational area as well as general study corecourses. In addition, there are some shorter term programs leading to certificates in vocationalareas offered within the colleges that have less strict entrance requirements and little or no generaleducation core requirements.
10Telephone interview with Velma Haslin, British Columbia Department of Education, May 25, 1993.1 'Canadian colleges are similar to community colleges in the United States. They offer 2-year programs in
occupational and academic subjects serving both an occupational training and a university-transfer function.
12Qu6bee community colleges, referred to as comprehensive colleges of general and vocational education (CEGEP),
are unique in that they are a required step in the higher education process. Students wishing to enroll in a universitymust complete a 2-year academic program at a CEGEP.
16
28
Ontario
In Ontario, 10th-grade students choose a "stream." There are three types of streams: 1)advanced or college prep (80-90 percent of students choose this stream while fewer than 20percent go on to a university); 2) generalthis stream emphasizes the application and acquisitionof skills and prepares students for community colleges; and 3) basicthis stream is for studentsinterested in working directly after high school and emphasizes life skills and personal skills.
At the secondary level, students may take vocational courses as electives in high school.Even in districts where there is a vocational high school, students must take the general corecurriculum, enrolling in vocational courses as electives. Two programs are offered at the secondarylevel that expand vocational education opportunities. The first is a program linked to thecommunity colleges. Students participating in this program fulfill their general requirements at thehigh school but take electives at a nearby community college. The second program is the secondaryschool workplace apprenticeship program, which allows secondary students to enter into anapprenticeship as long as they complete their core curriculum requirements. However, as in theother provinces, vocational programs are primarily postcompulsory and are offered withinOntario's community college structure.
Participation in Vocational Education and Student Outcomes
In 1991, 6 percent of 18-year-olds, 10 percent of 19-year-olds, and 10 percent of 20-year-olds were enrolled full time in a long-term postsecondary vocational program (data from StatisticsCanada, September 1993). Over the past two decades, the number of young people attending long-term vocational programs has grown along with the overall growth in postsecondary enrollments.However, the proportion of community college students enrolled full time in vocational programsas opposed to university-transfer programs has changed little. In 1970-71, 71 percent ofcommunity college students participated in a long-term vocational program; in 1991, 68 percent ofcommunity college students did so (Council of Ministers of Education, Canada, February 1993).
After declining from 1984 to 1988, total participation in short-term postsecondary vocationalprograms (not including apprenticeships) increased by 8 percent from 1989 to 1991. Participationin registered apprenticeship programs followed a similar pattern: the numbers of participants rosein recent years after declining from 1984 through 1988 (Council of Ministers of Education, Canada1993).13 In 1987-88, nearly 48,000 people participated in registered apprenticeships, while in1990-91 there were more than 60,000 apprentices, an increase of 26 percent. The short-termpostsecondary vocational programs that attracted the most participants were preemploymentprograms (30 percent of short-term postsecondary vocational program participants); programs forregistered apprentices (23 percent); and prevocational academic upgrading courses (19 percent)(data from Statistics Canada, October 1993). About 60 percent of short-term vocational programparticipants were enrolled in programs that lasted less than 30 weeks; the rest were enrolled inprograms that were 30 weeks or more in duration.
In 1991-92, 58 percent of those who entered a short-term vocational program successfullycompleted it. In 1988, the median annual earnings of 1986 careertechnical graduates were$22,000; however, tradevocational graduates tended to earn less. In 1988, the median earnings of1986 tradevocational graduates were $19,000 (table 2.1).
13Declines in apprenticeships have not been even across fields of study. Between 1984-85 and 1989-90, a largedecline in participation was seen in the welding trade (22 percent), whereas the number of registered apprentices incooking increased 34 percent (Council of Ministers of Education, Canada, February 1993).
17 2 9

Tab
le 2
.1E
stim
ated
med
ian
annu
al e
arni
ngs
of 1
986
trad
e-vo
catio
nal g
radu
ates
(sh
ort p
rogr
ams)
and
car
eer-
tech
nica
l gra
duat
es (
long
pro
gram
s) w
orki
ng f
ull t
ime,
by
fiel
d of
stu
dy: 1
988
Shor
t-te
rm p
rogr
ams:
Tra
de -
voc
atio
nal g
radu
ates
Med
ian
earn
ings
($ C
anad
ian)
Lon
g-te
rm p
rogr
ams:
Car
eer-
tech
nica
l gra
duat
esM
edia
n ea
rnin
gs($
Can
adia
n)
Fiel
d of
stu
dy:
Tot
al$1
9,00
0$2
2,00
0A
s13
,000
18,0
00B
usin
ess
and
Com
mer
ce16
,000
19,0
00E
ngin
eeri
ng a
nd A
pplie
d Sc
ienc
es21
,000
23,0
00M
athe
mat
ics
and
Com
pute
r Sc
ienc
e21
,000
23,0
00H
ealth
Sci
ence
s an
d re
late
d20
,000
27,0
00H
uman
ities
rel
ated
17,0
00N
atur
al S
cien
ces
and
Prim
ary
Indu
stri
es20
,000
21,0
00So
cial
Sci
ence
s an
d Se
rvic
es18
,000
20,0
00
Not
app
licab
le.
SOU
RC
E: W
arre
n, C
lark
, The
Cla
ss o
f 86
: A C
ompe
ndiu
m o
f Fi
ndin
gs (
Otta
wa:
Em
ploy
men
t and
Im
mig
ratio
n C
anad
a, 1
991)
.
31
Approximately two-thirds of registered apprentices complete their program and receive aqualification, and of these completers about 40 percent receive a "Red Seal" qualification. Thisqualification is recognized throughout Canada and allows its holder to practice that trade in anyprovince (Employment and Immigration Canada and Statistics Canada 1990). The job placementrecord of apprenticeship completers is fairly high. Of those who completed an apprenticeshipprogram:
96 percent held a job in their trade area during the first year after the program;
90 percent held jobs in their trade area 2 and 3 years after the program; and
85 percent of those with jobs in their trade area were employed at the journey level(Employment and Immigration Canada and Statistics Canada 1990).
34-
19
Vocational Education in France
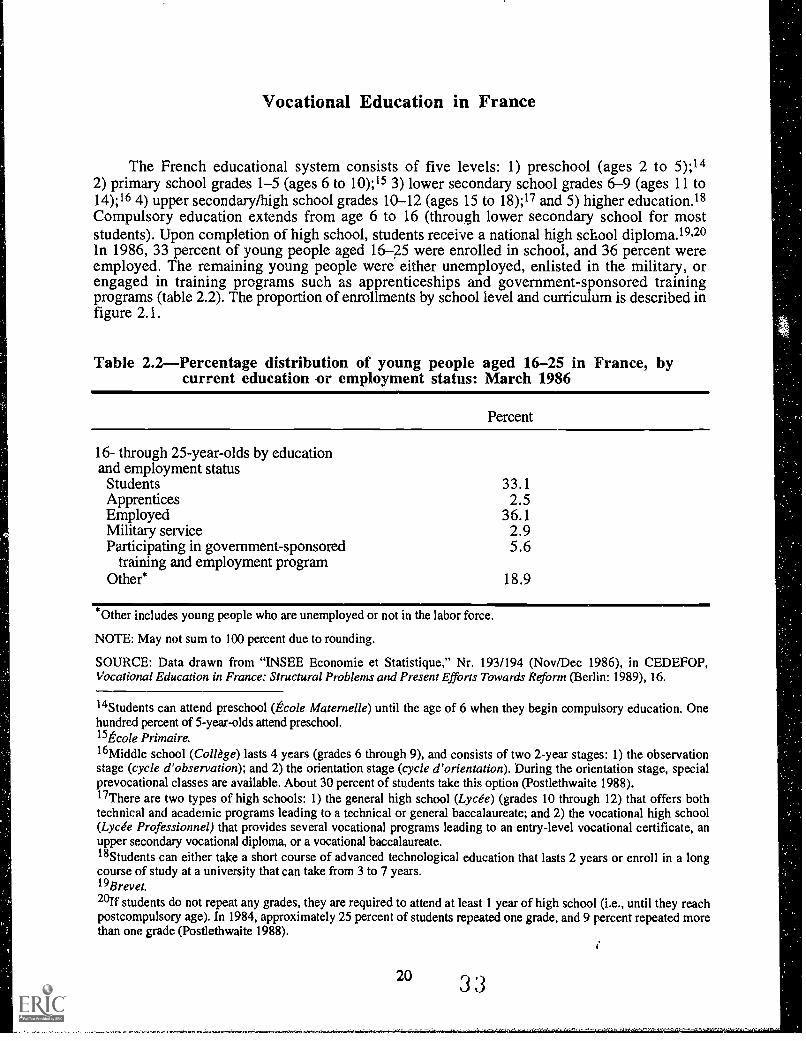
The French educational system consists of five levels: 1) preschool (ages 2 to 5);142) primary school grades 1-5 (ages 6 to 10)05 3) lower secondary school grades 6-9 (ages 11 to14);16 4) upper secondary/high school grades 10-12 (ages 15 to 18);17 and 5) higher education.18Compulsory education extends from age 6 to 16 (through lower secondary school for moststudents). Upon completion of high school, students receive a national high school diploma.19,20In 1986, 33 percent of young people aged 16-25 were enrolled in school, and 36 percent wereemployed. The remaining young people were either unemployed, enlisted in the military, orengaged in training programs such as apprenticeships and government-sponsored trainingprograms (table 2.2). The proportion of enrollments by school level and curriculum is described infigure 2.1.
Table 2.2Percentage distribution of young people aged 16-25 in France, bycurrent education or employment status: March 1986
Percent
16- through 25-year-olds by educationand employment status
Students 33.1Apprentices 2.5Employed 36.1Military service 2.9Participating in government-sponsored
training and employment program5.6
Other* 18.9
*Other includes young people who are unemployed or not in the labor force.
NOTE: May not sum to 100 percent due to rounding.
SOURCE: Data drawn from "INSEE Economie et Statistique," Nr. 193/194 (Nov/Dec 1986), in CEDEFOP,Vocational Education in France: Structural Problems and Present Efforts Towards Reform (Berlin: 1989), 16.
14Students can attend preschool (Ecole Maternelle) until the age of 6 when they begin compulsory education. Onehundred percent of 5-year-olds attend preschool.15Ecole Primaire.16Middle school (College) lasts 4 years (grades 6 through 9), and consists of two 2-year stages: 1) the observationstage (cycle d'observation); and 2) the orientation stage (cycle d'orientation). During the orientation stage, specialprevocational classes are available. About 30 percent of students take this option (Postlethwaite 1988).17There are two types of high schools: 1) the general high school (Lycie) (grades 10 through 12) that offers bothtechnical and academic programs leading to a technical or general baccalaureate; and 2) the vocational high school(Lycee Professionnel) that provides several vocational programs leading to an entry-level vocational certificate, anupper secondary vocational diploma, or a vocational baccalaureate.18Students can either take a short course of advanced technological education that lasts 2 years or enroll in a longcourse of study at a university that can take from 3 to 7 years.19Brevet.20If students do not repeat any grades, they are required to attend at least 1 year of high school (i.e., until they reachpostcompulsory age). In 1984, approximately 25 percent of students repeated one grade, and 9 percent repeated morethan one grade (Postlethwaite 1988).
203 3
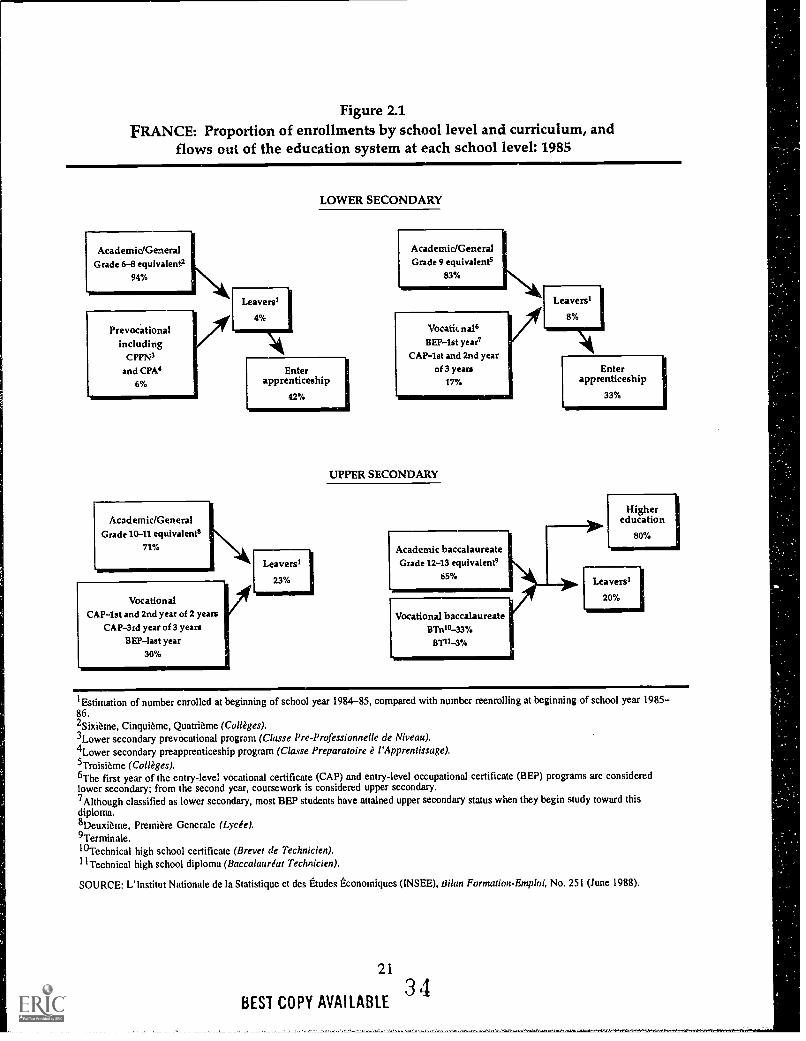
Figure 2.1FRANCE: Proportion of enrollments by school level and curriculum, and
flows out of the education system at each school level: 1985
AcademidGeneralGrade 6-8 equivalent;
94%
Prevocationalincluding
CPPN3
and CPA'6%
Academic/GeneralGrade 10-11 equivalents
71%
LOWER SECONDARY
Enterapprenticeship
42%
VocationalCAP -1st and 2nd year of 2 years
CAP-3rd year of 3 yearsBEP-last year
30%
Academic/GeneralGrade 9 equivalents
83%
1110111111111
Leavers1
8%Vocatit.nals
BEP -1st yeag
CAP -1st and 2nd yearof 3 years
17%
UPPER SECONDARY
Enterapprenticeship
33%
Academic baccalaureateGrade 12-13 equivalents
65%
Vocational baccalaureateBTnls-33%
BT11-3%
Highereducation
80%
Leavers1
20%
lEstimation of number enrolled at beginning of school year 1984-85, compared with number reenrolling at beginning of school year 1985-86.2Sixierne, Cinquieme, Quatrieme (Colleges).3Lower secondary prevocational program (Classe Pre-Professionnelle de Niveau).4Lower secondary preapprenticeship program (Clam Preparatoire e l'Apprentissage).5Troisieme (Colleges).6The first year of the entry-level vocational certificate (CAP) and entry-level occupational certificate (BEP) programs are consideredlower secondary; from the second year, coursework is considered upper secondary.7Although classified as lower secondary, most BEP students have attained upper secondary status when they begin study toward thisdiploma.8Deuxieme, Premiere Generale (Lycie).9Terminale.1°Technical high school certificate (Brevet de Technicien).I I Technical high school diploma (Baccalaureat Technicien).
SOURCE: L' Institut Nationale de la Statistique et des Etudes Economiques (INSEE), titian Formation-Emploi, No. 251 (June 1988).
21
3BEST COPY AVAILABLE
There is a range of widely recognized national certificates and qualifications that certifydifferent levels of academic and vocational attainment. Students begin preparing for the qualifyingexams for these certificates and qualifications after the "observation stage" of lower secondaryschool (sixth and seventh grades). Placement in an academic track at this point requires selectionby school counsels (administrators, teachers, parents, students, and guidance counselors).Students who are not selected to pursue academics are effectively tracked into vocational programs.In the eighth grade, students can enroll in prevocational studies leading to an entry-level vocationalcertificate.
Clear divisions exist between school-based and nonschool-based vocational education andtraining. In-school vocational programs are the responsibility of the Ministry of Education;nonschool training programs fall under the jurisdiction of the Ministry of Labor, with support fromthe National Vocational Training Delegation and Regional Vocational Training Delegations.
Vocational Education Options Within the Educational System
Lower Secondary School Options2'
In the last 2 years of lower secondary school (eighth and ninth grades), students have severalvocational options. Within lower secondary schools, students can participate in a prevocationalprogram (CPPN),22 or they can enroll in a preapprenticeship program (CPA).23 These programsinvolve part-time general and vocational studies along with part-time on-the-job training. However,they are considered marginal options for students and will soon be phased out.24 Instead, studentshave the option of taking an alternative technological curriculum within a lower secondary schoolor a vocational high schoo1.25 These students may begin study while in lower secondary for anentry-level Vocational Aptitude Certificate (CAP).26 For these students the CAP takes 3 years.Students with a lower secondary diploma can earn a 2-year CAP at the upper secondary leve1.27The CAP is a specialized diploma awarded for skill in one of over 200 trades. A lower secondarydiploma qualifies a student to enter a program in a vocational high school leading to an uppersecondary Vocational Studies Certificate (BEP).28 The 3-year BEP program is less specialized thanthe CAP. It is awarded for vocational skills not in a specific trade, but in a professional, industrial,commercial, administrative, or social sector. There are 40 to 50 BEP specialties.
21College.22Classe Pre-Professionnelle de Niveau (CPPN).23Classe Preparatoire e l'Apprentissage (CPA).241n general, the lowest 20 percent of academic performers (not including those in special education courses) weretracked into these prevocational programs.25Lycee Professionnel.26Certificat d'Aptitude Professionnelle (CAP).27 Brevet des Colleges. Parents often prefer the alternative technological curriculum within middle schools. Althoughit is the same curriculum, most parents want to avoid having their children labeled as "vocational."28Brevet d'Enseignement Professionnelles (BEP). Both the CAP and BEP are terminal secondary degrees. Somestudents, however, receive a CAP prior to earning a BEP.
22
3

Upper Secondary School Options
At the upper secondary level, vocational programs are offered by several types of institutions:vocational high schools,29 general or academic high schools,30 and apprentice training centers.31In 1991-92. 71 percent of upper secondary students were enrolled in general or academicprograms, with 30 percent in vocationaltechnical programs (table 2.3). Among those studentspursuing vocational studies at the upper secondary level, 69 percent were enrolled in a programleading to a BEP.
Table 2.3Percentage of upper secondary students in France, by courses ofstudy: 1991-92
PercentEnrolled
Upper secondaryGeneral or academic 70.5Vocationaltechnical 29.5
Total upper secondary 100 . 0
Upper secondary vocational enrollmentsby certification program type 100.0Vocational certificate (CAP)1 12.6Occupational certificate (BEP) 69.4Vocationaloccupation certificate2 0.7Vocational high school diploma (BP) 17.4
lIncludes third-year CAP students who began during lower secondary (for these students, the first two years areconsidered lower secondary) and first- and second-year CAP students who began after receiving a lower secondarydiploma.2CAP and BEP combined.
NOTE: May not sum to 100 percent due to rounding.
SOURCE: Ministere de L'Education Nationale, "Effectifs du Second Degre: Public + Prive 1991-92," Noted'Information, 92.08, Tableau I, 4.
Within vocational high schools, students can prepare for a CAP or a BEP. Both certificatesare designed to prepare students for skilled blue- and white-collar jobs or a vocational occupationcertificate32 in one of 21 career areas. Vocational high school students can also work toward avocational high school diploma (BP).33
2914cee Professionnel.30Lycee.
31 Centre de Formation d'Apprentis (CFA). The status of vocational education causes many to worry that theseoptions may lose their importance as a training ground for skilled labor and may become a remedial option for thosenot performing well in the academic stream (CEDEFOP 1989).32Mention Complementaire au CAP et BEP.33Baccalaureat Professionnel.
233G

As noted, for students who did not attain lower secondary diplomas, the vocational programleading to the CAP requires 3 years of full-time general and vocational coursework, including on-the-job training. It only takes 2 years for students who have lower secondary diplomas. Graduatesof CAP or BEP programs who do well in both vocational and general studies can reenter thegeneral education system at the 10th-grade level and attend an academic high school.34 Further, astudent who receives high marks on the BEP qualification exam has the option of transferring tothe second year of high schoo135 in order to pursue a technical high school diploma (BT)36 or atechnical high school certificate (BTn).37
The BP program is a more advanced vocational qualification. It requires a minimum of 4years of vocational studies (including a 2-year BEP). Vocational diploma students are required tospend 12-24 weeks working in their field of study with an "in-firm" trainer. The degree isdesigned to lead students directly into skilled white- or blue-collar jobs.
Within general or academic high schools, students can pursue programs leading to technicalhigh school diplomas (BT) and technical high school certificates (BTn). In addition to generalacademic courses, students in these programs acquire specialized training that directly preparesthem for an occupation (most programs train students in modern technologies). The technicalcertificate requires 1 year of high school coursework and specialization in particular occupationalfields. However, very few students pursue technical certificates (Ambassade de France 1992). Thetechnical high school diploma requires 3 years of high school in order to prepare for the technicalhigh school diploma examination. These qualifications prepare students for supervisory staffpositions.
Also, at age 16, postcompulsory upper secondary students can enter an apprentice trainingcenter where they can complete work toward a CAP while apprenticing. In 1985, of those studentswho took the vocational certificate examination, 45 percent of apprentices and 56 percent ofvocational high school students successfully passed (CEDEFOP 1989).
A principal education goal of the French government is to have 80 percent of its studentsgraduate with high school diplomas by the year 2000. In 1990, 39 percent of students aged 18-19received a high school diploma (Ambassade de France 1991). There are three types of diplomas: 1)the general or academic diploma;38 2) the technical diploma; and 3) the professional diploma.39 In1990, 50 percent of students in the last year of upper secondary (typically 18- through 19-year-olds) sat for either the general, technical, or professional diploma exams. Seventy-five percent ofthose taking the general diploma exam passed, while 69 percent of those taking the technicaldiploma exam were successful (Ambassade De France 1991).
34 Lycee.35 Lycee Technique.36Baccalaureat Technicien (BT).37 Brevet de Technicien (BTn).38There are eight areas of study leading to a general baccalaureate (e.g., mathematics, physics and chemistry,agriculture, philosophy, and so on), and 20 technical baccalaureate areas of study (e.g., civil engineering, energy andindustry, music, and so on).39The professional baccalaureate was introduced in the 1985-86 school year. These new degree programs have beencreated in "professional" fields such as sales, maintenance and automated systems, and computer-aided manufacturing.
24
3'
Postsecondary Vocational Options
Those with high school diplomas can enter technical training programs leading to anadvanced technical diploma40 or a technical university degree 41 These programs require 2 years ofpostsecondary study and provide advanced technological education. The advanced technicaldiploma programs are offered primarily in universities and in social, paramedical, or commercialschools. These technical diplomas train students for fairly specific jobs. Because these programsare more narrow and specialized than the technical university degree programs, students who havethese diplomas are considered less retrainable than technical degree students. Technical universitydegree programs that are designed to prepare students for rapid promotion to managerial positionsin their field are offered in universities. In 1988-89, nearly 32 percent of students who passed thehigh school diploma exams entered technical diploma or technical degree programs-10 percententered degree programs and 22 percent diploma programs.
Vocational Training Programs Outside the Education System
France has a long-standing apprenticeship tradition for persons aged 16-25; however,relatively few participate. Although the numbers of young people participating full time in uppersecondary education have grown from 800,000 students in 1960 to more than 2 million in 1989,the numbers participating in apprenticeships have not significantly changed over the past twodecades. In 1989, the equivalent of 11 percent of all full-time upper secondary students participatedin an apprenticeship program (Wolf and Rapiau 1993).
An apprenticeship contract can last from 1 to 3 years; the length of the contract depends uponthe profession and the qualification an apprentice wants to achieve. Approximately 75 percent ofapprentices hold contracts with firms employing fewer than 10 people, and most apprenticeshipsare in the traditional crafts and trade sectors: construction, auto mechanics, agriculture and foodpreparation, and retail (CEDEFOP 1989). Apprenticeships can prepare students for vocational ortechnological education certificates at both the secondary and upper secondary levels.42
Apprentices receive a training wage (15 to 60 percent of the statutory minimum wage),according to the apprentice's age and semester in training (CEDEFOP 1989). In addition,apprentices are required to attend classes at a training center for a minimum of 400 hours per year.About one-third of the classes offered at these training centers are in general education, and aboutone-third each are practical vocational education classes and theoretical vocational education classes(CEDEFOP 1989).
There are also local programsschool-to-work transition projectsdirected at 16- through25-year-olds (Nothdurft 1989).43 Further, other ministries administer training programs andschools. For example, the Ministry of Agriculture runs agricultural high schools andpostsecondary programs in agronomy (Nothdurft 1989).
40Brevet de Technicien Superieur (BTS).41Diplome Universitaires de Technologie.42Before 1987, apprenticeships only prepared students for the CAP. After reforms were passed in 1987, apprenticescould train students for further vocational certificates (e.g., professional baccalaureate within the apprenticeshipsystem).43Missions Locales.
25
33
Vocational Education. Curricula
Elementary and lower secondary school curricula are predominantly academic. In 1984, theFrench government introduced classes in technology at the lower secondary school level as part ofthe required curriculum. However, most vocational curricula are found within the prevocationaland preapprenticeship training programs (which will soon be phased out) and the alternativetechnological curriculum. The technological curriculum provides a similar, but more limited (andless rigorous), academic curriculum with more prevocational coursework.
The extent of contact with vocational curricula from upper secondary school and beyonddepends upon the course of study undertaken. Within general and academic high schools, wherestudents prepare for general and technical high school diplomas, vocational courses such as officeautomation and automation technology are offered as electives. Within vocational high schools,students attend both general education and vocational education classes between 31 and 36 hoursper week.
Participation in Vocational Education
In 1986, among persons aged 16-25, 36 percent were employed, 33 percent were students,19 percent were unemployed or not the labor force, 3 percent were in military service,3 percent were apprentices, and 6 percent were participating in a government employment trainingprogram (table 2.2) (CEDEFOP 1989).44 In 1987, in response to the problem of school -leaverswho have no formal vocational or academic qualification, several school reforms were suggestedby a government High Commission for Education and the Economy. Among the reforms beingimplemented are the following:
Establishing an "occupation-related" option within lower secondary schoolsthat is,vocational secondary schools for students in the eighth and ninth grades; and
Establishing a prevocational program for low-achieving students within vocationalsecondary schools and apprentice training centers.45 This program would lead to a 2-yearprogram to enable students to prepare for the CAP or BEP exam.
These two new vocational paths are meant to replace the secondary prevocational (CPPN)and preapprenticeship (CPA) courses of study.46
Table 2.4 shows levels of participation in vocational curricula and training and types ofcertification among school leavers aged 16-22.
44The balance was idle or status unknown.45Classes de formations pre-professionnelles.46The High Commission argued that secondary student enrollment should be distributed as follows: 75 percent ingeneral education, 15 in the occupation-related option, and 10 percent in prevocational studies.
26
3
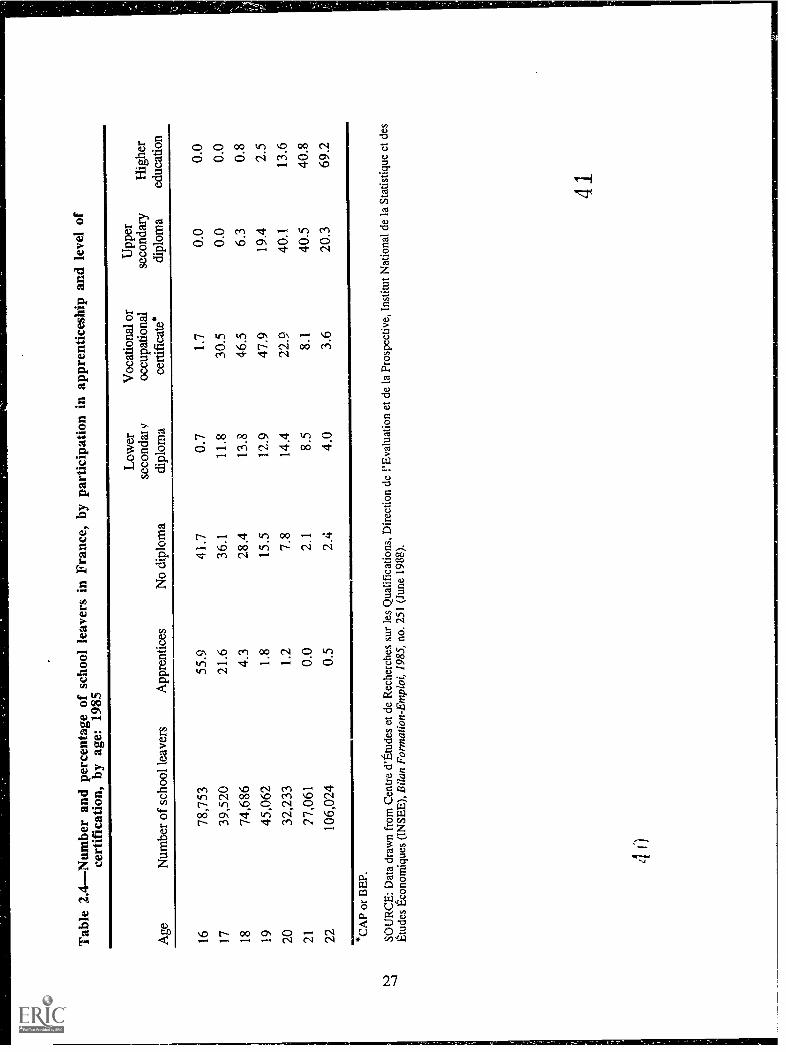
Tab
le 2
.4-N
umbe
r an
d pe
rcen
tage
of
scho
ol le
aver
s in
Fra
nce,
by
part
icip
atio
n in
app
rent
ices
hip
and
leve
l of
cert
ific
atio
n, b
y ag
e: 1
985
Age
Num
ber
of s
choo
l lea
vers
App
rent
ices
No
dipl
oma
Low
erse
cond
ed v
dipl
oma
Voc
atio
nal o
roc
cupa
tiona
lce
rtif
icat
e*
Upp
erse
cond
ary
dipl
oma
Hig
her
educ
atio
n
1678
,753
55.9
41.7
0.7
1.7
0.0
0.0
1739
,520
21.6
36.1
11.8
30.5
0.0
0.0
1874
,686
4.3
28.4
13.8
46.5
6.3
0.8
1945
,062
1.8
15.5
12.9
47.9
19.4
2.5
2032
,233
1.2
7.8
14.4
22.9
40.1
13.6
2127
,061
0.0
2.1
8.5
8.1
40.5
40.8
2210
6,02
40.
52.
44.
03.
620
.369
.2
*CA
P or
BE
P.'O
W
ts.)
SOU
RC
E: D
ata
draw
n fr
om C
entr
e d'
Etu
des
et d
e R
eche
rche
s su
r le
s Q
ualif
icat
ions
, Dir
ectio
n de
1'E
valu
atio
n et
de
la P
rosp
ectiv
e, I
nstit
ut N
atio
nal
de la
Sta
tistiq
ue e
t des
Etu
des
Eco
nom
ique
s (I
NSE
E),
Bila
n Fo
rmat
ion-
Em
ploi
, 198
5, n
o. 2
51 (
June
198
8).
4l
4
Vocational Education in Germany47
Responsibility for elementary and secondary education in (former) West Germany restsmainly with the 11 federal states. Although they all share a common educational structure, eachstate's school system varies in its organization, administration, financing, and curricula planning.While the federal government is only modestly involved in general education programs, it plays aleading role in the "dual system" the upper secondary-level program that combines part-time in-class education with on-the-job training.
The private sector plays a major role in vocational training. The dual system is a joint ventureof business and the education system: businesses provide on-the-job training, and schoolssupplement training with classes in general and vocational subjects. In addition, unions and tradeassociations play a role in vocational training by providing recognized performance standards forcertification.
Compulsory education begins at the age of 6 and lasts 12 years until age 18. Students arerequired to attend school full time for 9 years." During the last 3 years (or until an apprenticeshipis completed), students are only required to attend school part time. Primary education begins at theage of 6 and continues for 4 years (grades 1 to 4).49 Subsequently, teachers and schooladministrators place students in the different types of secondary schools (grades 5 to 9):50genera1,51 intermediate,52 and grammar or academic.53 Some states have introduced a fourth typeof school, a comprehensive lower secondary schoo1.54 Since 1976, the first 2 years of lowersecondary curricula (grades 5 and 6) have been standardized across all types of schools, enablingstudents to transfer among the three types of schools. Assignment to a course of study isdetermined after the sixth grade.
In 1991, 30 percent of lower secondary students attended general lower secondary schools;25 percent attended intermediate lower secondary schools; 31 percent attended academic orgrammar secondary schools; 7 percent attended comprehensive lower secondary schools; and 6percent were enrolled in an orientation program that was independent of a lower secondary school(Federal Ministry of Education and Science 1992c). Over the past two decades, enrollments ingeneral lower secondary schools have declined as more students are pursuing an academic trackthrough intermediate and grammar schools.
47This overview describes the educational system of the former West German Republic. Education in the 11 formerWest German states has not changed as a result of reunification. The five newly created states of former EastGermany have begun phasing in aspects of the West German educational system. Full implementation of a uniformeducational system throughout the unified country will depend on such developments in the East German states asStrengthening the economic base and movement from centralized to state-controlled school administration.48Ten years in Berlin, Bremen, and North Rhine-Westphalia.49In Berlin, elementary school (Grundschule) lusts 5 years.50Parents can appeal a student's assignment to lower secondary school; however, the ultimate decision rests with theschool. The education system does include bridges to and from academic and vocational tracks via achievement tests,although the majority of students stay within their educational track.51General lower secondary schools (Hauptschulen) primarily prepare students for vocational training.52lntermediate lower secondary schools (Realschulen) provide a more rigorous academic education to their studentsthan do general lower secondary schools. Intermediate lower secondary students have immediate access to morevocational training and academic opportunities than do their general school counterparts.53Grammar or academic lower secondary schools (Gymnasium) prepare students for entrance into institutions ofhigher education.54Comprehensive lower secondary schools (Gesamtschule) offer curricula that bridge all three types of lowersecondary schools, facilitating the transfer of students from one type of curriculum track to another.
28
4 ')

In their last 2 years of lower secondary school, all students are required to participate in anoccupational education program,55 which exposes them to the "world of work" and the dualsystem. This program is designed to help students choose a vocational area of interest, preparethem for the dual system, and find an employer willing to accept them as an apprentice.
General lower secondary school culminates in the ninth grade, usually with a general lowersecondary certificate.56 Intermediate lower secondary school often lasts a year longer than generallower secondary school and awards students an intermediate lower secondary certificate. Thiscertificate qualifies students to sit for the entrance examination for the upper secondary portion ofacademic (grammar) school or to enter upper secondary technical schools. Academic secondary orgrammar school bridges both lower and upper secondary education, providing curricula upthrough the 12th grade. Upon completion of their coursework, grammar school students qualifyfor the university entrance examination that enables them to enter higher education.
In a 1984 survey of 477,300 lower secondary graduates, 55 percent planned to enter anapprenticeship program; 34 percent wanted to attend a full-time vocational school; 8 percentplanned to pursue full-time academic education; 2 percent planned to enter the labor market asunskilled labor; and 1 percent were undecided. In addition, 55 percent of general lower secondaryschool graduates and 58 percent of intermediate lower secondary school graduates reported thatthey wanted to enter an apprenticeship program. An estimated 15 to 20 percent of academic lowersecondary school graduates planned to enter an apprenticeship program (Braun 1987).
However, There is some indication that the transition from lower secondary school haschanged somewhat since the early 1980s. During this time, a large generational cohort entered theupper secondary education and training system. Given the substantial numbers of students,demand for apprenticeship training opportunities exceeded the available pool of positions.57 As aconsequence, the numbers and percentages of students enrolled in full-time vocational educationincreased during this decade.
At the upper secondary level, more students are involved in the dual system than in any othereducational program. In 1986, 57 percent of 16- through 18-year-olds were participating in thedual system; 20 percent were enrolled in a full-time vocational program; 21 percent were enrolledin grammar school; and about 3 percent were enrolled in a part-time vocational program only(Association of German Chambers of Industry and Commerce 1988).58
Participation in the education system remains relatively high for young people until the age of19. In 1991, 82 percent of 18-year-olds and 60 percent of 19-year-olds were enrolled in school.Also, 41 percent of 20-year-olds were still enrolled in school (table 2.5).
Figure 2.2 describes the proportion of enrollments by school level and curriculum in Germanlower and upper secondary programs.
55A rbeitslehre.
56In some states, general school students who remain in school until the 10th grade are awarded the more advancedintermediate certificate.57For example, in 1984, although there were 705,600 new training contracts (i.e., 705,600 young people entered anew apprenticeship), 58,400 applicants were left unplaced and 21,100 apprenticeship positions were left unfilled.(Fifty-nine percent of students aged 16-18 participated in an apprenticeship.) In 1991, while a higher proportion (75percent) of students aged 16-18 were apprentices, there were fewer new training contracts (540,300) and only 11,200unplaced applicants (Federal Ministry of Education and Science 1992a).581n 1990, 73 percent of students aged 16-18 were apprentices. Regardless of participation in an apprenticeship, 47percent of these students were enrolled in full- or part-time vocational schools, and 24 percent were enrolled ingrammar schools (Federal Ministry of Education and Science 1992a).
29 43
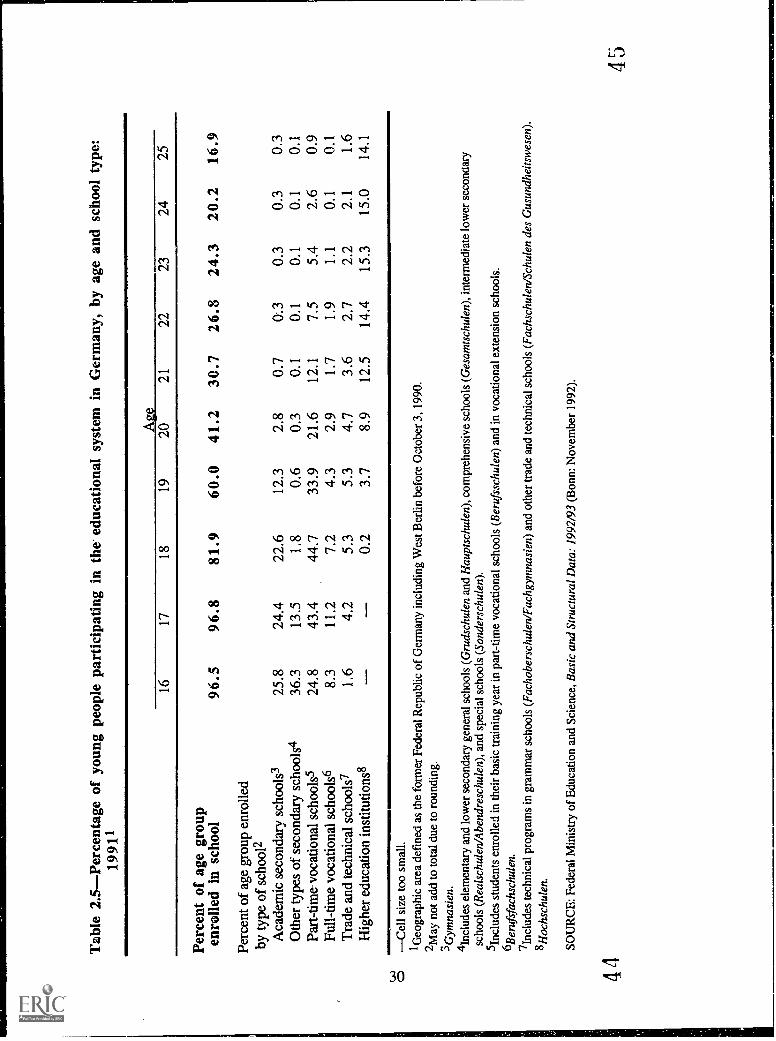
Tab
le 2
.5-P
erce
ntag
e of
you
ng p
eopl
e pa
rtic
ipat
ing
in th
e ed
ucat
iona
l sys
tem
in G
erm
any,
by
age
and
scho
ol ty
pe:
1991
1
Age
1617
1819
2021
2223
2425
Perc
ent o
f ag
e gr
oup
enro
lled
in s
choo
l96
.596
.881
.960
.041
.230
.726
.824
.320
.216
.9
Perc
ent o
f ag
e gr
oup
enro
lled
by ty
pe o
f sc
hool
2A
cade
mic
sec
onda
ry s
choo
ls3
25.8
24.4
22.6
12.3
2.8
0.7
0..3
0.3
0.3
0.3
Oth
er ty
pes
of s
econ
dary
sch
ools
436
.313
.51.
80.
60.
30.
10.
10.
10.
10.
1Pa
rt-t
ime
voca
tiona
l sch
ools
524
.843
.444
.733
.921
.612
.17.
55.
42.
60.
9Fu
ll-tim
e vo
catio
nal s
choo
ls6
8.3
11.2
7.2
4.3
2.9
1.7
1.9
1.1
0.1
0.1
Tra
de a
nd te
chni
cal s
choo
ls?
1.6
4.2
5.3
5.3
4.7
3.6
2.7
2.2
2.1
1.6
Hig
her
educ
atio
n in
stitu
tions
8-
-0.
23.
78.
912
.514
.415
.315
.014
.1
.111
1111
=11
1W
0-C
ell s
ize
too
smal
l.1G
eogr
aphi
c ar
ea d
efin
ed a
s th
e fo
rmer
Fed
eral
Rep
ublic
of
Ger
man
y in
clud
ing
Wes
t Ber
lin b
efor
e O
ctob
er 3
, 199
0.2M
ay n
ot a
dd to
tota
l due
to r
ound
ing.
-)G
ymna
sien
.4l
nclu
des
elem
enta
ry a
nd lo
wer
sec
onda
ry g
ener
al s
choo
ls (
Gni
dsch
ulen
and
Hau
ptsc
hule
n), c
ompr
ehen
sive
sch
ools
(G
esam
tsch
ulen
), in
term
edia
te lo
wer
sec
onda
rysc
hool
s (R
eals
chul
en/A
bend
resc
hule
n), a
nd s
peci
al s
choo
ls (
Sond
ersc
hule
n).
5lnc
lude
s st
uden
ts e
nrol
led
in th
eir
basi
c tr
aini
ng y
ear
in p
art-
time
voca
tiona
l sch
ools
(B
eruf
ssch
ulen
) an
d in
voc
atio
nal e
xten
sion
sch
ools
.6B
eruf
sfac
hsch
ulen
.
?Inc
lude
s te
chni
cal p
rogr
ams
in g
ram
mar
sch
ools
(Fa
chob
ersc
hule
n/Fa
chgy
mna
sien
) an
d ot
her
trad
e an
d te
chni
cal s
choo
ls (
Fach
schu
len/
Schu
len
des
Gus
undh
eits
wes
en).
8Hoc
hsch
ulen
.
SOU
RC
E: F
eder
al M
inis
try
of E
duca
tion
and
Scie
nce,
Bas
ic a
nd S
truc
tura
l Dat
a: 1
992/
93 (
Bon
n: N
ovem
ber
1992
).
4445
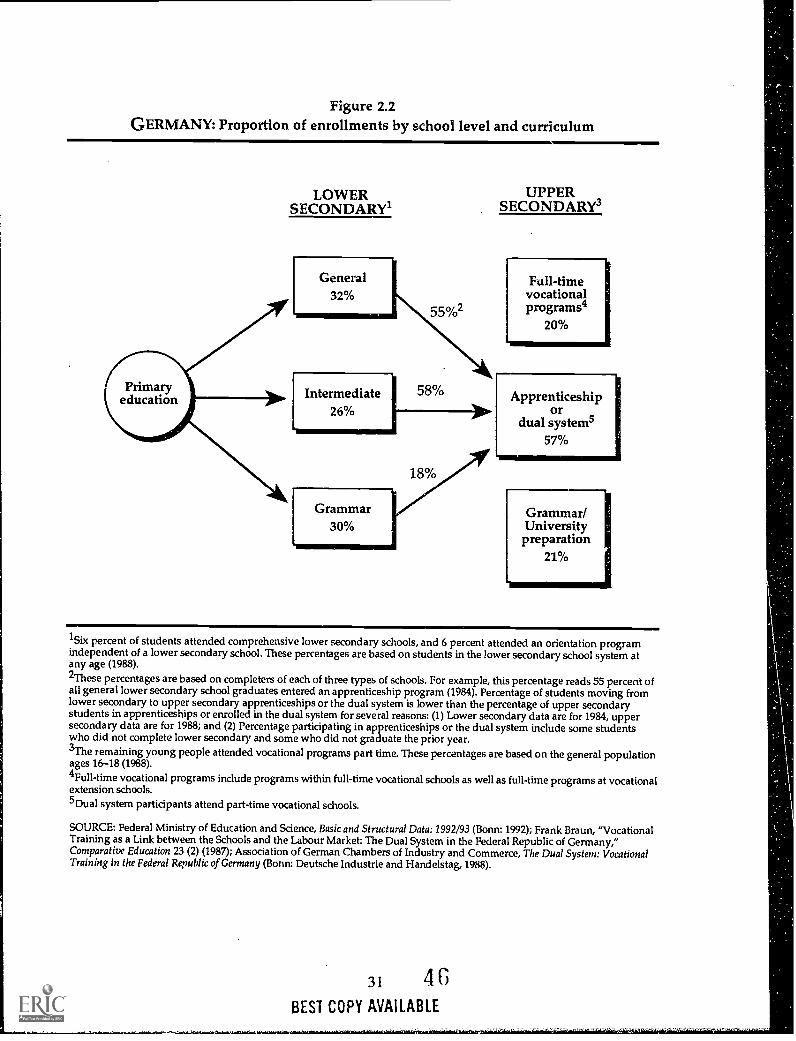
Figure 2.2GERMANY: Proportion of enrollments by school level and curriculum
LOWERSECONDARY1
UPPERSECONDARY3
Full-timevocationalprograms4
20%
Apprenticeshipor
dual systems57%
Grammar/University
preparation21%
1Six percent of students attended comprehensive lower secondary schools, and 6 percent attended an orientation programindependent of a lower secondary school. These percentages are based on students in the lower secondary school system atany age (1988).2These percentages are based on completers of each of three types of schools. For example, this percentage reads 55 percent ofall general lower secondary school graduates entered an apprenticeship program (1984). Percentage of students moving fromlower secondary to upper secondary apprenticeships or the dual system is lower than the percentage ofupper secondarystudents in apprenticeships or enrolled in the dual system for several reasons: (1) Lower secondary data are for 1984, uppersecondary data are for 1988; and (2) Percentage participating in apprenticeships or the dual system include some studentswho did not complete lower secondary and some who did not graduate the prior year.3The remaining young people attended vocational programs part time. These percentages are based on the general populationages 16-18 (1988).4FuIl -time vocational programs include programs within full-time vocational schools as well as full-time programs at vocationalextension schools.5Dual system participants attend part-time vocational schools.
SOURCE: Federal Ministry of Education and Science, Basic and Structural Data: 1992/93 (Bonn: 1992); Frank Braun, "VocationalTraining as a Link between the Schools and the Labour Market: The Dual System in the Federal Republic of Germany,"Comparative Education 23 (2) (1987); Association of German Chambers of Industry and Commerce, The Dual System: VocationalTraining in the Federal Republic of Germany (Bonn: Deutsche Industrie and Handelstag, 1988).
31 46BEST COPY AVAILABLE

Organization of Vocational Education and Training
Vocational education and training begin at the upper secondary level. In 1991, 74 percent of
all upper secondary students were enrolled in a vocational education program (table 2.6) (Federal
Ministry of Education and Science 1992a). Students can pursue vocational education through full-
time or part-time vocational schooling or through the dual system.59 While vocational educationand apprenticeship training are not necessarily restricted to graduates of lower secondary school, it
is assumed that students have obtained at least a general lower secondary school certificate; in fact,
many apprenticeship programs will not accept students without one.
Just before entering the dual system, students may participate in a Vocational Foundation
Training Year.60 The purpose of this program is to provide a broad base of knowledge in aparticular vocational area, preparing students for vocational training in a specific occupation or toenter the labor market as unskilled workers. This program takes one of two forms: the cooperative
form and, the school form. In the cooperative form, instruction alternates between in-classcoursework and on-the-job training; in the school form, all instruction takes place at school. Some
basic training year programs have articulated agreements with related businesses, which allowsstudents to apply the program toward the first 6 to 12 months of an apprenticeship program.6I
Students train for different types and levels of vocational certification. German industry andguilds define four levels of expertise: apprentice, journeyman or skilled blue- or white-collarworker, technician, and master. These are accompanied by four levels of certification: state-certified assistant, journeyman or skilled blue- or white-collar worker, technician, and master. Toreceive a higher level certification (for example, technician or master), a worker must pass anational examination and frequently have related work experience in the chosen trade oroccupation. Thus, within the vocational education system, there are many different levels and typesof vocational institutions catering to students seeking various levels of expertise and certification.
Vocational Education Within the Dual System
The dual system is a partnership between industry and the government that is designed toprovide young people with supervised on-the-job training supported by part-time general andvocational instruction. The objective of the dual system is to produce skilled workers who haveboth the theoretical and practical skills associated with their chosen occupations. The in-classportion of occupational training is intended to ensure that all apprentices have a uniform base ofknowledge in their occupational field.
Students in the dual system can choose their training program from more than 400 recognizedskilled occupations (Federal Ministry of Education and Science 1992a). Under a comprehensivevocational training law passed in 1960, the federal government sets the minimum requirements foreach occupation by standardizing: 1) the essential content of the training area; 2) the amount oftraining required; 3) the job description (type and scope of the qualification acquired uponcompleting the apprenticeship); 4) the basic training plan (timing and sequence for the teaching ofcompetencies); and 5) the requirements for intermediate and final examinations.
59For all people under the age of 18, vocational training by law must involve at least a part-time in-school program.
This is the basis for the dual system: apprenticeship training with paid release time for apprentices to completecompulsory part-time education.6°Berufsgrundbildungsjahr.61Full -time vocational students may sometimes substitute 1 year at a full-time vocational school for the first year of
an apprenticeship program.
32 4 7
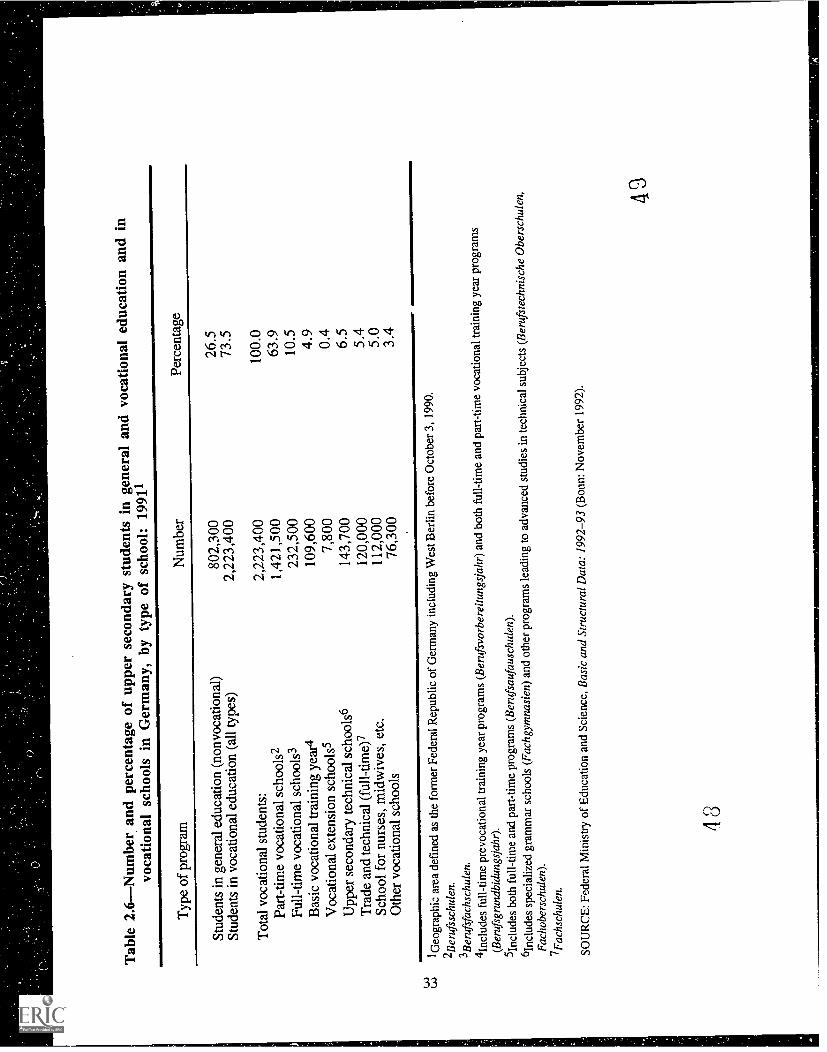
Tab
le 2
.6N
umbe
r an
d pe
rcen
tage
of
uppe
rse
cond
ary
stud
ents
in g
ener
al a
nd v
ocat
iona
led
ucat
ion
and
invo
catio
nal s
choo
ls in
Ger
man
y, b
y ty
pe o
f sc
hool
:19
911
Typ
e of
pro
gram
Num
ber
Perc
enta
ge
Stud
ents
in g
ener
al e
duca
tion
(non
voca
tiona
l)80
2,30
026
.5St
uden
ts in
voc
atio
nal e
duca
tion
(all
type
s)2,
223,
400
73.5
Tot
al v
ocat
iona
l stu
dent
s:2,
223,
400
100.
0
Part
-tim
e vo
catio
nal s
choo
ls2
1,42
1,50
063
.9
Full-
time
voca
tiona
l sch
ools
323
2,50
010
.5
Bas
ic v
ocat
iona
l tra
inin
g ye
ar4
109,
600
4.9
Voc
atio
nal e
xten
sion
sch
ools
57,
800
0.4
Upp
er s
econ
dary
tech
nica
l sch
ools
614
3,70
06.
5
Tra
de a
nd te
chni
cal (
full
- tim
e)?
120,
000
5.4
Scho
ol f
or n
urse
s, m
idw
ives
, etc
.11
2,00
05.
0
Oth
er v
ocat
iona
l sch
ools
76,3
003.
4
1Geo
grap
hic
area
def
ined
as
the
form
er F
eder
al R
epub
lic o
f G
erm
any
incl
udin
g W
est B
erlin
bef
ore
Oct
ober
3,1
990.
2Ber
ufss
chul
en.
3Ber
ufsf
achs
chul
en.
4lnc
lude
s fu
ll-tim
e pr
evoc
atio
nal t
rain
ing
year
pro
gram
s (B
eruf
svor
bere
itung
sjah
r) a
nd b
oth
full-
time
and
part
-tim
e vo
catio
nal t
rain
ing
year
pro
gram
s
(Ber
ufsg
rund
bidu
ngsj
ahr)
.5l
nclu
des
both
ful
l-tim
e an
d pa
rt-t
ime
prog
ram
s (B
entf
sauf
ausc
hule
n).
°Inc
lude
s sp
ecia
lized
gra
mm
ar s
choo
ls (
Fach
gym
nasi
en)
and
othe
r pr
ogra
ms
lead
ing
to a
dvan
ced
stud
ies
in te
chni
cal s
ubje
cts
(Ber
ufst
echn
isch
e O
bers
chul
en,
Fach
ober
schu
len)
.7
Fach
schu
len.
SOU
RC
E: F
eder
al M
inis
try
of E
duca
tion
and
Scie
nce,
Bas
ic a
nd S
truc
tura
l Dat
a:19
92-9
3 (B
onn:
Nov
embe
r 19
92).
Apprentices and employers enter into a written contract defining the responsibilities of eachparty, the duration of the apprenticeship, and the wages to be paid.62 In 1991, the average monthlywages of an apprentice were approximately $567 in U.S. currency.63 However, apprenticeshipwages can differ quite significantly across occupational areas (Federal Ministry of Education andScience 1992b). Employers release apprentices during the week or give them blocks of time so thatthey can attend vocational school or classes to fulfill the compulsory school requirement.
Approximately 500,000 firms participate in the dual-system training program. Fifty percentof German companies in the Chamber of Trade and Craft and 25 percent of companies in theChamber of Industry and Commerce offer apprenticeships (Nothdurft 1989),64 Although firmsand businesses are not obliged to train apprentices in the dual system, there is a long history ofprivate and public industry participation.
Employers shoulder much of the financial burden of apprentice training. In fact, they receiveno special tax benefits or other considerations from the government.65 Businesses pay the salariesof apprentices, as well as bear the mentoring costs and the expense of additional teaching materialsand workshops.66 Federal and state funding pays for only the in-class portion of apprenticeshiptraining (part-time vocational school). While 60 percent of all apprentices receive hands-oninstruction in a firm with less than 50 employees, 24 percent are trained in firms with 50 to 500employees. Moreover, 5 percent of all apprentices are trained in firms with 500 to 1,000employees, and 1 percent of apprentices train in major industrial companies with more than 1,000employees. Ten percent of apprenticeship placements were not accounted for (Federal Ministry ofEducation and Science 1992b).
In contrast to the on-the-job training component of the dual-system program, which is largelyadministered by the federal government, state governments have more control over the coursestaught during the in-class portion of the program. On average, apprentices spend 1 to 2 days perweek at a state-operated part-time vocational school; however, they do not always attend classevery week. The purpose of these classes is to provide a theoretical base to support in-firmtraining, and to ensure that all apprentices possess a uniform foundation of knowledge in theirtrade.
The duration of apprenticeships varies from 2 to 3.5 years. Students with superior scholasticqualifications and those who quickly master skills can apply to have their training periodshortened. Students who complete an apprenticeship become qualified as a skilled blue- or white-collar worker or journeyman.
62Wages are based upon minimum national standards determined by occupation and set by trade unions and employerassociations.63838 German marks.64German law requires that all businesses are members of either the Chamber of Trade and Craft or the Chamber ofIndustry and Commerce. These organizations provide advice on state vocational education standards, superviseapprenticeship training, and operate vocational centers in areas where the government does not have any such centers.Trade guilds are another important kind of business and industry organization. The guilds run workshops and trainingsessions in new technology, keeping members up-to-date in their vocation.65Since the mid-1970s, federal and state programs have emerged to assist and subsidize certain training programs.Those programs receiving assistance are typically in structurally weak regions, or they focus on special populations(e.g., students needing remediation).66Some firms do not believe that the state vocational school classes meet their needs. In response, they oftenestablish their own in-house, in-class training programs, send their apprentices to workshops held by trade guilds, orboth.
34
Education in Vocational Schools
Whether participating in the dual system or otherwise engaged in vocational training, allGerman students must attend school until the age of 18. Three forms of vocational schooling areavailable at the upper secondary level; part-time vocational schools, full-time vocational schools,and other vocational schools. Part-time vocational schools largely serve dual-system participants,as noted above. Full-time vocational schools and other types of technical schooling mostly servestudents who are seeking occupational certification outside the dual system.
Part-Time Vocational Schoo167
Students in part-time vocational schools are beginning their vocational training (either withinor outside the dual system). Although they have left or graduated from other secondary schools(where they have completed their full-time compulsory school requirement), they are obligated toattend school part time because they are still of compulsory school age. A part-time vocationalschool certificate qualifies a student for admission to advanced vocational schools.
Full-Time Vocational School
These schools provide instruction for 1 to 3 years and offer three main types of programs.First, they provide training courses and certificates in occupations not covered by the dual system,such as nursing. Second, these schools offer training (usually 1 year) that can serve as a substitutefor the initial vocational training year in the dual system or that can be used to upgrade secondaryschool certification. Last, they offer programs in occupations within the dual system that lead tovocational qualifications. For example, a student who completes a 2-year full-time vocationalschool program can receive a vocational qualification as a state-certified assistant (below the levelof a journeyman or skilled worker).
Other Vocational Schools
Approximately one-quarter of upper secondary vocational students are enrolled in programsat institutions other than full- or part-time vocational schools as described above. These optionsinclude vocational extension schools,69 upper secondary technical schools,70 upper secondarygrammar schools with a technical bias,71 and advanced vocational training schools.72 Theseschools provide continuing instruction in dual-system areas, extend general education, and/orprovide specialized training.
Vocational extension schools provide both academic and vocational classes. Educationalprograms in these schools tend to be 1 year (full time) in duration, and culminate in a certificate ofcompletion equivalent to the intermediate lower secondary certificate. These schools provideopportunities for students to further their vocational studies, to help them move on to moreadvanced academic or vocational programs, or both.
67Berufsschule.68Berufsfachschule.69Berufsaufbauschule.70Fachoberschule.7IBerufliches Gymnasium.72Fachschule.
35'51
Upper secondary technical schools require an intermediate lower secondary certificate forentrance. Courses of study last for 2 years, combining hands-on training with in-class work, andthey include both academic and vocational coursework. Students who successfully complete theprogram can enter university-level technical programs.
Upper secondary grammar schools with a technical bias provide the same level of academiceducation as the upper secondary levels of academic grammar schools except that career-relatedsubjects, such as economics and engineering, are available. However, these courses are onlyoffered as advanced course options. Students who successfully complete the program can enterhigher education.
Advanced vocational training schools provide extensive skill training and require anintermediate lower secondary certificate and vocational education training for entrance. Theseschools offer 1- to 3-year programs designed to enhance initial vocational qualifications or practicalexperience. Students who successfully complete the program can enter higher education.
Vocational Education Curricula
All vocational schools provide both general and career-related curricula.
Part-Time Vocational School
The part-time vocational school curriculum combines general and career-related education thatmeets the requirements for federal vocational training in the dual system. About 40 percent ofcoursework involves general education in economics, German, mathematics, religion, socialstudies, and foreign language (EURYDICE and CEDEFOP 1991). Trade-related classes make upthe rest of the in-class instruction.73 During the first year of vocational training, students choosecourses in 1 out of 13 career areas.74
Full-Time Vocational School
Students receive between 30 and 35 hours of classroom instruction each week (EURYDICEand CEDEFOP 1991). They are offered a wide range of courses that cater to a large number oftraining objectives, from studying for an intermediate lower secondary certificate to qualification as
a state-certified assistant. Thus, a student's mix of classes will depend upon individual training
objectives.
Other Vocational Schools
Vocational extension schools provide both academic and vocational classes. For example, 50percent of total classroom hours are devoted to general education subjects, and at least 160 hours
are devoted to instruction in a student's vocational area of specialization (EURYDICE andCEDEFOP 1991).
73Fachklassen.74The vocational areas include economics and administration, metalwork, electrical engineering, constructionengineering, woodworking techniques, textiles and clothing, chemistry/physics/biology, printil3, painting and
interior design, hygiene, health, agronomy, and nutrition/home economics.
36
The upper secondary technical school curriculum combines in-class study with on-the-jobtraining. Students spend 80 percent of their time during the first year in hands-on training and 20percent in class. The second year is primarily devoted to in-class activities, with 60 percent of thecoursework dedicated to general education subjects.
Upper secondary grammar schools with a technical bias have course offerings that are similarto those in the upper secondary levels of academic grammar schools, and they also provide career-related courses as options.
The curriculum in advanced vocational schools varies depending upon the subject area. Mostprograms prepare students for state examinations in their subject area, which mark the successfulcompletion of their program.
Participation in Vocational Education
The largest proportion of students in the vocational education system attend part-timevocational schools. This can be explained by the fact that these schools are the major provider ofin-school training for the dual system.
Participation in the Dual System
In 1992, 1.66 million people were enrolled in the dual system (Federal Ministry of Educationand Science 1992b). Approximately two-thirds of lower secondary school completers directly enterthe dual system, and 90 percent of young people who complete lower secondary school eventuallyparticipate in dual-system training. However, not all of them achieve certification (Federal Ministryof Education and Science 1991).
In 1991, the top four occupational choices among male apprentices were automobilemechanic (8 percent), electrician (5 percent), machine and systems technologist (4 percent), andbusiness specialist in wholesale and foreign trade (4 percent). Forty-nine percent of all maleapprentices were training in one of 15 trades (Federal Ministry of Education and Science 1992c).
For female apprentices, the top four occupations were medical assistant (8 percent), retailclerk (7 percent), hairdresser (7 percent), and office clerk (6 percent). Approximately 67 percent ofall female apprentices were training in one of 15 trades (Federal Ministry of Education and Science1992c).
Student Outcomes
Depending upon the trade area, 85 to 95 percent of apprentices in the dual system pass theirfinal examinations and become journeymen,75 skilled blue-collar workers,76 or skilled white-collarworkers (Federal Ministry of Educaiion and Science 1992b).77 Approximately 8.4 percent ofapprentices drop out of their training program each year, and about 50 percent of these dropoutspursue a different occupational area.
75Geselle.76Facharbeiter.77 Fachangestellter.
37
53

The Federal Ministry of Education and Science reports that 6 months after completingapprenticeship training, 52 percent of these youtig people were employed in their trainedoccupation; 15 percent were employed in another field; 10 percent had entered the military oralternative national services; 13 percent had continued on to further education or other training; and10 percent were unemployed (Federal Ministry of Education and Science 1992d).
5438

Vocational Education in Italy
Compulsory education in Italy spans 8 yearsfrom age 6 to 14and includes elementarygrades 1 through 5 and lower secondary grades 6 through 8. Despite periodic reforms, theeducation system has remained quite centralized at all levels, with the state setting the curricula forgeneral education programs. During the compulsory grades, students follow a standardizedacademic curriculum and teachers evaluate students two to three times each academic year. Eachstudent is given a written assessment of scholastic achievement, behavior, and attitudes,78 andmust receive a favorable evaluation to be promoted to the next grade. In order to attain a lowersecondary school diploma,79 students must pass a lower secondary examination. For .hose whosuccessfully complete lower secondary schooling, teachers suggest further courses of study thatthey feel are appropriate to the students' interests and skills.
Figure 2.3
ITALY: Education Flowsl
1V111.
Formalvocational
trainingprograms(includes
apprenticeship)
Formal1vocational
trainingprograms
Professionalqualification
School leavers:Noneducational
activities
Higher education
Universities
Formalvocationaltraining
programs(includes
apprenticeship)
School leavers:Noneducational
activities
1The student flows were calculated by Centro Studi Investimenti Sociali (CENSIS), using 1987-88 graduationand placement rates.
2Five percent of lower secondary graduates do not enter high school.
SOURCE: CENSIS, Italy Today: Social Picture and Trends, 1990 (Rome: 1991), 106.
78Scheda Personale.79Diploma di Licenza Media.
r rJ39
BEST COPY AVAILABLE

Upper secondary education includes a broad array of institutional typesclassical educationschools, art institutes, technical schools, and vocational schools. Each is part of a complex matrixof schools and curricula. For example, 200 kinds of vocational schools offer 150 differentcurricula. High school programs are 5 years in duration." Students with favorable schoolevaluations (i.e., Scheda Personale) qualify to take an examination for the upper secondarydiploma,81 and diploma recipients qualify for university-level studies. A majority of lowersecondary graduates pursue postcompulsory (high school) education. In 1989-90, 65 percent ofthose aged 14-18 were enrolled in school (CENSIS 1991).
Figure 2.3 on the previous page describes student enrollments in Italian secondary schoolsand postsecondary institutions.
Organization of Vocational Education
Vocational education and training begins after compulsory education. Within the educationsystem, there are upper secondary vocational and technical schools administered by the StateMinistry of Education. In 1987-88, 81 percent of lower secondary graduates entered uppersecondary school, and 71 percent of these students enrolled in vocational and technical schools(table 2.7). Outside the education system, there are other vocational options funded by the Ministryof Labor and administered by regional governments.
Table 2.7Percentage distribution of lower secondary graduates in Italy, byeducation, training status, and program type: 1987-88*
Percent enrolled
Upper secondary education 80 . 9Non-school-based vocational options 19.2
Upper secondary enrollmentby type of program 100.0Academic (including art) 29.0Technical 43.4Vocationalprofessional 27.6
Non-school-based vocational optionsby type of program 100.0Regional vocational training 33.3Apprenticeships 27.8Other 38.9
*Percentages were calculated by Centro Studi Ivestimenti Sociali (CENSIS), using 1987-88 graduation andplacement rates.
NOTE: May not sum to 100 percent due to rounding.
SOURCE: CENSIS, Italy Today: Social Picture and Trends, 1990 (Rome: 1991), 106.
"Vocational high schools also have 2- to 3-year programs aimed at preparing students for industry-qualifyingexaminations.81Maturitd.
40
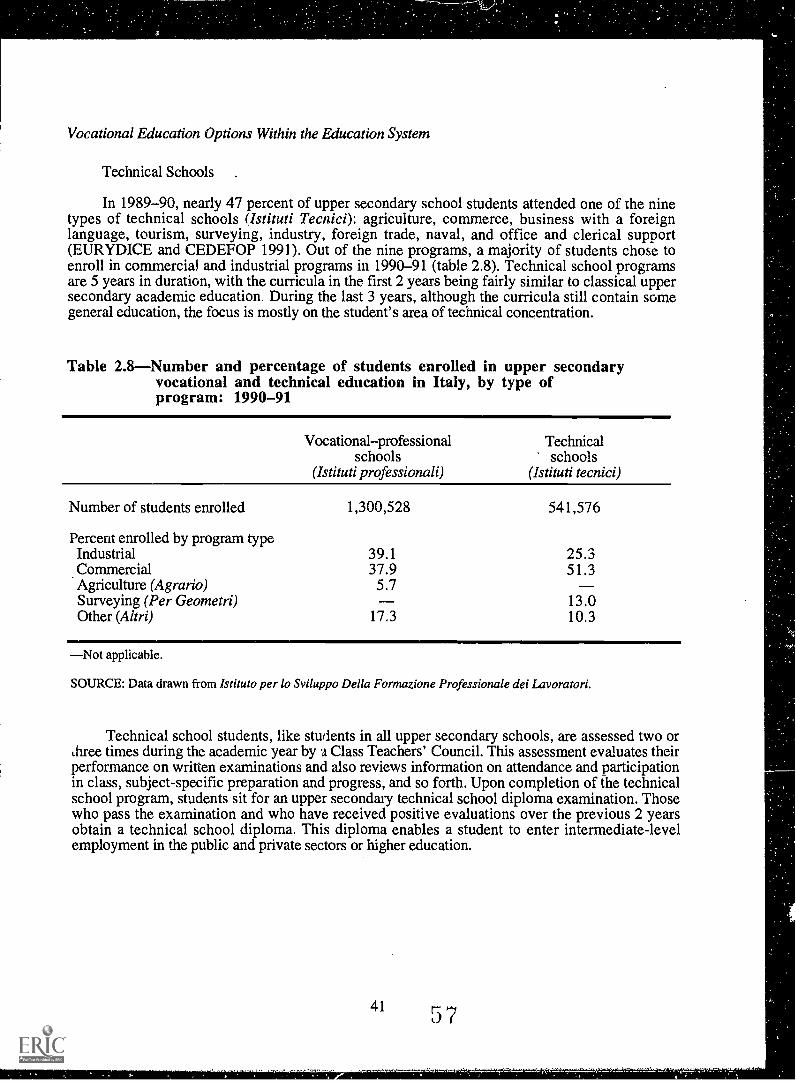
Vocational Education Options Within the Education System
Technical Schools .
In 1989-90, nearly 47 percent of upper secondary school students attended one of the ninetypes of technical schools (Istituti Tecnici): agriculture, commerce, business with a foreignlanguage, tourism, surveying, industry, foreign trade, naval, and office and clerical support(EURYDICE and CEDEFOP 1991). Out of the nine programs, a majority of students chose toenroll in commercial and industrial programs in 1990-91 (table 2.8). Technical school programsare 5 years in duration, with the curricula in the first 2 years being fairly similar to classical uppersecondary academic education. During the last 3 years, although the curricula still contain somegeneral education, the focus is mostly on the student's area of technical concentration.
Table 2.8Number and percentage of students enrolled in upper secondaryvocational and technical education in Italy, by type ofprogram: 1990-91
Vocationalprofessional Technicalschools schools
(Istituti professionali) (Istituti tecnici)
Number of students enrolled
Percent enrolled by program type
1,300,528 541,576
Industrial 39.1 25.3Commercial 37.9 51.3Agriculture (Agrario) 5.7Surveying (Per Geometri) 13.0Other (Altri) 17.3 10.3
Not applicable.
SOURCE: Data drawn from Istituto per lo Sviluppo Della Formazione Professionale dei Lavoratori.
Technical school students, like students in all upper secondary schools, are assessed two orthree times during the academic year by a Class Teachers' Council. This assessment evaluates theirperformance on written examinations and also reviews information on attendance and participationin class, subject-specific preparation and progress, and so forth. Upon completion of the technicalschool program, students sit for an upper secondary technical school diploma examination. Thosewho pass the examination and who have received positive evaluations over the previous 2 yearsobtain a technical school diploma. This diploma enables a student to enter intermediate-levelemployment in the public and private sectors or higher education.
41 J7
VocationalProfessional Schools
In 1989-90, 19 percent of upper secondary students attended vocational schools(EURYDICE and CEDEFOP 1991). These vocational schools (Istituti Professionali) consist offive main types: agriculture, trade and industry, commerce, hotel industry, and office and clericalsupport. Vocational school programs are tightly matched to labor market requirements and entryqualifications in each sector. Programs usually last 2 to 3 years (although an expansion of thevocational program to five years is being tested), and they are designed to train specialized workersin certain occupational areas. Curricula for the 2- and 3-year programs are based upon industryrequirements. In order to obtain a qualifying certificate, students must take an examination testingboth general education skills and knowledge in the occupational area of study. The qualificationcertificate allows a student to enter the fourth year of the new 5-year vocational program or a 2-yearspecialized vocational training course,82 but not a university or institution of higher education.
The experimental 5-year program is fashioned after the technical school program. In the first2 years, the curricula are largely academic, with occupational specialization taking place during thelast 3 years. After completing the 5-year program and passing the vocational school diplomaexamination, students can attend a university or a higher education institution.
Vocational Options Outside of School
There are several vocational options outside the education system. Three of these non-schoolbased optionsapprenticeships, trainingwork contracts, and basic vocational trainingaretargeted at young people beyond compulsory schooling age. Of the 1.3 million young peopleparticipating in these vocational programs outside of school, 43 percent were apprentices; 39percent held trainingwork contracts; and 18 percent were enrolled in vocational training courses(EURYDICE and CEDEFOP 1991).
Apprenticeship contracts last 3-5 years. Apprentices are required to work 32 hoursper week at the contracting firm and to spend 8 hours per week in classroom instruction,which usually consists of remedial or basic skill training. Apprenticeships are mainlyavailable in the craft and commercial sectors.
Trainingwork contracts are similar to apprenticeships in that they combine on-the-job training with classroom instruction. Contracts are 1-2 years in duration and include40-100 hours of technical training (classroom or laboratory instruction). Completing atrainingwork contract leads to a qualification recognized by the occupational sector.
Basic vocational training programs in the agriculture, industry, and service sectorsare operated in various regions of the country. There are two levels of basic trainingprograms offered. The iirst set of programs is targeted toward those who have onlycompleted compulsory schooling. The training in these programs lasts for an average of800-1,000 hours over a 2-year period and includes several on-the-job work-experienceprograms in firms. The second set of programs is targeted toward students who havecompleted upper secondary education and provides advanced-level vocational training.These programs last from 100300 hours for specialized training, and 500-1,000 hoursfor a recognized vocational qualification.
82Students who enter the 2-year integration course and complete the program qualify to take the vocational schoolleaving examination (which is given after the 5-year program) for the vocational school leaving certificate. Thiscertificate enables students to enter higher education institutions.
42
5 8
Vocational Education Curricula
Programs within the education system require substantial general education coursework. Forvocational training outside the education system, curricula mainly concentrate on buildingcapabilities in an occupational specialty, although some coursework in basic skills supports thevocational program.
Participation in Vocational Education
Of the 2.8 million upper secondary students in 1989-90, 47 percent were enrolled in atechnical school and 19 percent were enrolled in a vocational school. These students are in additionto youth who participate in vocational training outside the education system (EURYDICE andCEDEFOP 1991). In 1987-88, 12 percent of lower secondary school graduates enteredapprenticeships or regional vocational training programs; 35 percent entered technical schools; and22 percent entered vocational schools (CENSIS 1991).
Student Outcomes
In 1987-88, of those students who entered upper secondary schools, 59 percent graduatedand received a diploma; 13 percent pursued non-school-based vocational training options (regionalvocational programs, apprenticeships, and so on); and 8 percent received a professionalqualification (figure 2.3) (CENSIS 1991). Most students who sit for diploma examinationssuccessfully pass. For example, in 1988-89, only 1.5 percent of those who took the lowersecondary school diploma examination failed, as did 7.6 percent of those who took the high schooldiploma examination (CENSIS 1991).
43 5 9

Vocational Education in Japan
Japan has a centralized educational system characterized by a uniform, substantially academiccurriculum. The government prescribes curriculum guidelines and credit requirements for all publicschools, and teachers are paid according to a national scale. At the upper secondary or high schoollevel, schools play a major role in placing students in colleges, universities, or the work force, aswell as coordinating employer recruitment efforts.
Compulsory education begins at age 6 and lasts for 9 years. Japanese schools operate on the6-3-3-4 model: 6 years of elementary school (ages 6 to 12); 3 years of middle school (ages 12 to15);83 3 years of high school (ages 15 to 18);84 and 4 years of college.85 The first 9 years ofelementary and middle school are compulsory, and virtually all of the eligible population attends.During these years, students are not grouped by ability.86 and they attend schools assigned to thembased on their place of residence.87 The national curriculum for elementary and middle school ispredominantly academic with little exposure to vocational subjects.
Ninety-five percent of middle school graduates continue on to upper secondary education inhigh schools or through correspondence courses (with more than one-quarter of upper secondarystudents enrolled in vocational programs);88 2 percent pursue vocational training; and 3 percententer the labor force (Ministry of Education, Science and Culture 1990b).89
At the upper secondary or high school level, students compete for placement among publicschools in their district and among private institutions. The options for students at this level areeducation or employment, full-time or part-time education, or academic or vocational training. Inreality, the range of choice depends upon a student's scholastic abilities and school performance.Placement in a "good" school depends primarily upon a student's performance in school and on aschool entrance examination.90 School counselors and teachers meet with parents and students todiscuss high school options. Students can only apply to one public school at a time (there areusually two rounds of application). This procedure is intended to encourage students and parents tobe realistic about their prospects during the high school application process. High schools, bothpublic and private, are ranked within each district by their success in placing students in prestigiouspostsecondary institutions and by their ability to attract "good" companies to recruit at their school.
Vocational high schools tend to be the repository for students who have not performed wellin middle school and whose parents do not have the resources to enroll their child in a privateacademic high school. In one study conducted in the late 1970s, it was noted that mo' e than one-
83Chuugakko.84Koto gakko.85Daigaku.86Students with mental and physical disabilities, however, attend special schools with different curricula.87Students within the public system (which accounts for 99 percent of elementary scnool students and 97 percent ofmiddle school students) attend the elementary and middle school assigned to their by the district according to theirhome address. At the high school level, students compete for placement among public high schools in their district.88Vocational programs in high schools are different from vocational training pro grams in miscellaneous and specialtraining schools. Vocational programs that are not based in high schools include: little or no academic coursework,and the training tends to be more focused and skill based than the vocational coursework at vocational high schools.Students in vocational programs in high schools have the same standard academia: curriculum in the first year as dostudents in academic high school programs (except that the texts are less difficult), and only one-third of vocationalstudents' curriculum in the second and third years includes vocational coursework.89Two percent were employed, and 1 percent were unemployed.90Most high schools have entrance examinations. (Outstanding students may be admits d to a high school on thestrength of their student records and teacher recommendations.)
44HO
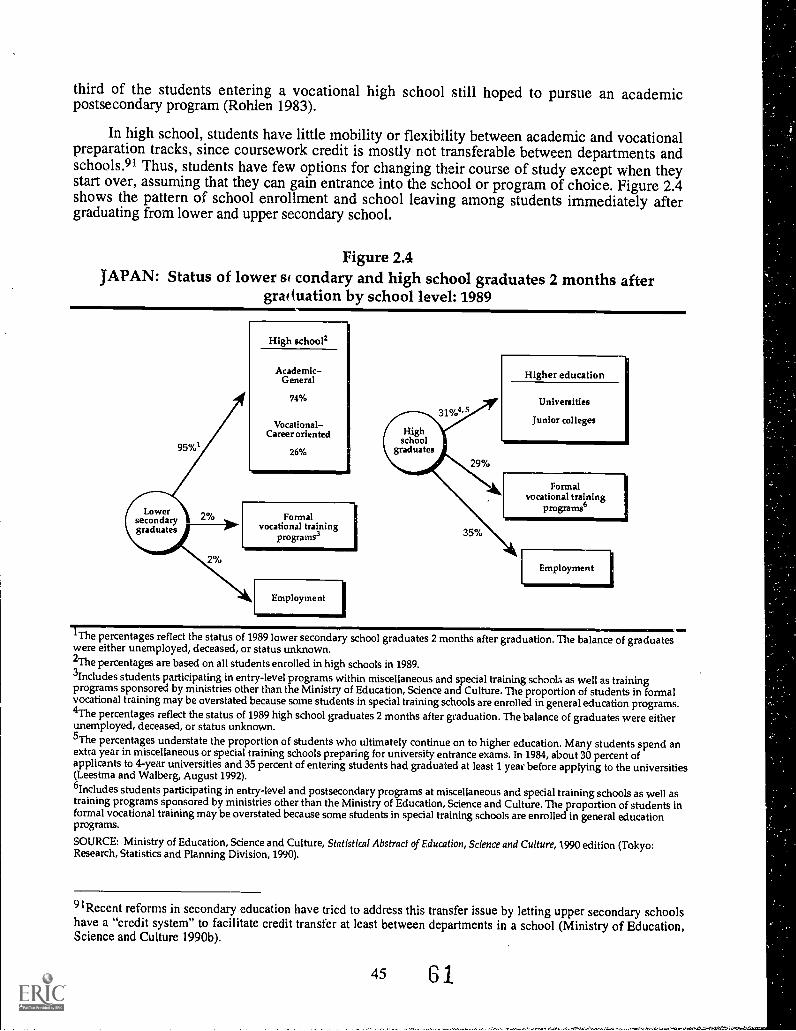
third of the students entering a vocational high school still hoped to pursue an academicpostsecondary program (Rohlen 1983).
In high school, students have little mobility or flexibility between academic and vocationalpreparation tracks, since coursework credit is mostly not transferable between departments andschools.91 Thus, students have few options for changing their course of study except when theystart over, assuming that they can gain entrance into the school or program of choice. Figure 2.4shows the pattern of school enrollment and school leaving among students immediately aftergraduating from lower and upper secondary school.
Figure 2.4JAPAN: Status of lower si condary and high school graduates 2 months after
gra( tuation by school level: 1989
High school2
AcademicGeneral
74%
Vocational-.Career oriented
26%
Formalvocational training
programs3
Employment
Higher education
Universities
Junior colleges
Formalvocational training
programs6
Employment
The percentages reflect the status of 1989 lower secondary school graduates 2 months after graduation. The balanceof graduateswere either unemployed, deceased, or status unknown.2The percentages are based on all students enrolled in high schools in 1989.3lncludes students participating in entry-level programs within miscellaneous and special training schools as well as trainingprograms sponsored by ministries other than the Ministry of Education, Science and Culture. The proportion of students in formalvocational training may be overstated because some students in special training schools are enrolled in general education programs.4The percentages reflect the status of 1989 high school graduates 2 months after graduation. The balance of graduates were eitherunemployed, deceased, or status unknown.5The percentages understate the proportion of students who ultimately continue on to higher education. Many students spend anextra year in miscellaneous or special training schools preparing for university entrance exams. In 1984, about 30 percent ofapplicants to 4-year universities and 35 percent of entering students had graduated at least 1 year before applying to the universities(Leestma and Walberg, August 1992).6lncludes students participating in entry-level and postsecondary programs at miscellaneous and special training schools as well astraining programs sponsored by ministries other than the Ministry of Education, Science and Culture. The proportion of students informal vocational training may be overstated because some students in special training schools are enrolled in general educationprograms.
SOURCE: Ministry of Education, Science and Culture, Statistical Abstract of Education, Science and Culture, 1990 edition (Tokyo:Research, Statistics and Planning Division, 1990).
91Recent reforms in secondary education have tried to address this transfer issue by letting upper secondary schoolshave a "credit system" to facilitate credit transfer at least between departments in a school (Ministry of Education,Science and Culture 1990b).
45 61
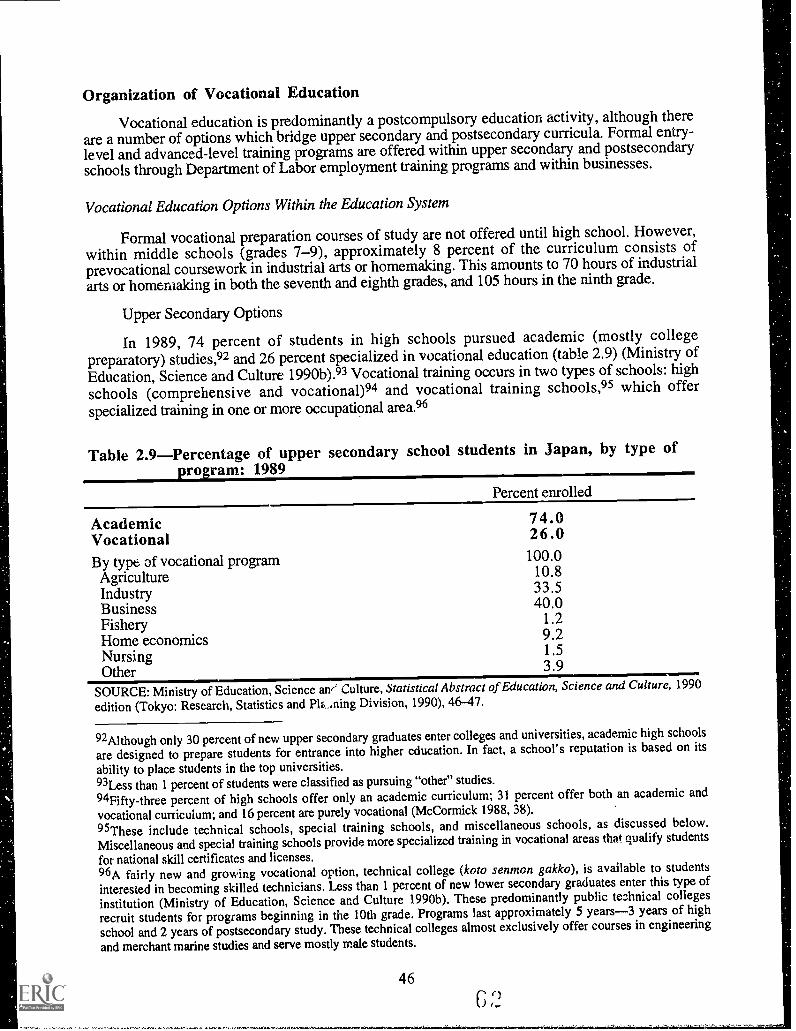
Organization of Vocational Education
Vocational education is predominantly a postcompulsory education activity, although thereare a number of options which bridge upper secondary and postsecondary curricula. Formal entry-level and advanced-level training programs are offered within upper secondary and postsecondaryschools through Department of Labor employment training programs and within businesses.
Vocational Education Options Within the Education System
Formal vocational preparation courses of study are not offered until high school. However,within middle schools (grades 7-9), approximately 8 percent of the curriculum consists ofprevocational coursework in industrial arts or homemaking. This amounts to 70 hours of industrialarts or homemaking in both the seventh and eighth grades, and 105 hours in the ninth grade.
Upper Secondary Options
In 1989, 74 percent of students in high schools pursued academic (mostly collegepreparatory) studies,92 and 26 percent specialized in vocational education (table 2.9) (Ministry ofEducation, Science and Culture 1990b).93 Vocational training occurs in two types of schools: highschools (comprehensive and vocational)94 and vocational training schools,95 which offerspecialized training in one or more occupational area.96
Table 2.9Percentage of upper secondary school students in Japan, by type ofro ram: 1989
Percent enrolled
Academic 74.0Vocational 26.0
By type of vocational program 100.0
Agriculture 10.8
Industry 33.5
Business 40.0Fishery 1.2
Home economics 9.2Nursing 1.5
Other 3.9
SOURCE: Ministry of Education, Science an Culture, Statistical Abstractedition (Tokyo: Research, Statistics and Plz...ning Division, 1990), 46-47.
of Education, Science and Culture, 1990
92Although only 30 percent of new upper secondary graduates enter colleges and universities, academic high schools
are designed to prepare students for entrance into higher education. In fact, a school's reputation is based on its
ability to place students in the top universities.93Less than 1 percent of students were classified as pursuing "other" studies.
"Fifty-three percent of high schools offer only an academic curriculum; 31 percent offer both an academic and
vocational curriculum; and 16 percent are purely vocational (McCormick 1988, 38).
95These include technical schools, special training schools, and miscellaneous schools, as discussed below.
Miscellaneous and special training schools provide more specialized training in vocational areas that qualify students
for national skill certificates and licenses.96A fairly new and growing vocational option, technical college (koto senmon gakko), is available to students
interested in becoming skilled technicians. Less than 1 percent of new lower secondary graduates enter this type of
institution (Ministry of Education, Science and Culture 1990b). These predominantly public technical colleges
recruit students for programs beginning in the 10th grade. Programs last approximately 5 years-3 years of high
school and 2 years of postsecondary study. These technical colleges almost exclusively offer courses in engineering
and merchant marine studies and serve mostly male students.
46
Postsecondary Options
Approximately one-third of all upper secondary graduates enroll in miscellaneous schools.97These schools offer both entry-level (upper secondary) and advanced-level (postsecondary)vocational programs in specific occupational fields,98 providing a type of training not available inhigh schools and universities. Training is often fairly specific and aimed at preparing students fornational licensing examinations (in subjects such as bookkeeping, automotive repair, ordressmaking). The majority of these schools offer only advanced-level (postsecondary) programs,and most are privatealthough some courses are available to upper secondary students. In 1990,77 percent of the students enrolled in these types of schools were pursuing advanced courses, and88 percent of these schools were private (Ministry of Education, Science and Culture 1990a).
One type of miscellaneous school are special training schools.99 These schools are requiredto enroll 40 or more students, and courses must be at least 1 year in duration, with a minimum of800 teaching hours. Special training schools offer 3-year courses to lower secondary graduates and2-year courses to high school graduates in fields such as engineering, nursing, allied health fields,and home economics. Most special training schools are private. The few public institutions areadministered by the Ministry of Education, Science and Culture, although the special trainingschools have far more autonomy in setting their curriculum than do public high schools andcolleges. However, credits gained in these schools are not transferable toward a degree at auniversity or junior college.
Although there are special training schools at the upper secondary level, most of theseschools offer postsecondary programs: 75 percent of students in special training schools areenrolled at the postsecondary level. Upper secondary special training schools loo offer 3-yearprograms to lower secondary school graduates, while special training colleges (advanced-levelspecial training schools)101 offer 2-year postsecondary vocational programs to high schoolgraduates.
Another vocational option within the educational system are programs offered at juniorcolleges. These colleges are administered by three different entities: the federal government, localgovernments, and private enterprises. Eighty-four percent of junior colleges are private institutions;7 percent are national institutions;102 and 5 percent are local institutions. These collegespredominantly serve women: in 1989, more than 90 percent of the enrollment was female (Ministryof Education, Science and Culture 1990b). Although the emphasis at most junior colleges is onliberal arts, the number of professional education programs has been increasing. Unlike juniorcolleges in the United States, junior colleges in Japan do not serve a transfer function into 4-yearuniversities.
97Kakushu gakko.98Some special training schools also offer general education programs.99Senshu gakko.IMKoto senshu gakko.1°1Senmon gakko.I °2The programs offered at national junior colleges are often related to those at national universities; 50 percent ofthe colleges coordinate their health science and medical technician programs with those at the national university; 25percent coordinate their law and commerce programs; and 25 percent coordinate their engineering programs.
47
R3
The most popular vocational programs in junior colleges include home economics (enrollingapproximately 27 percent of all junior college students), and education (enrolling approximately 22percent of all junior college students).103 Another 10 percent of junior college students are enrolledin agriculture, health, and engineering programs (U.S. Department of Education 1987).
Vocational Training Programs Outside the Educational System
The Ministry of Labor operates public training centers that enroll approximately 300,000students each year. The programs at these centers include basic training, skill improvementtraining, retraining for new occupations, and instructor training. Most students in these centers areolder workers who want to acquire a national trade certificate or retraining for new jobs.104 TheMinistry of Labor provides training allowances for unemployed persons and financially assistssmall- and medium-size firms with their training programs.
In addition, approximately 150 vocational schools are operated by other ministries. TheMinistry of Health oversees nursing schools; the Ministry ofTransportation supervises seamen'sschools; and the Ministry of Construction manages some training programs for the constructionindustry (McCormick 1988).
Most companies in Japan have new employee training programs geared toward high schooland college graduates. Large companies, with more than 300 employees, often provide extensive,in-house continuing education and training programs for their workers.105 However, thesecompanies employ only 27 percent of the work force (U.S. Department of Education 1987).
School-to-Work Transition
Approximately 35 percent of high school students enter the work force directly after theygraduate (table 2.10). High school guidance counselors primarily coordinate the job recruitmentand placement of students. At the high school level, the government regulates the job recruitmentprocess by limiting the provision of job placement assistance to only public and nonprofitinstitutions. Companies have limited access to potential workers. In fact, direct communicationbetween businesses and high school students is prohibited, andcompanies must work through theschools and the Ministry of Labor Public Employment Security Office (PESO) to recruitstudents.106 Moreover, companies can only recruit high school seniors, and they cannot begin toscreen job applicants until October, midway through the school year.107
103These programs offer mainly preschool education.104These centers were first created in part to help lower secondary graduates who were nonskilled workers in theirtransition from compulsory schooling to work. However, since most lower secondary graduates continue on to someform of postcompulsory education, these centers have shifted their focus to retraining and updating skills.105Training also takes place in smaller companies; larger companies are more explicit about training programs and
often set aside and spend more resources on training.106Companies must submit recruitment cards that describe job openings and each position's salary and benefits forPESO approval. These cards are then used by PESO and school counselors forjob placement purposes.
107The school year in Japan starts in April.
48
64
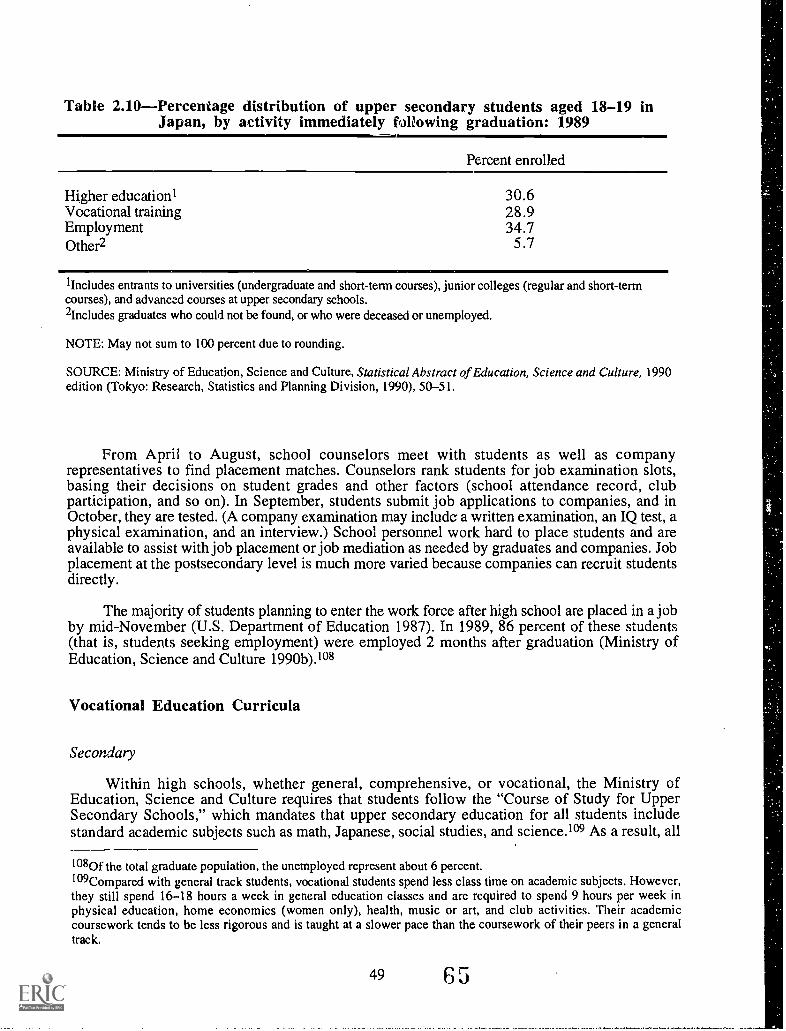
Table 2.10Percentage distribution of upper secondary students aged 18-19 inJapan, by activity immediately following graduation: 1989
Percent enrolled
Higher education) 30.6Vocational training 28.9Employment 34.7Other2 5.7
'Includes entrants to universities (undergraduate and short-term courses), junior colleges (regular and short-termcourses), and advanced courses at upper secondary schools.2lncludes graduates who could not be found, or who were deceased or unemployed.
NOTE: May not sum to 100 percent due to rounding.
SOURCE: Ministry of Education, Science and Culture, Statistical Abstract of Education, Science and Culture, 1990edition (Tokyo: Research, Statistics and Planning Division, 1990), 50-51.
From April to August, school counselors meet with students as well as companyrepresentatives to find placement matches. Counselors rank students for job examination slots,basing their decisions on student grades and other factors (school attendance record, clubparticipation, and so on). In September, students submit job applications to companies, and inOctober, they are tested. (A company examination may include a written examination, an IQ test, aphysical examination, and an interview.) School personnel work hard to place students and areavailable to assist with job placement or job mediation as needed by graduates and companies. Jobplacement at the postsecondary level is much more varied because companies can recruit studentsdirectly.
The majority of students planning to enter the work force after high school are placed in a jobby mid-November (U.S. Department of Education 1987). In 1989, 86 percent of these students(that is, students seeking employment) were employed 2 months after graduation (Ministry ofEducation, Science and Culture 1990b).108
Vocational Education Curricula
Secondary
Within high schools, whether general, comprehensive, or vocational, the Ministry ofEducation, Science and Culture requires that students follow the "Course of Study for UpperSecondary Schools," which mandates that upper secondary education for all students includestandard academic subjects such as math, Japanese, social studies, and science.109 As a result, all
1080f the total graduate population, the unemployed represent about 6 percent.109Compared with general track students, vocational students spend less class time on academic subjects. However,they still spend 16-18 hours a week in general education classes and are required to spend 9 hours per week inphysical education, home economics (women only), health, music or art, and club activities. Their academiccoursework tends to be less rigorous and is taught at a slower pace than the coursework of their peers in a generaltrack.
49 6 5
high school curriculum in the first year is academic, and nearly two-thirds of a vocational student'sschooling in the second and third years is devoted to standard academic subjects (U.S. Departmentof Education 1987). Students specializing in a vocational occupation must take no less than 30 outof 80 graduation credits in their subject specialization area.
Within comprehensive and vocational high schools, the vocational program is orientedtoward broad career clusters, rather than being job specific. The broad occupational career areasinclude agriculture, industry, business, fishery, home economics, and nursing. Vocational high
schools tend to be more specialized, focusing on industrial, commercial, or agricultural studies
(McCormick 1988).
Postsecondary
The Ministry of Education, Science and Culture does not regulate the curriculum within
special training and miscellaneous schools to the extent that it does in other upper secondary and
postsecondary institutions. Curricula, especially in the special training schools, are moreinfluenced by standards set by occupational qualification and certification processes.
The occupational programs offered by miscellaneous schools include bookkeeping, typing,
automotive repair, computer techniques, dressmaking, and cooking. The duration of the programvaries and can last anywhere from several months to several years. At the special training schools,
programs are offered in engineering, agriculture, medical care, nursing, health, commerce, home
economics, and culture/liberal arts.
Participation in Vocational Education
In 1989, 94 percent of middle school graduates advanced to technical schools and high
schools,! 10 while 2 percent of graduates enrolled in a vocational training program (Ministry of
Education, Science and Culture 1990b). Of the 5.6 million upper secondary students in 1989, 26
percent pursued a vocational program area, and 74 percent pursued academic studies (Ministry of
Education, Science and Culture 1990b).
Over the past decade, the overall proportion of high school students pursuing studies ia an
occupational field has decreased slightlyfrom 32 percent in 1980 to 26 percent in 1989. Among
the vocational programs available to high school students in 1989, business and industry studies
had the highest proportions of students enrolled. Business programs predominately enrolled
women, with only 29 percent of men specializing in this area, and industry programspredominately enrolled men, with only 5 percent of women specializing in this area (Ministry of
Education, Science and Culture 1990b).
Of high school students who graduated in 1989, 30 percent continued on to higher education
(18 percent to a university and 12 percent to a junior college). Nearly the same proportion of
graduates (29 percent) entered advanced-level vocational training programs. Thirty-five percent
were employed within 2 months of graduation, and 6 percent were unemployed (Ministry of
Education, Science and Culture 1990b).
The total number of enrollees in miscellaneous and special training schools remained fairly
steady throughout the 1980s. However, a greater proportion of these participants were enrolled in
I I °These schools include academic, comprehensive, and vocational high schools. As noted, while the comprehensive
and vocational high schools offer vocational programs, these offerings only account for approximately one-third of
students' curricula.I I !Less than 1 percent were enrolled in other educational programs.
50
special training schools. In fact, the number of students who were enrolled in these schoolsincreased by 71 percent from 1980 to 1989, while the number of students enrolled in othermiscellaneous schools decreased by 39 percent. Thus, in recent years, the total number of studentsenrolled in special training schools has been greater than that in other miscellaneous schools
(Ministry of Education, Science and Culture 1990b).
Similar patterns of participation by gender occur in miscellaneous and special trainingschools. While a slightly larger proportion of women (55 percent) participate in these programs,
they tend to be clustered in certain fields. For example, in 1987, the two most popular disciplines
in special training schools were engineering, with a female participation rate of 21 percent, and
health occupations, with a male participation rate of 17 percent (McCormick 1989).
5167
Vocational Education in the United Kingdom
The various education authorities within the United KingdomDepartment of Education andScience (England and Wales), the Welsh Office Education Department, the Scottish OfficeEducation Department, and the Department of Education (Northern Ireland)differ in the way theystructure their education and training systems. This narrative focuses primarily on England andWales except when noted.
Compulsory education in England and Wales spans 11 years for students, from age 5 untilage 16. The education system is highly decentralized, with responsibility for management andcontrol resting mainly with the local education authorities (LEAs), of which there are 117 inEngland and Wales. Most LEAs adopt two-tiered grade-level configurations-6 years of primaryschool and 5 years of lower secondary school.112
Recent educational reforms (The Education Reform Act, July 1988) broadened nationalresponsibilities for educational programs, and established a national core curriculum and anassessment process for students during their years of compulsory education. The Act also conveysmore budgetary authority to individual schools and, under certain circumstances, allows them theoption of withdrawing from LEA control and becoming a grant-maintained school.
Approximately 90 percent of secondary students attend nonselective, comprehensivesecondary schools (EURYDICE and CEDEFOP 1991). The remaining students attend selectiveschools,113 mainly in the form of grant-maintained schools, grammar schools, secondary modernschools, and private institutions.114
While students can leave the education system at age 16, many remain in school until age 18(figure 2.5). Secondary students, especially those intending to pursue upper secondary and highereducation, take the General Certificate of Secondary Education (GCSE) examination aftercompleting lower secondary school (usually around age 16).115 Students who achieve a grade ofA, B, or C on the GCSE examination and who are in an "academic track" spend 2 more years
112In England, about 15 percent of students used to attend a three-tier school system consisting of primary school (3to 5 years); middle school (4 years); and high school (2 to 4 years). However, this structure no longer exists.113Until 1965, students were tracked into particular schooling opportunities based on tests administered at age 11.Those scoring in the highest quartile were admitted to grammar schools (college-prep curriculum), while othersattended secondary technical or modern schools. Secondary technical schools offered curricula oriented towardoccupational clusters, although still enabling students to undertake some form of postsecondary higher education.Today, these schools are rarely mentioned as an alternative for students because few, if any, exist in their originalform. A recent British government initiative resurrected these institutions in the form of City Technical Colleges(CTCs), which are being piloted in 20 sites. These schools provide a broad-based secondary education for studentsaged 11-18 that incorporates a strong technical training element into the curriculum and primarily serves the needs ofnonuniversity-bound youth (Edwards, Gewirtz, and Geoff 1992). Secondary modern schools, which exist today butare fewer in number, provide general secondary education for nonuniversity-bound youth, usually providingschooling until age 16.114In 1987-88, 10 percent of elementary and secondary schools were private institutions (EURYDICE andCEDEFOP 1991).115In 1988, the GCSE replaced the General Certificate of Education, Ordinary-level (GCE, 0-level) qualification andthe Certificate of Secondary Education (CSE) qualification. The GCSE exam is graded on a 7-point AF scale, wherea score of AC represents the same competency level as a pass on the GCE, 0-level exam. This certificate is theentry-level qualification for upper secondary (postcompulsory) education and training (Central Office of Information1989).
52
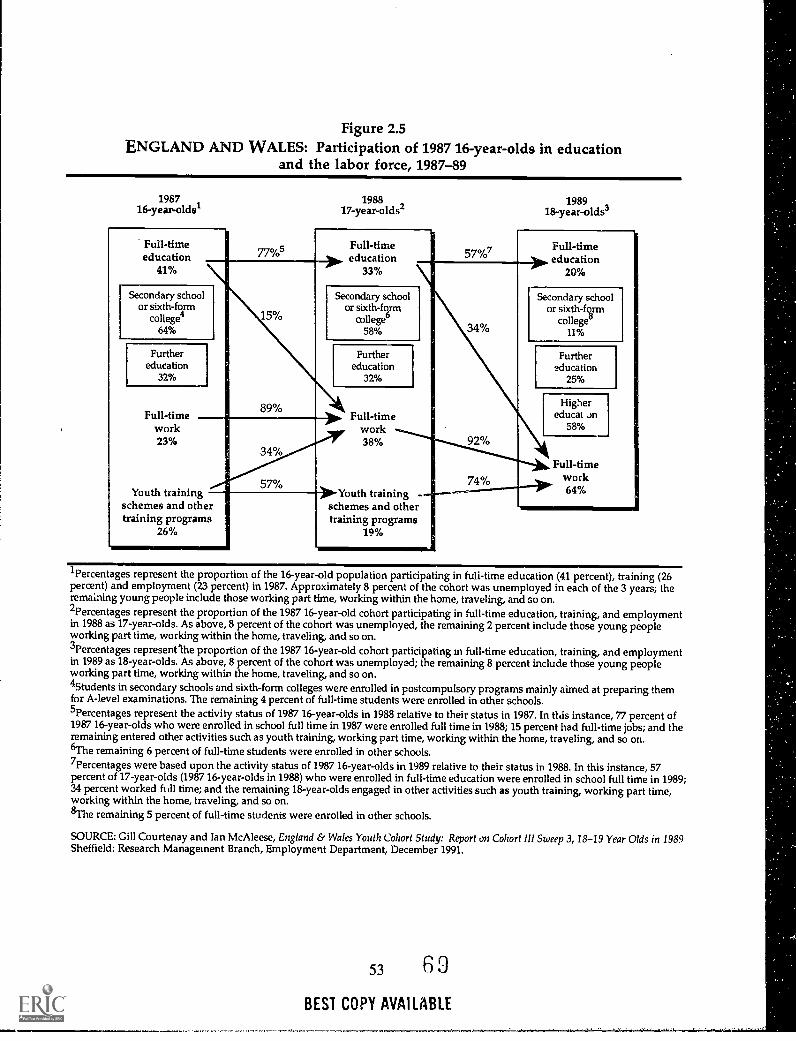
Figure 2.5ENGLAND AND WALES: Participation of 1987 16-year-olds in education
and the labor force, 1987-89
198716-year-olds'
Full-timeeducation
41%
198817-year-olds`
77%5
Secondary schoolor sixth-form
college464%
Furthereducation
32%
Full-timework23%
Youth trainingschemes and othertraining programs
26%
15%
89%
34%
57%
Full-time> education
33%
Secondary schoolor sixth-form
college658%
Furthereducation
32%
-->. Full-timework38%
198918- year -olds3
57%7
34%
Full-timeeducation
20%
Secondary schoolor sixth-form
college811%
Furthereducation
25%
92%
Highereducat jn
58%
*Youth training -schemes and othertraining programs
19%
Full-timework64%
1Percentages represent the proportion of the 16-year-old population participating in full-time education (41 percent), training (26percent) and employment (23 percent) in 1987. Approximately 8 percent of the cohort was unemployed in each of the 3 years; theremaining young people include those working part time, working within the home, traveling, and so on.2Percentages represent the proportion of the 1987 16-year-old cohort participating in full-time education, training, and employmentin 1988 as 17-year-olds. As above, 8 percent of the cohort was unemployed, the remaining 2 percent include those young peopleworking part time, working within the home, traveling, and so on.3Percentages represent'he proportion of the 1987 16-year-old cohort participating in full-time education, training, and employmentin 1989 as 18-year-olds. As above, 8 percent of the cohort was unemployed; the remaining 8 percent include those young peopleworking part time, working within the home, traveling, and so on.4Students in secondary schools and sixth-form colleges were enrolled in postcompulsoryprograms mainly aimed at preparing themfor A-level examinations. The remaining 4 percent of full-time students were enrolled in other schools.5Percentages represent the activity status of 1987 16-year-olds in 1988 relative to their status in 1987. In this instance, 77 percent of1987 16-year-olds who were enrolled in school full time in 1987 were enrolled full time in 1988; 15 percent had full-time jobs; and theremaining entered other activities such as youth training, working part time, working within the home, traveling, and so on.6The remaining 6 percent of full-time students were enrolled in other schools.7Percentages were based upon the activity status of 1987 16-year-olds in 1989 relative to their status in 1988. In this instance, 57percent of 17-year-olds (1987 16-year-olds in 1988) who were enrolled in full-time education were enrolled in school full time in 1989;34 percent worked ft ill time; and the remaining 18-year-olds engaged in other activities such as youth training, working part time,working within the home, traveling, and so on.8The remaining 5 percent of full-time students were enrolled in other schools.
SOURCE: Gill Courtenay and Ian McAleese, England & Wales Youth Cohort Study: Report on Cohort 111 Sweep 3,18-19 Year Olds in 1989Sheffield: Research Management Branch, Employment Department, December 1991.
53 6 9
BEST COPY AVAILABLE
(ages 17 and 18) in secondary school or a "sixth-form" college, where they prepare for the GeneralCertificate of Education at Advanced-level examinations (A-level exams), the traditional entryqualification for higher education.116
In 1992-93, nearly 80 percent of 16-year-olds, about 67 percent of 17-year-olds, and 46percent of 18-year-olds were enrolled in school. In 1992-93, 71 percent of 16-year-olds, 55percent of 17-year-olds, and 34 percent of 18-year-olds were enrolled in full-time schooling(Department for Education 1993).
Focusing strictly on those enrolled in schools full time masks the degree to which youngpeople really participate in compulsory education and training.1 i fact, an increasing proportion ofthose who have entered the labor force participate in further education as part of their employmenttraining or attend further education classes at night while working full time (Kerchoff 1990). In1992-93, 8 percent of 16-year-olds, 11 percent of 17-year-olds, and 12 percent of 18-year-oldsattended school on a part-time basis (Department for Education 1993).
Organization of Vocational Education
Vocadonal education and training are student options at the age of 16. Programs are offeredboth within and outside the educational system.
Vocational Education Options Within the Educational System
There are two types of postcompulsory education: further education and higher education.Further education includes all upper secondary-level programs, which mainly prepare 16- to 18-year -olds for entry-level vocational qualifications or A-level or university entrance examinations.Further education is provided by a broad variety of schools and institutions: secondary schools,sixth-form colleges, tertiary colleges, technical colleges, and colleges of further education. Highereducation includes academic degree programs in universities and advanced-level occupation andtechnical degrees and certificates.
Within the educational system, vocational education takes place primarily in tertiary colleges,technical colleges, and colleges of further education. Two levels of vocational education areofferednonadvanced courses or upper secondary programs and advanced courses orpostsecondary programs. For the most part, vocational programs prepare students for vocationalqualification examinations. In 1989, 33 percent of 16- through 18-year-olds were enrolled infurther education. A majority of these students were preparing for vocational qualifications (table2.11) (Department of Education and Science 1992).117 Table 2.12 shows the percentage of 16-through 18-year-olds in England participating in different academic and vocational curricula.
"OA-level examinations used to be the prerequisite to a postsecondary degree program. Universities required aminimum of two A-level passes for entrance into postsecondary studies; more commonly students entered with at
three A-level passes of high scores. However, recent reforms have opened access to higher education throughadviu;:Td-level vocational qualifications and bridging programs." 7Further education includes students preparing for university-qualifying A-level examinations and other uppersecondary academic programs. Thus, not all further education students are vocational students.
547 0

Table 2.11Percentage distribution of students aged 16-18 in the UnitedKingdom participating in further education, by type of programcertification: August 1989
Students aged 16-18
Of those enrolled in further education)Percent enrolled full time 42.1
Full time by type of program certificationBTEC/SCOTVEC2
38.9
Royal Society of Arts 2.7City and Guilds 16.0Academic secondary diploma 30.0
Other specified courses3 12.4
Percent enrolled part time (day) 3 9 .
Part time (day) by type of program certificationBTEC/SCOTVEC2
32.7
Royal Society of Arts 3.8City and Guilds 51.8Academic secondary diploma 6.7
Other specified courses3 5.0
Percent enrolled part time (evenings) 18.7Part time (night) by type of program certificationBTEC/SCOTVEC2
6.8
Royal Society of Arts 13.2City and Guilds 10.9Academic secondary diploma 57.6
Other specified courses3 11.5
1Thirty-three percent of 16- through 18-year-olds in the United Kingdom were enrolled in further education.
2SCOTVEC is the Scottish equivalent of the Business & Technician EducationCouncil's (BTEC) certificate.
3London Chamber of Commerce and Industry's qualifications are included in this category.
NOTE: May not sum to total due to rounding.
SOURCE: Department of Education and Science, Government Statistical Service, Education Statistics for the United
Kingdom, 1991 Edition (London: HMSO, 1992).
55 71
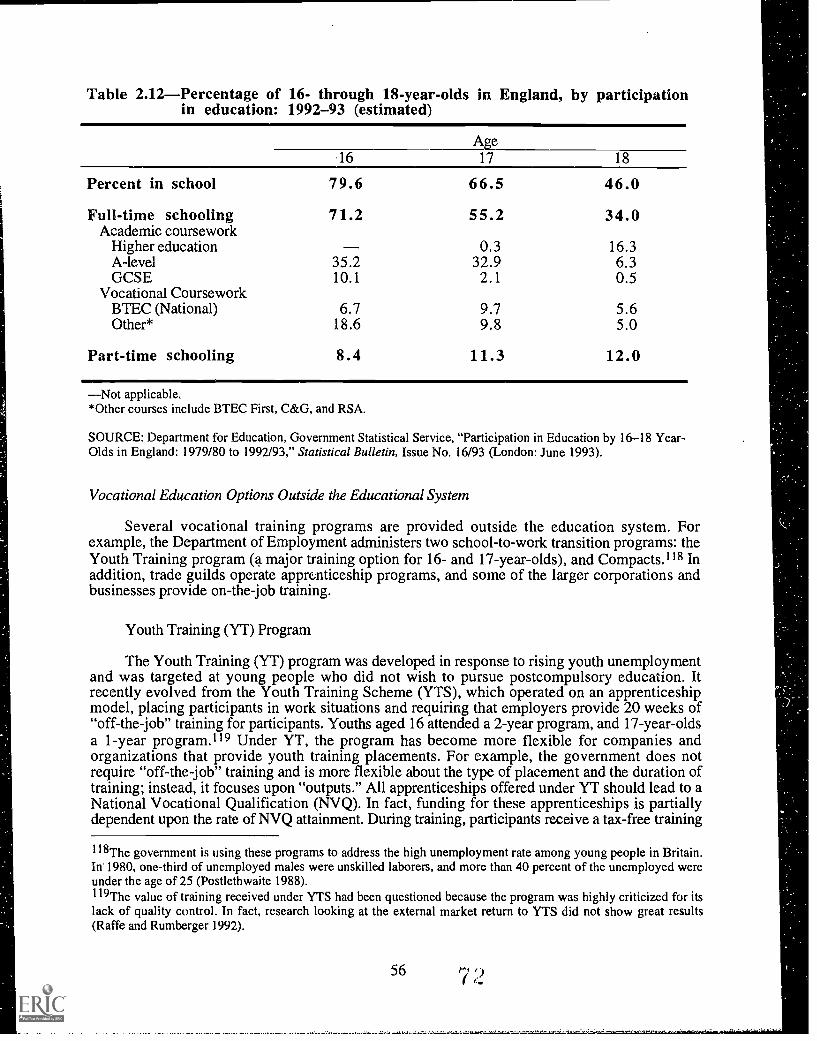
Table 2.12Percentage of 16- through 18-year-olds in England, by participationin education: 1992-93 (estimated)
Age16 17 18
Percent in school 7 9.6 6 6.5 4 6 . 0
Full-time schooling 71.2 55.2 3 4 . 0Academic coursework
Higher education 0.3 16.3A-level 35.2 32.9 6.3GCSE 10.1 2.1 0.5
Vocational CourseworkBTEC (National) 6.7 9.7 5.6Other* 18.6 9.8 5.0
Part-time schooling 8 . 4 11.3 1 2.0
Not applicable.*Other courses include BTEC First, C&G, and RSA.
SOURCE: Department for Education, Government Statistical Service, "Participation in Education by 16-18 Year-Olds in England: 1979/80 to 1992/93," Statistical Bulletin, Issue No. 16/93 (London: June 1993).
Vocational Education Options Outside the Educational System
Several vocational training programs are provided outside the education system. Forexample, the Department of Employment administers two school-to-work transition programs: theYouth Training program (a major training option for 16- and 17-year-olds), and Compacts.I18 Inaddition, trade guilds operate apprenticeship programs, and some of the larger corporations andbusinesses provide on-the-job training.
Youth Training (YT) Program
The Youth Training (YT) program was developed in response to rising youth unemploymentand was targeted at young people who did not wish to pursue postcompulsory education. Itrecently evolved from the Youth Training Scheme (YTS), which operated on an apprenticeshipmodel, placing participants in work situations and requiring that employers provide 20 weeks of"off-the-job" training for participants. Youths aged 16 attended a 2-year program, and 17-year-oldsa 1-year program.119 Under YT, the program has become more flexible for companies andorganizations that provide youth training placements. For example, the government does notrequire "off-the-job" training and is more flexible about the type of placement and the duration oftraining; instead, it focuses upon "outputs." All apprenticeships offered under YT should lead to aNational Vocational Qualification (NVQ). In fact, funding for these apprenticeships is partiallydependent upon the rate of NVQ attainment. During training, participants receive a tax-free training
18The government is using these programs to address the high unemployment rate among young people in Britain.1111980, one-third of unemployed males were unskilled laborers, and more than 40 percent of the unemployed wereunder the age of 25 (Postlethwaite 1988).I l9The value of training received under YTS had been questioned because the program was highly criticized for itslack of quality control. In fact, research looking at the external market return to YTS did not show great results(Raffe and Rumberger 1992).
56 7 9
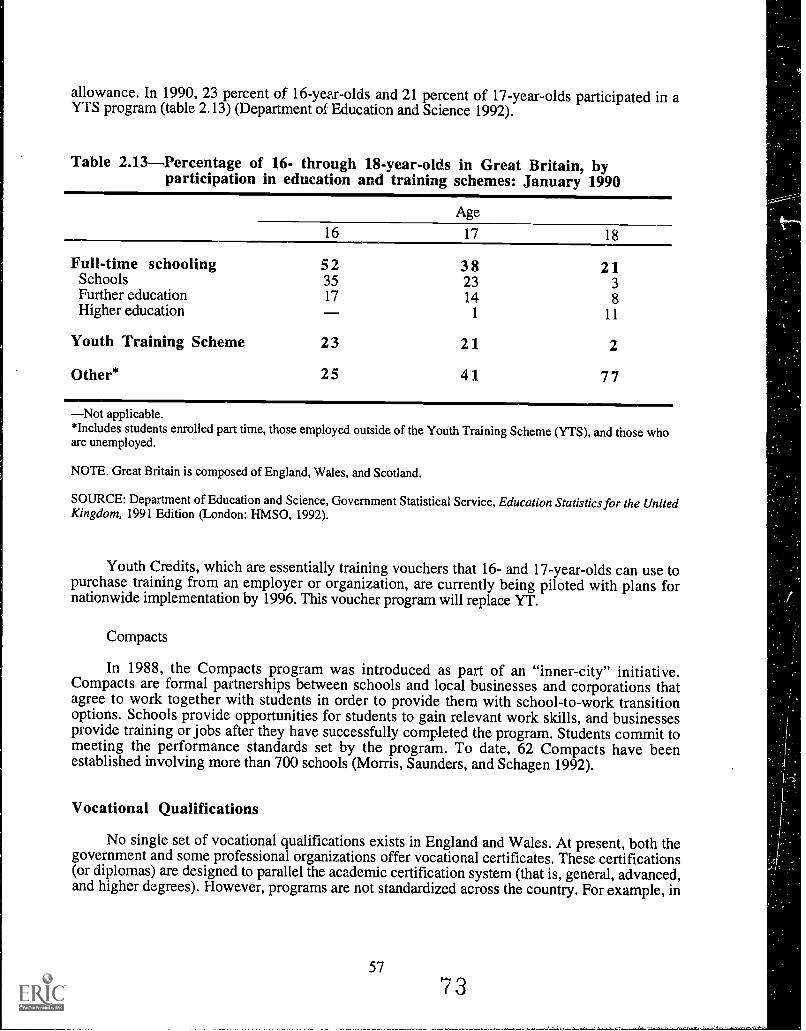
allowance. In 1990, 23 percent of 16-year-olds and 21 percent of 17-year-olds participated in aYTS program (table 2.13) (Department of Education and Science 1992).
Table 2.13Percentage of 16- through 18-year-olds in Great Britain, byparticipation in education and training schemes: January 1990
Age
16 17 18
Full-time schooling 52 38 21Schools 35 23 3Further education 17 14 8Higher education 1 11
Youth Training Scheme 23 21 2
Other* 25 41 77
Not applicable.*Includes students enrolled part time, those employed outside of the Youth Training Scheme (YTS), and those whoare unemployed.
NOTE. Great Britain is composed of England, Wales, and Scotland.
SOURCE: Department of Education and Science, Government Statistical Service, Education Statistics for the UnitedKingdom, 1991 Edition (London: HMSO, 1992).
Youth Credits, which are essentially training vouchers that 16- and 17-year-olds can use topurchase training from an employer or organization, are currently being piloted with plans fornationwide implementation by 1996. This voucher program will replace YT.
Compacts
In 1988, the Compacts program was introduced as part of an "inner-city" initiative.Compacts are formal partnerships between schools and local businesses and corporations thatagree to work together with students in order to provide them with school-to-work transitionoptions. Schools provide opportunities for students to gain relevant work skills, and businessesprovide training or jobs after they have successfully completed the program. Students commit tomeeting the performance standards set by the program. To date, 62 Compacts have beenestablished involving more than 700 schools (Morris, Saunders, and Schagen 1992).
Vocational Qualifications
No single set of vocational qualifications exists in England and Wales. At present, both thegovernment and some professional organizations offer vocational certificates. These certifications(or diplomas) are designed to parallel the academic certification system (that is, general, advanced,and higher degrees). However, programs are not standardized across the country. For example, in
57
7 3
the area of retail, there are four separate professional bodies awarding certificates at the "craft" level(Steedman 1992). Currently, there are almost 1,400 different occupational qualifications (Parkes1991).120
National Vocational Qualifications
There are two national vocational qualifications: the National Vocational Qualification (NVQ)
and the Certificate of Prevocational Education.121
The NVQ is a new kind of qualification established in 1986 and is just being implemented.Ultimately, it will consist of five levels of expertise within each vocational area, each
corresponding to increasing skills and competencies in a given vocation. Students will gain credit
toward qualification by participating in particular education and training programs.122 These
qualifications are meant to be a vocational counterpart to the GCSE and A-level exams.123 In
essence, postcompulsory training courses must meet NVQ criteria before these awards become
nationally recognized vocational qualifications. A National Council for Vocational Qualifications(NCVQ) was established by the government to create and monitor the 5-level competencyframework.
Recently, the government introduced a new qualification, the General National VocationalQualification (GNVQ), which serves as an alternative to the A-level exam. The GNVQ differs from
the NVQ in that it does not imply that a recipient can competently perform the tasks of anoccupation immediately after receiving the qualification. Instead, the qualification is broader and
indicates that the recipient has achieved a foundation of basic skills, knowledge, andunderstandings that underpin a certain range of occupations.
The Certificate of Prevocational Education, introduced in 1985, is a vocational counterpart to
the GCSE. Those preparing for this qualification sample different vocational areas within an"activity-based" learning program. Students can extend their program of studies for 2 years and
qualify for an A-level exam in a specific vocational area.
Four professional organizations provide credentialing: the Business and TechnicianEducation Council (BTEC), the City and Guilds of London Institute (C&G), the Royal Society of
Arts (RSA), and the London Chamber of Commerce and Industry (LCCI).124
BTECoffers certificates and diplomas in business and technical subjects at three levels:1) the First Certificate and Diploma (GCSE level); 2) the National Certificate and Diploma
(A-level); and 3) Higher National Certificates and Diplomas. Programs leading tocertificates are 2 years in duration and involve in-school coursework and on-the-jobtraining. Programs leading to diplomas require 2 years of full-time schooling. (There is
also a 3-year option for those who want to work part time.)
120Institutions that provide further education decide the mix of vocational programs and credentials they will offer
among the many different occupations.121These options were introduced as part of a vocational training reform that sought to unify the myriad of
vocational qualifications, and to provide uniformity, coherence, and a bridge between academic and vocational areas.
122The impact of NVQ is not clear. Some employers who are not familiar with NVQ competencies continue to use
individual profession-4 qualifications as indicators of capabilities.123For example, a level-2 NVQ will be equivalent to four GCSEs, and a level-3 NVQ will be equivalent to two A-
level exams. Presently, there are 285 NVQ qualifications, covering approximately 60 percent of the working
population that fall into the first four levels of competencies.124There are other smaller organizations that offer certificates and qualifications, but the four mentioned above are
the main sources of nationally recognized qualifications.
58 7 4
17' -1, . 4
C&Goffers qualifications in technical, industrial, and commercial fields. Programsleading to C&G qualifications are provided in colleges of further education, trainingcenters, and large companies. C&G offers a variety of skill-level certificates; however, theorganization is mainly concerned with certifying basic and craft vocational education.
RSAoffers three levels of qualifications (elementary, intermediate, and advanced) inbusiness and secretarial skills.
LCCIsimilar to RSA, offers three levels of qualifications in commercial subjects (forexample, foreign languages and office technology).
Vocational Education Curricula
All secondary students aged 11-14 are required to study core and foundation subjects:English, math, science, technology, history, geography, music, art, physical education, and aforeign language. From the ages of 14-16, students take the three core courses (English,mathematics, and science), as well as continuing foundation courses in technology, modernlanguages, physical education, and either history or geography. The Department of Education hasset performance standards for each major national curriculum subject area, and plans are currentlybeing made to assess students against these standards at "key" stages.
In response to an ongoing recession and high youth unemployment rates, the schoolcurriculum now includes more work-readiness and occupational skill training than it hadpreviously. In 1983, the Department of Employment introduced the Technical and VocationalEducation Initiative (TVEI), involving reform designed to make the secondary curriculum morerelevant to the world of work, impart problem-solving skills, and encourage creativity, enterprise,and initiative among students. These programs were designed and administered by LEAs to includea vocational and work-experience component that would lead to a nationally recognized certificateor professional qualification. While every secondary school now has a TVEI program, the futureof these efforts is contingent upon the continued availability of special funding.
Participation in Vocational Education and School-to-Work Transition Programs
In 1992-93, 25 percent of 16-year-olds, 20 percent of 17-year-olds, and 11 percent of 18-year-olds in the United Kingdom were enrolled in full-time vocational education (Department forEducation 1993). In 1990, 15 percent of 16- to 18-year-olds were enrolled in the YTS (Departmentof Education and Science 1992). In 1988, 27 percent of 18-year-olds had participated in both theYTS and further education (figure 2.6).
75
59
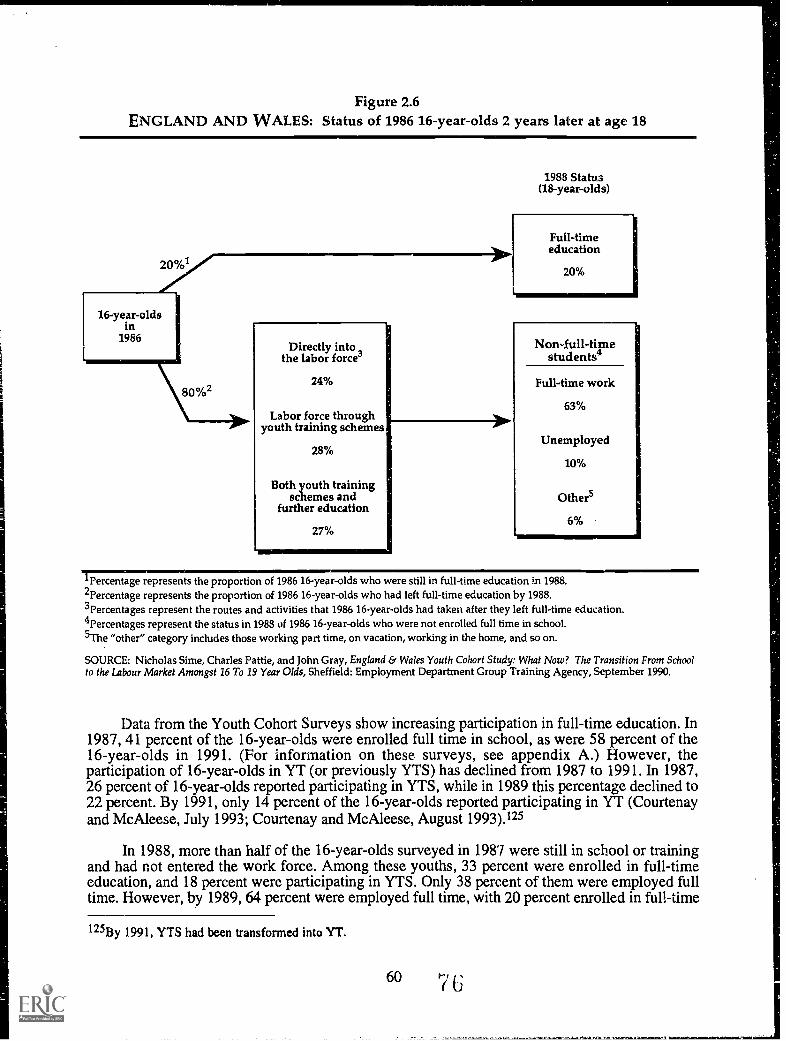
Figure 2.6ENGLAND AND WALES: Status of 1986 16-year-olds 2 years later at age 18
20%1
Directly intothe labor force'
80%224%
111
Labor force throughyouth training schemes
28%
Both youth trainingschemes and
further education
27%
1988 Status(18-year-olds)
Full-timeeducation
20%
Non-full-timestudents4
Full-time work
63%
Unemployed
10%
Others
60/0
1Percentage represents the proportion of 1986 16-year-olds who were still in full-time education in 1988.-Percentage represents the proportion of 1986 16-year-olds who had left full-time education by 1988.3Percentages represent the routes and activities that 1986 16-year-olds had taken after they left full-time education.4Percentages represent the status in 1988 of 1986 16-year-olds who were not enrolled full time in school.5The "other" category includes those working part time, on vacation, working in the home, and so on.
SOURCE: Nicholas Sime, Charles Pattie, and John Gray, England & Wales Youth Cohort Study: What Now? The Transition From Schoolto the Labour Market Amongst 16 To 19 Year Olds, Sheffield: Employment Department Group Training Agency, September 1990.
Data from the Youth Cohort Surveys show increasing participation in full-time education. In1987, 41 percent of the 16-year-olds were enrolled full time in school, as were 58 percent of the16-year-olds in 1991. (For information on these surveys, see appendix A.) However, theparticipation of 16-year-olds in YT (or previously YTS) has declined from 1987 to 1991. In 1987,26 percent of 16-year-olds reported participating in YTS, while in 1989 this percentage declined to22 percent. By 1991, only 14 percent of the 16-year-olds reported participating in YT (Courtenayand McAleese, July 1993; Courtenay and McAleese, August 1993).125
In 1988, more than half of the 16-year-olds surveyed in 1987 were still in school or trainingand had not entered the work force. Among these youths, 33 percent were enrolled in full-timeeducation, and 18 percent were participating in YTS. Only 38 percent of them were employed fulltime. However, by 1989, 64 percent were employed full time, with 20 percent enrolled in full-time
125By 1991, YTS had been transformed into YT.
60 7G

education and only 1 percent participating in YTS. About 40 percent of this cohort had gained avocational qualification. Of those with qualifications, about 75 percent were employed full time;just over half held a C&G qualification; 31 percent held an RSA qualification; and 18 percent held aBTEC qualification (Courtenay and McAleese 1991).
The National Children's Bureau of London conducted a perinatal mortality survey of a cohortof children born in the first week of March 1958. Since then, several follow-up surveys of thiscohort have been conducted. The most recent follow-up for which data are available was conductedin 1981 when the cohort was 23 years old. (For more information on this survey, see appendix A.)At the time of the survey, more than half of the cohort had at least one upper secondaryqualification. Of these 23-year-olds, 22 percent had their highest level of qualification at the uppersecondary level, 13 percent at the postsecondary level, and 16 percent at the higher or advancedtechnical level. Of those whose highest level of qualification was upper secondary, about half hadreceived an academic qualification, while the other half had obtained a vocational qualification. Atthe postsecondary level, 87 percent had received their qualification in a vocational subject area, and13 percent in an academic area. At the higher/advanced technical level, 78 percent had receivedtheir qualification in an academic subject area, while the remainder had received it in a vocationalsubject area (Kerchoff 1993).
7761

Vocational Education in the United States
Education in the United States takes place in a highly decentralized context in which states
and local education authorities exercise considerable autonomy and authority for establishingrequirements for students, teacher certification, governance, and financing. Compulsory educationrequirements vary, but generally run from around age 6 to 16.
There are a variety of grade-level patterns in schools, two of which are particularly common:kindergarten plus 6 years of elementary school, followed by 3 years of junior high school, and 3
years of high school; or kindergarten plus 4 or 5 grades, a 3- or 4-ear middle school, and a 4-yearhigh school. The vast majority of students attend publicly supported nonselective schools, whileabout 10 percent of elementary and secondary students attend private institutions, many of which
are religiously affiliated.
The U.S. education system is unique in that it provides students with multiple opportunities
to change the course of their education. Secondary students are not generally placed in strict tracks.
Instead, they are able to explore various curricular areas in both vocational and academic education.For example, a secondary student who took primarily college preparatory courses can switch totaking courses designed to prepare one for an occupation after graduation. A student whoconcentrated in vocational education at the secondary level can enroll in academic courses at apostsecondary institution that enrolls all applicants with a high school diploma, and can eventually
complete a baccalaureate degree.
Vocational education in the United States is a multifaceted enterprise. Although primarily apublic activity at the secondary level, vocational education constitutes an important part of thecurriculum in both public and private postsecondary institutions. Students at both levels participate
to varying degrees, with some electing to take one or more courses, others completing full
programs preparing them for employment, and still others earning diplomas, certificates, or
degrees.
Organization of Vocational Education
Introductory vocational education and training are generally offered for the first time in grade
7, and are primarily school based. Occupation-related vocational education is usually not offered
until high school and much of it takes place at the postsecondary level. Vocational education
continues to be primarily school based through the postsecondary level.
Organization of Vocational Education at the Secondary Level
Most vocational education is offered at the secondary level in grades 7 through 12, chiefly
through the public school system. Specific course offerings vary by district and even by school,with some locales offering only a few courses and others providing an extensive array ofvocationaltechnical programs. Nonoccupationally specific courses, such as courses in consumerand homemaking education and courses teaching general labor market skills, are taught throughout
the secondary years, while occupationally specific courses are generally reserved for grades 10
through 12.
Public vocational education is delivered through several different institutional arrangements,the most common including comprehensive high schools, part-time area vocational schools, and
6278
full-time vocational high schools. The term "comprehensive high school" refers to the typical U.S.public high school. Comprehensive high schools offer both academic and vocational courses. Thevast majority of instruction in vocational education takes place in comprehensive high schools,although most of these schools focus primarily on teaching academic subjects.
Area vocational schools provide a centrally located vocational facility and are shared by twoor more "feeder" high schools. Students attend the area vocational school for part of the day toreceive their vocational instruction, while pursuing their academic studies at their home highschool. Under this arrangement, occupationally specific courses are generally taught at the areavocational school, while nonoccupationally specific vocational education courses, such as homeeconomics and some keyboarding or introductory computer courses, are taught at the home highschool. Full-time vocational high schools, on the other hand, offer a complete program ofacademic and vocational studies. This type of arrangement is often found in large cities. Full-timevocational high schools differ from comprehensive high schools in that their primary focus isvocational rather than academic, and they are often organized around a particular industry, such asaviation or health.
Organization of Vocational Education at the Postsecondary Level
Since the purpose of vocational education has been defined in federal legislation as preparingstudents for employment that does not require a baccalaureate or advanced degree, postsecondaryvocational programs generally lead to an associate degree or certificate. Vocational education at thislevel is delivered through a variety of public and private institutions. Although most postsecondaryvocational education is provided by less-than-4-year postsecondary institutions that do not offerbaccalaureate degrees, some 4-year colleges and universities do offer certificates and asscciatedegrees in vocational areas.
In 1989, almost 8,000 postsecondary institutions offered vocational education in the UnitedStates (Hoachlander et al. 1992). Approximately two-thirds of these institutions were private, for-profit. The public 2-year institution was the next most common type of institution offeringvocational education programs, followed by private, nonprofit iess-than-4-year institutions, 4-yearinstitutions, and public vocationaltechnical institutes. However, since the size of institutionsvaries considerably, the number of schools does not reflect the number of students being served byeach institutional type.
Private, for-profit institutions offer a variety of vocational programs ranging from very shortcertificate programs (6 weeks, for example) to 2-year associate degree programs. Public2-year institutions typically offer.2-year assojate degree programs and certificate programs of upto 2 years in duration. Public vocationaltechnical institutes differ from public 2-year institutions inthat the institutes generally do not award associate degrees and are more likely to provide certificateprograms lasting 1 year or less. Finally, some 4-year institutions offer programs leading to short-and long-term certificates or to an associate degree. While public 2-year institutions and 4-yearinstitutions generally offer programs of study in both academic and vocational areas, vocationaltechnical institutes and private, for-profit schools almost exclusively offer vocational education.
Vocational Education Curriculum
Secondary Level
States require students to take certain numbers of courses, as well as certain numbers ofcourses in specific areas in order to earn a high school diploma. Requirements have been
63 9
established in mathematics, science, and English in all states; most states have also set standards in
history and social studies; and some have requirements for foreign language, life skills, and fine
arts. These requirements, which are primarily academic subjects, must be achieved by all students,
including those who are concentrating on vocational options.
One authority in the vocational education research field has divided the secondary vocational
curriculum into three curricular areas for research purposes: 1) consumer and homemaking
education, 2) general labor market preparation, and 3) specific labor market preparation
(Hoachlander 1989; Hoachlander 1994; and Hoachlander et al. 1992). Consumer and homemaking
education provides students with training and skills related to home and family life. Courses
include instruction in the areas of food and nutrition, individual and family health, consumer
education, family living and parenting education, child development and guidance, housing, home
management (including'resource management), and clothing and textiles.126 General labor market
preparation teaches skills that can be applied broadly to various personal or occupational settings,
including courses such as beginning typing, industrial arts or technology education, work
experience and career exploration, business math, and business English. Grouped together,
general labor market preparation and consumer and homemaking courses make up thenonoccupationally specific vocational education curriculum. In contrast, specific labor market
preparation includes introductory, advanced, and elective courses in seven occupational areas:
agriculture, business, marketing and distribution, health, occupational home economics, trade and
industry, and technical and communication. Personal health courses that teach students about
taking care of themselves are not considered part of the vocational curriculum.
Students who concentrate in vocational education participate in only slightly fewer academic
courses than students without such a concentration. However, students who concentrate invocational education participate in considerably fewer advanced academic courses, such as
chemistry and physics (Hoachlander 1992).
Postsecondary Level
Unlike secondary vocational education, postsecondary vocational education in the United
States offers only an occupationally specific curriculum.127 Postsecondary vocational education
includes seven broad categories of occupational courses: agriculture, business and office,marketing and distribution, health, home economics, trade and industry, and technical education.
These categories of vocational courses correspond to the seven program areas of specific labor
market preparation at the secondary level, although the postsecondary programs generally prepare
students for more advanced employment opportunities.
126The Carl D. Perkins Vocational and Applied Technology Amendments of 1990, Public Law 101-392, sec. 311.
127Although postsecondary vocational education courses are organized into occupationally specific programs,
students may enroll in these courses for a variety of personal and occupational reasons. In addition, adult or
continuing vocational education in the United States encompasses general labor market courses such as personal
typing and occupationally specific courses. However, these courses differ from postsecondary vocational education
courses in that they generally are not offered for credit. Adult or continuing vocational education may be delivered
through secondary or postsecondary institutions or through other arrangements.
64
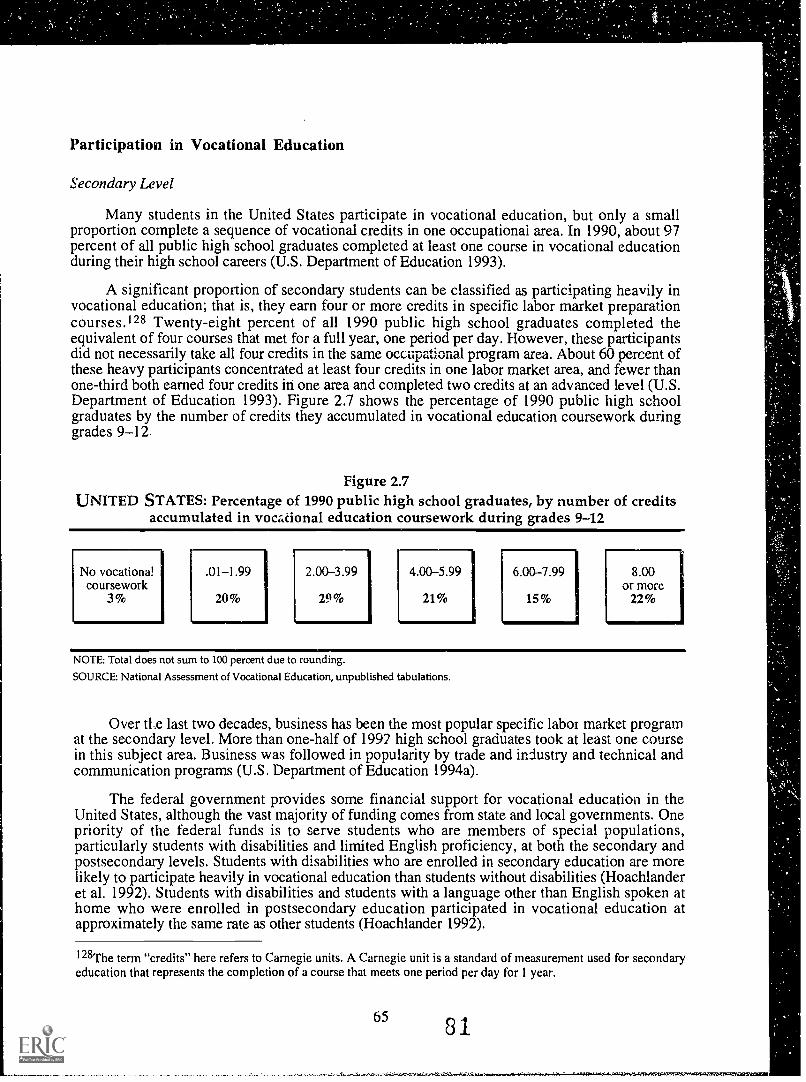
Participation in Vocational Education
Secondary Level
Many students in the United States participate in vocational education, but only a smallproportion complete a sequence of vocational credits in one occupational area. In 1990, about 97percent of all public high school graduates completed at least one course in vocational educationduring their high school careers (U.S. Department of Education 1993).
A significant proportion of secondary students can be classified as participating heavily invocational education; that is, they earn four or more credits in specific labor market preparationcourses. 128 Twenty-eight percent of all 1990 public high school graduates completed theequivalent of four courses that met for a full year, one period per day. However, these participantsdid not necessarily take all four credits in the same occupational program area. About 60 percent ofthese heavy participants concentrated at least four credits in one labor market area, and fewer thanone-third both earned four credits in one area and completed two credits at an advanced level (U.S.Department of Education 1993). Figure 2.7 shows the percentage of 1990 public high schoolgraduates by the number of credits they accumulated in vocational education coursework duringgrades 9-12_
Figure 2.7UNITED STATES: Percentage of 1990 public high school graduates, by number of credits
accumulated in vocational education coursework during grades 9-12
No vocationalcoursework
.01-1.99 2.00-3.99 4.00-5.99 6.00-7.99 8.00or more
3% 20% 29% 21% 15% 22%
I
NOTE: Total does not sum to 100 percent due to rounding.
SOURCE: National Assessment of Vocational Education, unpublished tabulations.
Over the last two decades, business has been the most popular specific labor market programat the secondary level. More than one-half of 1992 high school graduates took at least one coursein this subject area. Business was followed in popularity by trade and industry and technical andcommunication programs (U.S. Department of Education 1994a).
The federal government provides some financial support for vocational education in theUnited States, although the vast majority of funding comes from state and local governments. Onepriority of the federal funds is to serve students who are members of special populations,particularly students with disabilities and limited English proficiency, at both the secondary andpostsecondary levels. Students with disabilities who are enrolled in secondary education are morelikely to participate heavily in vocational education than students without disabilities (Hoachlanderet al. 1992). Students with disabilities and students with a language other than English spoken athome who were enrolled in postsecondary education participated in vocational education atapproximately the same rate as other students (Hoachlander 1992).
128The term "credits" here refers to Carnegie units. A Carnegie unit is a standard of measurement used for secondaryeducation that represents the completion of a course that meets one period per day for 1 year.
65 81
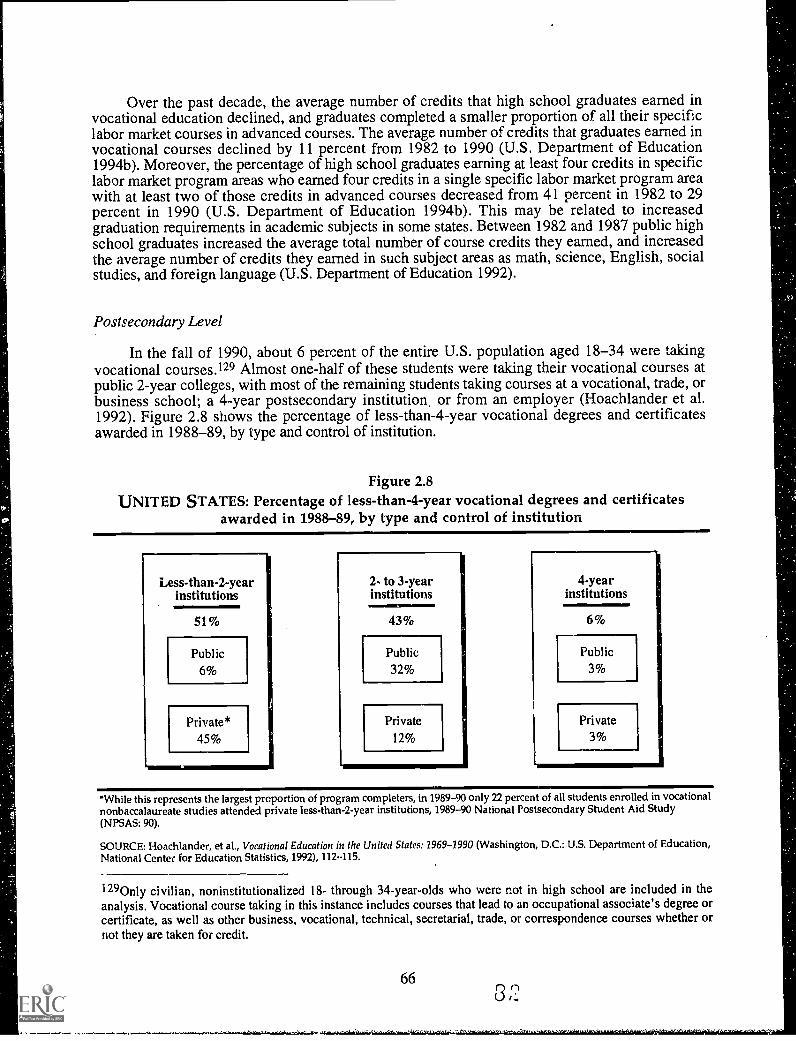
Over the past decade, the average number of credits that high school graduates earned invocational education declined, and graduates completed a smaller proportion of all their specificlabor market courses in advanced courses. The average number of credits that graduates earned invocational courses declined by 11 percent from 1982 to 1990 (U.S. Department of Education1994b). Moreover, the percentage of high school graduates earning at least four credits in specificlabor market program areas who earned four credits in a single specific labor market program areawith at least two of those credits in advanced courses decreased from 41 percent in 1982 to 29percent in 1990 (U.S. Department of Education 1994b). This may be related to increasedgraduation requirements in academic subjects in some states. Between 1982 and 1987 public highschool graduates increased the average total number of course credits they earned, and increasedthe average number of credits they earned in such subject areas as math, science, English, socialstudies, and foreign language (U.S. Department of Education 1992).
Postsecondary Level
In the fall of 1990, about 6 percent of the entire U.S. population aged 18-34 were takingvocational courses.129 Almost one-half of these students were taking their vocational courses atpublic 2-year colleges, with most of the remaining students taking courses at a vocational, trade, orbusiness school; a 4-year postsecondary institution, or from an employer (Hoachlander et al.1992). Figure 2.8 shows the percentage of less-than-4-year vocational degrees and certificatesawarded in 1988-89, by type and control of institution.
Figure 2.8UNITED STATES: Percentage of less-than-4-year vocational degrees and certificates
awarded in 1988-89, by type and control of institution
Less-than-2-year 2- to 3-year 4-yearinstitutions institutions institutions
51% 43% 6%
Public Public Public
6% 32% 3%
Private* Private Private I
45% 12% 3%
*While this represents the largest proportion of program completers, in 1989-90 only 22 percent of all students enrolled in vocationalnonbaccalaureate studies attended private less-than-2-year institutions, 1989-90 National Postsecondary Student Aid Study(NPSAS: 90).
SOURCE: Hoachlander, et al., Vocational Education in the United States: 1969-1990 (Washington, D.C.: U.S. Department of Education,National Center for Education Statistics, 1992), 112-115.
1290nly civilian, noninstitutionalized 18- through 34-year-olds who were not in high school are included in theanalysis. Vocational course taking in this instance includes courses that lead to an occupational associate's degree orcertificate, as well as other business, vocational, technical, secretarial, trade, or correspondence courses whether orriot they are taken for credit.
66
When focusing on the postsecondary student population nationally, vocational educationplays an even more important role. Students enrolled in less-than-4-year postsecondary institutionsroutinely take vocational education courses. Of the 1980 high school seniors enrolled in public2-year postsecondary institutions by 1984, about four-fifths had taken at least one course in thevocational education curriculum. Similarly, of those students enrolled in private less-than-4-yearinstitutions, almost nine out of ten took one or more courses in vocational education. At publicvocationaltechnical institutes and private proprietary schools, virtually every student enrolled tookcourses in vocational education (Hoachlander et al. 1992). Furthermore, postsecondary students atall socioeconomic and academic ability levels were equally likely to participate in vocationaleducation, as were handicapped and nonhandicapped students (Hoachlander et al. 1992).
The pattern of student enrollment in postsecondary vocational programs is similar to that ofprogram enrollment at the secondary level. Of 1980 high school seniors taking at least onevocational course at a public 2-year institution by 1984, about one-half had taken a businesscourse. Computers/data processing was the second most popular program, followed by homeeconomics.
Student Outcomes
Secondary Level
Students who take more vocational education courses in high school are more likely to beemployed full time after graduation. Specifically, those 1982 public high school graduates who hadcompleted the equivalent of eight or more credits in vocational education and who were notenrolled in rstsecondary education 6 months after graduation were one and a half times as likelyto be emplol red full time as graduates who had completed the equivalent of less than two vocationalcredits and were also not participating in postsecondary education (50 percent versus 34 percent).In addition, those students who participated heavily in vocational education were less likely to beemployed part time than graduates with little vocational coursework (15 percent versus 25 percent)(Hoachlander et al. 1992). Equally important, those who earned many vocational credits in acoherent program of study were more likely to find jobs utilizing their training than were thosewith many vocational credits in a variety of fields (U.S. Department of Education 1993).
Postsecondary Level
Participation in vocational education at the postsecondary level does not appear to affect theshort-term earnings of former students. Former postsecondary students who earned varyingnumbers of vocational credits in public 2-year institutions in the early 1980s earned roughly thesame hourly wages 6 months after their last enrollment in a public 2-year institution. Studentsemployed either full time or part time earned about $5.00 an hour, and students with morevocational credits earned just as much as those with fewer credits. However, any benefits in
earnings due to greater vocational course taking may take longer than 6 months to appear; in otherwords, course taking may not affect starting salaries as much as it may influence future earningpotential (Hoachlander et al. 1992).130 Further, with regard to economic outcomes, students whoattended community colleges and undertook vocational training were more likely to be employedand were more likely to utilize their vocational credits than were trainees from other kinds ofinstitutions (U.S. Department of Education 1993).
credits per se. It has been hypothesized that the major economic outcome of a college education is its credentialing orlabeling consequences. Differences in potential earnings might arise, other things being equal, not only becausefurther education imparts useful knowledge to workers but also beca:se employers use educational attainment, such
as degrees or certificates earned, as a convenient screening device for filtering persons into specific jobs. Incremental
Douglass, "Economic Returns on Investments in Higher Education," in Investments in Learning, ed. H. Bowen (San
Francisco: Jossey-Bass Publishers, 1977).
increases in credits earned short of actual degree attainment, therefore, may not influence earning potential. See G.K.
130It is also possible that there are few economic advantages to the accumulation of more academic or vocational
688'l
Summary and Conclusion
Systems of vocational education and training are rooted in national traditions. Predominantmechanisms and processes of training reflect differing views of how to best develop work-relatedskills among the young. Some countries organize vocational education and training around in-school programs, others around the workplace and on-the-job apprenticeships, and otherscombine both. While some countries focus on classroom instruction as a primary way ofpreparing and credentialing in vocational areas, other countries emphasize hands-on skillbuilding with limited technical classroom training. Across systems, vocational education plays agreater or lesser role, compared with a general academic preparation. Differences from countryto country reflect philosophies of education and different perspectives regarding how muchemphasis should be placed on vocational preparation in contrast to traditional academics.Furthermore, some countries have a long tradition of cooperation among employers, unions, andschools that creates a particular vocational education and training environment. In othercountries, vocational education and training are not regarded as highly as academic educationthat is, some systems are basically organized to prepare students for postsecondary education,and issues of work force preparation receive less attention.
Despite sharing high levels of development, the G-7 countries have approached the processof vocational education and training in very different ways. Table 2.14 summarizes thecharacteristics of each country's programs. While a few commonalities are evident, it is thedifferences that are most apparent. The narratives in this chapter were designed to provide anessential context for evaluating data on vocational education and training and the comparabilityof data across educational systems.
69 85

Table 2.14Summary of vocational education and training options* in G-7 countries
VOCATIONAL
PRIMARY MOM 0,3100,110 CPIA Ciii 1'6:AMON ORCOUNTRY EcivartOKAAt$ '-`:' itat.itNt' :: TAAIN640::- QUALIFICATION OPPYRED
Canada Community colleges (postsecondary) School-based Provincial diploma orcertificate
France Vocational high school(upper secondary) (Lycie)
School-based National upper secondaryvocational certificate (CAP)
National upper secondaryoccupational certificate(BEP)
National vocational highschool diploma (BP)
Germany Dual system (upper secondary) Both firm-basedand school-based
National industry & guildcertification (journey-man, skilled blue- andwhite-collar workers)
Full-time vocational schools School-based (as above)(upper secondary)
Part-time vocational schools School-based (as above)(upper secondary)
Italy Technical school (upper secondary) School-based National technical schoolleaving certificate
Vocational school (upper secondary) School -based National vocationalschool leaving certificate
Japan Comprehensive and vocational highschools (upper secondary)
School-based High school diplomas
Special training & miscellaneousschools (upper secondary & postsecondary)
School-based National skill certification(mainly industrial) orinstitution certificates ofcompletion
Technical colleges (upper secondary &postsecondary)
School-based Institution certificatesof completion orpostsecondary degree
Junior colleges School-based (as above)
UnitedKingdom
Youth training (YT) (upper secondary) Firm-based National industry andguild qualifications
(EnglandSc Wales) Tertiary colleges, technical colleges, and
colleges of further educationSchool-based National vocational
qualification (NVQs)(upper secondary)
UnitedStates
Comprehensive and vocational highschools and area vocational centers
School-based High school diplomas
(upper secondary)
4-year degree-granting institutions(postsecondary)
School-based Associate degrees orvocational certificates
2- to 3-year degree-granting institutions School-based (as above)(generally community colleges)(postsecondary)
Non-degree-granting institutions(generally vocational-technicalinstitutes and proprietary schools)
School-based Vocational licenses orcertificates
(postsecondary)
'There are small long-standing apprenticeship programs in Canada, France, and the United States. These programs are not included becausethey are not administered by the Department or Ministry of Education.
70 6b
Chapter 3
Cross-National Comparisons of Data onVocational Education and Training
This chapter begins by discussing some of the issues associated with collecting data onvocational education in the international forum and making cross-national comparisons. The nextsection identifies three types of indicators that are especially appropriate to cross-nationalanalysis, and then describes the data that are available on these indicators. The chapter concludeswith a discussion of ways to enhance cross-national vocational education comparisons.
Factors Constraining Cross-National Comparisons
Governments collect data about the scope and effectiveness of vocational educationprograms in order to meet requirements for information, based on national goals and objectives.As a result, data from national government sources are generally not tailored to the needs of theinternational forum. Accordingly, this section notes several issues that must be considered whenmaking international comparisons of data on vocational education.
As described in the preceding chapter, countries take very different approaches tovocational education. These approaches reflect individual cultures and philosophies ofeducation,which in turn yield varied vocational education and training strategies. The data governmentscollect, what they report, and how they report these data differ from country to country. Thesefactors have implications for cross-national comparisons. Two issues are particularlyconfounding.
1. Since definitions as to what constitutes vocational education vary cross-nationally, it isoften difficult to find common, comparable elements across systems.
Countries differ considerably in the types of programs they define as constitutingvocational education or technical training. The European Centre for the Development ofVocational Training devotes an entire publication to defining and comparing terminologyassociated with vocational training in nine countries (CEDEFOP 1987). Important differencesundermine comparability from system to system. For instance, apprenticeship programs areviewed as education functions in some countries and as manpower training in others. InGermany, for example, the "Dual System," which has both apprenticeship and in-school trainingdimensions, is administered by the Education Ministry. In England and Wales, Youth Training(YT), an apprenticeship-like program that does not have an in-school component, is administeredby the Employment Department, rather than the Department of Education and Science. A similarproblem occurs with data from almost every country including the United States. Further, even ifenrollments could be counted in a comparable fashion, the data would not provide a comparablemeasure. While Germany, England and Wales, and the United States, have apprenticeshipprograms, the nature of each initiative is substantially different. As Keith Drake, Director ofContinuing Education and Training, University of Manchester, England, noted:
It is tempting to tabulate data on apprentices across [systems]. However,the same word"apprentice"---is used for very different acti "ities andattainments from country to country. . . Training statisticians are still
71
8r
struggling to produce usable comparative training data . . . without writingfor each country in each table a short explanatory essay on the nature ofthe training (Drake 1991, 212).
As subsequent sections of this chapter will show, countries "count" vocational students indifferent ways. This is a function of the structure of the vocational systemwhether programsare based "in" or "out" of school, whether certain kinds of youth or employment trainingactivities fall under the jurisdiction of education or labor ministries, and so forth. Because not allvocational education programs are provided by education authorities, when examining cross-national data, considerable effort must be devoted to describing who is being counted and howand why one country's way of counting vocational enrollments, or program completers, issimilar to or different from another.
2. While some vocational education programs may appear to be similar, this may maskdifferences that diminish the utility of some cross-national comparisons.
Constructing comparable data describing vocational education is difficult because differenttypes of training take place at different agegrade levels across systems. Hence, while programofferings may appear to be similar, the content of coursework may be very different.. Forexample, what is expected in a vocational program at the upper secondary level in one countrymay be considered postsecondary training in another country. What students are expected tolearn and the kinds of employment that they are being prepared for may be completely different.
Achieving relatively comparable cross-national data requires careful management of dataand data sources. Realistic expectations are essential, and it is important to focus on thosecomparisons that are of greatest value, recognizing that only certain types of comparisons areappropriate in the international forum.
Three Key Indicators for International Vocational Education Comparisons
Education indicators are more than statistics. They are policy-relevant measures of thepurpose, processes, and outcomes of education systems. Given constraints that so fundamentallydistinguish the nature of vocational education and training across systems, three types ofindicators are proposed here as appropriate for cross-national vocational educationcomparisonsparticipation rates, vocational student supply and demand, and labor forceoutcomes for vocational participants and completers.
Indicator 1: Vocational Education Participation Rates
The most basic type of data that offers important cross-national comparisons of thevocational education landscape concerns rates of participation. Data on the proportion of studentsat the secondary and postsecondary levels who are enrolled in and are completing vocationaleducation and related training programs would suggest the relative emphasis that educationsystems place on technically preparing those students who are not pursuing traditional academiccurricula for participation in the work force.
72 8 '6
At first glance, counts of vocational education participants do not seem difficult to achieve.This is the case as long as each country's own definition of vocational education prevails. Thus,for example, it is possible to estimate the number of French students enrolled in school-basedvocational programs. However, this count does not include those enrolled in a variety of otherjob-training programs that have schooling components, but that are not administered by theEducation Ministry. In contrast, the German Education Ministry's counts of participation invocational education include students involved in a variety of programs, some of which are notschool based but that include a formal education component and are administered by theEducation Ministry. Without careful qualification, one country may appear to have very high orlow levels of vocational program participation compared with another country, when in fact therates of participation are quite similar.
The United States has its own counting dilemma: at the secondary level, there is no specificdefinition of a vocational education student (Hoachlander 1994). In contrast, in most G-7countries (as noted in chapter 2), students are enrolled in particular curriculaacademic, general,or vocational. Since secondary schools in the United Stat,:s do not formally categorize students interms of a curriculum concentration, this raises the fundamental problem of determining a basisagainst which to compare participation rates in other vocational systems with participation ratesin the United States. In fact, almost all students in the United States participate in the vocationalcurriculum at some point in secondary school, and a majority of students in less-than-4-yearpostsecondary institutions have taken vocational courses. (See Hoachlander et al. 1992 for areview of data and trends.) In order to make overall statistical comparisons of participation ratesin vocational education in the United States with those of other countries, it is necessary to createan artificial constructin other words, an American "definition" of a vocational educationstudentso that there will be a common framework. One might argue whether it is appropriateto designate students as "vocational concentrators" in the United States (since most schools donot). However, in order to make cross-national comparisons, some kind of construct is necessary.
As a data collection issue, there are several ways to address problems associated withdifferent ways of defining participation from country to country. One alternative is to reduce dataon participation to a common base. For example, in the case of the United States, one might beinterested in knowing about participation in school-based vocational education and trainingbecause that is where most training occurs in the American system. With substantial effort itmight be possible to identify those students in other countries who are in school-based programs.Once this is done, however, it must be understood that only a small portion of the populationparticipating in training may have been described for countries that support substantial vocationaltraining efforts that are not school based. A second alternative is to qualify the data onenrollments and participation from country to country so that the school-based commitments tovocational education and training are seen within the larger, or prevailing, context of eachcountry. In this instance, the first step would be to describe total levels of participation in bothschool-based and nonschool-based programs, and then focus detailed analysis on just the school-based populations. A third alternative is to qualify the data by categorizing countries in terms oftheir vocational education and training foci; although the school-based vocational education andtraining framework may be highly appropriate for making comparisons among some countries, itmay not be in others. This would involve grouping and comparing countries within these twocategories, so that countries with mostly school-based training are analyzed as one group, whilecountries with training that is mostly not school based are analyzed separately.
8973

These common sense ways of dealing with genuine differences in systems of education areoften disregarded in an effort to create an illusion of commonality across countries. Under anycircumstance, deriving cross-national participation rates in vocational education and training mayraise as many questions as are answered. It is most important to know whether studentsparticipating in similar kinds of programs have been compared, or whether apparent differencesin participation rates simply reflect. variations in how systems of education and training areorganized.
Indicator 2: Vocational Student Supply and Demand
A second indicator describes the vocational education and training priorities acrosscountries, as they are reflected in the kinds of programs available, the extent of enrollment indifferent curricula, and the demand for workers in each field of study. This indicator wouldprovide a perspective on how or whether countries encourage student enrollment in occupationalclusters that are in demand, and how that demand differs from country to country. Generally, thisindicator would offer a measure of the "pipeline," and also a way of understanding the fitbetween the pipeline and national labor markets.
Data on participation in different types of programs, as well as measures of labor forcesupply and demand by occupation, are difficult to place into a framework amenable to cross-national comparison. Courses of study differ from country to country across levels of schooling.In some countries, vocational education and training are targeted at the upper secondary level,while in others at the postsecondary level. There also tend to be considerable differences in thelevel of expertise expected as a result of program participation, with implications for the kinds ofemployment for which programs are attempting to prepare participants, which can easily be lostin cross-national analyses. France, for example, has programs that train young people for jobs inparticular fields, but at different entry levels, requiring substantially different academic andvocational qualifications. These differences would be lost in simple cross-national comparisons.
Indicator 3: Labor Force OutcomesWhat Happens to Program Participants?
A third cross-national comparison measures student outcomesthat is, the circumstancesof vocational program participants in the labor force. These comparisons would includeinformation concerning success rates in placing participants who complete different types oftraining in jobs, data on earnings of new workers, and information collected over time about thecareer paths of program participants and completers. These data would provide helpful indicatorsof both the success of programs (in terms of placements) and of workers (in terms of finding andkeeping jobs as well as economic returns).
Comparisons of labor force outcomes represent ways of estimating the success ofvocational education and training efforts, although appropriate data sources may be difficult tofind and interpret. It may be particularly difficult to find data cross-nationally at specified pointsin time (for example, a certain number of months or years after program completion). Moreover,it may not be clear whether the payoffs of program completion are achieved at the same timefrom country to country. (For example, some programs may result in immediate benefits inearnings to completers, while others may have long-term benefits that occur over time.)Snapshots of earnings and employment outcomes cross-nationally, which are taken at specifiedpoints in time, may not account for these types of differences.
74
Status of Cross-National Comparisons for the Key Vocational Education Indicators
These three types of vocational education indicators have received relatively little attentionat the cross-national level. As noted above, given the complexity of national vocational educationand training systems and given differences across systems, these comparisons are difficult toachieve.
A few efforts have been made to report and compare vocational education data. At theinternational level, the Organization for Economic Cooperation and Development (OECD), theUnited Nations Educational, Scientific, and Cultural Organization (UNESCO), and the StatisticalOffice of the European Communities (EUROSTAT) are among the agencies publishing data onvocational education. In all cases, member governments provide the data. OECD, in particular,through the International Education Indicators (INES) project, has developed methodologiesintended to reconcile differences in education data reporting systems among membergovernments. Generally, however, data on vocational education and training from internationalorganizations do not grapple with the differences among systems, and the comparabilityquestions are significant.
Tables 3.1 and 3.2 from the OECD represent the kinds of data that are available. Table 3.1distributes upper secondary students across curricula. In effect, it documents the degree to whichupper secondary students are participating in the vocational curriculum. No data were availablefrom Canada, which collects most data at the provincial rather than at the national level (andthese data are not aggregated); or from the United States, which as discussed earlier does notcategorize and define upper secondary students in terms of their curricular concentration. Table3.2, which characterizes only full-time upper secondary students, was derived from unpublishedmaterials and provides additional detail about the G-7 upper secondary vocational population.These two tables reflect efforts to compare systems, although each is constrained by differencesin definitions among curricular concentrations (countries may not define the same subject matteror activities as vocational); by differences in the organization of schools from system to system(neither the age of students at particular grade levels nor upper secondary grade configurationscan be standardized across countries); and by differences in how data on student concentrationsare derived.
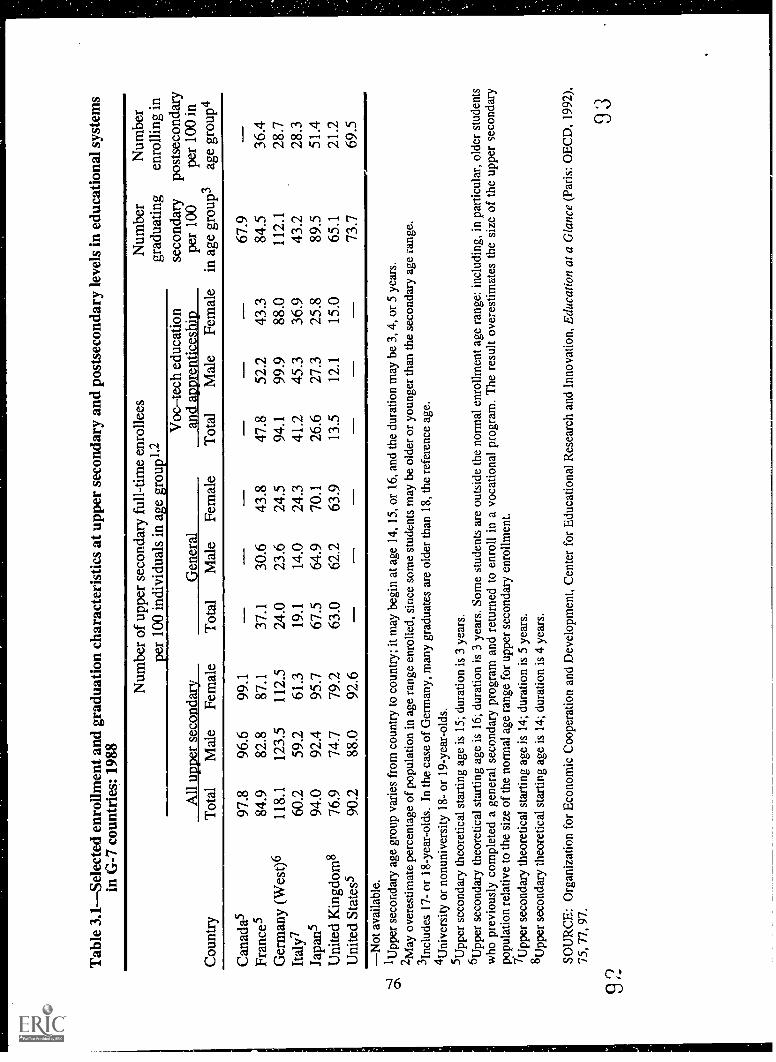
9
Tab
le 3
.1-S
elec
ted
enro
llmen
t and
gra
duat
ion
char
acte
rist
ics
at u
pper
sec
onda
ry a
nd p
osts
econ
dary
leve
ls in
edu
catio
nal s
yste
ms
in G
-7 c
ount
ries
: 198
8
Num
ber
per
of u
pper
sec
onda
ry f
ull-
time
enro
llees
100
indi
vidu
als
in a
ge g
roup
1,2
Voc
-tec
h ed
ucat
ion
Num
ber
grad
uatin
gse
cond
ary
Num
ber
enro
lling
inpo
stse
cond
ary
All
uppe
r se
cond
ary
Gen
eral
and
appr
entic
eshi
ppe
r 10
0pe
r 10
0 in
Cou
ntry
Tot
alM
ale
Fem
ale
Tot
alM
ale
Fem
ale
Tot
alM
ale
Fem
ale
in a
ge g
roup
3ag
e gr
oup4
Can
ada5
97.8
96.6
99.1
--
67.9
Fran
ce5
84.9
82.8
87.1
37.1
30.6
43.8
47.8
52.2
43.3
84.5
36.4
Ger
man
y (W
est)
611
8.1
123.
511
2.5
24.0
23.6
24.5
94.1
99.9
88.0
112.
128
.7It
aly?
60.2
59.2
61.3
19.1
14.0
24.3
41.2
45.3
36.9
43.2
28.3
Japa
ns94
.092
.495
.767
.564
.970
.126
.627
.325
.889
.551
.4U
nite
d K
ingd
oms
76.9
74.7
79.2
63.0
62.2
63.9
13.5
12.1
15.0
65.1
21.2
Uni
ted
Stat
es5
90.2
88.0
92.6
-73
.769
.5
0
-Not
ava
ilabl
e.1U
pper
sec
onda
ry a
ge g
roup
var
ies
from
cou
ntry
to c
ount
ry; i
t may
beg
in a
t age
14,
15,
or
16, a
nd th
e du
ratio
n m
ay b
e 3,
4,
or 5
yea
rs.
2May
ove
rest
imat
e pe
rcen
tage
of
popu
latio
n in
age
ran
ge e
nrol
led,
sin
ce s
ome
stud
ents
may
be
olde
r or
you
nger
than
the
seco
ndar
y ag
e ra
nge.
3lnc
lude
s 17
- or
18-
year
-old
s. I
n th
e ca
se o
f G
erm
any,
man
y gr
adua
tes
are
olde
r th
an 1
8, th
e re
fere
nce
age.
4Uni
vers
ity o
r no
nuni
vers
ity 1
8- o
r 19
-yea
r-ol
ds.
5Upp
er s
econ
dary
theo
retic
al s
tart
ing
age
is 1
5; d
urat
ion
is 3
yea
rs.
6Upp
er s
econ
dary
theo
retic
al s
tart
ing
age
is 1
6; d
urat
ion
is 3
yea
rs. S
ome
stud
ents
are
out
side
the
norm
al e
nrol
lmen
t age
ran
ge: i
nclu
ding
, in
part
icul
ar, o
lder
stu
dent
sw
ho p
revi
ousl
y co
mpl
eted
a g
ener
al s
econ
dary
pro
gram
and
ret
urne
d to
enr
oll i
n a
voca
tiona
l pro
gram
. The
res
ult o
vere
stim
ates
the
size
of
the
uppe
r se
cond
ary
popu
latio
n re
lativ
e to
the
size
of
the
norm
al a
ge r
ange
for
upp
er s
econ
dary
enr
ollm
ent.
1Upp
er s
econ
dary
theo
retic
al s
tart
ing
age
is 1
4; d
urat
ion
is 5
yea
rs.
8Upp
er s
econ
dary
theo
retic
al s
tart
ing
age
is 1
4; d
urat
ion
is 4
yea
rs.
SOU
RC
E: O
rgan
izat
ion
for
Eco
nom
ic C
oope
ratio
n an
d D
evel
opm
ent,
Cen
ter
for
Edu
catio
nal R
esea
rch
and
Inno
vatio
n, E
duca
tion
at a
Gla
nce
(Par
is: O
EC
D, 1
992)
,75
, 77,
97.
93
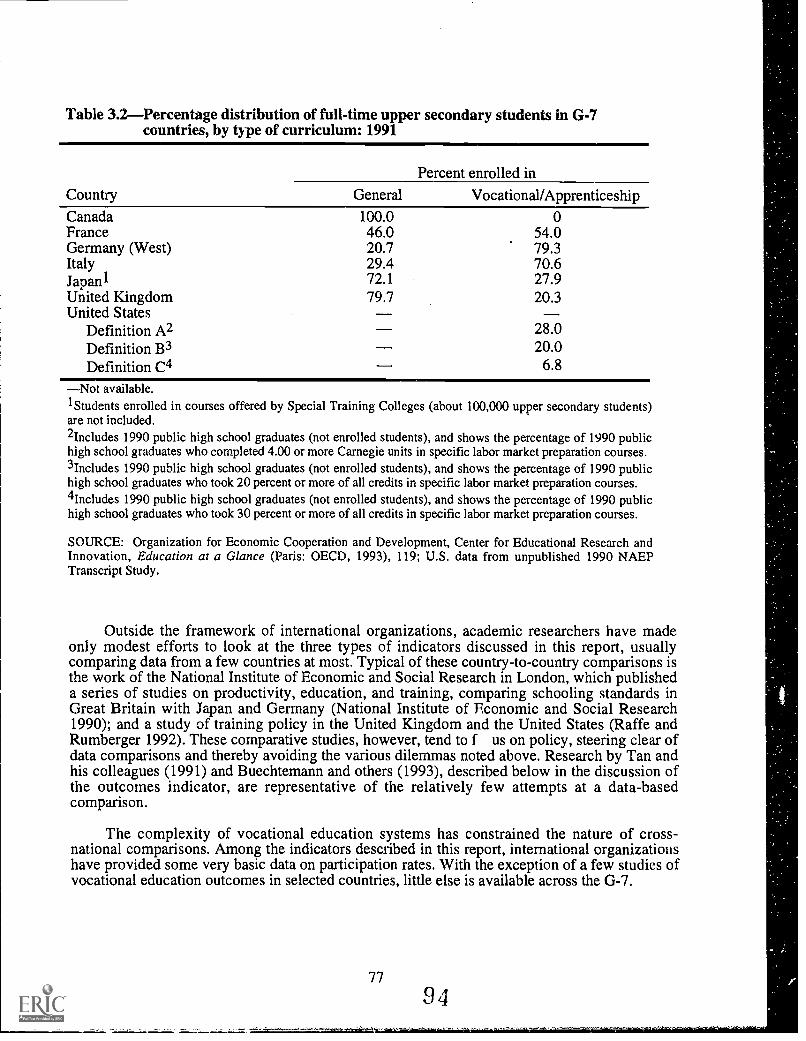
Table 3.2Percentage distribution of full-time upper secondary students in G-7countries, by type of curriculum: 1991
Country
Percent enrolled in
General Vocational/ApprenticeshipCanadaFranceGermany (West)ItalyJapan 1United KingdomUnited States
Definition A2Definition B3Definition C4
100.046.020.729.472.179.7
054.079.370.627.920.3
28.020.0
6.8
Not available.1Students enrolled in courses offered by Special Training Colleges (about 100,000 upper secondary students)are not included.2lncludes 1990 public high school graduates (not enrolled students), and shows the percentage of 1990 publichigh school graduates who completed 4.00 or more Carnegie units in specific labor market preparation courses.3lncludes 1990 public high school graduates (not enrolled students), and shows the percentage of 1990 publichigh school graduates who took 20 percent or more of all credits in specific labor market preparation courses.4Includes 1990 public high school graduates (not enrolled students), and shows the percentage of 1990 publichigh school graduates who took 30 percent or more of all credits in specific labor market preparation courses.
SOURCE: Organization for Economic Cooperation and Development, Center for Educational Research andInnovation, Education at a Glance (Paris: OECD, 1993), 119; U.S. data from unpublished 1990 NAEPTranscript Study.
Outside the framework of international organizations, academic researchers have madeonly modest efforts to look at the three types of indicators discussed in this report, usuallycomparing data from a few countries at most. Typical of these country-to-country comparisons isthe work of the National Institute of Economic and Social Research in London, which publisheda series of studies on productivity, education, and training, comparing schooling standards inGreat Britain with Japan and Germany (National Institute of Economic and Social Research1990); and a study of training policy in the United Kingdom and the United States (Raffe andRumberger 1992). These comparative studies, however, tend to f us on policy, steering clear ofdata comparisons and thereby avoiding the various dilemmas noted above. Research by Tan andhis colleagues (1991) and Buechtemann and others (1993), described below in the discussion ofthe outcomes indicator, are representative of the relatively few attempts at a data-basedcomparison.
The complexity of vocational education systems has constrained the nature of cross-national comparisons. Among the indicators described in this report, international organizationshave provided some very basic data on participation rates. With the exception of a few studies ofvocational education outcomes in selected countries, little else is available across the G-7.
Data Available on the Key Indicators
National and international sources provide somewhat different perspectives on each ofthese indicators. Data from government ministries, which are reported in chapter 2, are a startingpoint for cross-national comparisons; however, they are driven by national definitions ofvocational education and training, and they do not attempt to address problems of cross-nationalcomparability. In contrast, some international sources, which are cited here, attempt to reconciledifferences in definitions and provide a "common" analytical shell. As noted in the precedingchapters, however, vocational programs from country to country have more differences thansimilarities across the G-7, and "commonality" at the international level is difficult to achieve.Hence, this section will necessarily use both national government ministry data and data frominternational sources. Differences in the nature and quality of data on each indicator acrosssources will be noted.
Indicator 1: Data on Vocational Education Program Participation
Within the limits of national definitions, all G-7 counties produce data on vocational sectorparticipation at the upper secondary and postsecondary levels. The amount of informationavailable and its utility in cross-national anPlysis vary from country to country. In Germany, forinstance, where the Education Ministry plays a significant role in vocational training, data aboutprogram participation are readily available. In Italy, on the other hand, where the vocationalsystem is relatively decentralized, data on participation are modest, and little is collected by thenational government. Similarly, in Canada, which is highly decentralized at the provincial level,national aggregations are difficult to find. Taken on their own terms, however, national counts ofprogram participation are more likely to be available than other types of data on vocational
education.
Across the G-7 countries, vocational education and training occur largely at the uppersecondary or postsecondary level. Table 3.1 describes participation in and graduation from uppersecondary and postsecondary education. The table does not include data for the United Statesbecause students are not formally categorized as vocational students and there is no generallyaccepted definition of a vocational student. In interpreting this table, it is important to understandthat the duration of upper secondary education and the age range of students enrolled at this levelvary from country to country. Further, table 3.1 may overestimate enrollments by type ofcurriculum because some students actually enroll twicefirst undertaking coursework in ageneral curriculum, and second, after completing the general curriculum, in a vocationalprogram. For example, in Germany, enrollments seem to exceed 100 percent of the age grouptheoretically eligible to attend at this level, because so many students outside the theoreticallimits of the enrollment age have undertaken formal studies in more than one curriculum.
An important finding is worth noting: most countries fall into one of two groupsthosethat have large proportions of upper secondary-level students participating in vocationaleducation programs (France, Germany, and Italy), and those that do not (Canada, Japan, theUnited Kingdom, and the United States). This finding is useful because it says something aboutnational education policy at this level of schooling. In fact, it may seem somewhat surprising thatthese highly developed countries appear to have such different vocational education participationprofiles.
78 9 5

Beyond these general predispositions, the data become confounded. Data reported for theUnited States refer to public school graduates, whereas the data from other countries refer toenrolled students. In contrast to table 3.2 table 3.3 estimates the proportion of students in othercountries who completed upper secondary certificates in the general or vocational curriculum.Note that the general distributions are similar to those for enrollments; however, the table doesnot take into account persons outside the specified age groups who might complete programs at alater point.
Table 3.3Number of public and private upper secondary graduates per 100 personsaged 17 in educational systems in G-7 countries: 1991
CountryGraduates from
general programs
Graduates fromvocational and technical
educationCanada 72.5 0France 30.8 45.0Germany (West)1 24.2 93.1Italy2 18.2 32.6Japan' 66.4 24.7United Kingdom 58.5 15.9United States
Not available.'Data reflect the fact that many students take examinations in both curricula.218-year-olds.
SOURCE: Organization for Economic Cooperation and Development, Center for Educational Research andInnovation, Education at a Glance (Paris: OECD, 1993), 176.
Data for the United States were especially difficult to derive because education isdecentralized. Obtaining comparable data on the United States to produce national estimatesrequires using standardized national definitionsdefinitions that have proven difficult toimplement in the past. As noted above, unlike many other countries, upper secondary schools inthe United States do not formally categorize students as academic or vocational. For the purposesof this report, three definitions were developed for table 3.2. All of the definitions are based onthe proportions of students graduating from high school who took certain numbers of credits orcertain proportions of their coursework in specific labor market preparation in seven majorvocational fieldsagricultural and renewable resources, business, marketing, health,occupational home economics and services, trade and industry, and technical andcommunications. (See Gifford, Hoachlander, and Tuma 1989 for an extended discussion of theclassification scheme.) The amounts of coursework students take in such classes offer one way ofdefining "vocational ,:bncentrators."
The three definitions in table 3.2 are as follows:
Definition A: This is an estimate of the percentage of 1990 public high school graduateswho completed 4.00 or more Carnegie units in specific labor market preparation courses.On average, 1990 high school graduates completed a total of 23.5 Carnegie units duringtheir secondary school careers (U.S. Department of Education, Office of EducationalResearch and Improvement 1993, 90).
Definition B: This is an estimate of the percentage of 1990 public high school graduateswho took 20 percent or more of all credits in specific labor market preparation courses.
Definition C: This is an estimate of the percentage of 1990 public high school graduateswho took 30 percent or more of all credits in specific labor market preparation courses. Itis the most restrictive definition.
As table 3.2 shows, these definitions result in quite different erl:mates. However, under allthe definitions, it is apparent that secondary schools in the United States are oriented towardacademic preparation, whether students are college bound or not, and that relatively few studentsconcentrate in vocational education, compared with France, Germany, and Italy. This isconfirmed in table 3.3, which shows the percentages of upper secondary graduates in each G-7country completing general programs, compared with those earning vocational or technicaldiplomas.
Comparisons at the postsecondary level, as opposed to those at the upper secondary level,yield quite different conclusions. Table 3.4 provides a comparison of the fields of study of 18-year -olds entering postsecondary education. In this table, "nonuniversity" students refer to thosewho are studying curriculum that is technical or applied, rather than academic. The difficultyhere is that not all countries distinguish university and nonuniversity curricula in the same way.For example, nursing, teaching, and engineering are considered university studies in somecountries, but nonuniversity studies in others. Recognizing the problem associated with the waysin which fields of study are classified, these data must be interpreted with care. For example, theUnited States and Japan, which were both more likely to have upper secondary-level enrollmentsconcentrated in the general or academic curriculum than were other countries (see tables inchapter 2), have high proportions of 18-year-olds entering the postsecondary applied curriculum.This suggests that some countries might tend to defer vocational training to the postsecondarylevel, or give students an opportunity to undertake technical training at a later point in theirschool careers. However, in the United States this might occur because of the large population of18-year-olds participating in postsecondary education. The proportion of 18-year-oldpostsecondary students enrolled in "nonuniversities" in the United States seems typical for a G-7country.
0 '780
1
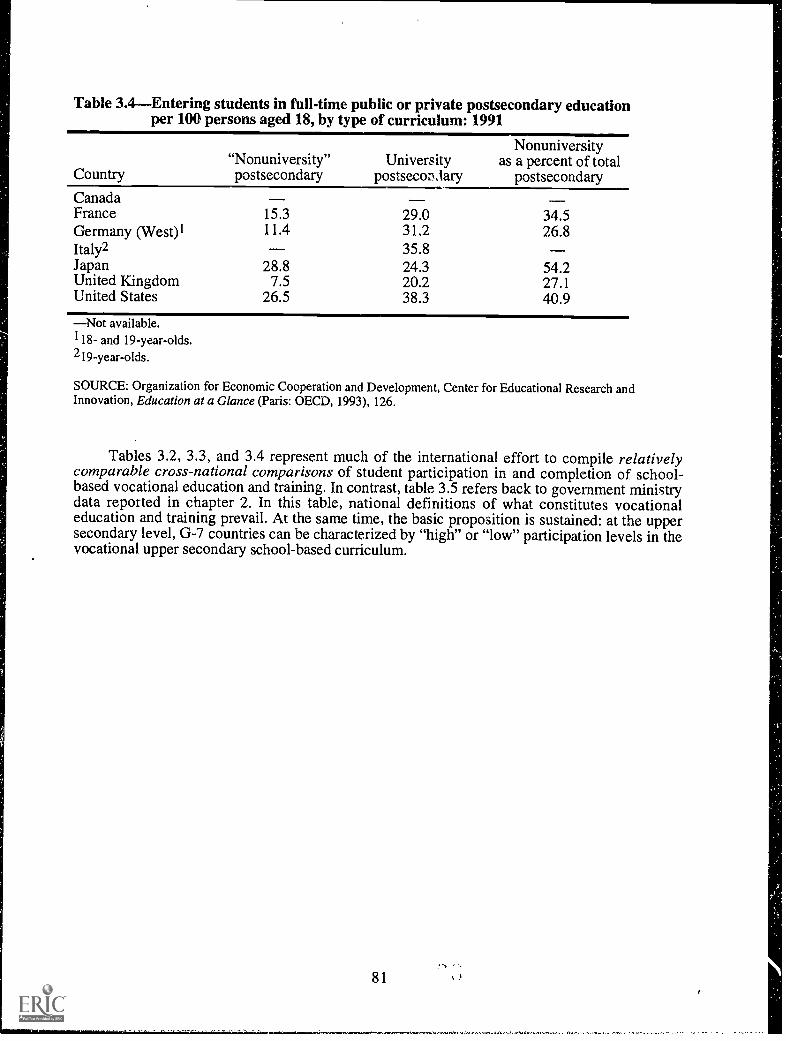
Table 3.4Entering students in full-time public or private postsecondary educationper 100 persons aged 18, by type of curriculum: 1991
Country"Nonuniversity"postsecondary
Universitypostsecondary
Nonuniversityas a percent of total
postsecondaryCanadaFrance 15.3 29.0 34.5Germany (West)1 11.4 31.2 26.8Italy2 35.8Japan 28.8 24.3 54.2United Kingdom 7.5 20.2 27.1United States 26.5 38.3 40.9
Not available.118- and 19-year-olds.219-year-olds.
SOURCE: Organization for Economic Cooperation and Development, Center for Educational Research andInnovation, Education at a Glance (Paris: OECD, 1993), 126.
Tables 3.2, 3.3, and 3.4 represent much of the international effort to compile relativelycomparable cross-national comparisons of student participation in and completion of school-based vocational education and training. In contrast, table 3.5 refers back to government ministrydata reported in chapter 2. In this table, national definitions of what constitutes vocationaleducation and training prevail. At the same time, the basic proposition is sustained: at the uppersecondary level, G-7 countries can be characterized by "high" or "low" participation levels in thevocational upper secondary school-based curriculum.
81
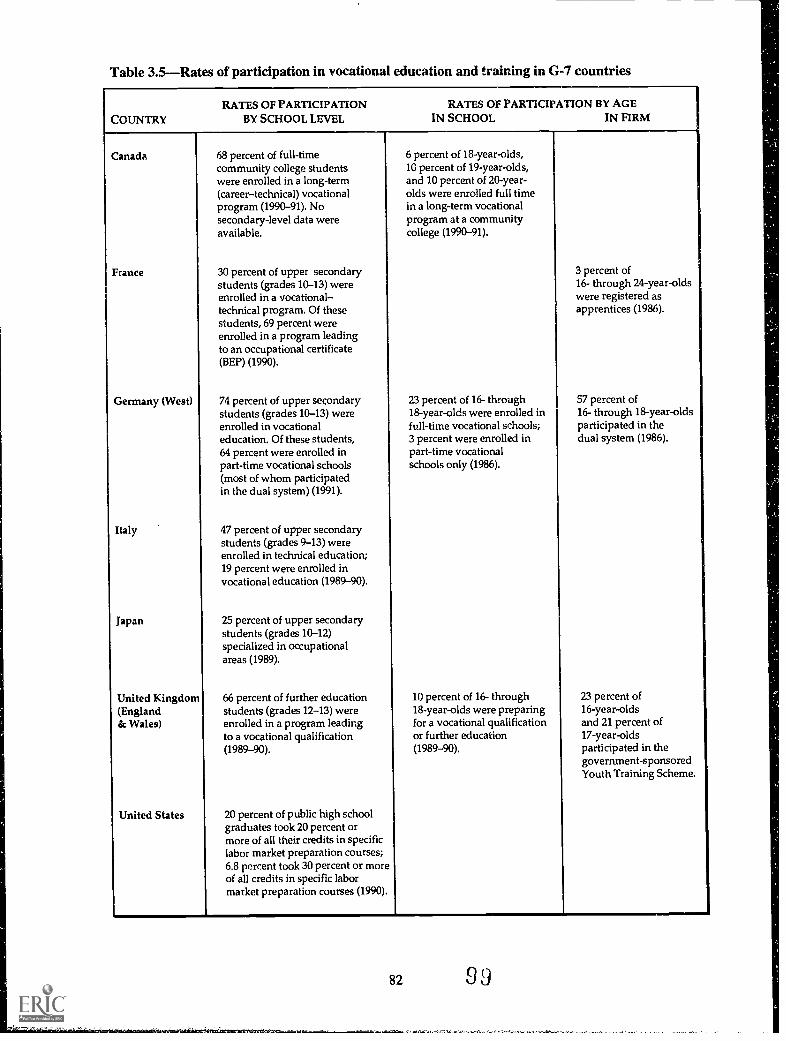
Table 33Rates of participation in vocational education and training in G-7 countries
COUNTRY
Canada
France
Germany (West)
Italy
japan
United Kingdom(England& Wales)
United States
RATES OF PARTICIPATIONBY SCHOOL LEVEL
68 percent of full-timecommunity college studentswere enrolled in a long-term(career-technical) vocationalprogram (1990-91). Nosecondary-level data wereavailable.
30 percent of upper secondarystudents (grades 10-13) wereenrolled in a vocational-technical program. Of thesestudents, 69 percent wereenrolled in a program leadingto an occupational certificate(BEP) (1990).
74 percent of upper secondarystudents (grades 10-13) wereenrolled in vocationaleducation. Of these students,64 percent were enrolled inpart-time vocational schools(most of whom participatedin the dual system) (1991).
47 percent of upper secondarystudents (grades 9-13) wereenrolled in technical education;19 percent were enrolled invocational education (1989-90).
25 percent of upper secondarystudents (grades 10-12)specialized in occupationalareas (1989).
66 percent of further educationstudents (grades 12-13) wereenrolled in a program leadingto a vocational qualification(1989-90).
20 percent of public high schoolgraduates took 20 percent ormore of all their credits in specificlabor market preparation courses;6.8 percent took 30 percent or moreof all credits in specific labormarket preparation courses (1990).
RATES OF PARTICIPATION BY AGEIN SCHOOL IN FIRM
6 percent of 18-year-olds,10 percent of 19-year-olds,and 10 percent of 20-year-olds were enrolled full timein a long-term vocationalprogram at a communitycollege (1990-91).
23 percent of 16- through18-year-olds were enrolled infull-time vocational schools;3 percent were enrolled inpart-time vocationalschools only (1986).
10 percent of 16- through18-year-olds were preparingfor a vocational qualificationor further education(1989-90).
3 percent of16- through 24-year-oldswere registered asapprentices (1986).
57 percent of16- through 18-year-oldsparticipated in thedual system (1986).
23 percent of16-year-oldsand 21 percent of17-year-oldsparticipated in thegovernment-sponsoredYouth Training Scheme.
82 9J
Indicator 2: Data on Vocational StudentSupply and Demand
Data on vocational enrollments by curricula and on demand for students by area ofspecialization are sparse. It would be reasonable to expect that education authorities make someeffort to attract students into occupational clusters that are in demand or that are highly valued interms of perceived future opportunities. To determine whether or to what degree this is the case,it would be necessary to track the supply of and demand for students completing programs ineach occupational cluster. Data in this area, as summarized in table 3.6, are fragmented andincomplete. Germany tracks the demand for young workers because apprenticeship opportunitiesand new training contracts are closely linked to current and emerging business needs. Forexample, German data on the supply of and demand for training places, the number of unplacedtraining applicants, and vacant training places are reported annually. In addition, data are alsoused to follow trends in enrollments by subject area over time. This provides some cluesregarding the types of jobs students think will lead to employment (to the extent that studentsenroll in vocational programs because they believe their labor force prospects will be enhanced).
Other countries, notably Japan, also track vocational (nonacademic) students at secondaryand postsecondary levels by type of curriculum specialization. Again, this provides an over-timeperspective on the kinds of occupations in which students believe there will be opportunities.These data, however, do not seem to be linked to any system monitoring the demand forgraduates across occupational clusters.
In the United States, data from both the National Education Longitudinal Study (NELS)and the National Assessment of Educational Progress (NAEP) provide an indication of coursetaking patterns among public high school graduates engaged in vocational education studies. Atthe postsecondary level, elements of the National Postsecondary Student Aid Study (NPSAS)provide cross-sectional information on participation in vocational curricula.
Generally, at the postsecondary but not the upper secondary level, most G-7 countriespublish data on degree and certificate recipients by type of curriculum. This, however, does notcapture the supplydemand perspective of the labor force that seems important to mostvocational education and training program strategies.
Even the available data are difficult to interpret. While course specialization clusters fromcountry to country may appear to be nominally related (for example, health occupations andagriculture), it is impossible to ascertain whether similar skills are taught, or similar employmentoutcomes are anticipated for students completing a particular curriculum cluster. In G-7countries, the vocational education student pipeline and labor force demand by curriculumcluster are difficult to determine.
83 1(10

Table 3.6Student vocational education concentration by type of program, andrelated occupational demand in G-7 countries
Canada No information available.
France No information available.
Germany (West) In 1991, 51 percent of apprentices were specializing in business, 32 percent in crafts,10 percent in medical or legal paraprofessions, 4 percent in government service,and 3 percent were classified as other. Top occupations for which apprentices werepreparing included retail sales, auto mechanics, and various clerical (FederalMinistry of Education and Science 1992a).
Italy
Japan
United Kingdom(England & Wales)
United States
Data were not available at the secondary or postsecondary level on the percentagesof students completing studies who found employment in their area of occupationalspecialization. No data were available on the demand for or placement rates ofcompleters by occupation.
No information available.
In 1990, among upper secondary students specializing in vocational subjects,11 percent were studying agricultural-related subjects, 33 percent industry-relatedsubjects, 40 percent business, 9 percent home economics, 2 percent nursing, and 5percent other subjects (Ministry of Education, Science and Culture 1990b).
Data were not available at the secondary or postsecondary level on the percentagesof students completing studies who found employment in their area of occupationalspecialization. No data were available on the demand for or placement rates ofcompleters by occupation.
No information available.
In 1990, among public high school graduates who completed three or more credits inone specific labor market preparation area, 32 percent took three or more credits inbusiness courses; 22 percent in precision production (drafting, etc.); 9 percent inoccupational home economics; 6 percent in marketing; 8 percent in mechanics;3 percent in communications technology; 3 percent in health; and 10 percent inagriculture (does not sum to 100 percent, and some graduates may have taken threeor more credits in more than one vocational subject area) (U.S. Department ofEducation 1992).
In 1990, among nonbaccalaureate f:tudents enrolled in vocational majors in 2-yearpublic institutions, 37 percent were studying business, 24 percent health-relatedfields, 11 percent engineering technologies, 10 percent trade and industry, 6 percentprotective services, 7 percent computers and data processing, and 5 percent other(U.S. Department of Education 1990).
Data were not available at the secondary or postsecondary level on the percentagesof students completing studies who found employment in their area of occupationalspecialization. No data were available on the demand for or placement rates ofcompleters by occupation.
84 1 0 1
Indicator 3: Labor Force Outcomes
Data on labor force outcomes among participants and compieters of vocational educationand training programs come exclusively from the national level; no data have been published byinternational agencies. As part of general household surveys, most G-7 countries collect somedata about educational attainment and schooling history, employment status and history, andearnings. In most instances, this is done periodically, as with the Current Population SurveyEducation Supplement and the Survey of Income and Program Participation in the United States.However, data specifically linking employment and earnings to participation in or completion ofvocational programs are not often available. Appendix A describes some of the major surveys inG-7 countries that include information about employment status, income, and education.Describing studies of labor force outcomes among participants in vocational education andtraining programs would require considerable country-by-country analysis. There are a fewcross-national studies of the outcomes of program participation and the returns to vocationalstudents. Tan (1991), for example, attempted to use data from surveys in Australia, the UnitedStates, and Great Britain to calculate and compare returns across countries. The complexity ofthese outcome phenomena, however, has discouraged country-to-country comparisons.
Table 3.7 summarizes several studies that focus on labor force outcomes among vocationalstudents. While different things are measured from study to study, there is clearly interest at thenational level in describing employment outcomes for students after they complete their studies.Generally, the studies reported in table 3.7 reflect real concern about the problems that studentsmay face in finding employment in the short run after completing their education, as well as thecapacity of the labor market to absorb new workers in the fields for which they are trained. Asdemonstrated in the table, not all countries are equally successful. In some countries for whichdata are available, vocational students find immediate placements after completing courseworkand achieve certification at higher rates than in other countries (although this says nothing aboutlong-term success in the labor market). It is important to understand, however, that these are notall general population studies, and that some of the data are focused on particular populations orcohorts, such as the data from the United States and the United Kingdom.
Without doubt, however, labor force outcomes are a matter of great concern across theG-7. While this has not resulted in a significant cross-national dialogue, many government-sponsored surveys are conducted according to strict data collection standards, which might beexamined. Further, there might also be grounds for enhancing some of these surveys withquestions and analyses that are of interest cross-nationally so that direct comparisons ofpopulations across countries could be made in the future.
85102
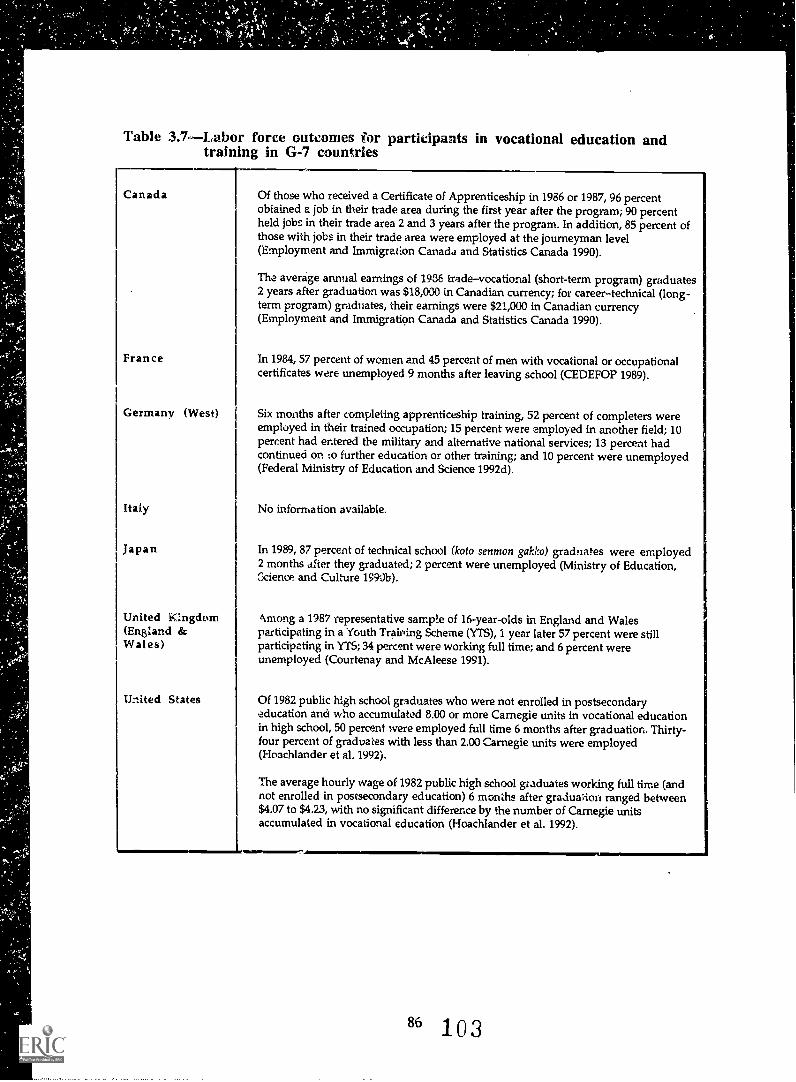
Table 3.Labor force outcomes for participants in vocational education andtraining in G-7 countries
Canada Of those who received a Certificate of Apprenticeship in 1986 or 1987, 96 percentobtained a job in their trade area during the first year after the program; 90 percentheld jobs in their trade area 2 and 3 years after the program. In addition, 85 percent ofthose with jobs in their trade area were employed at the journeyman level(Employment and Immigration Canada and Statistics Canada 1990).
The average annual earnings of 1936 tradevocational (short-term program) graduates2 years after graduation was $18,000 in Canadian currency; for careertechnical (long-term program) graduates, their earnings were $21,000 in Canadian currency(Employment and Immigration Canada and Statistics Canada 1990).
France In 1984, 57 percent of women and 45 percent of men with vocational or occupationalcertificates were unemployed 9 months after leaving school (CEDEFOP 1989).
Germany (West)
Italy
Japan
United iCngdom(England &Wales)
United States
Six months after completing apprenticeship training, 52 percent of completers wereemployed in their trained occupation; 15 percent were employed in another field; 10percent had entered the military and alternative national services; 13 percent hadcontinued on to further education or other training; and 10 percent were unemployed(Federal Ministry of Education and Science 1992d).
No information available.
In 1989, 87 percent of technical school (koto senmon gakko) graduates were employed2 months after they graduated; 2 percent were unemployed (Ministry of Education,Science and Culture 1990b).
Among a 1987 representative sample of 16-year-olds in England and Walesparticipating in a Youth Training Scheme (YTS), 1 year later 57 percent were stillparticipating in YTS; 34 percent were working full time; and 6 percent wereunemployed (Courtenay and McAleese 1991).
Of 1982 public high school graduates who were not enrolled in postsecondaryeducation and who accumulated 8.00 or more Carnegie units in vocational educationin high school, 50 percent were employed full time 6 months after graduation. Thirty-four percent of graduates with less than 2.00 Carnegie units were employed(Hoachlander et al. 1992).
The average hourly wage of 1982 public high school graduates working full time (andnot enrolled in postsecondary education) 6 months after graduation ranged between$4.07 to $4.23, with no significant difference by the number of Carnegie unitsaccumulated in vocational education (Hoachlander et al. 1992).
.1111111111.M1111.
86 103
Enhancing Data Collection and Improving the Quality and Availability of ComparableCross-National Data on Key Vocational Education and Training Indicators
There is a paucity of comparable cross-national data on vocational education !'nd trainingprograms in G-7 countries and little, if any, data on special populations, such as students withdisabilities and limited English proficiency. As American policymakers and school practitionerscontinue to evaluate ways of producing a skilled labor force prepared for the challenges of the21st century, there is a pressing need for more information about vocational education andtraining programs in other countries and a real interest in understanding how well other "models"of training and preparation have worked. One important aspect of such inquiry involvescomparisons of vocational education and training programs among our chief economiccompetitors. This concluding section discusses possible approaches to enhancing the level ofinformation on each of the three indicators described in this chapter.
Indicator 1: Vocational Education Program Participation
Data on vocational education participation rates are essential and amenable to analysis byinternational organizations. The INES project of OECD represents an example of a forum forenhancing data and data comparability of this type.
An improved indicator of vocational participation requires achieving agreement on whichprograms in each country are to be considered part of the vocational education system (amongEuropean nations, work in this area has been done by the European Centre for the Developmentof Vocational Training); distinguishing data on vocationaltechnical schooling from data onapprenticeships; and differentiating data on student enrollments from data on programcompleters in each program. To produce more detail on a participation indicator, sources ofinformation within each G-7 country could be used (see Appendix A), recognizing that thiswould leave some issues of comparability unresolved. For instance, general household surveys inCanada (General Social Survey), Germany (Microzensus), and the United Kingdom (GeneralHousehold Survey) are data sets that are somewhat similar to the Current Population Survey inthe United States. Each collect some information on the educational history of individuals 15years and older. Analysts could examine specific items pertaining to vocational educationparticipation and program completion and could encourage cooperative exchange of suchinformation among governments.
Indicator 2: Vocational Student Supply and Demand
Of the three types of indicators, supply and demand issues have received the least attentionin the international forum. Nonetheless, this type of indicator is significant bec'use it provides aparticularly helpful way of understanding how responsive the vocational education system is tolabor force needs and opportunities. To date, these kinds of data have not been collected in across-national setting, and little data could be found from national sources. For many reasons- -e.g., differences in how occupations are grouped from vocational education system to system,and differences in the level and type of work for which credentials in different countries preparestudentscross-national comparability would be very difficult to achieve.
Even so, a cooperative research effort among a few countries might define how such datacould be organized. This would provide a way of describing the vocational education "pipeline"from country to country, as well as the fit between student preparation and the needs of the laborforce.
87104
Indicator 3: Labor Market Outcomes
Given the differences in vocational systems across the G-7, there is no common metricagainst which to compare labor market outcomes of students completing programs. To achieve acomparable measure, it would be necessary to attempt some sort of "crosswalk" that woulddefine which programs are generally alike from country to country, both in terms of objectivesand the skills students are expected to have acquired upon program completion. On this basis, theemployment and wage outcomes (adjusted for parity) of program completers could be compared,to the extent that such data are collected at the national level. A small-scale project, through aninstitution such as OECD, would represent an appropriate venue for developing the indicator.Such an effort would be especially useful because it would provide a perspective on the degree towhich those completing particular kinds of vocational credentials are able to find a productiveplace in the labor force.
Conclusion
Because of the complexity of the vocational systems in G-7 countries, the development ofany indicator such as the ones described in this report would require 1) substantial developmentefforts by international organizations and, in some cases, a financial commitment on the part ofparticipating nations to. collect data; and 2) careful reflection about the utility of a givenindicator. While international organizations rely on national government ministries to providedata, they are well situated to synthesize and report data across countries with very differenteducation systems. Further, given the differences in the systems that have been described here,international organizations represent the best forum in which to capture comprehensive portraitsof the larger school-to-work transition environment and how it differs from country to country.
Each of the three indicators described in this report would require a significantdevelopment effort by an international organization. For instance, the indicator on student supplyand demand would require a substantial financial commitment on the part of participatingcountries to collect additional data. All G-7 countries have information that could inform theseindicators (see Appendix A). However, these sources have not necessarily been applied in across-national framework. As a result, to elaborate the indicators, cooperation at both nationaland international levels would be necessary. Data-related requirements for each indicator, aremost appropriately defined with international agreement, and data sets must be compared countryby country to determine commonalities and differences in terms of what is collected andavailable. To the extent that national sources could provide some or all of the necessary data in arelatively comparable fashion, the indicators could be elaborated, even though this might requirea substantial commitment. From the evidence compiled in this report, data on participation andmeasures of student outcomes could be derived from existing data collections in most G-7countries. In contrast, data on vocational education student supply and demand have receivedonly modest attention, and in only a few G-7 countries. A considerable data collectioncommitment at the national level in each country would be required to support the developmentof this indicator.
The utility of indicators on international vocational education needs to be carefullyscrutinized since, as this report has carefully detailed, the systems of vocational education differconsiderably across the G-7 countries. Of the three indicators described, the participationindicator is perhaps the most amenable to cross-national analysis, and a reasonable degree of datacomparability might be achieved. In addition, the participation indicator reflects the degree towhich vocational education is used as a training vehicle in G-7 countries.
88 105
Appendix A
Sources of Information on Vocational Education and Training:Panel and Cross-Sectional Studies in G-7 Countries
10689
4011111111111111161,Vaiii.a115-

CANADA
Cross-Sectional Surveys
General Social Survey. This household survey contains an education and work questionnaire.Respondents represent random samples of household members 15 years or older. In 1988,approximately 10,000 individuals were surveyed from the 10 provinces. Topics covered includeeducational attainment and future educational goals, employment experience and status, andknowledge of science and technology.
CONTACT: Statistics CanadaHousing, Family and Social Statistics DivisionRH Coats BuildingTunney's PastureOttawa K1A 0T6
Labor Force Survey. This survey, conducted since November 1945, collects data every monthon the labor force (the population 15 years or older). Statistics Canada surveys a representativesample of about 62,000 households and approximately 115,000 people (over the age of 15) inCanada (excluding the Yukon and Northwest Territories). Selected households remain as part ofthe sample for 6 months.
This survey provides monthly estimates of participation in the labor force, estimated for the weekcontaining the 15th of the month. Other data that are collected include information on educationalattainment (highest grade completed and highest degree or certificate received), and the occupationand industry attachment of all household members 15 years or older.
CONTACT: Statistics CanadaHousehold Surveys DivisionRH Coats BuildingTunney's PastureOttawa K1A OT6
National Graduates Survey. This study surveys graduates of trade/vocational programs,colleges, and universities 2 years after graduation. Statistics Canada conducted three rounds of thissurvey, most recently in 1988 (Class of 1986). Other years that were surveyed included 1984(Class of 1982) and 1978 (Class of 1976). Approximately 40,000 graduates who remained inCanada after graduation were interviewed by telephone.
Data concentrate on school-to-work transition and include information on graduates' earnings andincome, employment status (including the relationship of jobs to education), and attitudes towardtheir education.
CONTACT: Statistics CanadaEducation Culture and Tourism DivisionRH Coats BuildingTunney's PastureOttawa KIA 0T6
91 107
-_,4tiwigistimgafiailiatialWatt

National Apprenticeship Survey. In 1989, Statistics Canada conducted telephone interviewsof 9,100 participants in registered apprenticeship programs in Canada (except for the province ofQuebec) who either completed or left the program during 1986 or 1987.131
The purpose of the survey was to provide information similar to that collected on the NationalGraduates Survey, but for those registered in apprenticeship programs.
Among other things, respondents were asked about attitudes before beginning the apprenticeship;required hours of work in the apprenticeship program in-class training; certification; work in trade;employer questions; labor force experience since the apprenticeship; work outside the trade; andadditional training and courses.
CONTACT: Statistics CanadaEducation Culture and Tourism DivisionRH Coats BuildingTunney's PastureOttawa K1A 016
FRANCE
Cross-Sectional Surveys
Survey of School Leavers. In March of each year, the Institut National de la Statistique et desEtudes Economiques (INSEE) conducts a sample survey of school leavers (1 in 300). The surveyis intended to estimate who leaves school at each secondary and postsecondary level. The data areused to describe the situation of students who have left the educational system the precedingspring. The data also examine employment status, participation in apprenticeship programs andnational service, and types of qualifications attained by school leavers.
CONTACT: L'Institut National de la Statistique et des Etudes Economiques (INSEE)18 Blvd. Adolphe Pinard75014 Paris
Telephone: (33) 1 41 17 50 50Telefax: (33) 1 41 17 66 66
Survey of Secondary School Leavers and Their Progression into the Professions(L'Enquete Annuelle d'Insertion Professionalle des Sortants de l'Enseignement Secondaire).Conducted 6 months after the end of each school year, this survey examines access to the jobmarket among school leavers. Surveys are conducted by written questionnaire or by interview, andone schooling level is surveyed each year in a cycle (those leaving school with qualifications abovethe baccalaureate level, those leaving with qualifications at the baccalaureate level, and thoseleaving with qualifications, or without diplomas, below the baccalaureate level).
131Survey results do not reflect those apprentices still in the program &Ling the 2-year span.
92
108

CONTACT: Ce tre D'Etudes et de Recherches sur les Qualification (CEREQ)10, Place de la JolietteE.P. 17613474 Marseille
Telephone: (33) 1 91 13 28 28Telefax: (33) 1 91 13 28 80
GERMANY
Cross-Sectional Surveys
Microzensus. The German Statistics Bureau (Statistisches Bundesamt) conducts this annualcensus of the population and the labor force. Detailed data on employment are collected byoccupational title every 2 years; currently, there are approximately 25,000 recognized occupationaltitles. Data items include net income; school completion by level (i.e., secondary and higher); andtype of school (i.e., general or vocationalloccupational). Postunification data will not be availableuntil 1995.
CONTACT: German Statistics Bureau(Statistisches Bundesamt)Postfach 55 286200 Weisbaden 1
Telephone: (49) 06 11 71 1Telefax: (49) 06 11 72 40 00
Basic and Structural Data. This is an annual survey conducted by the Federal Ministry ofEducation and Science. It contains data on school participation by level and type of school.
CONTACT: Federal Ministry of Education and Science(Bundesminister fiir Bidung and Wissenschaft)Heinemannstal3e 25300 Bonn 2
Telephone: (49) 02 28 57 23 72
ITALY
No specific data sources have been identified. ISTAT, the federal government statistics bureau,collects data on school enrollments. The Ministry of Employment and the Ministry of Educationalso have some data on participation in regional vocational training, professional education, andapprenticeships.
CONTACT: ISTATVia Cesare Balbo, 161-00100 Rome
Telefax: (39) 6 854 7321
93 1 1) 9
JAPAN
Cross-Sectional Surveys
Basic School Survey. Public schools on all levels (i.e., national, prefectural, etc.) and privateand cooperative schools are required each year to provide basic school information to the Ministryof Science, Education and Culture. This Basic School Survey is conducted on May 1st of eachyear. Schools provide information as of May 1st on the previous year's enrollees and graduates,teachers and staff, facilities and finances. Information is generally provided on a classroom orschool level; no information is collected on individual students. At the school level, however, theinformation collected includes: 1) number of students by grade, gender, and type of program(academic, agricultural, industrial, business, etc.); 2) for upper secondary schools, the number ofstudents who were admitted to the school and the number who entered; and 3) for graduates, thestatus of the graduate as of May 1st of that year.
CONTACT: Ministry of Education, Science, and CultureResearch and Statistic Planning Division3-2-2 KasumigasekiChiyoda-kuTokyo 100
Telephone: (81) 3 3583 1547Telefax: (81) 3 3592 1065
Japanese nigh School and Beyond Survey. In 1980, the Japan Youth Research Instituteconducted a survey similar to the High School and Beyond (HS&B) study. Only a small sample ofschools (46) were involved, and only high school seniors participated. No cognitive tests wereadministered, as was the case in HS&B.
CONTACT: Ministry of Education, Science, and CultureAll Japan Youth Development Association2-4-5 IidabashiChiyoda-kuTokyo 102
Telephone: (81) 3 3263 7881Telefax: (81) 3 3238 1753
UNITED KINGDOM (England and Wales)
Cross-Sectional Surveys
General Household Survey (GHS). The OHS is an annual survey of noninstitutionalizedresidents of Great Britain. The survey has been conducted by the Office of Population Censusesand Surveys (OPCS) since 1971. Similar to the U.S. Current Population Survey, OPCSinterviews one household member (16 years or older) and gathers information about the entirehousehold.
The GHS is used by the government as a source of data on the status of households and for over-time comparisons. This survey, together with the Family Expenditure. Survey and the Labor
94 1
Meuales,-..ehto=stn.,M,m.1-
Force Survey, is an especially valued source of information between decennial populationcensuses.
The 1990 survey included interviews with 18,384 people aged 16 dud over, from 9,623households. The 1990 response rate was 83 percent. The main subject areas that the survey coversare population and fertility, housing, health, employment, and education. In addition, this surveyincludes questions relating to education level and qualification status, employment status, andparticipation in government training schemes (Youth Training, Employment Training, etc.).
The National Institute of Economic and Social Research (NIESR) in London used this data set,along with the Microzensus data set from Germany, to make cross-national comparisons of levelsof vocational training.
CONTACT: Office of Population Censuses and Surveys (OPCS)Social Survey DivisionSt. Catherine's House10 KingswayLondon WC2B 6JP
Telephone: (44) 071 396 2200Telefax: (44) 071 404 3020
Department of Employment Surveys. Several surveys conducted by the Department ofEmployment are concerned with specific employment programs.
Labour Force Survey. The purpose of this survey is to gather information onemployment and unemployment trends and patterns. It is conducted every 3 years on arepresentative sample of approximately 40,000 households. Respondents self-reportinformation on their employment status (including some questions on past training).
Youth Training Scheme Survey. This survey of all who enter the youth trainingprogram is conducted by the Training Agency of the Department of Employment (formerlythe Manpower Service Commission). Data are self-reported, and do not differentiatebetween short- and long-term program participants.
CONTACT: Department of EmploymentMoorfootSheffield S1 4PQ
Telephone: (44) 074 259 3932
Other Surveys
Destination of School Leavers. The Department of Education and Science annually surveysall Local Education Agencies (LEAs) on their school-leaving population. Survey items aredesigned to identify postcompulsory schooling plans of students.
CONTACT: Department of Education and ScienceSanctuary BuildingsGreat Smith StreetWestministerLondon SW1 3BT
11195
Oxford Mobility Survey. This one-time 1972 survey involved interviews with a representative
sample of men aged 20-64 living in England and Wales. Respondents were questioned about a
wide range of subjects, including their families, educational experiences, and job status.
Panel Surveys
Longitudinal Study (LS). The LS links event records (e.g., birth, cancer, immigration, and
death records) with decennial census records (1971, 1981, and 1991) for 1 percent of thepopulation of England and Wales (approximately 500,000 people). LS drew its initial sample from
all people born on each of four dates each year, as recorded in the 1971 General Census. Records
for these people and members of their household became the initial LS database. Since then,individuals have been added, including immigrants with those four birth dates and infants who
were born on those dates in subsequent years. The LS was established for the purpose ofcollecting social statistics and, in particular, data on mortality.
CONTACT: Office of Population Censuses and Surveys (OPCS), Health StatisticsSt. Catherine's House10 KingswayLondon WC2B 6JP
Telephone: (44) 071 242 0262Telefax: (44) 071 404 1186
National Survey of Health and Development (NSHD). The NSHD followed 5,362
children born in the first week of March 1946, until the age of 21. This cohort took a battery ofschool achievement tests at ages 8, 11, and 15. In addition, the survey included information on
family background (family size, father's occupation, and educational level) and educational
attainment (years of formal schooling).
CONTACT: For more information, seeJ.W.B. Douglas, J.M. Ross, and H.R. SimpsonAll Our Future: A Longitudinal Study ofSecondary EducationLondon: Peter Davies, 1968
National Child Development Study. The National Children's Bureau of London conductedthe Perinatal Mortality Survey of "virtually all" babies born in England, Scotland, and Walesduring the first week in March of 1958. The National Child Development Study is made up offollow-up surveys of this cohort. Since 1958, there have been five follow-up surveys: conducted
in 1965, 1969, 1974, 1981, and 1991.132 The first three follow-up surveys involved interviews
with a child's parent or guardian and the head teacher at the child's school. It also included amedical examination and various other test batteries. In addition, the third follow-up containedinformation gathered from the students on their aspirations and expectations. In the fourth follow-
up, a detailed interview was conducted with cohort members that included questions regarding
their involvement with postsecondary education and the labor force.
CONTACT: National Children's Bureau of London8 Wakley StreetLondon EC1V 7QE
Telephone: (44) 071 278-9441
132Data has not been released yet on the fifth follow-up.
96 112
Cohort Study of TVEI Extension Students. This is a 4-year longitudinal survey (1990-94)of two cohorts of young people which starts at ages 14 and 15 and follows the teenagers until theyare age 17. Conducted by the National Foundation for Educational Research in England andWales, data are included on the following: students' characteristics and background; students'school experience (e.g., curriculum, accreditation, industryeducation links, and career guidance);students' postschool destinations, education, training, and experience; students' acquisition ofskills and knowledge in TVEI-related areas and their qualifications; equal opportunity issues; andstudents' attitudes toward TVEI-related experiences.
CONTACT: National Foundation for Educational Research in England and WalesThe Mere, Upton ParkSlough, Berkshire SL1 2DQ
Telephone: (44) 075 357 4123Telefax: (44) 075 369 1632
Youth Cohort Study. This longitudinal study of 16- to 19-year-olds is co-sponsored by theEmployment Department and the Department for Education. The study tracks a representativesample of approximately 20,000 16-year-olds in England and Wales for three years, collectinginformation on school experience, job and training experience (including wage information), andparental employment and education level. These young people are surveyed once a year on theiractivities in the preceding 12 months. The first cohort of 16-year-olds was surveyed in 1985. Sincethen five other cohorts were surveyed (in 1986, 1987, 1989, 1991, and 1992).The purpose of thisstudy is to provide information on the school-to-work transition of young people, after theycomplete compulsory schooling at age 16.
CONTACT: Employment DepartmentStatistical Services DivisionMoorfootSheffield Si 4PQ
Telephone: (44) 074 259Telefax: (44) 074 259 4371
UNITED STATES
Cross-Sectional Surveys
Education Supplement to the Current Population Survey. The Current PopulationSurvey (CPS) is conducted by the Bureau of the Census on a regular basis. The monthly CPSprimarily collects labor force data for the civilian non-institutionalized population. In addition to thebasic CPS questions which are asked every month, in October of eac:t year supplementaryquestions about school enrollment are asked of all eligible household members 3 years old andover. Questions asked every October include enrollment status in regular school (nursery,kindergarten, elementary, high school, college, university, or professional school), grade level,enrollment in school during the previous year, participation in vocational education, and highschool graduation status of the individuals living in the sampled households.
971 1 3
The present CPS sample covers all 50 states and the District of Columbia. About 56,100 occupiedhousing units are eligible for interview every month. Since 1981, sample sizes have ranged fromabout 53,000 to 59,000 households.
CONTACT: U.S. Bureau of the CensusPopulation DivisionEducation and Social Stratification BranchWashington, DC 20277
Longitudinal Surveys
Survey of Income and Program Participation. The Survey of Income and ProgramParticipation (SIPP) expands the kind and amount of information available to analyze the economiccondition of households and individuals. The SIPP panel sample consists of 55-60,000 personsselected to represent the non-institutionalized population of persons at least 15 years of age.Participants are interviewed once every four months for a 27 month period (8 interview waves).During each interview wave information is collected regarding labor force activity and incomereceived during each four month period. During one of the interview waves, participants are askedabout their education arid work training history. For those who have received vocational training atthe postsecondary level, data enable study of labor market success as it relates to education andarea of training.
CONTACT: U.S. Bureau of the CensusPopulation DivisionWashington, DC 20277
The U.S. National Center for Education Statistics (NCES) conducts a number of longitudinalsurveys pertinent to issues of data collection on vocational education described in this report. Formore information on the National Longitudinal Survey, High School and Beyond, the NationalEducation Longitudinal Study, the High School Transcript Studies, and the Schools and StaffingSurvey described below:
CONTACT: U.S. National Center for Education Statistics555 New Jersey Av. NWWashington, DC 20208
National Longitudinal Survey of 1972. The National Longitudinal Survey of 1972 (NLS-72) was the first longitudinal study conducted by NCES. The sample for the base year, NLS-72,included students from public and private schools in the 50 states and the District of Columbia whowere enrolled in grade 12 during the 1971-72 school year. NLS-72 oversampled schools in low-income areas and schools with significant minority populations. The NLS-72 series of surveysinvolved 22,000 high school seniors. Data collected from student surveys include informationabout their personal and family background, education, and work experience. Students' highschool curriculum track (academic, vocational, or general) and standardized test scores werecollected from school records. NLS-72 students completed a battery of achievementability tests invocabulary, reading, and mathematics and tests of reasoning and memory. Follow-up surveyswere conducted in 1973, 1974, 1976, 1979, and 1986 and contain information aboutpostsecondary education, work experiences, and family formation.
98
High School and Beyond Student Surveys. High School and Beyond (HS&B) is alongitudinal study of two cohorts: 1980 high school seniors and 1980 high school sophomores.The database contains information collected in a series of student questionnaires, scores from abattery of achievement tests, and information about the high schools attended by the students. Highschool transcripts were collected for the 1980 high school sophomore cohort, and postsecondaryschool transcripts were collected for both cohorts.
The HS&B 1980 senior cohort contains a nationally representative sample of 28,000 high schoolseniors in 1980 from 1,015 public and private high schools across the county. The sophomorecohort includes more than 30,000 sophomores enrolled in the same schools in 1980.
The study design provided for a nationally representative sample, oversampling schools with high-minority populations, alternative public schools, and private schools with high-achieving students.Surveys conducted in 1980 recorded information about the students' demographic characteristics,family backgrounds, and educational experience. Followups were conducted in 1982, 1984, and1986, and 1992. These follow-up surveys contain information on postsecondary education, workexperience, and family formation.
Some school information--including length of school year, availability of educational programs(such as remedial and gifted education), availability of student programs (academic, general, andspecific vocational programs such as business education), courses offered, and use of minimumcompetency testinghas been collected for the HS&B sample of schools.
1982 High School Transcript Study. The 1982 High School Transcript Study containscomplete transcripts for approximately 12,000 members of the 1980 HS&B sophomore cohort.Transcript information for the cohort was collected in 1982 from the 9th- through 12th-graderecords (the school years 1978-79 through 1981-82). Because the transcript information is morecomplete and accurate than the student-reported information about courses and grades, transcriptdata are particularly useful for analyzing student course taking and grades.
For each course taken by a student in grades 9 through 12, the data files contain a course code, theschool year and term that the course was taken, the credits attempted and earned, and the finalgrade. The course codes describe both the subject and level of the courses. Classification codeslike those in other NCES secondary transcript studies are used so that courses taken by studentsfrom different transcript studies can be compared. Courses that are part of the special educationcurricula are identified. In addition, each student record contains information on the student's rankin class, overall grade-point average, number of days absent in each school year, number ofsuspensions, the date and reason the student left school, and scores for standardized tests.
For the HS&B sophomore cohort transcripts include information about all high school courses andgrades for students, and student-reported information about courses and grades in selected subjectareas; verbal and quantitative achievement, science, writing, and civics scores; and studentcharacteristics such as sex, raceethnicity, socioeconomic background, anc ..ugh school curriculumtrack.
1987 and 1990 High School Transcript Studies. Three high school transcript studies havebeen conducted since 1980. The first was part of the High School and Beyond (HS&B) firstfollowup survey in 1982. About 12,000 transcripts were collected from school records for HS&Bsophomore cohort students who were seniors in 1982. A second study, the 1987 High SchoolTranscript Study, surveyed approximately 22,700 seniors who had participated (as 11th graders)in the 1986 National Assessment of Educational Progress (NAEP).
99 1 1 5
The 1990 High School Transcript Study consisted of systematically transcribing about 23,000transcript records to determine the course-taking patterns of 12th-grade high school studentsselected from the 1990 NAEP assessment sample. With this connection, test results can be linkedto course-taking patterns. All transcript information was collected by field personnel; no personalcontacts were made with students. The coded data were compatible with the data produced in the1982 HS&B Transcript Study and the 1987 High School Transcript Study. To ensure maximumcompatibility, the procedures and formats used in previous studies for editing, coding, errorresolution, and documentation were also used for the 1990 transcript data. This consistencyenables users to compare cohorts.
Among the data on student characteristics available from the 1990 transcript study are: dates whenattended and left school; graduate or not when left school; high school programs in which enrolled;completion status of curricular programs (particularly vocational programs); days absent; honorsawarded; disciplinary actions recorded; grade point average; standardized test scores; and studentrank in relation to class size. Data on course-level characteristics include: subject matter of thecourse; period of time the course was taken; grade earned; credits earned; whether the course wastaken at an Area Vocational Technical Center; and whether the course was desgned for honors,exceptional, or special education students.
National Education Longitudinal Study of 1988. The National Education LongitudinalStudy of 1988 (NELS:88) is a new database that follows students from the time they are enrolledin the eighth grade. The NELS:88 sample, drawn from the cohort of students enrolled in 8th gradein 1988, is representative at the national level. Participants were randomly selected from each of the1,000 public and private schools sampled for the study. Some 25,000 8th graders and theirparents, teachers, and school principals were surveyed in 1988. Hispanic and Asian-Americanstudents were oversampled to create a sufficiently large sample for analysis of language-minoritystudents.
The first followup surveyed the same students in 1990, when most were in 10th grade; the secondfollowup in 1992, when most were in their senior year of high school. The database containsstudent background information including raceethnicity, sex, and socioeconomic status indicatorsand identifies handicapped students. Information on school policies and practices, testing andminimum course requirements, activities, and school climate are among the data available from aschool administrator questionnaire.
Four cognitive tests were administered in 1988, 1990, and 1992. In 1990 and 1992, both studentsand school dropouts from the 8th-grade sample took cognitive tests in reading, science, socialscience (history and government), and mathematics. The tests were designed to reflect 8th- through12th-grade coursework and have enough overlapping items with the 8th- and 12th-grade tests topermit measurement of academic growth.
High school transcripts for this sample of students have also been collected. These transcriptsinclude courses taken, credits earned, and grades achieved in all high school classes. Informationavailable includes: courses taken and grades achieved while in high school; achievement test scoresin reading, science, social science, and mathematics (administered in 8th, 10th, and 12th grades);student characteristics including sex, raceethnicity, and socioeconomic background; schoolpolicies, including testing and minimum course requirements for graduation (which can be linkedto courses taken, grades, achievement test scores, and dropout rates); test scores from 8th to 12thgrade for students with different course-taking patterns; and dropout rates for students withdifferent course-taking patterns, grade-point averages, and achievement test scores, as well as datafor students attending schools with different graduation requirements.
Schools and Staffing Survey. The Schools and Staffing Survey (SASS) is a comprehensivepublic and private school education database that combines and expands on three data setspreviously collected by NCES: a survey of teacher demand and shortages, surveys of public andprivate schools, and a survey of public and private school teachers. In 1987-88, SASS containedasample of approximately 65,000 teachers, 12,800 schools, and 5,600 school districts. The datafrom SASS support national estimates of various characteristics of public and private schools andstate estimates for public schools. Data have been collected for 1987-88, 1990-91, and 1992-93.It will be administered at 2-year intervals in the future.
SASS contains four questionnaires. The Teacher Demand and Shortage Questionnaire surveysschools about demand for teachers and factors affecting the supply of teachers. It also asks aboutthe number of credits students in the graduating classes must complete in order to graduate fromschool. The School Questionnaire surveys programs, policies, and conditions; studentcharacteristics; and staffing patterns. The School Administrator Questionnaire surveys principalsand school heads about their backgrounds and their perceptions of school climate. The TeacherQuestionnaire provides information about the demographics and qualifications of teachers, theirworking conditions, career history, and career plans.
SASS files contain information that is useful for developing descriptions of school policies. Thesedata can be used to track changes over time in school policies and graduation requirements,beginning with the 1987-88 school year, for the entire nation or for the public sector in individualstates. Although SASS does not contain information about individual students attending theseschools, it includes some appropriate data about students and data describing available curriculumand student programs.
National Assessment of Vocational Education. The Department of Education, Office ofResearch in the Office of Educational Research and Improvement' recently conducted the NationalAssessment of Vocational Education (NAVE) programs mandated by Section 403 of the 1990Perkins Act. This assessment evaluated the current status of vocational and occupational education,and addressed four major subject areas: the implementation and, where possible, effects of the1990 Perkins Act, including the allocation of funds; participation of special populations invocational education; the quality of vocational education programs; and vocational education andemployment.
Implementation: The 1990 Perkins Act is intended to promote major reforms in vocationaleducation. Because of the limited time period covered by the assessment, it could notdetermine definitively whether these reforms have been successful. However, it didexamine the processes of implementing provisions of the 1990 Perkins Act, gauge theprogress of states and localities in achieving the goals of the legislation, and identify theeffects of the ,Act insofar as they were observable by the spring of 1993. Examples ofquestions that address implementation of the 1990 Perkins Act included: 1) what stepswere being taken to develop and implement performance standards; 2) what services wereprovided to special populations; and 3) what were states and localities doing to implementprovisions of the Act.
loll 1 7
Participation of special populations: Participation of special populations in vocationaleducation has been a continuing emphasis of federal policy, but the 1990 Perkins Actchanged the approach by eliminating set-asides for some groups, such as students withdisabilities and limited English proficiency. Examples of how the assessment studied theparticipation of special populations included comparing participation rates of special andgeneral populations at both the secondary and postsecondary levels, and using longitudinaldata to determine the employment outcomes of special education students who participatedin vocational education.
Program quality: The assessment addressed the quality of vocational education. Questionsincluded: how well qualified were teachers of vocational education; what was the qualityof course materials used; and what were the academic outcomes of vocational education.
Employment outcomes: Employment is an important outcome of participation in vocationaleducation. The assessment examined the school-to-work transition, employment outcomesof vocational students, the relevance of vocational training to subsequent occupations, andemployer involvement in and satisfaction with vocational education.
A variety of methods were utilized in the study. The assessment conducted surveys and casestudies, analyzed data from NCES, reviewed existing literature, and used studies conducted byresearch centers funded by the Department of Education.
Surveys: Surveys were conducted of secondary and postsecondary schools, schooldistricts, state directors of vocational education, teachers, education directors of juvenilecorrectional facilities, advisors to vocational student organizations, and employers. Thesurveys provided nationally representative data.
Case studies: Community-based case studies on curricula were conducted at 20 sitesacross the country. Another set of case studies was conducted on tribal schools thaireceived Perkins funds. A third set of case studies examined changes in schools thatreceived much higher and much lower Perkins allocations in the 1991-92 school year thanin the previous year.
Analyses of NCES data: The Office of Research examined student participation, academicoutcomes, and teacher qualifications using NCES data sets, such as the NationalAssessment of Educational Progress, the National Postsecondary Student Aid Study, andthe Schools and Staffing Survey.
Literature reviews: A series of literature reviews was conducted to address broad issues invocational education, such as teacher training, contextual learning, and the changing needof the workforce.
Studies by research centers funded by the Department of Education: The National Centerfor Research in Vocational Education studied reforms from the 1990 Perkins Act such asthe integration of academic and vocational education, performance standards andmeasures, and school-to-work transition; the Center on the Educational Quality of theWorkforce examined the employment outcomes of vocational education by linking stateunemployment insurance data with school records; and the Finance Center of the Centerfor Policy Research in Education studied the interstate funding formula for distributingPerkins funds to states.
CONTACT: National Assessment of Vocational Education (NAVE)Office of Educational Research and ImprovementOffice of ResearchU.S. Department of Education555 New Jersey Av. NWWashington, DC 20201
102 1 1 8

EUROPEAN COMMUNITY
Cross-Sectional Survey
Young Europeans in 1990. This opinion survey was conducted by the European CommunityTask Force on Human Resources, Education, Training, and Youth. The 1990 survey was the thirdin a series. The first study, conducted in 1982, surveyed a representative sample of 3,900 15-through 24-year-olds in the 10 European countries that made up the European Community; thesecond survey, conducted in 1987, surveyed a representative sample of 7,000 15- through 24-year -olds residing in the 12 European countries that make up the European Community. The 1990survey questioned approximately 7,600 15- through 24-year-olds, representative of the 12European Community countries.
These surveys contain similar data elements on respondent attitudes and opinions concerning awide range of issues, including respondents' education, professional training, and participationand experiences in the labor force.
CONTACT: Commission of the European CommunitiesTask Force for Human Resources, Education, Training, and YouthEuropean Community Information Center2100 M Street, NW #707Washington, DC 20037
119103

Appendix B
Vocational Education Data Information SourcesContact List
120105

INTERNATIONAL ORGANIZATIONS
European Institute of Education and Social PolicyUniversity of Paris IX - DauphinePlace du Marechal de Lattre de Tassigny75116 Paris
Organization for Economic Cooperation and Development (OECD)Center for Educational Research and Innovation2 Rue Andre Pascal75775 Paris
Telephone: (33) 1 45 24 82 00
Delegation of European Communities2100 M Street NW 7th FloorWashington, DC 20037
Telephone: (202) 862 9500Telefax: (202) 429 1766
European Centre for the Development of Vocational Training (CEDEFOP)Bundesallee 22Jean Monnet House1000 Berlin 15
Telephone: (49) 30 884 120Telefax: (49) 30 884 12222
European Information Network in the European CommunitiesRue d'Arlon 1513-1040 Brussels
Telephone: (32) 2 238 30 11Telefax: (32) 2 230 65 62
Statistical Office of European Communities (EUROSTAT)Batiment Jean MonnetL-2920 Luxembourg
Telephone: (35) 2 43 01 1Telefax: (35) 2 43 01 44 15
121107
iddrarigeG
International Association for the Evaluation of Educational Achievement (IBA)14 Sweelinckplein2517 GK The HagueThe Netherlands
Telephone: (31) 70 346 9679Telefax: (31) 70 360 9951
CANADA
British Columbia Ministry of EducationCommunications Branch620 Superior Street3rd Floor Room 325Victoria BC V8V 2M4
Telephone: (604) 387 4611Telefax: (604) 356 5945
Canadian Education association252 Bloor Street West, Suite 8-200
'Toronto Ontario M5S 1V5
Telephone: (416) 924 7721Telefax: (416) 924 3188
Council of Ministries of Education252 Bloor Street West, Suite 5-200Toronto M5S 1V5
Telephone: (416) 964 2551Telefax: (416) 964 2296
Employment and Immigration CanadaP.O. Box 9721Ottawa Ontario K1G 4X8
Telephone: (613) 992 1300Telefax: (613) 991 5050
Ministere de l'EducationDirection des Etudes Economique et Demographiqu.1035 de la Chevrotiere 8th FloorQuebec G1R 5A5
Telephone: (418) 643 3684Telefax: (418) 646 5503
1081 2 r)
Ontario Ministry of Education and TrainingMowat Block900 Bau StreetToronto M7A 1L2
Telephone: (416) 325 1945Telefax: (416) 325 1971
Statistics CanadaOttawa K1A OT6
Telephone: (613) 951 1500Telefax: (613) 951 9040
FRANCE
Centre d'Etudes et de Recherches sur les Qualifications (CEREQ)10 Place de la JolietteB.P. 176
13474 Marseille
Telephone: (33) 1 91 13 28 28Telefax: (33) 1 91 13 28 80
International Center for Pedagogical Studies (CIEP)Division de L'Etudes sur les Systemes d'Education1 Rue Leon JournaultF-92311 Sevres CEDEX
Telephone: (33) 1 45 07 60 82Telefax: (33) 1 45 07 60 01
L'Institut National de la Statistique et des Etudes Economiques (INSEE)18 Blvd. Adolphe Pinard75014 Paris
Telephone: (33) 1 41 17 50 50Telefax: (33) 1 41 17 66 66
GERMANY
Bundesinstitut far BerufsbildungFederal Institute for Vocational EducationFehrbelliner Platz 3W-1000 Berlin 31
Telephone: (49) 30 8643 0Telefax: (49) 30 8683 455
(49) 30 8621 375
1091 2 3

Deutsches Jugendinstitute e.V. (DJI)FreibadstraBe 30D-8000 Munchen 90
Telefax: (49) 89 62306162
Carl Duisberg Society InternationalCDS International309 W. Washington Suite 201Indianapolis, Indiana 46204
Telephone: (317) 581 8807Telefax: (317) 637 2441
German Information Center950 3rd AvenueNew York NY 10022
Telephone: (212) 888 9840Telefax: (212) 752 6691
The German Marshall Fund of the United States11 Dupont Circle NWSuite 750Washington, DC 20036
Telephone: (202) 745 3950Telefax: (202) 265 1662
Institut fUr Arbeitsmarkt and Berufsforschung (IAB)Federal Institute of Vocational TrainingRegensburger Str. 1048500 Nurnberg 30
Telephone: (49) 0911 179 0Telefax: (49) 0911 179 3258
German Youth InstituteFreibadstr. 308000 Munchen 90
Telefax: (49) 89 623 06162
110

Sample InstitutForchung fiirden Produktionsfaktor InformationINRA Papenkamp 2-62410 Mo lln
Telephone: (49) 4542 801 342Telefax: (49) 4542 801 301
ITALY
Centro per l'Innovazione e la Sperimentazione Educativa Milano (CISEM)20129 Milano-corsoConcordia 7
Telephone: (39) 02 774 0290Telefax: (39) 02 774 02941
Centre Studi Investimenti Sociali (CENSIS)Italian Social Investment Study CenterPiazza di Novella, 200199 Rome
Telephone: (39) 6 8861 641Telefax: (39) 6 8621 1367
Istituto Nazionale di Statistica (ISTAT)Via le LiegiN13 Rome
Telephone: (39) 6 88 41341
Istituto per lo Sviluppo della Formazione Professionale dei Lavoratori (ISFOL)Via B, Eustachio, 800100 Rome
Telefax: (39) 6 8547321
Pragma SriMarket Research CompanyVia Salaria, 298/A00199 Rome
Telephone: (39) 6 84 13557Telefax: (39) 6 85 40038

JAPAN
Employment Promotion Corporation2-1 Kojimaehi KyodakuTokyo 102
Telephone: (81) 3 222 8000Telefax: (81) 3 578 1108
Japan Institute of LaborChutai Kin Building1-7-6 Shibakoen MinatokuTokyo 105
Telephone: (81) 3 436 3491Telefax: (81) 3 578 1108
US - Japan Culture Center2600 Virginia Avenue NWSuite 711Washington DC 20037
Telephone: (202) 342 5800Telefax: (202) 342 5803
National Institute for Education Research5-22 Suimomeguro6-ChomeMeguro-kuTokyo
Telephone: (81) 3 714 0111
Ministry of Education, Science and CultureResearch and Statistic Planning DivisionKasumigaseki Chiyoda-kuMonbusho3-2-2 KasumigasekiChiyoda-kuTokyo 100
Telephone: (81) 3 3581 1547Telefax: (81) 3 3592 1065
UNITED KINGDOM (England and Wales)
Center for Japanese and Comparative Industrial ResearchImperial College of Science, Technology and MedicineSouth KensingtonLondon SW7 2AZ
Telephone: (44) 071 589 5111
112
4.1111:45arg.Williti;47:07:6,,,, '.1/
2
Department for Education and ScienceAnalytical Services BranchMowden Hall Staindrop RoadDarlington Co.Durham DC3 9B6
Telephone: (44) 032 539 2753Telefax: (44) 032 539 2695
Institute for Employment ResearchUniversity of WarwickDepartment of EducationWestwood Coventry CV47AL
Telephone: (44) 020 352 4416Telefax: (44) 020 352 4110
National Commission on EducationPaul Hamlyn FoundationSuite 24, 10-18 Manor GardensLondon N7 6JY
Telephone: (44) 071 272 4411Telefax: (44) 071 281 6778
National Council on Vocational Qualifications222 Euston RoadLondon NW1 2B2
Telephone: (44) 071 387 9898Telefax: (44) 071 387 0978
National Foundation for Educational Research in England and Wales (NFER)The MereUpton ParkSlough Berkshire SL1 2DQ
Telephone: (44) 075 357 4123Telefax: (44) 075 369 1632
Office of Population Censuses & Surveys (OPCS)St. Catherine's House10 KingswayLondon WC2B 6JP
113 1 2 7
UNITED STATES
National Center for Education StatisticsU.S. Department of Education555 New Jersey Avenue, NWWashington DC 20208
Telephone: (202) 219 1828Telefax: (202) 219 1736
FOUNDATIONS AND CENTERS
Brookings Institute1775 Massachusetts Avenue NWWashington, DC 20036
Telephone: (202) 797 6000Telefax: (202) 797 6004
William T. Grant Foundation515 Madison Avenue, 6th FloorNew York, NY 10022
Telephone: (212) 752 0071Telefax: (212) 752 1398
RAND CorporationP.O. Box 2138Santa Monica, CA 90407-2138
Telephone: (310) 393 0411Telefax: (310) 393 4818
U.S. Department of LaborBureau of International Labor Affairs200 Constitution Avenue NWWashington, DC 20210
Telephone: (202) 219 6043Telefax: (202) 219 5980
114
144.12,1,1.roft.1,14.1.47,441,e,te.

Bibliography
Alkin, Marvin C., ed. 1992. "Vocational Education." In Encyclopedia of Educational Research.New York: Macmillan Publishing Company. p. 1515.
Ambassade de France, Press and Information Service. October 1992. Facts from France.Washington, DC.
Ambassade de France, Service Culture!. 1991. Organisation of the French Educational SystemLeading to the French Baccalaureat. Washington, DC.
Association of German Chambers of Industry and Commerce. 1988. The Dual System:Vocational Training in the Federal Republic of Germany. Bonn: Deutscher Industrie andHandelstag.
Blanchflower, David G., and Lynch, Lisa M. November 1991. Training at Work: A Comparisonof U.S. and British Youths. (Preliminary draft). London: NBER/CEP Conference.
Braun, Frank. 1987. "Vocational Training as a Link between the Schools and the Labour Market:The Dual System in the Federal Republic of Germany." Comparative Education 23 (2):123-143.
Buechtemann, Christoph F., Schupp, Juergen, and Soloff, Dana. 1993. "Roads to Work: School-to-Work Transition Patterns in Germany and the United States." Industrial RelationsJournal 24 (2): 97-111.
Castro, C.D., and Alfthan, T. 1992. "Vocational Education and Training, InternationalDifferences." In Encyclopedia of Educational Research, Sixth Edition, 1510-1516. NewYork: Macmillan.
Central Office of Information. August/September 1989. Education in Britain. London: HMSO.
Centre for Policy Studies in Education. February 1993. The Changing Role of Vocational andTechnical Education and Training, Canada. Ontario: Council of Ministers of Education,Canada.
Centro Studi Investimenti Sociali (CENSIS). 1991. Italy Today: Social Picture and Trends,1990. Rome.
Clark, Burton, ed. 1985. The School and the University: An International Perspective. Berkeley:University of California Press.
Clark, Warren. 1991. The Class of 86: A Compendium of Findings. Ottawa: Employment andImmigration Canada.
Clough, Elizabeth, Gray, John, Jones, Ben, and Pattie, Charles. April 1988. England & WalesYouth Cohort Study: Routes Through YTS: The Experiences of Young People Participatingon the Youth Training Scheme. (Research and Development No. 42-Youth Cohort SeriesNo. 2). Sheffield, England: Manpower Services Commission.
Council of Chief State School Officers. 1992. European Lessons from School and theWorkplace. Washington, DC: Council of Chief State School Officers.
Council of Ministers of Education, Canada. September 14-19, 1992. Education in Canada:1988-1992: Report to the 43rd Session, International Conference on Education, Geneva.Ontario.
. February 1993. The Changing Role of Vocational and Technical Education andTraining, Canada. British Columbia: The Centre for Policy Studies in Education,University of British Columbia.
Courtenay, Gill. April 1988. England & Wales Youth Cohort Study: Report on Cohort 1,Sweep 1. (Research and Development No. 41-Youth Cohort Series No. 1). Sheffield,England: Manpower Services Commission.
. October 1988. England & Wales Youth Cohort Study: Report on Cohort 1,Sweep 2. (Research and Development No. 44-Youth Cohort Series No. 3). Sheffield,England: Employment Department Group Training Agency.
. June 1989. England & Wales Youth Cohort Study: Report on Cohort 1,Sweep 3. (Research and Development No. 47-Youth Cohort Series No. 4). Sheffield,England: Employment Department Group Training Agency.
. August 1989. England & Wales Youth Cohort Study: ReportSweep I. (Research and Development No. 48-Youth Cohort Series No.England: Employment Department Group Training Agency.
. October 1989. England & Wales Youth Cohort Study: ReportSweep I. (Research and Development No. 53-Youth Cohort Series No.England: Employment Department Group Training Agency.
. January 1990. England & Wales Youth Cohort Study: Report on Cohort 2, Sweep 2.(Research and Development No. 55-Youth Cohort S ° Ties No. 9). Sheffield, England:Employment Department Group Training Agency.
March 1990. England & Wales Youth Cohort Study: Report on Cohort 2, Sweep 3.(Research and Development No. 59-Youth Cohort Series No. 11). Sheffield, England:Employment Department Group Training Agency.
Courtenay, Gill, and McAleese, Ian. December 1991. England & Wales Youth Cohort Study:Report on Cohort III Sweep 3,18-19 Year Olds in 1989. (Research and Development No.66-Youth Cohort Series No. 17). Sheffield, England: Research Management Branch,Employment Department.
. July 1993. England & Wales Youth Cohort Study: Cohort IV: Young People 16-17Years Old in 1989, Report on Sweep 1. (ED Research Series, Youth Cohort Report No. 21).Sheffield, England: Employment Department.
. August 1993. England & Wales Youth Cohort Study: Cohort 5: Aged 16-17 in 1991,Report on Sweep 1. (ED Research Series, Youth Cohort Report No. 22). Sheffield,England: Employment Department.
Department for Education, Government Statistical Service. June 1993. "Participation inEducation by 16-18 Year Olds in England: 1979/80 to 1992/93," in Statistical Bulletin.Issue No 16/93. London.
Department of Education and ,cience, Government Statistical Service. 1992. EducationStatistics for the United Kingdom, 1991 Edition. London: HMSO.
Derouet, Jean-Louis. 1991. "Lower Secondary Education in France: From Uniformity toInstitutional Autonomy." European Journal of Education 26 (2): 119-132.
Douglass, G.K. 1977. "Economic Returns on Investments in Higher Education," in Investmentsin Learning. Ed. H. Bowen. San Francisco: Jossey-Bass Publishers.
Drake, Keith. 1991. "Inventions in Market Financing of Training in the European Community,"in International Comparisons of Vocational Education and Training for IntermediateSkills. Ed. Paul Ryan. Oxford: Falmer Press.
on Cohort 2,5). Sheffield,
on Cohort 3,3). Sheffield,
118
131
Dundas-Grant, Valerie. 1985. "The Organisation of Vocational/Technical/TechnologicalEducation in France." Comparative Education 21 (3): 257-272.
Education Information Network in the European Community (EURYDICE) and EuropeanCentre for the Development of Vocational Training (CEDEFOP). 1991. Structures oftheEducation and Initial Training Systems in the Member Stales of the European Community1990. Luxembourg: Office for Official Publications of the European Communities.
Edwards, Tony, Gewirtz, Sharon, and Whitty, Geoff. March 1992. "Researching a Policy inProgress: The City Technology Colleges Initiative." Research Papers in Education: Policyand Practice 7 (1).
Employment and Immigration Canada and Statistics Canada. 1990. National ApprenticeshipSurvey (1989-90): A Compendium of Findings. Ottawa.
European Centre for the Development of Vocational Training (CEDEFOP). 1980. Descriptionsof the Vocational Training Systems: Italy. Berlin.
. 1981. The Material and Social Standing of Young People during Transition fromSchool to Work Life. Berlin.
. 1987. Terminology of Vocational Training: Basic Concepts. Berlin.
. 1989. Vocational Education in France: Structural Problems and Present EffortsTowards Reform. Berlin.
. 1991. Vocational Training in the Federal Republic of Germany. Berlin.
Federal Ministry of Education and Science. 1991. Report on Vocational Education, 1991. Bonn.
. 1992a. Basic and Structural Data: 1992/93. Bonn.
. 1992b. Learning for the Working World: Vocational Training in the FederalRepublic of Germany. No. 5/6. Bonn.
. 1992c. Numerical Barometer: Some Educational Statistics 1992/93. Bonn.
. 1992d. Vocational Training in the Dual System in the Federal Republic of Germany.Bonn.
Gaziel, Haim. 1989. "The Emergence of the Comprehensive Middle School in France:Educational Policy-Making in a Centralized System." Comparative Education 25 (1): 29-40.
Gifford, Antoinette G., Hoachlander, E.G., and Tuma, John. 1989. "The Secondary SchoolTaxonomy Final Report." A report prepared for the U.S. Department of Education, Officeof Planning, Budgeting, and Evaluation, National Assessment of Vocational Education.Berkeley: MPR Associates, Inc.
Gray, John, and Sime, Nicholas. August 1990. England & Wales Youth Cohort Study: Patternsof Participation in Full-Time Post-Compulsory Education. (Research and DevelopmentNo. 61-Youth Cohort Series No. 13). Sheffield, England: Employment Department GroupTraining Agency.
Gray, John, Jesson, David, and Tranmer, Mark. June 1993. England & Wales Youth CohortStudy: Boosting Post-16 Participation in Full-Time Education: A Study of Some KeyFactors. (ED Research Series, Youth Cohort Report No. 20). Sheffield, England:Employment Department.
11932
Gray, John, Jesson, David, Pattie, Charles, Sime, Nicholas. October 1989. England & WalesYouth Cohort Study: Education and Training Opportunities in the Inner City. (Researchand Development No. 51-Youth Cohort Series No. 7). Sheffield, England: EmploymentDepartment Group Training Agency.
Hoachlander, E.G. 1989. National Data Needs for Vocational Education. Berkeley: NationalCenter for Research in Vocational Education.
. 1994. "Collecting Information on Participation in Postsecondary VocationalEducation." Paper prepared for the U.S. Department of Education, National Center forEducation Statistics. Berkeley: MPR Associates, Inc.
Hoachlander, E.G., Kaufman, P., Levesque, K., and Houser, J. 1992. Vocational Education in theUnited States: 1969-1990. Washington, DC: U.S. Department of Education, NationalCenter for Education Statistics.
Jesson, David, and Gray, John. June 1990. England & Wales Youth Cohort Study: Access, Entryand Potential Demand for Higher Education amongst 18-19 Year Olds in England andWales. (Research and Development No. 60-Youth Cohort Series No. 12). Sheffield,England: Employment Department Group Training Agency.
Jesson, David, Gray, John, and Sime, Nicholas. August 1991. England & Wales Youth CohortStudy: Participation, Progress and Performance in Post-Compulsory Education. (Researchand Development No. 64-Youth Cohort Series No. 15).. Sheffield, England: ResearchManagement Branch, Employment Department.
Kerckhoff, Alan C. 1990. Getting Started: Transition to Adulthood in Great Britain. Boulder:Westview Press.
. 1993. Diverging Pathways: Social Structure and Career Deflections. Cambridge:Cambridge University Press.
Kerckhoff, Alan C. et al. 1983. Regular and Vocational Education in the Process ofOccupational Achievement in Great Britain and the United States. Washington, DC: U.S.Department of Education, National Center for Education Statistics.
Lauglo, J., and Lillis, K., eds. 1988. Vocationalizing Education: An International Perspective.Oxford: Pergamon Press.
Leestma, Robert, and Walberg, Herbert J., eds. 1992. "Japanese Educational Productivity."Michigan Papers in Japanese Studies, no. 22.
McCormick, Kevin. 1988. "Vocationalism and the Japanese Educational System." ComparativeEducation 24 (1).
. 1989. "Towards a Lifelong Learning Society: The Reform of Continuing VocationalEducation and Training in Japan." Comparative Education 25 (2).
Meijer, Kees. 1991. "Reforms in Vocational Education and Training in Italy, Si,)ain and Portugal:Similar Objectives, Different Strategies." European Journal of Education. 26 (1).
Ministere de l' tducation. 1992a. Basic Statistics on Preschool, Elementary School andSecondary School Education. Province of Quebec: Gouvernement du Quebec.
. 1992b. 1992-1993 Program Catalogue: Vocational Education in Secondary School.Province of Quebec: Gouvernement du Quebec.
. 1992c. Statistiques de l'Education. Province of Quebec: Gouvernement du Quebec.
120 133
6.111.1:*47ext.M. a.
Ministere de l'Education Nationale. "Effectifs du Second Degre: Public + Prive 1991-92." Noted' Information, 92.08, Tableau 1, 4.
Ministere de l'Enseignement Supeieur et de la Science. January 1992. Studying in Quebec.Province of Quebec: Gouvernement du Quebec.
. April 1992. La Re lance au Collegial. Province of Quebec: Gouvernement duQuebec.
Ministry of Advanced Education, Training, and Technology. 1990. B.C. PostsecondaryEnrollment Statistics, 1989-90. Province of British Columbia.
. 1991. B.C. College Student Outcomes Report. Province of British Columbia.
. October 1992a. History of FTE's, 1988-89-1991-92. Province of British Columbia.
October 1992b. Opportunities in Advanced Education and Training: A Guide toPrograms Available at British Columbia Postsecondary Institutions. Province of BritishColumbia.
Ministry of Education, Science and Culture. 1989. Education in Japan: A Graphic Presentation.Tokyo: Research, Statistics and Planning Division.
. 1990a. Japanese Government Policies in Education, Science and Culture 1990:Towards the Creation of New Structures for Higher Education. Tokyo.
. 1990b. Statistical Abstract of Education, Science and Culture, 1990 edition. Tokyo:Research, Statistics and Planning Division.
Morris, Marian, Saunders, Lesley, and Schagen, Ian. 1992. The Impact of Compacts 1991.Berkshire, England: National Foundation for Educational Research.
National Commission on Excellence in Education. 1983. A Nation at Risk: The Imperatives forEducational Reform. Washington, DC.
National Institute of Economic and Social Research. October 1990. Productivity, Education andTraining: Britain and Other Countries Compared. London.
Nothdurft, William E. 1989. School Works: Reinventing Public Schools to Create the Workforceof the Future. Washington, DC: The Brookings Institute.
Organization for Economic Co-operation and Development (OECD). 1985a. CompulsoryEducation and Training: Student Flows in Four OECD Countries. Paris.
. 1985b. Education and Training after Basic Schooling. Paris.
. 1985c. Postcompulsory Education and Training: Student Flows in Four OECDCountries. Paris.
. 1989. Pathways for Learning: Education and Trainingfrom 16 to 19. Paris.. 1990. Education in OECD Countries 1987-88: A Compendium of Statistical
Information. Paris.
. 1991. Labor Force Statistics. Paris.
. 1992. Education at a Glance. Paris.
. 1993. Education at a Glance. Paris.
134121
Parkes, David. 1991. "Home Thoughts from Abroad: Diagnosis, Prescription and Prognosis forBritish Vocation Education and Training." European Journal of Education 26 (1): 41-53.
Perry, Rick L. 1991. "The German Apprenticeship System: Everybody's Talking About It, But IsIt the Right Model for America?" Vocational Education Journal 66 (5): 30-31,46.
Postlethwaite, Neville T., ed. 1988. The Encyclopedia of Comparative Education and NationalSystems of Education. Oxford: Pergamon Press.
Raffe, David. May 1992. Participation of 16-18 year Olds in Education and Training. NationalCommission on Education Briefing #3. London.
Raffe, David, and Rumberger, Russell W. 1992. "Education and Training for 16-18 Year Olds inthe UK and USA." Oxford Studies in Comparative Education 2 (2): 135-157.
Riddle, Wayne. 1984. Public Sector Education Systems in England, France, Japan, SovietUnion, United States, and West Germany: A Comparative Analysis. Washington, DC:Congressional Research Service.
Roberts, Ken, and Chadwick, Cherie. August 1991. England & Wales Youth Cohort Study:Transitions into the Labour Market: The New Routes of the 1980s, A Study of Transitions1984-87. (Research and Development No. 65-Youth Cohort Series No. 16). Sheffield,England: Employment Department.
Rohlen, Thomas. 1983. Japan's High Schools. Berkeley: University of California.
Ryan, Paul, ed. 1991. International Comparisons of Vocational Education and Training orIntermediate Skills. Oxford: Falmer Press.
Schenkel, Peter. 1988. "West Germany's Dual Training System." Vocational Education Journal66 (3): 29-31,47.
Sime, Nicholas. November 1991. England & Wales Youth Cohort Study: Constraining Choices:Unemployment Amongst Sixteen and Seventeen Year Olds in the Late Eighties. (Researchand Development No. 67-Youth Cohort Series No. 18). Sheffield, England: ResearchManagement Brancy, Employment Department.
Sime, Nicholas, Pattie, Charles, and Gray, John. September 1990. England & Wales YouthCohort Study: What Now? The Transition from School to the Labour Market Amongst 16to 19 Year Olds. (Research and Development No. 62-Youth Cohort Series No. 14).Sheffield, England: Employment Department Group Training Agency.
Statistics Canada. 1991. "Full-time Enrollment in Trade and Vocational Programs in Canada.August 1988-89." Education Statistics Bulletin. Catalogue 81-002. Vol. 13, no. 5. Ottawa.
Statistics Canada and the Council of Ministers of Education. August 1990. A Statistical Portraitof Elementary and Secondary Education in Canada. Ottawa.
Steedman, Hilary. 1992. "Assessing Performance and Standards in Education and Training: ABritish View in Comparative Perspective." Comparative Education 28 (1): 53-60.
Stern, David. 1992. "School to Work Transition and the Relevance of Vocational Education toSubsequent Employment." A report prepared for the National Assessment of VocationalEducation. Berkeley: National Center for Research in Vocational Education.
Tan, Hong et al. 1991. Youth Training in the United States, Britain, and Australia. Santa Monica:The RAND Corporation.
Tight, Malcolm. 1991. "Part-time Higher Education in Western Developed Countries." EuropeanJournal of Education 26 (1).
U.S. Congress. 1990. Public Law 101-392, The Carl D. Perkins Vocational and AppliedTechnology Amendments of 1990. Washingtoa, DC.
U.S. Department of Education. January 1987. Japanese Education Today. Washington, DC.
U.S. Department of Education, Office of Educational Research and Improvement, NationalCenter for Education Statistics. 1990. 1990 National Postsecondary Aid Study.Washington, DC.
. 1992a. National Education Longitudinal Study of 1988. "Second Followup Survey."Washington, DC.
. 1992b. Overview and Inventory of State Requirements for School Coursework andAttendance. Washington, DC.
U.S. Department of Education, Office of Educational Research and Improvement, NationalAssessment of Vocational Education. 1993. National Assessment of Vocational EducationInterim Report to Congress. Washington, DC.
. 1994a Forthcoming. National Assessment of Vocational Education Final Report to.Congress. Washington, DC.
. 1994b. Unpublished tabulations. Washington, DC.
U.S. General Accounting Office. 1990. Training Strategies: Preparing Nancollege Youth forEmployment in the U.S. and Foreign Countries. Washington, DC.
Uthmann, Karl-Josef. 1991. "Vocational Education and Training in Germany after Unification."European Journal of Education 26 (1): 5-12.
Whitfield, Keith, and Bourlakis, Costas. January 1990. England & Wales Youth Cohort Study:YTS and The Labour Queue. (Research and Development No. 54-Youth Cohort SeriesNo. 8). Sheffield, England: Employment Department Group Training Agency.
Wolf, Alison, and Rapiau, Marie Therese. 1993. "The Academic Achievement of CraftApprentices in France and England: Contrasting Systems and Common Dilemmas."Comparative Education 29 (1): 29-43.
136
123

9
SBN 0-16 045219 -8
780160 4521.1
IS?