Embed Size (px)
Citation preview

2010Version
Overview
Vocationaland TechnicalTraining in Québec

© Gouvernement du QuébecMinistère de l'Éducation, du Loisir et du Sport, 2010
ISBN 978-2-550-59662-2 (print)ISBN 978-2-550-59663-9 (PDF)
ISSN 1715-300X (print)ISSN 1923-7480 (PDF)
Legal Deposit–Bibliothèque et Archives nationales du Québec, 2010Legal Deposit–Bibliothèque et Archives Canada, 2010

Foreword
Ensuring that there are enough skil led workers to meet labour needsis a major chal lenge facing every modern society. Constant labourmarket f luctuat ions mean that workers need to be not only h ighlyski l led but also adaptable and innovative. Vocational and technicaltraining (VTT) has a decisive role to play in this regard since it enablesstudents to acquire the occupat ional competencies demanded bythe labour market, as wel l as the personal ski l ls and att i tudes thatwill allow them to adapt to change and to acquire new competencies.
Over 20 years ago, Québec embarked on a comprehensive reformof i ts VTT system to br ing i t in l ine w i th a competency-basedapproach. The new program-development process, centred on ensur-ing a consistent match between the competencies taught in schooland those required in the workplace, is largely based on a sequenceof measures and steps designed to increase the number of qualif iedgraduates in al l the regions of Québec.
The Québec government has invested heavily in providing educationalinstitutions with some of the most effective training mechanisms possi-ble. Although Québec has attained its objective of offering universalaccess to diversif ied and effective VTT programs, many chal lengesremain, including that of renewing its labour force, given the prevailingdemographic context.
This publ icat ion is a f i f th update to the 2003 edit ion. I t descr ibesthe current s i tuat ion of Québec’s VTT system. I t a lso out l ines thesystem’s character is t ics and shows how i ts var ious componentshave evolved over the past few years. This analysis is supplementedwith detailed tables and charts, which we hope will prove informativefor our different partners and for the general public.
Vocational and Technical Training in Québec: Overview

Contents
1 Québec’s Vocational and Technical Training System . . . 1
Legal and regulatory framework . . . . . . . . . . . . . . . . . . . . . . . . . . . . . . . . 1
Responsibilities . . . . . . . . . . . . . . . . . . . . . . . . . . . . . . . . . . . . . . . . . . . . . . 3
Major reform . . . . . . . . . . . . . . . . . . . . . . . . . . . . . . . . . . . . . . . . . . . . . . . . 3
Program management . . . . . . . . . . . . . . . . . . . . . . . . . . . . . . . . . . . . . . . . 4
Partnerships . . . . . . . . . . . . . . . . . . . . . . . . . . . . . . . . . . . . . . . . . . . . . . . . 5
2 Program Offerings . . . . . . . . . . . . . . . . . . . . . . . . . . . . 6
Diversity of training programs . . . . . . . . . . . . . . . . . . . . . . . . . . . . . . . . . . 6
Provincewide training services . . . . . . . . . . . . . . . . . . . . . . . . . . . . . . . . . . 7
Investments and training costs . . . . . . . . . . . . . . . . . . . . . . . . . . . . . . . . . 8
Diversified training options . . . . . . . . . . . . . . . . . . . . . . . . . . . . . . . . . . . . . 9
Recognition of prior learning and competencies . . . . . . . . . . . . . . . . . . . 10
Significant financial aid . . . . . . . . . . . . . . . . . . . . . . . . . . . . . . . . . . . . . . . 10
3 School Attendance . . . . . . . . . . . . . . . . . . . . . . . . . . . 12
Enrollments and graduation . . . . . . . . . . . . . . . . . . . . . . . . . . . . . . . . . . . 12
Enrollments, by age and gender . . . . . . . . . . . . . . . . . . . . . . . . . . . . . . . 15
Educational success . . . . . . . . . . . . . . . . . . . . . . . . . . . . . . . . . . . . . . . . 18
4 Integration Into the Job Market . . . . . . . . . . . . . . . . . 20
Employment rate differences, by program of study . . . . . . . . . . . . . . . . 22
Employment rate differences, by age and gender . . . . . . . . . . . . . . . . . . 23
Employer satisfaction . . . . . . . . . . . . . . . . . . . . . . . . . . . . . . . . . . . . . . . . 23
5 Labour Market Outlook and Demographic Trends . . . 24
Promotional campaigns . . . . . . . . . . . . . . . . . . . . . . . . . . . . . . . . . . . . . . 24
Important demographic changes . . . . . . . . . . . . . . . . . . . . . . . . . . . . . . . 24
6 Challenges and Development . . . . . . . . . . . . . . . . . . . 26
Appendix . . . . . . . . . . . . . . . . . . . . . . . . . . . . . . . . . . 28
Vocational and Technical Training in Québec: Overview

1 Québec’s Vocational and TechnicalTraining System
Legal and regulatory framework
Under Canada’s Constitution, the Québec government has complete juris-diction over its education system, which includes four levels: preschooland elementary, secondary, college, and university. From the age of five,children attend kindergarten, at the preschool level, for one year.Elementary education normally lasts six years, and secondary education,five. Depending on the choice of program, students can enroll in voca-tional training in their third, fourth or fifth year of secondary school. General-education students who earn a Secondary School Diploma (SSD) can goon to college for a two-year pre-university program or a three-year tech-nical program. Lastly, university education is divided into three cycles.Three-or four-year undergraduate programs lead to a bachelor’s degree.Graduate studies lead to a master’s degree, and postgraduate studies,to a doctorate.
School attendance is compulsory for all children in Québec between theages of six and sixteen. Elementary education is offered in French, inEnglish or in Aboriginal languages, while secondary education is providedin French or in English. College and university students can choose eitherEnglish or French as the language of instruction, depending on the insti-tution they attend. Educational services are free for Québec residentsexcept for university education; however, the Québec government offersstudents financial aid in the form of loans and bursaries.
1Vocational and Technical Training in Québec: Overview

2 Vocational and Technical Training in Québec: Overview
I I
I II
I IV
V
Québ
ec’s
Edu
catio
n Sy
stem
Cont
inui
ng e
duca
tion
and
trai
ning
Job
mar
ket
Sem
iski
lled
occu
patio
ns |
Ski
lled
occu
patio
ns |
Tec
hnic
ians
and
tech
nolo
gist
s |
Pro
fess
iona
l occ
upat
ions
Voca
tiona
l tra
inin
gDV
S: 6
00 to
180
0 ho
urs
AVS:
330
to 9
00 h
ours
Age
16 +
lang
uage
of i
nstru
ctio
n,se
cond
lang
uage
and
Sec
. III
mat
hem
atic
s fo
r cer
tain
pro
gram
sor Ag
e 16
+ la
ngua
geof
inst
ruct
ion,
sec
ond
lang
uage
and
Sec
. IV
mat
hem
atic
sfo
r cer
tain
pro
gram
s
Trai
ning
for s
emis
kille
doc
cupa
tions
TCST
: 900
hou
rsCo
mpl
etio
n of
Sec
. II
Univ
ersi
ty
Post
grad
uate
PhD
(3 o
r mor
e ye
ars)
Grad
uate
MA
(2 y
ears
)
Unde
rgra
duat
eBA
(3 o
r 4 y
ears
)
Colle
ge
Preu
nive
rsity
edu
catio
nDC
S: 2
yea
rs
Tech
nica
l tra
inin
gDC
S: 3
yea
rs
SSD
Seco
ndar
y5
year
s(a
ges
12 to
17)
Elem
enta
ry6
year
s (a
ges
6 to
12)
Pres
choo
l1
year
(Age
5)

Responsibilities
Public or private secondary schools offer vocational training programs,among other services. CEGEPs,* private colleges and certain governmentschools offer technical training programs. Several factors determine if aprogram of study is to be offered at the secondary or college level, includ-ing the complexity of the occupation to which the program leads and theacademic prerequisites required for admission to the program. Vocationaltraining programs generally lead to occupations and are certified by aDiploma of Vocational Studies (DVS) an Attestation of VocationalSpecialization (AVS). For several years now, school boards have beenoffering a vocational training option leading to a Skills Training Certificate(STC); programs under this option are designed to meet periodic trainingneeds. Colleges offer technical programs that allow graduates to work astechnicians or technologists. These programs are certified by a Diplomaof College Studies (DCS) or an Attestation of College Studies (ACS).
School boards and CEGEPs also offer continuing education and train-ing both in educational institutions and in the workplace. These offeringsare tailored to match businesses’ and individuals’ specific needs. Thetraining provided is either customized or based on an official program of study, and leads to various types of certification issued by the edu-cational institutions.
Major reform
In 1986, the Ministère de l’Éducation du Québec (MEQ) launched a majorreform of vocational education (now known as vocational training), whichled to:
• The definition of new vocational training paths
• The adoption of a competency-based approach as the foundation for program design
• A new geographical distribution of program offerings corresponding to the social and economic profile of each region
• Major capital investments (buildings and equipment)
Moreover, in 1993-1994, the renewal of the college system made it possible to extend the competency-based approach to technical training.
3
* A French acronym for general and technical colleges (collèges d'enseignement généralet professionnel).

Program management
The Ministère de l’Éducation, du Loisir et du Sport (MELS) guides andsupports VTT development by providing integrated program management,organizing program offerings, and ensuring universal access to educa-tion. In practice, this means that it handles the educational, physical andmaterial aspects of instruction, develops programs, issues diplomas andfunds training activities.
The process for developing VTT programs comprises a series of stepsthat include planning, design, development, implementation, follow-upand evaluation.
4 Vocational and Technical Training in Québec: Overview
Management Cycle
�program approval
�institutional authorizations
Evaluation of the system�programs
�performance (indicators, success rates)
�job entry
�employer satisfaction
Implementation of training�building construction and renovation
�purchase of equipment and materials
�in-service teacher training
�student training
�evaluation of student learning
Impact analysis�organizational guide
�funding parameters
�distribution of program offerings
Program development�job analysis
�design of the proposed training plan
�validation of the proposed training plan
�program development
Planning�sector surveys and monitoring
�orientations
�priority setting within and between sectors

Partnerships
Apart from the public sector (school boards, CEGEPs and governmentschools) and the private sector, several other partners work closely withthe MELS to plan and organize VTT services in Québec. Active partici-pants in this process include different government ministries and sectororganizations.
Emploi-Québec, for example, is responsible for estimating labour needsand for managing and directing the apprenticeship program, among otherthings. These activit ies, which rely on in-depth knowledge of the job market and labour forecasts, are essent ia l in planning which VTT programs are to be offered in Québec. These activit ies are also the cornerstone of the employment-training correlation model that the MELSuses to determine each region’s share of program offerings.
In addition, some 30 sector committees set up by Emploi-Québec workin close collaboration to identify occupational competencies and to runthe apprenticeship program. The Commission de la construction duQuébec (CCQ) also plays a vital role in developing VTT programs, giventhat it is mandated to coordinate the construction industry training sys-tem, making sure that it corresponds to industry needs and realities.
Businesses, for their part, play a leading role in Québec’s VTT system.They take part in various surveys and studies carried out before programsare developed or revised. They are active participants in job analysis.Specialists from the different occupations are called upon to identify thecompetencies and attitudes required by the job market. Businesses alsohelp students get on-the-job training through their involvement in tradi-tional practicums or in work-study or apprenticeship programs that pairup students with journeymen.
Finally, the Comité national des programmes d’études professionnelleset techniques (CNPEPT), composed of representatives from business,labour unions, school boards, CEGEPs, private educational institutionsand Emploi-Québec, advises the MELS on all important VTT issues aswell as on program orientations and development.
5Vocational and Technical Training in Québec: Overview

2 Program Offerings
Diversity of training programs
Québec offers close to 300 VTT programs designed to meet the needs ofbusinesses and individuals. These programs all follow a competency-based approach. Programs are divided among 21 training sectors andcover all the occupations requiring vocational or technical training. Morespecifically, 140 programs lead to a Diploma of Vocational Studies (DVS),110 lead to a Diploma of College Studies (DCS), and 25 lead to anAttestation of Vocational Specialization (AVS).
In addition, school boards issue 31 different Skills Training Certificates(STC). As for educational institutions at the college level, they offer morethan 1 200 different Attestations of College Studies (ACS). For the 2008-2009 school year, over 600 of these ACS programs declared enrollments.Programs leading to a DVS, representing 600 to 1800 hours, normally lastone to two years, while programs leading to an AVS or an STC last lessthan a year. Finally, DCS programs last three years, and ACS programsvary in length from several months to over a year.
6 Vocational and Technical Training in Québec: Overview
DVS AVS Total
Source: Ministère de l’Éducation, du Loisir et du Sport (MELS), Direction générale de la formation professionnelle et technique (DGFPT), Direction de la gestion stratégique de l’offre de formation (DGSOF), 2010.
Distribution of programs by educational path and training sectorVocational and technical training (Québec as a whole, 2009-2010)
DCS
Administration, Commerce and Computer Technology 5 5 5 15
Agriculture and Fisheries 12 1 9 22
Arts 5 1 10 16
Beauty Care 2 1 - 3
Buildings and Public Works 24 2 6 32
Chemistry and Biology 1 - 5 6
Communications and Documentation 4 - 11 15
Electrotechnology 8 1 5 14
Fashion, Leather and Textiles 8 - 3 11
Food Services and Tourism 7 3 5 15
Forestry and Pulp and Paper 8 - 3 11
Health Services 5 - 20 25
Land Use Planning and the Environment 1 - 4 5
Maintenance Mechanics 6 3 1 10
Mechanical Manufacturing 9 4 7 20
Metallurgical Technology 8 1 1 10
Mining and Site Operations 8 - 1 9
Motorized Equipment Maintenance 9 2 2 13
Social, Educational and Legal Services 2 - 8 10
Transportation 2 - 3 5
Woodworking and Furniture Making 6 1 1 8
Total 140 25 110 275

Provincewide training services
Vocational and technical training is available throughout Québec. Vocationaltraining is managed by 70 school boards, including 9 English-languageboards and two special-status boards. Altogether they operate 170 voca-tional training centres. Vocational training is also offered by 3 governmentschools and 30 private institutions. Technical training is provided by 52CEGEPs, 4 government schools and 13 private institutions offering DCSprograms, as well as by 25 non-subsidized private institutions offeringACS programs.
7Vocational and Technical Training in Québec: Overview
1 T
otal
num
ber o
f pro
gram
aut
horiz
atio
ns p
er re
gion
. The
sam
e pr
ogra
m m
ay b
e co
unte
d m
ore
than
onc
e if
it is
offe
red
by s
ever
al o
rgan
izat
ions
in th
e sa
me
regi
on.
2 N
umbe
r of a
utho
rized
pro
gram
s pe
r reg
ion.
Pro
gram
s ar
e co
unte
d on
ly o
nce
in a
regi
on e
ven
if of
fere
d by
mor
e th
an o
ne o
rgan
izat
ion.
Sour
ce: M
ELS,
DGF
PT, D
GSOF
, 201
0.
01
Bas-
Sain
t-La
uren
t 76
57
4
55
42
5
02
Sagu
enay
–Lac
-Sai
nt-J
ean
90
70
4 51
39
4
03
Capi
tale
-Nat
iona
le
166
115
11
82
55
8
04
Mau
ricie
57
55
3
45
37
4
05
Estri
e 10
4 81
6
33
29
3
06
Mon
tréal
25
8 16
2 13
18
9 75
19
07
Outa
ouai
s 83
73
6
27
21
2
08
Abiti
bi-T
émis
cam
ingu
e 58
53
5
13
13
1
09
Côte
-Nor
d 32
26
2
15
12
2
10
Nord
-du-
Québ
ec
48
33
3 -
- -
11
Gasp
ésie
–Île
s-de
-la-M
adel
eine
46
37
5
12
12
1
12
Chau
dièr
e-Ap
pala
ches
84
56
4
31
21
3
13
Lava
l 69
66
3
19
19
1
14
Lana
udiè
re
46
40
3 21
19
3
15
Laur
entid
es
84
65
7 26
24
2
16
Mon
téré
gie
238
113
19
77
38
8
17
Cent
re-d
u-Qu
ébec
68
56
7
19
16
3
Regi
onal
dis
trib
utio
n of
aut
horiz
atio
ns to
offe
r the
DVS
and
AVS
in v
ocat
iona
l tra
inin
g an
d th
e DC
S in
tech
nica
l tra
inin
g pr
ogra
ms
in
term
s of
the
num
bers
of e
duca
tiona
l org
aniz
atio
ns (s
choo
l boa
rds,
CEG
EPs,
priv
ate
inst
itutio
ns, g
over
nmen
t sch
ools
) (Q
uébe
c as
a w
hole
, 200
9-20
10 s
choo
l yea
r)
Adm
inis
trat
ive
regi
on
Num
ber o
f or
gani
zatio
ns
Voca
tiona
l tra
inin
gAu
thor
izat
ions
Diffe
rent
2To
tal1
Num
ber o
f or
gani
zatio
ns
Tech
nica
l tra
inin
gAu
thor
izat
ions
Diffe
rent
2To
tal1

Investments and training costs
The VTT system requires an investment of over CAN$1.5 billion per year,of which nearly $80 million go to equipment and buildings. In 2008-2009alone, investments totalled an estimated $1.7 billion. Nearly 60% of thatamount ($942.2 million) went exclusively to the technical training system.The Québec government provides almost all the funding for the VTT sys-tem, while businesses make only a minor contribution. This situationdiffers radically from that of other provinces or countries, such as Ontarioand the United States, which finance less than half of the total trainingcosts, owing to higher student and business contributions.
According to MELS estimates, annual costs in 2001 amounted to $7 519for a secondary school student, $10 711 for a pre-university college student, $14 556 for a technical college student, and $17 491 for a university student. In vocational training, the average annual cost per student is estimated to be in excess of $10 000.
Total training costs for graduates vary greatly, however, since they dependon program length and operating costs. For example, training costs amountto $12 000 for an accounting clerk, a hairdresser or a secretary; $30 000for a nursing assistant; and over $40 000 for a heavy-machine operator.These estimates obviously do not include overall educational costs incurredsince the start of elementary school. Indeed, the cost of educating acollege graduate is over $140 000, and for a university graduate with abachelor’s degree, it is close to $180 000.
8 Vocational and Technical Training in Québec: Overview
Investments in buildings and equipment for vocational training (VT) and technical training (TT) (Québec as a whole, from 2005-2006 to 2009-2010 [millions of CAN$])
*: Cost estimate based on total investments in colleges.
Source: MELS, Direction de la gestion sectorielle des ressources (DGSR), 2010.
2005-2006 2007-20082006-2007 2008-2009 Total2009-2010
Buildings
VT 42.46 51.25 39.24 9.80 0 142.75
TT 18.45 13.37 16.04 5.29 0 53.15
Subtotal 60.91 64.62 55.28 15.09 0 195.9
Equipment
VT 6.81 1.23 6.54 0.78 0 15.36
TT* 42.90 26.43 26.40 16.26 6.00 117.99
Subtotal 49.71 27.66 32.94 17.04 6.00 133.35
VTTCollaboration Plan — — 4.50 2.50 0 7.00
Total 110.62 92.28 92.72 34.63 6.00 336.25

Diversified training options
A variety of options have been implemented over the past few years tomake it easier for young people to enroll in vocational training.
• The Exploration of Vocational Training option thereby gives secondarystudents in general education the opportunity to explore one or morevocational training programs to find the one that best suits their tastesand interests.
• For its part, the concurrent-program option allows students to enrollin a vocational training program even if they do not have the requisiteSecondary IV or V credits in general education. These students must,however, have earned at least the Secondary III credits in the threebasic subjects and will have to obtain the missing credits during voca-tional training in order to comply with admission requirements beforebeing awarded a DVS. Students enrolled in vocational training canalso concurrently earn the general education credits needed to obtaintheir secondary school diploma (SSD), in addition to their DVS. Since1996-1997, the number of students enrolled in this training option hasrisen from under 100 to over 2 000 a year.
• Numerous efforts have been devoted to the creation of bridges betweenvocational and technical training. Thus many related programs now belongto continuous learning paths. These foster access to college education,facilitate academic paths between the two education levels, and promotevocational and technical training. At the moment, nearly 30 continuouslearning paths are in the process of being developed or implemented.
• Since July 1, 2008, the Attestation of Vocational Education (AVE) leadingto the exercise of a semiskilled occupation has been replaced by the TrainingCertificate for a Semiskilled Trade (TCST). Each year, over 2100 studentsenrolled in programs leading to one of the 200 attestations of vocationaleducation being offered. This new certificate is being made available toyoung people within the framework of the Work-Oriented Training Path,and adult education students have access to it as well.
9Vocational and Technical Training in Québec: Overview

Recognition of prior learning and competencies
The MELS has been supporting the principle of recognizing prior learn-ing and competencies for many years. These competencies may havebeen acquired in a school system in or outside Québec, in the workplaceor through life experience in general. In addition to continuing to developreliable, flexible and rigorous evaluation instruments, the MELS is work-ing to support the education system through various actions such asreviewing budget rules, the legislative framework and the al location of funding; developing human resources; and implementing integratedservice structures in the various regions of the province. As a result, since2005, nearly $2 million has been invested annually in all regions of Québecto ensure the adult population’s access to services that provide officialrecognit ion so they can either pursue their studies or enter the job market. The MELS is also f inancing the upgrading training required by the professional corporations, in keeping with a process for the recognition of prior learning and competencies.
In all, in 2008-2009, 6 039 adults benefited from services related to therecognition of prior learning and competencies in vocational and technicaltraining programs in Québec—an increase of over 24% in comparison withthe previous year. In vocational training, the recognition of prior learningaffected 107 training programs in 61 school boards and, in technical training, 135 programs (DCS and ACS) in 45 CEGEPs.
Significant financial aid
A loans and bursaries program provides financial aid to students enrolledin VTT. In the fall of 2008, 23% of vocational training students and 30%of technical training students received loans, while 17% of vocationaltraining students and 18% of technical training students were awarded
10 Vocational and Technical Training in Québec: Overview
Technical trainingVocational trainingYear
Source: MELS, DPD, Direction de la formation continue et du soutien (DFCS), Direction générale du financement et de l’équipement (DGFE), Direction des systèmes et du contrôle (DSC), 2010.
2002-2003 1 004 33 1 616 29
2003-2004 1 301 37 1 702 38
2004-2005 1 503 38 1 664 36
2005-2006 1 415 42 1 838 41
2006-2007 1 813 48 1 843 40
2007-2008 2 679 54 2 180 42
2008-2009 3 528 61 2 511 45
Services provided for the recognition of prior learning and competencies and the population concerned (Québec as a whole, from 2002-2003 to 2008-2009)
Number of clients
Numberof schoolboards
Number of clients
Numberof CEGEPs

bursaries. In 2008-2009, of the total student loans granted across the province, vocational training students received 16%, and technicaltraining students, 19%. Vocational training students were awarded 17%of the total number of bursaries, and technical training students, 19%.
11Vocational and Technical Training in Québec: Overview
Sour
ce: M
ELS,
Aid
e fin
anci
ère
aux
étud
es. 2
008-
2009
Rep
ort,
prel
imin
ary
data
, Apr
il 20
10.
Voca
tiona
l tra
inin
g 88
.5
77.1
68
.2
75.1
74
.5
383.
4 46
.9
49.9
59
.3
63.9
61
.6
281.
6
Colle
ge
14
5.9
123.
1 10
9.6
128.
6 12
5.2
632.
4 7
4.7
78.6
89
.2
93.6
91
.1
427.
2
Pr
euni
vers
ity e
duca
tion
35.0
30
.1
27.5
35
.5
33.9
16
2.0
14.1
16
.4
19.8
21
.8
21.6
93
.7
Te
chni
cal t
rain
ing
110.
9 93
.1
82.1
93
.1
91.3
47
0.5
66.6
62
.2
69.5
71
.8
69.6
33
9.7
Univ
ersi
ty e
duca
tion
367.
0 27
5.4
238.
3 26
5.3
259.
3 1
405.
3 16
0.9
173.
9 20
3.8
214.
5 21
5.7
968.
8
Othe
r ins
titut
ions
and
prog
ram
s 30
.2
20.6
21
.1
21.5
20
.1
113.
5 -
- -
- -
-
Tota
l
631.
6 49
6.2
437.
2 49
0.5
479.
1 2
534.
6 28
2.9
302.
7 35
2.6
372.
4 36
8.9
1 67
9.5
Inte
rest
exp
ense
s on
loan
s 40
.0
57.4
74
.2
79.6
53
.6
304.
8 -
- -
- -
-
Dist
ribut
ion
of fi
nanc
ial a
id in
the
form
of l
oans
and
bur
sarie
s, b
y le
vel o
f pro
gram
(Qué
bec
as a
who
le, f
rom
200
4-20
05 to
200
8-20
09 [m
illio
ns o
f CAN
$])
Loan
sBu
rsar
ies
2004
2005
2005
2006
2006
2007
2007
2008
2008
2009
Tota
l20
0420
0520
0520
0620
0620
0720
0720
08To
tal
2008
2009

3 School Attendance
Enrollments and graduation
The number of students enrolled in the various VTT programs in Québechas risen to nearly 200 000 a year. Over 40 000 diplomas are awardedeach year to vocational training students (DVS, AVS and AVE) and nearly30 000 to technical training students (DCS, ACS, CCS and DPEC (diplomaof advanced college studies). In comparison, the MELS annually awardssome 75 000 diplomas for general secondary-school studies and about23 000 for pre-university college studies. However, slightly fewer than threeout of ten of the students leaving the Québec education system each yearhave no specific vocational or technical qualifications to help them enterthe job market: 12% have no diplomas at all and 15% have only a generalsecondary-school or college diploma.
12 Vocational and Technical Training in Québec: Overview
20082009
20072008
20062007
20052006
20042005
20032004
20022003
20012002
20002001
Total enrollment trends in vocational training (DVS, AVS, AVE) and technical training(DCS, ACS, CCS, DPEC) (Québec as a whole, from 2000-2001 to 2008-2009)
Source: MELS, Direction de la recherche, des statistiques et des indicateurs (DRSI), DGSOF chart, 2010.
Vocational training Technical training
102
166
97 5
44
70 000
77 500
85 000
92 500
100 000
107 500
115 000
122 500
130 000
10 000
15 000
20 000
25 000
30 000
35 000
40 000
20082007200620052004200320022001
Trends in numbers of diplomas awarded in vocational training (DVS, AVS, AVE) andin technical training (DCS, ACS, CCS, DPEC) (Québec as a whole, from 2001 to 2008)
Source: MELS, DRSI, DGSOF chart, 2010.
Vocational trainingTechnical training

Enrollments in vocational training have been gradually rising for a num-ber of years, registering a 14% increase since 1999-2000. Following adecline over many years, enrollments in technical training have beenrising over the last two years. Nevertheless, they have declined by morethan 16% since 1999. Most of the increased enrollment in vocational train-ing is due to the Buildings and Public Works, Health Services, andAdministration, Commerce and Computer Technology training sectors.However, in technical training, the Health Services and Social, Educationaland Legal Services sectors, as well as Buildings and Public Works haveall performed well. Meanwhile, the sectors of Administration, Commerceand Computer Technology, Forestry and Pulp and Paper, Electrotechnology,Metallurgical Technology and Woodworking and Furniture Making in particular have experienced lower enrollments.
Enrollments in vocational and technical training vary considerably fromone region to the next. In spite of the overall increase in vocational train-ing enrollments throughout Québec, 2 of the 17 regions experienced adecline in this respect, while only 4 others saw their enrollments remainrelatively stable during the last ten years. However, 9 of the 11 regionswith rising enrollments had above average increases. As for technicaltraining, enrollments decreased everywhere in Québec, except in 2 regions.In 11 regions, enrollments fell by more than average.
In Québec, in 2008-2009, 82 vocational training programs were offeredin English (70 DVS and 12 AVS) to over 5 800 students. With respect tothe DCS in technical training, 5 English-language CEGEPs and 5 bilingualCEGEPs offered approximately 40 technical training programs in Englishto a little under 6 000 full-time students in 2008-2009.
13Vocational and Technical Training in Québec: Overview
Distribution of school leavers, by highest level of diploma(Québec as a whole, from 1998-1999 to 2007-2008)
No diploma
University diploma
Technical training diploma
General education (SSD, DCS)
Vocational training diploma
10
15
20
25
30
35
20072008
20062007
20052006
20042005
20032004
20022003
20012002
20002001
19992000
19981999
Source: MELS, Education Indicators, 2002, 2004, 2005, 2007, 2008, 2009 and 2010, DRSI, Table 5.1.

14 Vocational and Technical Training in Québec: Overview
The
data
for 2
008-
2009
ar
e pr
elim
inar
y.
1 R
egul
ar p
aths
onl
y (D
iplo
ma
of V
ocat
iona
l Stu
dies
, Ce
rtific
ate
of V
ocat
iona
l St
udie
s, A
ttest
atio
n of
Vo
catio
nal S
peci
aliz
atio
n,
and
Atte
stat
ion
of
Voca
tiona
l Edu
catio
n).
2 F
igur
es in
clud
ed s
tude
nts
enro
lled
in p
rogr
ams
lead
ing
to th
e fo
llow
ing:
DCS
(Dip
lom
a of
Col
lege
Stu
dies
); AC
S (A
ttest
atio
n of
Col
lege
St
udie
s); C
CS (C
ertifi
cate
of
Col
lege
Stu
dies
); DP
EC
(Dip
lôm
e de
per
fect
ionn
emen
t de
l’en
seig
nem
ent c
ollé
gial
).
Sour
ce: M
ELS,
Don
nées
div
erse
s su
r la
form
atio
n pr
ofes
sion
nelle
et
tech
niqu
e. D
RSI a
nd D
GSOF
, M
arch
201
0.
Bas-
Sain
t-La
uren
t 2
712
2 66
1 2
602
2 59
2 -4
.4%
4
608
4 64
8 4
577
4 90
5 6.
4%
Sa
guen
ay–
Lac-
Sain
t-Je
an
4 72
2 4
794
4 57
6 4
510
-4.5
%
5 95
0 5
894
5 69
0 5
741
-3.5
%
Capi
tale
-Nat
iona
le
11 7
72
10 6
81
10 9
61
11 2
71
-4.3
%
12 5
74
12 5
48
12 9
29
13 1
79
4.8
%
Mau
ricie
3
358
3 41
1 3
496
3 52
2 4.
9%
4
263
4 13
2 4
183
4 24
0 -0
.5%
Es
trie
3 66
7 3
691
3 73
7 3
561
-2.9
%
4 08
9 4
161
4 25
1 4
051
-0.9
%M
ontré
al
25 0
97
26 0
53
27 4
72
28 9
53
15.4
%
37 5
59
37 1
39
37 6
88
38 6
80
3.0
%
Outa
ouai
s 2
874
2 87
8 2
955
2 98
3 3.
8%
2
568
2 51
9 2
484
2 58
7 0.
7%
Ab
itibi
-Tém
isca
min
gue
1 92
9 1
966
1 96
4 1
853
-3.9
%
1 27
3 1
250
1 39
9 1
415
11.2
%
Côte
-Nor
d 89
9 97
2 98
7 1
065
18.5
%
776
741
756
758
-2.3
%
Nord
-du-
Québ
ec
420
511
567
688
63.8
%
55
38
71
89
61.8
%
Gasp
ésie
–Île
s-de
-la-M
adel
eine
1
119
1 09
5 1
017
1 07
2 -4
.2%
74
0 63
3 61
9 63
2 -1
4.6
%
Chau
dièr
e-Ap
pala
ches
4
482
4 74
7 4
681
4 76
7 6.
4%
3
440
3 27
2 3
284
3 29
0 -4
.4%
La
val
7 59
6 5
702
5 56
8 5
516
-27.
4%
3
321
3 62
3 3
586
3 74
3 12
.7%
La
naud
ière
2
407
2 77
0 3
408
4 61
9 91
.9%
2
070
2 08
0 2
148
2 30
8 11
.5%
La
uren
tides
5
549
5 80
8 5
967
6 12
0 10
.3%
3
933
3 84
5 3
863
4 04
0 2.
7%
M
onté
régi
e 11
739
12
387
12
349
12
242
4.
3%
10
072
10
004
10
091
10
545
4.
7%
Ce
ntre
-du-
Québ
ec
2 07
3 2
034
2 13
5 2
210
6.6
%
2 11
1 1
839
1 92
1 1
893
-10.
3%
Al
l of Q
uébe
c 92
415
92
161
94
442
97
544
5.
5%
99 4
02
98 3
66
99 5
40
102
166
2.8%
Tren
ds in
enr
ollm
ents
in v
ocat
iona
l and
tech
nica
l tra
inin
g, b
y ad
min
istr
ativ
e re
gion
(Qué
bec
as a
who
le, v
aria
tion
betw
een
2005
-200
6 an
d 20
08-2
009)
Voca
tiona
l tra
inin
g1
2005
2006
2007
2008
2006
2007
2008
2009
Varia
tion
2005
-200
6/20
08-2
009
Tech
nica
l tra
inin
g2
2005
2006
2007
2008
2006
2007
2008
2009
Varia
tion
2005
-200
6/20
08-2
009
01 02 03 04 05 06 07 08 09 10 11 12 13 14 15 16 17

Enrollments, by age and gender
In vocational training, male students (56%) outnumber female students.The situat ion is di fferent in technical training, however, where the proportion of female students is higher (60%). Female students are concentrated in fewer sectors. In vocational training, over 4 out of 5women (84%) are enrolled in four sectors: Administration, Commerceand Computer Technology (35%); Health Services (31%); Beauty Care(11%); and Food Services and Tourism (7%). In technical training, nearly3 out of 4 female students (71%) are enrol led in three sectors:Administration, Commerce and Computer Technology (13%); HealthServices (31%); and Social, Educational and Legal Services (27%).
15Vocational and Technical Training in Québec: Overview
The data for 2008-2009 are preliminary.
Source: MELS, DGFPT, DGSOF, 2010.
Total enrollments in 2008-2009
Female Male Total
The ten vocational (DVS, AVS) and technical (DCS) training programs with the highest enrollments. Total full-time enrollments (Québec as a whole, 2008-2009)
Vocational training programs (DVS, AVS) (Programs are offered in both English and French.)
578799/528799 Health, Assistance and Nursing 5 659 864 6 523
571299/521299 Secretarial Studies 4 695 50 4 745
576499/526499 Starting a Business 2 693 1 696 4 389
573199/523199 Accounting 3 441 793 4 234
581999/531999 Carpentry 68 3 379 3 447
579299/529299 Automobile Mechanics 149 3 219 3 368
581699/531699 Assistance in Health Care Facilities 2 342 516 2 858
579599/529599 Electricity 71 2 664 2 735
569599/519599 Welding and Fitting 167 2 518 2 685
581199/531199 Professional Cooking 976 1 130 2 106
Technical training programs (DCS) (Not all programs are offered in English.)
180.A0 Nursing 7,548 1 015 8 563
410.B0 Accounting and Management Technology 2 828 2 397 5 225
351.A0 Special Care Counselling 3 970 484 4 454
420.A0 Computer Science Technology 185 3 185 3 370
410.D0 Business Management 1 433 1 840 3 273
322.A0 Early Childhood Education 3 091 73 3 164
310.A0 Police Technology 867 1 824 2 691
388.A0 Social Service 1 995 310 2 305
221.A0 Architectural Technology 794 861 1 655
221.B0 Civil Engineering Technology 194 1 455 1 649

On the whole, students enrolled in technical training are younger thanthose in vocational training. In fact, over 85% of students enrolled in theDCS path of technical training are below the age of 25, whereas in voca-t ional training just over 55% of students belong to that age group.Interestingly enough, a little less than one-third of vocational trainingstudents are aged 30 or over. In Québec, vocational training appears tobe an option chosen more by adults than by young people. In programsleading to an ACS, on the other hand, over half the students are at least30 years old, while young people under the age of 20 account for lessthan 5% of the student population.
16 Vocational and Technical Training in Québec: Overview
The data for 2008-2009 are preliminary.
Source: MELS, DGFPT, DGSOF, 2010.
Total enrollments in 2008-2009
Female Male Total
The ten vocational (DVS, AVS) and technical (DCS) training programs with the highest enrollments of female studentsTotal full-time enrollments (Québec as a whole, 2008-2009)
Vocational training programs (DVS, AVS) (Programs are offered in both English and French.)
578799/528799 Health, Assistance and Nursing 5 659 864 6 523
571299/521299 Secretarial Studies 4 695 50 4 745
573199/523199 Accounting 3 441 793 4 234
576499/526499 Starting a Business 2 693 1 696 4 389
581699/531699 Assistance in Health Care Facilities 2 342 516 2 858
574599/524599 Hairdressing 1 954 71 2 025
553599/503599 Aesthetics 1 577 7 1 584
581199/531199 Professional Cooking 976 1 130 2 106
580299/530299 Pharmacy Technical Assistance 918 99 1 017
564499/514499 Dental Assistance 907 12 919
Technical training programs (DCS) (Not all programs are offered in English.)
180.A0 Nursing 7 548 1 015 8 563
351.A0 Special Care Counselling 3 970 484 4 454
322.A0 Early Childhood Education 3 091 73 3 164
410.B0 Accounting and Management Technology 2 828 2 397 5 225
388.A0 Social Service 1 995 310 2 305
410.D0 Business Management 1 433 1 840 3 273
570.E0 Interior Design 1 230 81 1 311
571.C0 Fashion Marketing 1 110 86 1 196
310.C0 Legal Techniques 1 022 183 1 205
412.A0 Office System Technology 967 236 1 203

Generally speaking, depending on their age, a proportionally higher num-ber of young people enroll in college technical training leading to a DCSthan in secondary-level vocational training. Up until the age of 20, thereare decidedly more young people in general education for adults than thereare in vocational training. It is only starting at age 25 that enrollments arehigher in vocational training than in technical training.
Nearly half the students who enroll in vocational training already have aSecondary School Diploma (SSD). This percentage is inversely proportionalto the student’s age, as 60% of the students aged 17 to 24 already havean SSD when they enroll in vocational training, while 40% of older studentshold this diploma.
17Vocational and Technical Training in Québec: Overview
0
10
20
30
40
50
60
Age 30 and overAges 25-29Ages 20-24Under age 20
Student enrollments in vocational training (DVS, AVS) and technical training (DCS),by age group (Québec as a whole, 2008-2009)
Source: MELS, DGSOF chart, 2010.
Vocational training
Technical training

Educational success
For a number of years, school boards, CEGEPs and MELS and manyof their partners have joined together in a massive operation aimed atimproving student graduation rates. In DVS programs as a whole, theannual graduation rate exceeds 70%. This figure, however, concealscertain discrepancies. The graduation rate for full-time students is over85%, while for technical training students enrolled in programs leadingto a DCS, it is slightly higher than 60%, provided that changes in theprograms of study and duration of training are not taken into account.If the graduation rate is considered only within the program in whichthe student is initially enrolled, the figure stands at 34% when programsare completed within the prescribed length of time (three years), butrises to 55% if completed within five years.
18 Vocational and Technical Training in Québec: Overview
Secondary School College University TotalAge
Source: MEQ, DRSI. Le cheminement des élèves, du secondaire à l’entrée à l’université. Annexe 2, 2004.
Student enrollments by age (Québec as a whole, 2000-2001 [%])
Generaleducation,
youth sector
Generaleducation,
adult sector
Vocationaltraining
Pre-universityeducation
Technicaltraining
16 87.9 5.3 1.1 1.9 - - 96.6
17 25 14.3 6.1 27.3 12.7 0.5 85.8
18 5.3 15.3 9.6 27.3 16.8 2.9 77.2
19 1 11.5 9.1 13.6 18 14 67.2
20 0.5 8.1 7.3 5.4 13.5 21 55.8
21 0.1 6.4 5.8 2.6 9.7 24.4 49.0
22 - 5.2 4.8 1.3 6.9 23.6 41.8
23 - 4.4 3.8 0.7 5 19.1 33.0
24 - 3.8 3.4 0.4 3.9 14.6 26.1
25 to 29 - 3 2.4 0.2 2.3 8.6 16.5
30 and + - 1 0.7 0 0.5 1.5 3.8

19Vocational and Technical Training in Québec: Overview
Male
LVP or DVS 2 57.1 58.3 60.0 67.7 63.9 75.3 72.8
Full-time 3 51.8 51.4 81.1 79.5 81.6 86.1 85.2
Female
LVP or DVS 2 65.5 69.5 50.3 64.5 70.2 74.5 75.0
Full-time 3 61.3 62.0 80.0 78.3 82.4 87.1 86.9
Male and female
LVP or DVS 2 61.7 64.1 54.4 66.1 66.6 75.0 73.8
Full-time 3 56.3 56.6 80.6 78.9 82.0 86.6 86.0
Proportion of secondary-level vocational training graduates1, by gender, category and last year of enrollment (%)
1980 1981
1985 1986
1990 1991
1995 1996
19992000
2006 2007
2007 2008e
Male and female graduates
Same type of initial training
3 years or less1 n.a. 29.6 26.8 31.6 32.6 34.1
5 years or less1 n.a. 51.1 47.8 52.4 52.3 55.1
All durations n.a. 56.6 53.1 57.6 59.6 62.1
Other type of initial training 2
All durations n.a. 64.4 55.7 57.8 62.8 62.9
All types of initial training and all durations
Male and female 59.0 58.6 53.9 57.7 60.7 62.4
Male 53.9 54.7 46.1 50.1 53.9 55.0
Female 63.0 61.3 60.9 64.6 65.6 68.0
Proportion of technical training DSC graduates, by last year of enrollment in regular college education, gender, type of initial training and time elapsed 1 since the beginning of studies (%)
1980 1981
1985 1986
1990 1991
1995 1996
19992000
2006 2007
2007 2008e
e: Estimates1 All secondary-level diplomas are taken into account.2 Figures for 1980-1981 and 1985-1986 include enrollments in long vocational programs (LVP) in the youth sector.
Figures after 1988-1989 take into account the Diploma of Vocational Studies (DVS) awarded in the youth and adult sectors.3 Students enrolled for 270 or more course hours per year are considered full-time.
Source: MELS, Education Indicators, 2010 edition, preliminary version, DRSI, Table 3.2.
e: Estimatesn.a.: Data not available1 The time elapsed since initial enrollment is not necessarily the same as the duration of studies because the studies
may have been interrupted at some point.2 Until 1993-1994, this category referred to students who began their studies in a preuniversity program. As of 1994-1995,
this category also includes students who leave technical training (with or without a diploma) after having begun in an Explorations program the previous year.
Source: MELS. Education Indicators, 2010 edition, preliminary version, DRSI, Table 3.4.

4 Integration Into the Job Market
Long-lasting employment is the primary aim of Québec’s VTT system. Oneyear after the end of their studies, slightly less than three quarters of VTTgraduates had jobs; of these, over 85% were full-time positions. Integrationinto the job market varies according to the educational path. Although atendency toward improved integration has been observed since the beginning of 2000, the situation has reversed during the last few years,reflecting the general situation in the job market.
A high proportion of DCS graduates tend to pursue their studies afterobtaining their diplomas. In fact, between 2000 and 2009, the proportionof college graduates who decided to continue their studies jumped from19.6% to 29.8%. Conversely, proportionately fewer vocational traininggraduates chose to pursue their studies, as only a little more than 10%have done so. In both cases, however, the proportion of people with adiploma who continue their studies has risen in recent years.
Holders of an ACS enjoy an employment rate of nearly 80% one year aftercompleting their training, while 8% of them pursued studies afterwards.Over 87% of employed ACS holders work full time and, in three quartersof these cases, their jobs are related to their training.
Although the unemployment rate of VTT graduates compares favourablywith that of Québec’s population as a whole, it is difficult to draw parallelsbetween these two groups. The overall labour force is very diversified,its structure differs from that of the graduate population, and findingsare derived from fundamentally different surveys. Nevertheless, some factsare worth highlighting. Recent Relance surveys show an unemployment
20 Vocational and Technical Training in Québec: Overview
64
67
70
73
76
79
82
20092008200720062005
Employment rates of graduates, by educational path(Québec as a whole, from 2005 to 2009)
Source: MELS, Enquêtes Relance. DRSI, 2009.
Attestation of Vocational Specialization (AVS) Diploma of College Studies (DCS))
Diploma of Vocational Studies (DVS) Attestation of College Studies (ACS)

21Vocational and Technical Training in Québec: Overview
0
5
10
15
20
25
20092008200720062005
Trends in graduates’ unemployment rates, by educational path(Québec as a whole, from 2005 to 2009)
Source: MELS, Enquêtes Relance. DRSI, 2009.
Attestation of Vocational Specialization (AVS)
Diploma of Vocational Studies (DVS)
Diploma of College Studies (DCS)
Attestation of College Studies (ACS)
Situation on March 31, 2009 of the graduates from the class of 2007-2008(Diploma of Vocational Studies–DVS)
Situation on March 31, 2009 of the graduates from the class of 2007-2008(Attestation of Vocational Specialization–AVS)
Situation on March 31, 2009 of the graduates from the class of 2007-2008 (Diploma of College Studies [DCS] in technical training)
Situation on March 31, 2009, of the graduates from the class of 2007-2008(Attestation of College Studies–ACS–in technical training)
Source: MELS. Enquêtes Relance 2009. DRSI. Graphique DGSOF, 2009.
4.5% 11.2%
Employed 73,5%
10.7%
8.9%64.6%
58.2%
55.6%
8.0% 14.8%
Employed 68.7%
8.4%
10.5%
2.5% 29.8%
Employed 64.8%
3.0%
9.2%
5.5%
67.9%
8.0%
Employed 77.8%
8.7%9.9%
Employed full-timeEmployed part-timeSeeking employmentPursuing studiesInactive
Employed full-timeEmployed part-timeSeeking employmentPursuing studiesInactive
Employed full-timeEmployed part-timeSeeking employmentPursuing studiesInactive
Employed full-timeEmployed part-timeSeeking employmentPursuing studiesInactive

rate of 12.8% for DVS graduates, 10.9% for AVS graduates, 4.4% for DCSgraduates and 10.1% for holders of an ACS. According to StatisticsCanada’s Labour Force Survey, for the same period, March 2009, theunemployment rate was 9.7% for Québec’s overall labour force, 16.4% forthe 15-24 age group, and 8.5% for the 25-44 age group
Employment rate differences, by program of study
Employment rates differ widely, depending on the choice of trainingprogram. As a general rule, programs with the highest employmentrates belong to f ive sectors: Health Services; Motorized EquipmentMaintenance; Transportation; Maintenance Mechanics; and Electro-technology. Conversely, programs with the lowest employment ratesbelong to these four sectors: Forestry and Pulp and Paper; Land UsePlanning and the Environment; Fashion, Leather and Text i les;Woodworking and Furniture Making. In 2009, half of all VTT programshad employment rates of over 70%. More specif ical ly, 8% of the programs had employment rates of 90% and over; 18% had rates of80% to 90% exclusive, and 23% had rates of 70% to 80% exclusive.
22 Vocational and Technical Training in Québec: Overview
Age 25and over
Ages20-24
Under 20 years old
1 Proportion of those working 30 or more hours per week.2 Weekly income of those in full-time paid employment.3 Percentage of those in full-time employment related to their training.
Source: MELS, Enquêtes Relance. DRSI, 2009.
Situation on March 31, 2009 of vocational and technical training graduates with a Diploma of Vocational Studies (DVS), an Attestation of Vocational Specialization (AVS), a Diploma of College Studies (DCS) or an Attestation of College Studies (ACS), by age group (Québec as a whole, graduating class of 2007-2008)
Graduates surveyed 5 519 10 586 15 592
Employed (%) 69.8 74.2 74.5
Seeking employment (%) 8.1 9.2 12.9
Pursuing studies (%) 18.8 12.9 6.9
Unemployment rate (%) 3.2 3.7 5.6
Taux de chômage (%) 10.4 11.0 14.7
Full-time (%)1 89.3 91.0 85.2
Average gross weekly salary (CAN$) 2 596 619 663
Related to the training (%)3 78.3 79.1 81.9
DVS

Employment rate differences, by age and gender
Age-group analysis of the job placements of vocational training gradu-ates (DVS and AVS) reveals that those aged 20 to 24 had the highestemployment rates. At the college level (DCS and ACS), there are propor-tionately more employed graduates among those aged 25 and over.Nevertheless, any analysis of the employment status of college graduateshaving obtained a DCS must take into account the sizeable proportion ofstudents who continue their studies after graduation, especially thoseunder the age of 25. This aspect means we must exercise caution wheninterpreting college-graduate employment statistics by age group. Thesame holds true for employment statistics by gender. Though women havehigher employment rates than men (67.8% compared with 59.5%), theyare less likely to pursue their studies once they have obtained a DCS(26.8% compared with 34.9%).
Employer satisfaction
The MELS has carried out several surveys among employers who hire VTTgraduates. More than 9 employers out of 10 consider their vocational trai-ning recruits to be competent. This figure is slightly higher among employerswho hire technical training graduates (96% compared with 89%). Recentsurveys also show that 93% of employers who hired DVS or AVS graduatesand 94% of those who hired DCS graduates were satisfied with their newemployees’ performance after one year of work.
23Vocational and Technical Training in Québec: Overview
414 1 218 4 195 911 10 790 3 978 189 2 085 8 317
50.9 78.3 68.0 46.7 61.1 81.0 59.8 75.6 78.7
6.5 6.7 9.1 2.0 2.9 3.7 3.7 6.9 9.2
41.2 11.6 12.7 49.9 34.2 11.0 34.6 13.9 6.1
1.4 3.4 10.3 1.4 1.9 4.4 1.9 3.6 6.0
11.3 7.9 11.8 4.1 4.5 4.3 5.9 8.4 10.5
83.0 90.0 83.0 86.7 85.8 85.7 84.4 86.9 87.4
554 602 723 613 640 708 598 606 694
65.8 76.0 65.6 83.6 83.5 88.6 61.1 71.0 77.0
Under 20 years old
Age 25and over
Under 20 years old
Age 25and over
Ages20-24
Under 20 years old
Age 25and over
Ages20-24
Ages20-24
AVS DCS ACS

5 Labour Market Outlookand Demographic Trends
Over the past few years, Québec has experienced significant job growth.Between 2000 and 2008, nearly 480 000 jobs were created, an increase ofmore than 14%. However, this growth in employment slowed in early 2009and the results for the year indicated a loss of 37 500 jobs compared to theprevious year (a drop of 1%).
Emploi-Québec estimates that the Québec economy will create 152 000jobs between 2009 and 2013. During the same period, retiring workerswill create additional openings. As jobs requiring technical and interme-diate skill levels increase in importance, labour market demand will conti-nue to exert considerable pressure on the VTT system.
To ensure the best possible match between labour needs and the profileof VTT graduates, the MELS and Emploi-Québec together have develo-ped an employment-training correlation model. This model uses labourmarket forecasts to determine how many people need to be trained in eachprogram.
The model reveals that 80% of the VTT programs are well balanced, thatis, enrollments in these programs should be sufficient to meet labourdemand. Still, in 10% of the programs, there is a substantial increaseddemand for enrollments, whereas in fewer than 5% of the programs thenumber of enrollments exceeds demand.
Promotional campaigns
Several advertising campaigns have been orchestrated to promote train-ing programs offering the best job prospects and hiring opportunities.These campaigns are designed both to inform the general public—youngpeople in particular—about these programs and to increase enrollmentsin programs where the supply does not meet demand.
Important demographic changes
For a number of years, a decline in total enrollments has been observedin both elementary and secondary education. However, this trend willsee a reversal within the next few years. This means that the numberof full-time students in the French, English and Aboriginal school boardsshould be on the rise by 2013-2014. This rise will be especially evidentin the administrat ive regions of Lanaudière, Laval, Outaouais and the Capitale Nationale, and wil l have a more moderate impact in theregions of Côte Nord, Bas-Saint-Laurent, Saguenay–Lac-Saint-Jeanand Abitibi Témiscamingue. It wil l even be negative in the regions ofNord-du-Québec and Gaspésie–Îles-de-la-Madeleine.
In technical training, it wil l be several years before the effects of thisrise in enrollments is felt. Enrollments will thus continue to decline, inall regions of Québec.
24 Vocational and Technical Training in Québec: Overview

25Vocational and Technical Training in Québec: Overview
The 50 vocational (DVS, AVS) and technical (DCS) training programs offering the best job prospects(Québec as a whole, 2009 (Not all programs are offered in English.)
Assistance in Health Care Facilities
Automobile Mechanics
Biomedical Laboratory Technology
Cable and Circuit Assembly
Chemical Engineering Techniques
Composites Processing
Computer Science Techniques
Construction Machine Mechanics
Dairy Production
Diemaking
Diesel (Injection and Electronic Controls)
Early Childhood Education
Farm Management and Technology
Fixed Machinery Mechanics
Gestion d'un établissement de restauration (in French only)
Home Care Assistance
Industrial Controls Maintenance Mechanics
Industrial Construction and Maintenance Mechanics
Industrial Drafting
Industrial Electronics Technology
Industrial Engineering Technology
Industrial Maintenance Technology
Insurance and Financial Services Consulting
Machining Techniques
Mechanical Engineering Technology
Medical Electrophysiology Techniques
Metal Structure Assembly
Metallurgical Process Engineering
Laboratory Technology
Moulding Machine Set-up and Operation
Nuclear Medicine Technology
Numerical Control Machine Tool Operation
Nursing
Ore Extraction
Pharmaceutical Production Technology
Precision Sheet Metal Work
Pre-Hospital Emergency Care
Production Equipment Operation
Professional Sales
Radiodiagnosis Technology
Respiratory Therapy Techniques
Retail Butchery
Secretarial Studies-Medical
Special Care Counselling
Techniques d'avionique (in French only)
Technologie des procédés et de la qualité des aliments (in French only)
Technologie minérale (in French only)
Toolmaking
Transportation Logistics
Welding and Fitting
Source: MELS, The Top 50, DGSOF, 2009.

6 Challenges and Developments
The VTT system contributes directly to Québec’s social and economicdevelopment, given its two specific aims, which are to provide studentswith the competencies that will help guarantee their personal and profes-sional autonomy, and to fulfill labour market needs for qualified workers.The challenges are many, and they must be reviewed at regular intervals sothat we can react appropriately both to labour market developments andthe demographic trends that raise important questions about training program accessibility and regional development support.
Both modern technologies and the Québec economy are evolving at arapid pace. As an industrial leader, Québec must continue to invest inwork force qualifications, especially in the high-tech and health and socialservices sectors where labour demand is high. To ensure that the VTTsystem keeps pace with Québec’s economic trends and developments,we must maintain and consolidate the ties we have developed with thedifferent stakeholders and partners in the labour market. This approachis essential in the case of emerging (or developing) sectors and niches ofexcellence in the various regions. Consequently, the competencies rela-ted to industries like multimedia, video games, mining, transportationequipment, value-added manufacturing, etc. will be increasingly soughtafter in the Québec labour market, and their presence wil l guarantee economic prosperity.
Vocational and technical training must be geared to helping job seekersfind long-lasting employment with relative ease. In that respect, the labouroutlook appears promising. Yet the current demographic downturn com-pels us to keep improving the performance of our training system as awhole and to make optimum use of our resources throughout Québec.This situation draws attention to three interesting facts. First, one third ofour students leave school each year without any specific job qualifica-tions. Second, some programs, especially in technical training, havelow graduation rates. Third, some training programs do not attract enoughstudents despite the excellent job prospects they offer. One of our chal-lenges, therefore, is to ensure a better match between training and labourneeds, while encouraging more young people to enroll in vocational trai-ning programs or to stay in school until they obtain a technical trainingdiploma.
Rapidly developing technologies require major investments in order tomaintain future workers’ qualification levels and to help businesses remaincompetitive. Increasingly, access to these technologies can be gainedonly through school and business partnerships, both in initial vocationaland technical training and in continuing education.
26 Vocational and Technical Training in Québec: Overview

27Vocational and Technical Training in Québec: Overview

Appendix
28 Vocational and Technical Training in Québec: Overview
Secondary school, private and public sectors (DVS, AVS)
Public and private colleges (DCS, ACS)
2006 2007
2005 2006
2007 2008
2008 2009
20062007
20052006
2007 2008
2008 2009
Number of institutions 1 58 58 58 58 53 53 53 51
Number of work-studyprojects in progress 2 259 275 274 293 298 299 283 276
Number of differentprograms 3 74 79 78 86 99 99 97 95
Number of students enrolled in work-studyprograms 4 8 407 8 948 10 789 11 662 3 813 3 929 4 281 3 905
Number of programscurrently being adapted tothe work-study approach5 53 40 49 50 17 15 1 25
Investments(in millions of dollars) 34 182 4 226 3 003 3 608 3 186 3 602 3 588 3 844
Trends in enrollments, projects and investments in work-study programs (Québec as a whole, from 2005-2006 to 2008-2009)
1 Institutions that offered at least one work-study program (with at least one student registered) during the year in question, as indicated in DFCS records at the MELS.
2 Programs with a work-study approach offered by an institution and in which there is at least one registration during the year in question.
3 Programs with a work-study approach offered at least once during the year in question.4 Students taking a program with a work-study approach and who are accordingly registered in the declaration
of enrollments database.5 Programs that are in the process of being adapted to the work-study approach.
Source: MELS, Direction de la formation continue et du soutien (DFCS), May 2010.
29Vocational and Technical Training in Québec: Overview
Underage 202 24 462 24 217 23 986 23 221 23 822 24 536 24 715 26 011 27 090 27 476
Male 14 783 14 991 14 862 14 657 15 115 15 555 15 844 16 520 17 367 17 487
Female 9 679 9 226 9 124 8 564 8 707 8 981 8 871 9 491 9 723 9 989
Age 20and over 61 207 56 614 59 140 57 008 60 654 65 696 67 700 66 150 67 352 70 068
Male 37 771 33 525 34 942 31 641 33 337 36 555 37 184 35 238 35 777 36 657
Female 23 436 23 089 24 198 25 367 27 317 29 141 30 516 30 912 31 575 33 411
Total 85 669 80 831 83 126 80 229 84 476 90 232 92 415 92 161 94 442 97 544
Male 52 554 48 516 49 804 46 298 48 452 52 110 53 028 51 758 53 144 54 144
Female 33 115 32 315 33 322 33 931 36 024 38 122 39 387 40 403 41 298 43 400
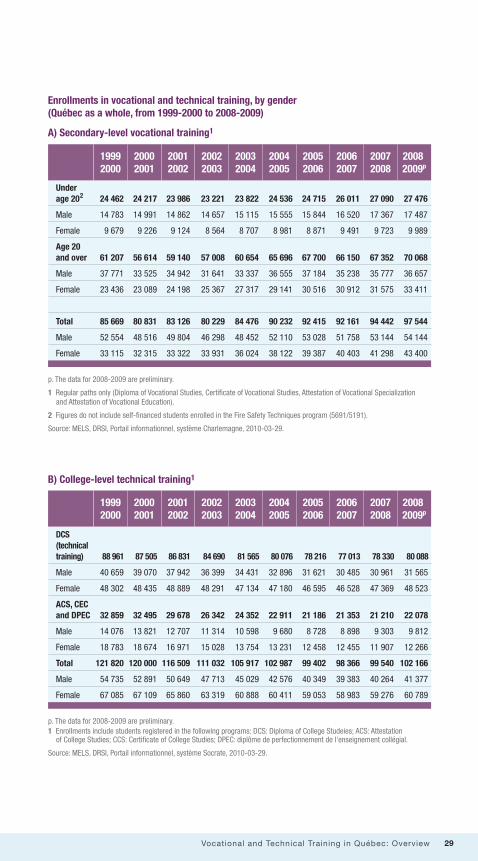
Enrollments in vocational and technical training, by gender (Québec as a whole, from 1999-2000 to 2008-2009)
p. The data for 2008-2009 are preliminary.
1 Regular paths only (Diploma of Vocational Studies, Certificate of Vocational Studies, Attestation of Vocational Specialization and Attestation of Vocational Education).
2 Figures do not include self-financed students enrolled in the Fire Safety Techniques program (5691/5191).
Source: MELS, DRSI, Portail informationnel, système Charlemagne, 2010-03-29.
A) Secondary-level vocational training1
DCS(technical training) 88 961 87 505 86 831 84 690 81 565 80 076 78 216 77 013 78 330 80 088
Male 40 659 39 070 37 942 36 399 34 431 32 896 31 621 30 485 30 961 31 565
Female 48 302 48 435 48 889 48 291 47 134 47 180 46 595 46 528 47 369 48 523
ACS, CECand DPEC 32 859 32 495 29 678 26 342 24 352 22 911 21 186 21 353 21 210 22 078
Male 14 076 13 821 12 707 11 314 10 598 9 680 8 728 8 898 9 303 9 812
Female 18 783 18 674 16 971 15 028 13 754 13 231 12 458 12 455 11 907 12 266
Total 121 820 120 000 116 509 111 032 105 917 102 987 99 402 98 366 99 540 102 166
Male 54 735 52 891 50 649 47 713 45 029 42 576 40 349 39 383 40 264 41 377
Female 67 085 67 109 65 860 63 319 60 888 60 411 59 053 58 983 59 276 60 789
p. The data for 2008-2009 are preliminary.1 Enrollments include students registered in the following programs: DCS: Diploma of College Studeies; ACS: Attestation
of College Studies; CCS: Certificate of College Studies; DPEC: diplôme de perfectionnement de l'enseignement collégial.
Source: MELS, DRSI, Portail informationnel, système Socrate, 2010-03-29.
B) College-level technical training1
2000 2001
1999 2000
2001 2002
20022003
2003 2004
20042005
2005 2006
2006 2007
2007 2008
2008 2009p
2000 2001
1999 2000
2001 2002
20022003
2003 2004
20042005
2005 2006
2006 2007
2007 2008
2008 2009p

30 Vocational and Technical Training in Québec: Overview
2000-20011999-2000
01 Bas-Saint-Laurent 2 592 2 652 2 631
02 Saguenay–Lac-Saint-Jean 5 365 4 846 4 951
03 Capitale-Nationale 8 660 8 950 9 790
04 Mauricie 2 741 2 795 3 033
05 Estrie 3 221 3 088 3 110
06 Montréal 19 269 20 065 20 816
07 Outaouais 2 664 2 484 2 513
08 Abitibi-Témiscamingue 1 824 1 693 1 745
09 Côte-Nord 1 048 858 858
10 Nord-du-Québec 288 306 370
11 Gaspésie–Îles-de-la-Madeleine 825 831 825
12 Chaudière-Appalaches 4 051 3 992 4 132
13 Laval 15 278 10 611 9 271
14 Lanaudière 1 788 1 815 2 006
15 Laurentides 4 013 3 956 5 088
16 Montérégie 9 860 9 634 9 859
17 Centre-du-Québec 2 182 2 255 2 128
All of Québec 85 669 80 831 83 126
Enrollments in secondary-level vocational training,1 by administrative region, from 1999-2000 to 2008-2009 (Québec as a whole)
2001-2002
2000-20011999-2000 2001-2002
01 Bas-Saint-Laurent 6 208 5 956 5 557
02 Saguenay–Lac-Saint-Jean 7 187 6 901 6 932
03 Capitale-Nationale 14 935 14 984 14 491
04 Mauricie 5 332 5 163 4 986
05 Estrie 5 076 5 083 4 979
06 Montréal 43 398 43 702 42 020
07 Outaouais 2 997 2 923 2 846
08 Abitibi-Témiscamingue 1 845 1 644 1 678
09 Côte-Nord 1 020 1 173 1 096
10 Nord-du-Québec 78 112 51
11 Gaspésie–Îles-de-la-Madeleine 1 033 933 871
12 Chaudière-Appalaches 4 633 4 180 3 941
13 Laval 4 300 4 013 3 865
14 Lanaudière 2 270 2 264 2 285
15 Laurentides 4 876 4 926 4 816
16 Montérégie 13 766 13 364 13 575
17 Centre-du-Québec 2 866 2 677 2 513
All of Québec 121 820 120 000 116 509
Enrollments1 in college-level technical training, by administrative region,from 1999-2000 to 2008-2009 (Québec as a whole)
p. The data for 2008-2009 are preliminary.
1 Regular paths only (Diploma of Vocational Studies, Certificate of Vocational Studies, Attestation of Vocational Specialization and Attestation of Vocational Education).
Source: MELS, DRSI, Portail informationnel, système Charlemagne, 2010-03-29.
p. The data for 2008-2009 are preliminary.
1 Figures include students enrolled in the following programs: DCS: Diploma of College Studies; ACS: Attestation of College Studies; CEC: certificat d’études collégiales (certificate of college studies); and DPEC: diplôme de perfectionnement de l’enseignement collégial (diploma of advanced college studies).
Source: MELS, DRSI, Portail informationnel, système Socrate, 2010-03-29.
2000-20011999-2000 2001-2002
31Vocational and Technical Training in Québec: Overview
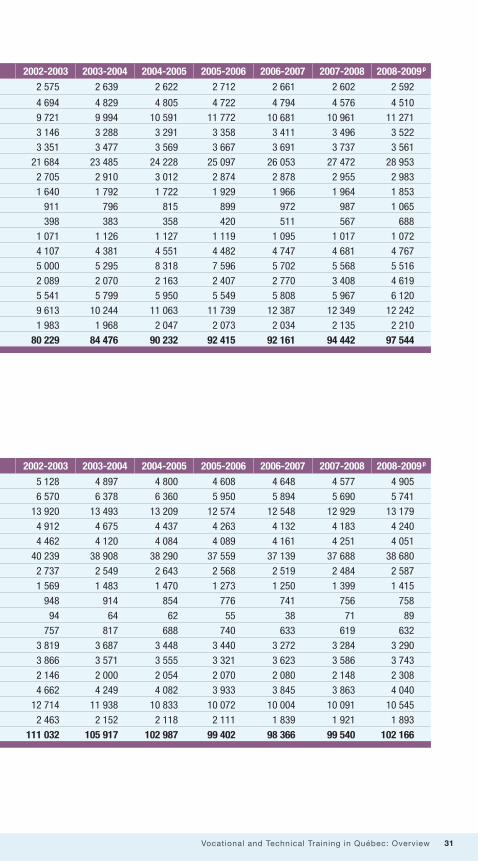
2 575 2 639 2 622 2 712 2 661 2 602 2 592
4 694 4 829 4 805 4 722 4 794 4 576 4 510
9 721 9 994 10 591 11 772 10 681 10 961 11 271
3 146 3 288 3 291 3 358 3 411 3 496 3 522
3 351 3 477 3 569 3 667 3 691 3 737 3 561
21 684 23 485 24 228 25 097 26 053 27 472 28 953
2 705 2 910 3 012 2 874 2 878 2 955 2 983
1 640 1 792 1 722 1 929 1 966 1 964 1 853
911 796 815 899 972 987 1 065
398 383 358 420 511 567 688
1 071 1 126 1 127 1 119 1 095 1 017 1 072
4 107 4 381 4 551 4 482 4 747 4 681 4 767
5 000 5 295 8 318 7 596 5 702 5 568 5 516
2 089 2 070 2 163 2 407 2 770 3 408 4 619
5 541 5 799 5 950 5 549 5 808 5 967 6 120
9 613 10 244 11 063 11 739 12 387 12 349 12 242
1 983 1 968 2 047 2 073 2 034 2 135 2 210
80 229 84 476 90 232 92 415 92 161 94 442 97 544
2007-2008 2008-2009 p2006-20072005-20062004-20052003-20042002-2003
2007-2008 2008-2009 p2006-20072005-20062004-20052003-20042002-2003
5 128 4 897 4 800 4 608 4 648 4 577 4 905
6 570 6 378 6 360 5 950 5 894 5 690 5 741
13 920 13 493 13 209 12 574 12 548 12 929 13 179
4 912 4 675 4 437 4 263 4 132 4 183 4 240
4 462 4 120 4 084 4 089 4 161 4 251 4 051
40 239 38 908 38 290 37 559 37 139 37 688 38 680
2 737 2 549 2 643 2 568 2 519 2 484 2 587
1 569 1 483 1 470 1 273 1 250 1 399 1 415
948 914 854 776 741 756 758
94 64 62 55 38 71 89
757 817 688 740 633 619 632
3 819 3 687 3 448 3 440 3 272 3 284 3 290
3 866 3 571 3 555 3 321 3 623 3 586 3 743
2 146 2 000 2 054 2 070 2 080 2 148 2 308
4 662 4 249 4 082 3 933 3 845 3 863 4 040
12 714 11 938 10 833 10 072 10 004 10 091 10 545
2 463 2 152 2 118 2 111 1 839 1 921 1 893
111 032 105 917 102 987 99 402 98 366 99 540 102 166
2007-2008 2008-2009 p2006-20072005-20062004-20052003-20042002-2003

32 Vocational and Technical Training in Québec: Overview
p. The data for 2008-2009 are preliminary. Source : MELS, DRSI, Portail informationnel, système Socrate, 2010-03-29.
DCS (technical training)
01 Bas-Saint-Laurent 5 118 4 879 4 589
02 Saguenay–Lac-Saint-Jean 6 106 5 904 5 857
03 Capitale-Nationale 11 080 11 327 11 384
04 Mauricie 4 550 4 383 4 255
05 Estrie 3 622 3 552 3 529
06 Montréal 29 359 29 501 29 564
07 Outaouais 2 043 2 070 2 126
08 Abitibi-Témiscamingue 1 533 1 308 1 310
09 Côte-Nord 877 843 743
10 Nord-du-Québec 44 57 34
11 Gaspésie–Îles-de-la-Madeleine 756 684 679
12 Chaudière-Appalaches 3 955 3 620 3 470
13 Laval 2 749 2 679 2 657
14 Lanaudière 1 480 1 537 1 561
15 Laurentides 3 489 3 494 3 615
16 Montérégie 10 165 9 938 9 810
17 Centre-du-Québec 2 035 1 727 1 641
All of Québec 88 961 87 505 86 831
Enrollments in college-level technical training, by administrative region,from 1999-2000 to 2008-2009 (Québec as a whole)
ACS, CCS and DPEC
01 Bas-Saint-Laurent 1 090 1 077 968
02 Saguenay–Lac-Saint-Jean 1 081 997 1 075
03 Capitale-Nationale 3 855 3 657 3 107
04 Mauricie 782 780 731
05 Estrie 1 454 1 531 1 450
06 Montréal 14 039 14 201 12 456
07 Outaouais 954 853 720
08 Abitibi-Témiscamingue 312 336 368
09 Côte-Nord 143 330 353
10 Nord-du-Québec 34 55 17
11 Gaspésie–Îles-de-la-Madeleine 277 249 192
12 Chaudière-Appalaches 678 560 471
13 Laval 1 551 1 334 1 208
14 Lanaudière 790 727 724
15 Laurentides 1 387 1 432 1 201
16 Montérégie 3 601 3 426 3 765
17 Centre-du-Québec 831 950 872
All of Québec 32 859 32 495 29 678
2000-20011999-2000 2001-2002
2000-20011999-2000 2001-2002

33Vocational and Technical Training in Québec: Overview
4 464 4 254 4 145 3 981 3 954 3 939 4 044
5 608 5 556 5 446 5 138 5 064 4 905 4 909
11 396 11 024 10 823 10 539 10 484 10 852 10 983
4 199 4 034 3 842 3 795 3 622 3 717 3 786
3 411 3 360 3 340 3 422 3 424 3 424 3 366
28 965 28 008 27 514 27 054 26 501 27 030 27 451
2 114 2 081 2 199 2 099 2 032 2 086 2 074
1 316 1 328 1 254 1 143 1 117 1 281 1 361
712 681 666 619 596 574 607
29 39 40 28 24 36 39
600 558 575 588 525 483 515
3 435 3 313 3 136 3 033 2 785 2 809 2 837
2 615 2 471 2 583 2 625 2 746 2 769 2 931
1 588 1 553 1 614 1 623 1 590 1 677 1 824
3 468 3 255 3 147 3 056 3 023 3 127 3 325
9 262 8 757 8 486 8 124 8 090 8 180 8 622
1 482 1 271 1 266 1 349 1 436 1 441 1 414
84 690 81 565 80 076 78 216 77 013 78 330 80 088
664 643 655 627 694 638 861
962 822 914 812 830 785 832
2 524 2 469 2 386 2 035 2 064 2 077 2 196
713 641 595 468 510 466 454
1 051 760 744 667 737 827 685
11 274 10 900 10 776 10 505 10 638 10 658 11 229
623 468 444 469 487 398 513
253 155 216 130 133 118 54
236 233 188 157 145 182 151
65 25 22 27 14 35 50
157 259 113 152 108 136 117
384 374 312 407 487 475 453
1 251 1 100 972 696 877 817 812
558 447 440 447 490 471 484
1 194 994 935 877 822 736 715
3 452 3 181 2 347 1 948 1 914 1 911 1 923
981 881 852 762 403 480 479
26 342 24 352 22 911 21 186 21 353 21 210 22 078
2007-2008 2008-2009 p2006-20072005-20062004-20052003-20042002-2003
2007-2008 2008-2009 p2006-20072005-20062004-20052003-20042002-2003
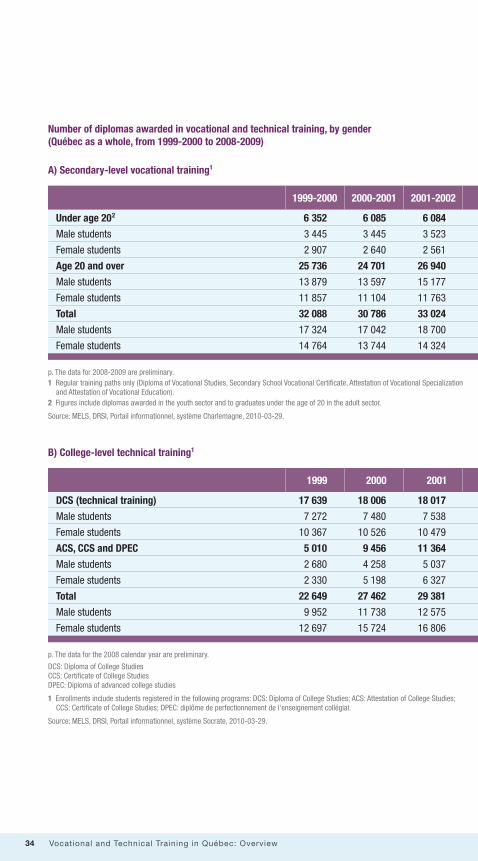
34 Vocational and Technical Training in Québec: Overview
2000-20011999-2000
p. The data for 2008-2009 are preliminary.1 Regular training paths only (Diploma of Vocational Studies, Secondary School Vocational Certificate, Attestation of Vocational Specialization
and Attestation of Vocational Education). 2 Figures include diplomas awarded in the youth sector and to graduates under the age of 20 in the adult sector.
Source: MELS, DRSI, Portail informationnel, système Charlemagne, 2010-03-29.
p. The data for the 2008 calendar year are preliminary.
DCS: Diploma of College StudiesCCS: Certificate of College StudiesDPEC: Diploma of advanced college studies
1 Enrollments include students registered in the following programs: DCS: Diploma of College Studies; ACS: Attestation of College Studies; CCS: Certificate of College Studies; DPEC: diplôme de perfectionnement de l'enseignement collégial.
Source: MELS, DRSI, Portail informationnel, système Socrate, 2010-03-29.
B) College-level technical training1
A) Secondary-level vocational training1
2001-2002
20001999 2001
Number of diplomas awarded in vocational and technical training, by gender(Québec as a whole, from 1999-2000 to 2008-2009)
Under age 202 6 352 6 085 6 084
Male students 3 445 3 445 3 523
Female students 2 907 2 640 2 561
Age 20 and over 25 736 24 701 26 940
Male students 13 879 13 597 15 177
Female students 11 857 11 104 11 763
Total 32 088 30 786 33 024
Male students 17 324 17 042 18 700
Female students 14 764 13 744 14 324
DCS (technical training) 17 639 18 006 18 017
Male students 7 272 7 480 7 538
Female students 10 367 10 526 10 479
ACS, CCS and DPEC 5 010 9 456 11 364
Male students 2 680 4 258 5 037
Female students 2 330 5 198 6 327
Total 22 649 27 462 29 381
Male students 9 952 11 738 12 575
Female students 12 697 15 724 16 806

35Vocational and Technical Training in Québec: Overview
2007-2008 2008-2009 p2006-20072005-20062004-20052003-20042002-2003
2007 2008 p20062005200420032002
6 179 6 154 6 265 6 480 6 879 6 944 6 552
3 703 3 701 3 821 4 044 4 368 4 435 4 231
2 476 2 453 2 444 2 436 2 511 2 509 2 321
27 723 29 250 30 770 32 405 32 935 33 109 34 442
15 441 16 360 16 627 17 336 17 841 18 074 18 922
12 282 12 890 14 143 15 069 15 094 15 035 15 520
33 902 35 404 37 035 38 885 39 814 40 053 40 994
19 144 20 061 20 448 21 380 22 209 22 509 23 153
14 758 15 343 16 587 17 505 17 605 17 544 17 841
18 772 18 205 18 111 17 469 17 078 16 606 15 876
7 511 7 097 7 052 6 626 6 347 6 089 5 746
11 261 11 108 11 059 10 843 10 731 10 517 10 130
11 893 12 103 11 959 12 280 11 522 11 636 11 163
5 345 5 458 5 687 5 792 5 297 5 686 5 285
6 548 6 645 6 272 6 488 6 225 5 950 5 878
30 665 30 308 30 070 29 749 28 600 28 242 27 039
12 856 12 555 12 739 12 418 11 644 11 775 11 031
17 809 17 753 17 331 17 331 16 956 16 467 16 008

36 Vocational and Technical Training in Québec: Overview
01 Bas-Saint-Laurent 1 243 1 223 1 241
02 Saguenay–Lac-Saint-Jean 2 342 2 186 2 394
03 Capitale-Nationale 4 113 3 951 4 315
04 Mauricie 1 275 1 310 1 310
05 Estrie 1 557 1 408 1 363
06 Montréal 7 588 6 948 8 399
07 Outaouais 1 033 905 967
08 Abitibi-Témiscamingue 776 759 780
09 Côte-Nord 509 412 321
10 Nord-du-Québec 87 102 103
11 Gaspésie–Îles-de-la-Madeleine 381 456 411
12 Chaudière-Appalaches 1 787 1 592 1 906
13 Laval 1 801 1 759 1 753
14 Lanaudière 699 710 824
15 Laurentides 1 881 1 711 1 947
16 Montérégie 3 854 3 837 4 022
17 Centre-du-Québec 945 992 950
Indeterminate value 217 525 18
All of Québec 32 088 30 786 33 024
Number of diplomas awarded in secondary-level vocational training, by administrative region, from 1999-2000 to 2008-2009 (Québec as a whole)
DEC (formation technique)01 Bas-Saint-Laurent 1 025 1 039 1 117
02 Saguenay–Lac-Saint-Jean 1 478 1 435 1 420
03 Capitale-Nationale 2 505 2 487 2 507
04 Mauricie 1 071 1 105 1 019
05 Estrie 785 797 772
06 Montréal 5 186 5 297 5 468
07 Outaouais 380 415 388
08 Abitibi-Témiscamingue 328 281 297
09 Côte-Nord 184 175 155
10 Nord-du-Québec 0 0 0
11 Gaspésie–Îles-de-la-Madeleine 168 172 150
12 Chaudière-Appalaches 844 902 855
13 Laval 554 512 556
14 Lanaudière 275 286 284
15 Laurentides 646 677 675
16 Montérégie 1 865 2 067 2 020
17 Centre-du-Québec 343 359 334
Indeterminate value 2 0 0
All of Québec 17 639 18 006 18 017
Number of diplomas awarded in college-level technical training, by administrative region(Québec as a whole, from 1999 to 2008)
2000-20011999-2000 2001-2002
20001999 2001
p. The data for 2008 are preliminary.
p. The data for 2008-2009 are preliminary.

37Vocational and Technical Training in Québec: Overview
1 171 1 228 1 165 1 371 1 224 1 211 1 113
2 277 2 183 2 352 2 254 2 194 2 053 2 037
4 336 4 403 4 725 5 215 5 252 5 153 5 732
1 470 1 460 1 406 1 538 1 567 1 451 1 372
1 496 1 554 1 513 1 608 1 650 1 613 1 504
8 870 9 612 10 149 10 455 10 728 10 983 11 444
1 112 1 215 1 209 1 263 1 227 1 209 1 270
666 726 788 770 909 895 811
343 378 338 422 403 399 425
94 179 78 122 165 190 334
434 502 447 498 456 385 393
1 910 1 993 2 186 2 122 2 202 2 265 2 143
1 919 1 943 2 167 2 284 2 389 2 237 2 200
787 803 842 874 1 150 1 381 2 193
2 202 2 314 2 339 2 460 2 522 2 660 2 617
3 889 4 109 4 423 4 666 4 915 4 994 4 418
919 801 896 962 861 972 988
7 1 12 1 - 2 -
33 902 35 404 37 035 38 885 39 814 40 053 40 994
Source: MELS, DRSI, Portail informationnel, système Socrate, 2010-03-29.
1 111 1 027 1 053 963 935 916 903
1 498 1 383 1 403 1 314 1 320 1 230 1 139
2 685 2 701 2 716 2 569 2 489 2 394 2 344
1 045 944 980 925 941 874 857
843 775 779 771 771 733 759
5 752 5 573 5 501 5 468 5 284 5 199 4 974
386 373 370 434 416 393 390
294 259 289 282 262 234 237
182 169 132 175 157 146 121
0 0 0 0 0 0 0
160 122 151 97 116 130 109
774 821 797 761 751 646 575
599 603 575 569 646 647 622
283 313 336 299 328 312 317
703 757 749 710 657 628 581
2 118 2 038 1 974 1 870 1 732 1 805 1 632
339 347 306 261 273 319 316
0 0 0 1 0 0 0
18 772 18 205 18 111 17 469 17 078 16 606 15 876
2007-2008 2008-2009 p2006-20072005-20062004-20052003-20042002-2003
2006 2007 2008 p2005200420032002
Source: MELS, DRSI, Portail informationnel, système Charlemagne, 2010-03-29.

38 Vocational and Technical Training in Québec: Overview
Administration M 1 458 1 312 1 786 F 5 425 4 628 4 544 Agriculture and Fisheries M 450 454 539 F 598 527 587 Arts M 43 42 30 F 373 286 359 Beauty Care M 42 30 22 F 2 514 2 237 2 314 Buildings and Public Works M 2 176 2 323 2 454 F 253 252 297 Chemistry and Biology M 24 16 16 F 11 4 7 Communications and Documentation M 350 328 333 F 415 381 429 Electrotechnology M 2 410 2 154 2 165 F 130 112 122 Fashion, Leather and Textiles M 35 28 33 F 284 267 228 Food Services and Tourism M 1 235 1 122 1 099 F 1 924 1 659 1 534 Forestry and Pulp and Paper M 718 669 680 F 110 94 87 Health Services M 158 215 268 F 1 932 2 301 2 743 Land Use Planning and the Environment M 57 82 87 F 23 24 38 Maintenance Mechanics M 893 757 839 F 46 46 33 Mechanical Manufacturing M 2 185 2 150 2 618 F 263 322 341 Metallurgical Technology M 1 560 1 658 1 686 F 115 121 144 Mining and Site Operations M 287 313 368 F 12 8 16 Motorized Equipment Maintenance M 2 140 2 111 1 982 F 94 108 73 Social, Educational and Legal Services M 3 6 1 F 1 8 24 Transportation M 734 851 1 212 F 99 154 151 Woodworking and Furniture Making M 366 421 482 F 142 205 253 Total M 17 324 17 042 18 700 F 14 764 13 744 14 324 T 32 088 30 786 33 024
Number of diplomas awarded in secondary-level vocational training, by training sector and gender (Québec as a whole, from 1999-2000 to 2008-2009)
2001-20022000-20011999-2000
p. The data for 2008-2009 are preliminary.
Source : MELS, DRSI, Portail informationnel, système Charlemagne, 2010-03-29.

39Vocational and Technical Training in Québec: Overview
2 275 2 441 2 503 2 608 2 943 3 212 3 635 4 789 5 100 5 515 5 923 6 272 6 454 7 023
530 507 415 478 448 453 366534 516 530 447 417 405 390
51 47 49 72 65 66 34346 353 359 398 389 383 377
20 33 35 38 30 29 40 2 224 2 100 2 239 2 319 2 165 2 183 2 073 2 906 3 562 3 960 4 505 4 881 5 024 5 347
344 403 408 456 472 431 398 29 33 30 35 34 21 2814 18 14 16 16 11 7
381 336 292 240 238 169 161387 363 303 267 223 185 197
2 409 2 647 2 849 2 744 2 775 2 398 2 009109 120 125 120 98 81 53
29 9 18 16 16 14 10178 171 131 119 107 105 84
1 095 1 124 1 173 1 192 1 136 1 230 1 1341 398 1 334 1 342 1 441 1 475 1 448 1 349
605 662 764 606 517 321 29081 93 68 71 56 40 31
341 409 553 569 536 597 6473 248 3 723 4 531 4 816 4 893 4 988 5 019
105 67 79 71 82 77 11335 31 26 22 22 21 30
783 709 675 582 603 585 589 31 22 25 22 19 18 18
1 959 1 538 1 112 1 146 1 254 1 335 1 606308 226 174 190 213 164 273
1 602 1 401 1 251 1 376 1 398 1 467 1 402 112 99 85 102 98 82 86361 416 490 468 689 795 962
13 12 19 26 9 16 22 1 994 2 385 2 500 2 761 2 661 2 622 2 342
118 126 153 185 182 159 1552 - 3 2 3 5 -
22 26 43 44 60 26 -1 179 1 203 1 221 1 387 1 464 1 749 2 102
173 205 181 211 171 174 118 488 532 476 484 436 340 336 294 302 316 310 248 170 138
19 144 20 061 20 448 21 380 22 209 22 509 23 15314 758 15 343 16 587 17 505 17 605 17 544 17 841 33 902 35 404 37 035 38 885 39 814 40 053 40 994
2004-2005 2005-20062003-2004 2007-2008 2008-2009 p2006-20072002-2003

40 Vocational and Technical Training in Québec: Overview
Number of diplomas awarded in college-level technical training, by training sector and gender (Québec as a whole, from 1999 to 2008 [technical DCS])
20001999 2001
p. The data for 2008 are preliminary.
Source: MELS, DRSI, Portail informationnel, système Socrate, 2010-03-29.
Administration, Commerce M 2 271 2 592 2 543 and Computer Technology F 2 938 2 826 2 547 Agriculture and Fisheries M 175 218 186 F 356 316 376 Arts M 177 168 171 F 435 474 460 Building and Public Works M 544 413 423 F 208 202 160 Chemistry and Biology M 219 199 192 F 214 261 229 Communications and Documentation M 228 212 218 F 489 522 527 Electrotechnology M 1 272 1 375 1 386 F 101 87 103 Fashion, Leather and Textiles M 29 30 25 F 310 311 375 Food Services and Tourism M 132 129 109 F 530 599 521 Forestry and Pulp and Paper M 159 162 183 F 31 36 40 Health Services M 270 244 240 F 2 121 2 089 2 334 Land Use Planning and the Environment M 96 102 96 F 112 153 165 Maintenance Mechanics M 117 95 100 F 7 5 3 Mechanical Manufacturing M 644 671 734 F 86 107 88 Metallurgical Technology M 20 31 31 F 3 6 9 Mining and Site Operations M 43 36 39 F 9 18 8 Motorized Equipment Maintenance M 173 140 156 F 15 17 16 Social, Educational and Legal Services M 651 607 587 F 2 387 2 480 2 463 Transport M 36 44 98 F 10 7 41 Woodworking and Furniture Making M 16 12 21 F 5 10 14 Total M 7 272 7 480 7 538 F 10 367 10 526 10 479 T 17 639 18 006 18 017

41Vocational and Technical Training in Québec: Overview
2007 2008 p20062005200420032002
2 528 2 329 2 172 1 963 1 624 1 491 1 289 2 270 2 049 1 831 1 517 1 364 1 287 1 231
211 203 195 168 151 143 153 425 406 394 373 369 394 383190 170 173 174 192 199 203 571 486 646 558 552 564 579 447 463 496 592 652 753 723169 179 199 211 233 262 264150 127 117 104 126 107 119 208 148 126 134 126 143 107257 297 324 330 390 324 347 595 560 581 569 532 439 433
1 296 1 185 1 126 959 929 723 670 106 99 65 53 53 44 41
26 15 22 19 13 14 12454 421 422 375 386 310 329122 97 116 106 129 126 122 569 490 494 377 402 376 417183 153 140 94 100 69 84
43 31 30 17 19 11 14283 305 318 363 437 461 479
2 963 3 316 3 202 3 552 3 507 3 405 3 267122 87 97 96 102 99 66 141 162 117 140 138 113 90
99 101 98 100 80 67 74 7 9 3 1 1 3 0
634 624 608 557 465 450 417 99 78 48 56 23 32 2639 25 34 21 15 14 14
7 6 3 1 8 1 131 12 15 11 9 13 15 10 12 7 7 2 6 6
147 128 150 143 97 92 6617 14 13 14 6 13 9
623 667 738 738 711 834 801 2 521 2 597 2 824 2 837 2 976 3 078 2 896
97 90 95 78 110 83 8166 33 37 35 25 24 3026 19 18 10 15 27 1120 12 17 16 9 12 7
7 511 7 097 7 052 6 626 6 347 6 089 5 74611 261 11 108 11 059 10 843 10 731 10 517 10 13018 772 18 205 18 111 17 469 17 078 16 606 15 876

42 Vocational and Technical Training in Québec: Overview
EmployedGraduates surveyed
Survey year
(N) (%)
Status of vocational and technical training graduates on March 31 following their graduating year, by educational path (Québec as a whole, from 2007 to 2009)
Source: MELS. Enquêtes Relance. DRSI, 2009.
ATTESTATION OF VOCATIONAL SPECIALIZATION (AVS) 2009 3 154 65.2 Female graduates 2008 2 854 69.2 2007 2 786 72.6 2009 2 673 72.8 Male graduates 2008 2 459 77.3 2007 2 172 78.4 2009 5 827 68.7 Total 2008 5 313 73.0 2007 4 958 75.1 DIPLOMA OF VOCATIONAL STUDIES (DVS) 2009 13 326 76.1 Female graduates 2008 13 446 78.9 2007 13 413 79.3 2009 18 371 71.7 Male graduates 2008 18 088 77.0 2007 17 523 77.6 2009 31 697 73.5 Total 2008 31 534 77.8 2007 30 936 78.3 DIPLOMA OF COLLEGE STUDIES (DCS) 2009 10 036 67.8 Female graduates 2008 10 483 72.2 2007 10 261 72.6 2009 5 643 59.5 Male graduates 2008 6 054 61.5 2007 5 916 62.5 2009 15 679 64.8 Total 2008 16 537 68.2 2007 16 177 68.8 ATTESTATION OF COLLEGE STUDIES (ACS) 2009 5 511 78.6 Female graduates 2008 5 734 81.0 2007 6 076 81.6 2009 5 080 76.8 Male graduates 2008 5 031 80.0 2007 5 354 80.7 2009 10 591 77.8 Total 2008 10 765 80.6 2007 11 430 81.2

43Vocational and Technical Training in Québec: Overview
(%) (%) (%) (%) (%) ($) (%)
Related to the
training
Average gross weekly
salary
Full-time
Unemploy- ment rate
InactivePursuing studies
Seeking employment
Full-time employment and characteristics
8.8 15.9 10.1 11.9 77.7 570 65.1 8.0 13.2 9.6 10.4 79.8 538 66.1 7.9 11.1 8.4 9.8 78.2 529 67.9 7.9 13.7 5.6 9.8 92.1 740 71.2 7.0 10.9 4.8 8.3 93.2 711 70.2 6.0 10.7 5.0 7.1 92.4 682 74.4 8.4 14.8 8.0 10.9 84.7 666 68.3 7.6 12.1 7.3 9.4 86.5 633 68.3 7.1 10.9 6.9 8.6 84.7 605 71.1
7.6 10.2 6.1 9.1 79.7 530 81.3 6.7 8.4 6.0 7.8 80.9 515 81.4 6.9 8.4 5.4 8.0 79.3 490 79.0
12.9 11.9 3.5 15.3 94.0 696 79.6 9.4 10.4 3.1 10.9 94.4 669 78.2 9.5 9.8 3.2 10.9 94.3 647 79.0
10.7 11.2 4.5 12.8 87.9 635 80.3 8.3 9.6 4.3 9.6 88.6 611 79.5 8.4 9.2 4.1 9.7 87.8 587 79.0
2.4 26.8 3.0 3.4 83.6 635 87.6 1.9 23.2 2.6 2.6 83.5 612 87.4 1.8 23.4 2.2 2.4 83.1 588 86.4 4.1 34.9 1.5 6.4 90.1 702 80.2 3.7 32.9 1.9 5.6 90.9 681 82.8 4.0 31.7 1.9 6.0 91.6 651 81.4 3.0 29.8 2.5 4.4 85.8 659 85.0 2.6 26.8 2.3 3.6 86.0 636 85.8 2.6 26.5 2.1 3.7 86.0 611 84.6
6.9 7.5 7.1 8.0 83.6 611 77.6 5.3 7.3 6.4 6.1 83.0 595 79.2 6.1 5.8 6.6 6.9 82.8 571 78.0
10.8 8.6 3.7 12.3 91.6 744 73.7 8.1 8.3 3.6 9.2 90.9 728 72.4 8.4 8.1 2.8 9.4 91.2 693 70.0 8.7 8.0 5.5 10.1 87.3 674 75.7 6.6 7.7 5.1 7.6 86.6 657 75.9 7.1 6.8 4.8 8.1 86.6 627 74.2

44 Vocational and Technical Training in Québec: Overview
Response rate
Graduates surveyed
GenderTYPE OF DIPLOMA
Graduates under age 20 Male 3 612 68.1 Diploma of Vocational Studies (DVS) Female 1 907 63.2 Total 5 519 66.4 Male 184 69.6 Attestation of Vocational Specialization (AVS) Female 230 64.8 Total 414 66.9 Male 301 78.1 Diploma of College Studies (DCS) Female 610 77.7 Total 911 77.8 Male 101 60.4 Attestation of College Studies (ACS) Female 88 52.3 Total 189 56.6 Graduates aged 20 to 24 Male 6 553 61.3 Diploma of Vocational Studies (DVS) Female 4 033 56.0 Total 10 586 59.3 Male 655 61.1 Attestation of Vocational Specialization (AVS) Female 563 54.0 Total 1 218 57.8 Male 4 011 73.3 Diploma of College Studies (DCS) Female 6 779 70.5 Total 10 790 71.5 Male 1 024 55.6 Attestation of College Studies (ACS) Female 1 061 54.1 Total 2 085 54.8 Graduates aged 25 and over Male 8 206 57.7 Diploma of Vocational Studies (DVS) Female 7 386 59.8 Total 15 592 58.7 Male 1 834 53.8 Attestation of Vocational Specialization (AVS) Female 2 361 55.6 Total 4 195 54.8 Male 1 331 63.6 Diploma of College Studies (DCS) Female 2 647 65.2 Total 3 978 64.7 Male 3 955 57.0 Attestation of College Studies (ACS) Female 4 362 60.8 Total 8 317 59.0
Status of vocational and technical training graduates on March 31, 2009,by type of diploma, age group and gender (Québec as a whole)
(N) (%)
Source: MELS, Enquêtes Relance, DRSI, 2009.

45Vocational and Technical Training in Québec: Overview
68.2 9.6 19.0 3.2 12.4 94.0 4 653 79.2 73.2 5.0 18.5 3.3 6.4 80.3 5 450 76.4 69.8 8.1 18.8 3.2 10.4 89.3 4 596 78.3 54.7 8.6 35.9 0.8 13.6 91.4 3 613 65.6 47.7 4.7 45.6 2.0 9.0 74.6 3 475 66.0 50.9 6.5 41.2 1.4 11.3 83.0 3 554 65.8 41.7 3.8 53.6 0.9 8.4 95.9 5 661 81.9 49.2 1.1 48.1 1.7 2.1 82.8 5 590 84.5 46.7 2.0 49.9 1.4 4.1 86.7 5 613 83.6 60.7 1.6 36.1 1.6 2.6 83.8 5 680 48.4 58.7 6.5 32.6 2.2 10.0 85.2 5 490 78.3 59.8 3.7 34.6 1.9 5.9 84.4 5 598 61.1
73.2 11.1 13.1 2.6 13.2 94.9 5 674 79.7 76.0 5.8 12.6 5.6 7.1 84.4 5 507 78.0 74.2 9.2 12.9 3.7 11.0 91.0 5 619 79.1 78.5 7.3 12.0 2.3 8.5 94.3 3 669 81.4 78.0 5.9 11.2 4.9 7.1 84.4 5 501 68.0 78.3 6.7 11.6 3.4 7.9 90.0 4 602 76.0 55.1 3.7 39.6 1.5 6.4 89.4 6 689 78.8 64.7 2.3 30.8 2.2 3.4 83.9 5 613 86.1 61.1 2.9 34.2 1.9 4.5 85.8 5 640 83.5 74.3 8.6 14.6 2.5 10.4 90.1 6 662 71.4 76.8 5.2 13.2 4.7 6.4 83.9 6 549 70.5 75.6 6.9 13.9 3.6 8.4 86.9 6 606 71.0
72.4 16.2 7.1 4.3 18.3 93.1 6 739 79.7 76.9 9.3 6.8 7.1 10.8 77.2 5 566 84.5 74.5 12.9 6.9 5.6 14.7 85.2 6 663 81.9 72.8 8.1 11.4 7.6 10.0 91.2 8 811 67.1 64.3 9.9 13.6 12.3 13.3 76.1 7 621 64.2 68.0 9.1 12.7 10.3 11.8 83.0 7 723 65.6 79.8 5.2 13.3 1.7 6.1 91.1 6 741 83.1 81.5 2.9 9.8 5.7 3.4 83.1 5 692 91.5 81.0 3.7 11.0 4.4 4.3 85.7 5 708 88.6 77.9 11.6 6.4 4.1 12.9 92.1 8 770 74.7 79.3 7.2 5.8 7.7 8.4 83.5 6 629 79.1 78.7 9.2 6.1 6.0 10.5 87.4 7 694 77.0
Employed Seeking employ-
ment
Pursuing studies
Inactive Unemploy- ment rate
Full-time Duration of survey
Average gross weekly
salary
Related to the
training
Full-time employment and characteristics
(%) (%) (%) (%) (%) (%) (weeks) ($) (%)

46 Vocational and Technical Training in Québec: Overview
Observations
20082009
2009 2010
2006 2007
2007 2008
Source: MELS, Prévisions à long terme des effectifs de l’ensemble des commissions scolaires.DRSI, DGSOF calculations, 2010.
01 Bas-Saint-Laurent 25 802 24 991 24 145 23 311 22 895 22 444
02 Saguenay–Lac-Saint-Jean 36 956 35 605 34 232 33 172 32 281 31 921
03 Capitale-Nationale 77 718 76 112 74 377 72 838 71 938 71 413
04 Mauricie 31 151 30 121 29 018 28 246 27 498 26 907
05 Estrie 36 874 36 170 35 626 34 761 34 365 34 008
06 Montréal 170 017 167 350 166 325 167 201 168 153 169 257
07 Outaouais 44 178 43 205 42 173 41 294 40 811 40 486
08 Abitibi-Témiscamingue 20 762 19 957 19 144 18 597 18 069 17 790
09 Côte-Nord 11 505 11 127 10 712 10 526 10 296 10 158
10 Nord du Québec 2 156 2 102 2 033 1 957 1 885 1 833
11 Gaspésie–Îles-de-la-Madeleine 10 798 10 287 9 705 9 319 8 922 8 682
12 Chaudière-Appalaches 54 403 53 206 51 806 50 794 50 135 50 084
13 Laval 48 332 47 966 47 669 47 476 47 399 47 550
14 Lanaudière 63 847 62 654 61 212 59 681 58 365 57 493
15 Laurentides 77 708 76 876 75 225 73 977 72 823 71 987
16 Montérégie 183 047 179 928 176 605 173 274 170 596 169 077
17 Centre-du-Québec 31 764 31 191 30 478 29 836 29 416 29 221 Total French-language enrollments 928 714 910 149 891 428 877 597 867 164 861 625
English-language school boards 116 182 113 602 110 879 108 088 105 532 103 194 Aboriginal school boards 7 590 7 799 7 726 7 848 7 960 8 049
All of Québec 1 052 486 1 031 550 1 010 033 993 533 980 656 972 868
Observations and long-term forecasts for total full-time enrollments (public and private sectors), by administrative region for French-language students, and for Québec as a whole for English-language and Aboriginal school boardsObservations from 2006-2007 to 2009-2010 and forecasts from 2010-2011 to 2018-2019 (Base case, Québec as a whole)
2010 2011
2011 2012
French-language enrollments

47Vocational and Technical Training in Québec: Overview
Forecasts
22 318 22 166 22 267 22 434 22 676 22 813 23 004 -1.3%
31 478 31 454 31 523 31 780 32 060 32 349 32 485 -2.1%
71 624 72 379 73 817 75 321 77 042 78 777 80 375 10.3%
26 464 26 309 26 457 26 670 26 940 27 255 27 621 -2.2%
33 810 33 943 34 040 34 341 34 657 34 959 35 286 1.5%
171 288 173 979 176 663 179 859 182 946 185 830 188 467 12.7%
40 631 41 193 42 112 43 075 44 064 45 075 46 096 11.6%
17 557 17 601 17 541 17 731 17 827 18 015 18 147 -2.4%
10 117 10 057 10 062 10 029 10 085 10 105 10 148 -3.6%
1 796 1 761 1 728 1 705 1 681 1 664 1 622 -17.1%
8 453 8 334 8 276 8 261 8 268 8 295 8 342 -10.5%
50 179 50 568 51 300 52 052 52 854 53 575 54 218 6.7%
48 034 48 807 49 723 50 837 52 025 53 153 54 360 14.5%
57 400 57 812 59 205 60 634 62 248 63 952 65 730 10.1%
71 622 71 774 72 355 73 435 74 512 75 761 76 907 4.0%
168 601 169 541 171 086 173 606 176 324 179 130 181 696 4.9%
29 201 29 460 29 750 30 128 30 503 30 893 31 255 4.8%
861 888 868 472 879 257 893 271 908 113 923 026 937 212 6.8%
101 563 101 155 101 232 101 776 102 559 103 434 104 576 -3.2%
8 145 8 262 8 363 8 458 8 544 8 611 8 690 10.7%
971 596 977 889 988 852 1 003 505 1 019 216 1 035 071 1 050 478 5.7%
2015 2016
2016 2017
2017 2018
2018 2019
2012 2013
2013 2014
2014 2015
Variation
2009-2010 to
2018-2019

48 Vocational and Technical Training in Québec: Overview
Fore
cast
s
Note
: The
follo
win
g ar
e ex
clud
ed fr
om th
e pr
esen
t/pre
dict
ions
: con
tinui
ng e
duca
tion
stud
ents
(adu
lts),
part-
time
stud
ents
and
stu
dent
s
fro
m p
rivat
e or
gov
ernm
ent s
choo
ls.
Sour
ce: M
ELS,
Sys
tèm
e pr
évis
ionn
el S
IPEE
C, D
RSI,
May
201
0.
01 B
as-S
aint
-Lau
rent
5
576
5 39
3 5
223
5 04
0 4
931
4 73
7 4
515
4 24
3 4
146
4 04
1 3
994
-28.
4%
02 S
ague
nay–
Lac-
Sain
t-Je
an
7 93
6 7
613
7 13
4 6
780
6 43
5 6
236
5 88
6 5
573
5 27
6 5
233
5 19
6 -3
4.5
%
03 C
apita
le-N
atio
nale
18
934
18
987
18
851
18
446
18
030
17
388
16
688
16
005
15
521
15
364
15
363
-1
8.9
%
04 M
auric
ie
5 46
5 5
420
5 33
0 5
268
5 09
3 4
766
4 43
6 4
217
4 05
4 3
910
3 87
1 -2
9.2
%
05 E
strie
7
360
7 18
1 6
957
6 89
7 6
711
6 55
9 6
289
6 07
1 5
913
5 84
8 5
723
-22.
2%
06 M
ontré
al
53 9
34
54 5
15
55 2
00
55 5
14
54 8
15
53 5
54
51 5
40
49 9
47
49 0
02
48 5
51
48 1
70
-10.
7%
07 O
utao
uais
5
449
5 30
7 5
216
5 09
0 4
816
4 66
1 4
482
4 37
0 4
281
4 20
5 4
170
-23.
5%
08 A
bitib
i-Tém
isca
min
gue
2 59
3 2
572
2 50
4 2
446
2 26
8 2
248
2 14
8 2
040
1 94
8 1
905
1 86
8 -2
8.0
%
09 C
ôte-
Nord
1
337
1 41
1 1
400
1 35
3 1
296
1 26
6 1
276
1 22
9 1
168
1 13
2 1
110
-17.
0%
10 N
ord-
du-Q
uébe
c 13
2 12
7 13
2 12
6 11
8 11
0 10
3 95
84
91
95
-2
8.0
%
11 G
aspé
sie–
Îles-
de-la
-Mad
elei
ne
1 06
8 1
000
914
875
839
776
721
691
667
632
613
-42.
6%
12 C
haud
ière
-App
alac
hes
5 41
8 5
500
5 21
9 5
067
4 95
5 4
804
4 63
2 4
475
4 38
2 4
359
4 33
6 -2
0.0
%
13 L
aval
6
213
6 33
8 6
385
6 35
0 6
223
6 11
7 5
920
5 74
1 5
642
5 60
2 5
585
-10.
1%
14 L
anau
dièr
e 5
113
5 19
2 5
144
5 00
8 4
904
4 62
7 4
360
4 16
1 4
050
4 03
0 3
942
-22.
9%
15 L
aure
ntid
es
8 89
0 9
048
9 13
3 9
080
8 85
0 8
572
8 11
2 7
799
7 56
3 7
521
7 50
7 -1
5.6
%
16 M
onté
régi
e 20
830
20
906
20
745
20
455
19
731
19
073
18
144
17
304
16
736
16
522
16
395
-2
1.3
%
17 C
entre
-du-
Québ
ec
3 08
9 3
012
2 99
0 2
939
2 76
5 2
700
2 64
5 2
594
2 57
5 2
579
2 52
7 -1
8.2
%
Al
l of Q
uébe
c 15
9 34
4 15
9 52
2 15
8 47
7 15
6 73
4 15
2 78
0 14
8 19
4 14
1 89
7 13
6 55
5 13
3 00
8 13
1 52
5 13
0 46
5 -1
8.1%
Obse
rvat
ions
(200
9) a
nd fo
reca
sts
(201
0-20
19) f
or tr
ends
in e
nrol
lmen
ts in
full-
time
regu
lar c
olle
ge e
duca
tion,
by
adm
inis
trat
ive
regi
on (Q
uébe
c as
a w
hole
, pub
lic s
ecto
r)
2018
2019
2010
2011
2012
2013
2014
2015
2016
2017
Varia
tion
2009
20
19
Obs.
2009

Notes
49Vocational and Technical Training in Québec: Overview

50 Vocational and Technical Training in Québec: Overview


17-9
831A
Bar
rett
eCom
mun
icat
ion.
com


![NATIONAL VOCATIONAL EDUCATION QUALIFICATION FRAMEWORK ...€¦ · NATIONAL VOCATIONAL EDUCATION QUALIFICATION FRAMEWORK [NVEQF] ... framed a National Vocational Education Qualification](https://img.dokumen.tips/doc/110x75/5ac361b97f8b9af91c8bec0e/national-vocational-education-qualification-framework-national-vocational.jpg)