Embed Size (px)
Citation preview

HAL Id: hal-00717963https://hal.inria.fr/hal-00717963
Submitted on 14 Jul 2012
HAL is a multi-disciplinary open accessarchive for the deposit and dissemination of sci-entific research documents, whether they are pub-lished or not. The documents may come fromteaching and research institutions in France orabroad, or from public or private research centers.
L’archive ouverte pluridisciplinaire HAL, estdestinée au dépôt et à la diffusion de documentsscientifiques de niveau recherche, publiés ou non,émanant des établissements d’enseignement et derecherche français ou étrangers, des laboratoirespublics ou privés.
Vocal imitations and the identification of sound eventsGuillaume Lemaitre, Arnaud Dessein, Patrick Susini, Karine Aura
To cite this version:Guillaume Lemaitre, Arnaud Dessein, Patrick Susini, Karine Aura. Vocal imitations and the identifi-cation of sound events. Ecological Psychology, Taylor
Francis (Routledge), 2011, 23 (4), pp.267-307. <hal-00717963>
Submission to Ecological Psychology. Initially submitted March 23. 2010 (v0.5). Revision v3.4 July 4, 2011
Vocal imitations and the identification of sound events
Guillaume Lemaitre, Arnaud Dessein, Patrick SusiniSTMS-Ircam-CNRS, Paris, France
Karine AuraLaboratoire Octogone-J.Lordat EA 4156, Universite de Toulouse, France
Abstract
It is commonly observed that a speaker vocally imitates a sound that she orhe intends to communicate to an interlocutor. We report on an experimentthat examined the assumption that vocal imitations can effectively com-municate a referent sound, and that they do so by conveying the featuresnecessary for the identification of the referent sound event. Subjects wererequired to sort a set of vocal imitations of everyday sounds. The resultingclusters corresponded in most of the cases to the categories of the referentsound events, indicating that the imitations enabled the listeners to recoverwhat was imitated. Furthermore, a binary decision tree analysis showed thata few characteristic acoustic features predicted the clusters. These featuresalso predicted the classification of the referent sounds, but did not generalizeto the categorization of other sounds. This showed that, for the speaker, vo-cally imitating a sound consists of conveying the acoustic features importantfor recognition, within the constraints of human vocal production. As suchvocal imitations prove to be a phenomenon potentially useful to study soundidentification.
Studying vocal imitations to understand sound event identification
Sounds inform listeners about their environment, especially of the part of the envi-ronment not currently in their visual field. Think for instance, how annoying it would beto wait right next to a kettle to visually check when the water is boiling. But what exactlydo environmental sounds tell us? And what acoustic information do we use to identify
This work was founded by the FP6-NEST-PATH European project n. 29085 CLOSED (Closing the loopof sound evaluation and design). This work was also supported in part by NSF award #0946550 to LaurieHeller.
Portions of this work were presented in July 2008 during the Acoustics 08 Conference held in Paris,France, in July 2009 during the Sound and Music Computing Conference held in Porto, Portugal, andNovember 2009 during the Auditory Perception, Cognition and Action Meeting in Boston, MA. The authorswould like to thank Laurie Heller, Jennifer Tomlison, and Ashlie Henery for proofreading the manuscript.
VOCAL IMITATIONS, IDENTIFICATION, SOUND EVENTS 2
these sounds? These are two important questions that research in environmental soundperception tries to elucidate. A variety of methods have been developed over the years toquestion listeners, directly or indirectly, about the acoustic information they use to identifya sound: rating scales, discrimination and categorization tasks, analyses of verbalizations,etc. One aspect of human communication, however, has received little attention: humanspeakers very often vocally imitate a sound when they want to communicate it to an in-terlocutor. Although, it is likely that not every sound is vocalizable. But if one assumesthat at least some sounds can be vocally communicated, the successful vocal imitation of areferent sound has to convey the acoustic information that is necessary for its identification.In most cases however, the human voice cannot exactly reproduce every feature of a sound.Therefore, one may assume that a speaker will only select the features that he or she deemsnecessary and sufficient for identification and that he or she can reasonably vocalize well.If these assumptions are correct, successful vocal imitations of environmental sounds (i.e.imitations allowing successful identification) can be considered as a magnifying glass iso-lating and emphasizing the acoustic information used by listeners to identify sounds. Thisarticle examines the potential of using this magnifying glass to cast a light upon the acousticfeatures that allows sound identification.
Identifying environmental sounds
Empirical studies have consistently shown that listeners can identify what has causeda sound. Whereas some types of information about the sound source are conveyed by thesound only, others can not be interpreted without additional knowledge provided by thecontext.
A sound is an audible acoustic wave caused by a mechanical sound event: the air blow-ing out of a kettle, a pencil falling from a desktop, the membrane of loudspeaker vibrating.Now, consider the following descriptions of the same sound provided by different listeners(Lemaitre, Houix, Misdariis, & Susini, 2010): “a series of short high-pitched sounds”, “a fewsmall objects dropped onto a glass or ceramic surface and bouncing”, “a couple of ice cubesdropped into glass”. They all are correct, and illustrate that listeners are capable of bothanalyzing the properties of the acoustic wave (e.g. pitch, timbre, temporal sequencing),recovering the basic mechanical interactions (e.g. smalls objects dropped onto somethinghard), and interpreting the source of the sound. But this latter interpretation requires otheravailable sources of knowledge (Gaver, 1993a, 1993b; Handel, 1995). For instance, if thelistener is aware that the situation takes place in a kitchen, he or she will likely interpretthe small objects as ice cubes poured into a glass. But listeners not aware of the contextmay have a different interpretation: “coins dropped on a ceramic dish”, “aspirin tabletsdropped into a cup”, etc. (these were descriptions from the same study). Some propertiesare unambiguously specified by the sound only (e.g. dropping, small objects, a resonantsurface), but some others are interpreted based on the context: were the small objects icecubes, aspirin tablets, coins? Were they dropped onto a flat surface or into some sort ofcontainer? Was it made of glass, metal, or ceramic?
These questions are found throughout the literature on environmental sound percep-tion. Vanderveer (1979) was the first to show that listeners spontaneously describe thecause of the sounds they hear. Many authors have shown the listeners’ ability to auditorilyrecover the properties of isolated simple sound events: size and shape (Lakatos, McAdams,

VOCAL IMITATIONS, IDENTIFICATION, SOUND EVENTS 3
& Causse, 1997; Carello, Anderson, & Kunkler-Peck, 1998; Kunkler-Peck & Turvey, 2000;Houben, Kohlrausch, & Hermes, 2004; Grassi, 2005), material (Klatzky, Pai, & Krotkov,2000; McAdams, Chaigne, & Roussarie, 2004; Giordano & McAdams, 2006; McAdams,Roussarie, Chaigne, & Giordano, 2010), action (Warren & Verbrugge, 1984; Cabe & Pit-tenger, 2000).
In many cases however, it has been very difficult to pinpoint the acoustic featuresthat specify these properties to the listeners. A typical example is that of the perception ofthe material of impacted objects. There exists in theory an acoustic property that specifiesunequivocally the material of such an object: the ratio of each partial’s decay time over itsfrequency (Wildes & Richards, 1988). In the sense of the ecological approach to perception,it is an invariant (Carello, Wagman, & Turvey, 2005). However, empirical studies haveshown that listeners do not use this property to judge the material, and that they have onlya coarse ability to distinguish the material of the sounding objects when other propertiesare varied (see Klatzky et al., 2000; Lutfi & Oh, 1997; Giordano, McAdams, & Rocchesso,2010; Lemaitre & Heller, 2011).
As it turns out, interpreting meaningful sounds (sounds that listeners can identify thecause of) shares a lot with the processing of language (Howard and Ballas, 1980; Ballas andMullins, 1991; Ballas, 1993; Cummings et al., 2006). Ballas and Howard (1987) showed forinstance the importance of the phenomenon of homonym-like sounds: sounds that can bediscriminated (subjects can tell that the sounds are different), but identified as the sameevent (the cause appears to be identical). The sounds of a fuse burning and food frying areexamples of two homonymous sounds.
Many pieces of information that a listener can interpret from listening to a soundtherefore are inferred from more than just the sound. Before trying to highlight the acousticfeatures used by listeners to identify a sound source, it is first important to consider whichperceived properties of the sound events can possibly be conveyed by acoustic features only.Our previous work has shown that the perceived sound events are organized in listenersfollowing a taxonomy that is very close to that proposed by Gaver (1993b), with a firstseparation between actions made by solid objects, liquids and gas, and a special emphasison the temporal aspects of the elementary actions (e.g discrete vs. continuous actions,etc. Houix, Lemaitre, Misdariis, Susini, and Urdapilleta, 2011). Furthermore, we have alsoshown that listening to environmental sounds activates in listeners lexical representationsof the elementary mechanical actions that have caused the sounds (e.g. tapping, scraping,rolling, blowing, dripping, etc.) more strongly and rapidly than the many other possibledescriptions of the sources of the sound, even without the help of the context (Lemaitre &Heller, 2010). Therefore, the present study used a set of sounds that were easily identifiableat the level of the elementary actions organized in this taxonomy (Lemaitre et al., 2010).
Vocal imitations as a method to assess sound perception
Different methods are commonly used to assess which acoustic features listeners useto identify the sounds. A widespread psychoacoustic technique consists in synthesizingsounds and varying the parameters expected to subserve identification. But such a methodis not available when the experimenter wants to use recordings of natural events. In suchcases, another method consists of first using dissimilarity ratings and multidimensionalscaling analysis to identify the relevant features, and second typicality judgments to map the

VOCAL IMITATIONS, IDENTIFICATION, SOUND EVENTS 4
features to the different categories (Lemaitre, Susini, Winsberg, Letinturier, & McAdams,2007, 2009). Such a technique is however only appropriate for sounds caused by similarsources (Susini, McAdams, & Winsberg, 1999). For heterogeneous sets of sounds, freecategorization and linguistic analyses of the listeners’ descriptions of their categories aregenerally used (Houix et al., 2011). Among the various linguistic devices used to describe asound, we have observed that vocal imitations are spontaneously used when subjects haveto communicate a sound that they have just heard (Lemaitre, Dessein, Aura, & Susini,2009), as other authors have also noticed (Wright, 1971). Specifically, when no propervocabulary is available, vocal imitations may facilitate the communication of an acousticexperience. This is exactly what people do when they call the “Car Talk” radio show, andtry to vocalize the sound that their car is making to presumably indicate a problem to thehosts1.
Vocal imitations, onomatopoeias and sound symbolism
In fact, there are two different types of imitations: imitations standardized in alanguage (onomatopoeias) and non-conventional and creative vocalizations. Imitations ofthe former type are close to words: the meaning is associated to the word through a symbolicrelationship (Hashimoto et al., 2006). Our study is more interested in the latter kind,for which the meaning is conveyed by some similarity between the imitation and what itimitates. Let us first examine the difference between these two types of imitations.
Onomatopoeias have probably been the most commonly studied type of vocal imita-tions. Pharies (1979, cited by Sobkowiak, 1990) provided a very interesting definition:
An onomatopoeia is a word that is considered by convention to be acousticlysimilar to the sound, or the sound produced by the thing to which it refers.
The sound symbolism of onomatopoeias has been studied for several languages (Sobkowiak,1990; Rhodes, 1994; Oswalt, 1994; Zuchowski, 1998; Patel & Iversen, 2003). In particu-lar, Japanese onomatopoeias have been much studied. For instance, Iwasaki, Vinson, andVigliocco (2007) have experimentally shown that English listeners (with no proficiency inthe Japanese language) would correctly rate the meaning of giongo: common onomatopoeiasmimicking sounds. Systematic relationships between the aesthetic impressions, phoneticalcontent and acoustic properties have been highlighted for Japanese onomatopoeias (Takada,Tanaka, & Iwamiya, 2006; Takada, Fujisawa, Obata, & Iwamiya, 2010).
In comparison to onomatopoeias, non-conventional vocal imitations have been rarelystudied. Such imitations can be simply defined by dropping the first part of Pharies’definition of onomatopoeias: a non-conventional imitation is a creative utterance intendedto be acoustically similar to the sound, or the sound produced by the thing to which itrefers. Therefore, a non-conventional imitation is only constrained by the vocal ability ofthe speakers, and does not use symbolic conventions. Lass et al. (1983) showed that human-imitated animal sounds were well recognized by listeners, even better than the actual animal
1http://www.cartalk.com/. For instance, in a recent show:
“- So, when you start it up, what kind of noises does it make?- It just rattles around for about a minute. Just like it’s bouncing off something. He thinks that it could bebouncing off the fan, but it’s not there. [. . . ]- Just like budublu-budublu-budublu?- Yeah! It’s definitively bouncing off something, and then it stops.”

VOCAL IMITATIONS, IDENTIFICATION, SOUND EVENTS 5
sounds (Lass, Eastham, Parrish, Sherbick, & Ralph, 1982), yet the listeners did not have anyproblem discriminating between the two categories (Lass et al., 1984). This effect is probablyclose to that of the Foley sound effects used in movies and video games (Heller & Wolf,2002; Newman, 2004). The meaning of “tame” sound symbolisms (i.e. onomatopoeias) maybe specific to a culture, whereas “wild” sound symbolisms (non-conventional) are imitativerather than symbolic, to borrow the words of Rhodes (1994). Therefore, our study focusedon subjects using only wild imitations.
Vocal imitations have been also used to develop technical applications (Ishihara, Tsub-ota, & Okuno, 2003; Ishihara, Nakatani, Ogata, & Okuno, 2004; Nakano, Ogata, Goto, &Hiraga, 2004; Nakano & Goto, 2009; Sundaram & Narayanan, 2006, 2008; Takada et al.,2001; Gillet & Richard, 2005). For instance, using vocal imitation as a control of sound syn-thesis is a promising approach (Ekman & Rinott, 2010). Cartoonification is another specifickind of sound synthesis that consists of exaggerating some acoustic features (perceptuallyimportant) while discarding some (Rocchesso, Bresin, & Fernstrom, 2003).
But is any kind of sound vocalizable? Besides speech, humans can produce a widevariety of vocal sounds, from babbles to opera singing, from sighs to yells, from laughter togurgles. Beatboxers2 have developed vocal techniques that allow them to imitate the soundsof drums, turntables and other sound effects commonly found in popular music, with a pro-ficiency that compares only to the lyrebird (Proctor, Nayak, & Narayanan, 2010). Despitethese somewhat extraordinary performances, several limitations are to be considered. First,there are physiological limitations. The voice apparatus can be essentially approximatedby a source-filter model, with the lungs and the vocal folds as the source (i.e. the glottalsignal), and the articulators (vocal tract, tongue, palate, cheek, lips, teeth) as the filter.The main limitation to what the voice can do probably comes from the glottal signal. Theglottal signal is produced by a single vibrational system (the vocal folds), which implies thatvocal signals are most often periodic (even though, chaotic, a-periodic or double-periodicoscillations can also happen), and essentially monophonic (even though some singing tech-niques can produce the illusion of multiple pitches). Furthermore, its pitch range is limited.The range of the human voice extends overall from about 80 Hz to 1100 Hz, and a singleindividual’s vocal range usually covers less than two octaves. Another kind of limitationcomes from speakers’s native language. Speakers have a better ability to produce the speechsounds of their native language, and usually encounter utter difficulties when attemptingto produce the sounds of a foreign language (Troubetzkoy, 1949; Strange & Shafer, 2008).For instance, the French speakers used in this study, even if instructed not to use words,were of course more prone to produce French trills /r/ and /ö/3 than the Spanish trill orthe English /ô/, and very unlikely to use the English dental fricatives /T/ and /D/. A lastlimitation comes from the fact that some speakers may be better able to invent successfulimitations of a sound than some other ones.
Outline of the study
The goal of the research reported here was to answer two questions: can the vocalimitations of sounds made by novice imitators allow a listener to recover the imitated sound?
2For a compelling example, see http://www.neurosonicsaudiomedical.com/3We did not distinguish between /ö/ and /K/

VOCAL IMITATIONS, IDENTIFICATION, SOUND EVENTS 6
For the sounds that are successfully vocalizable, could we study vocal imitations to betterunderstand what acoustical features are necessary to identify the sounds sources? As astarting point, we used the sounds of categories of simple mechanical events previouslymentioned that our previous work showed to be well identified on the basis of their acousticfeatures, and require little semantic interpretation.
The experiment reported in this paper required a set of participants to vocally imitatethese sounds, and then another set of participants to categorize these imitations in termsof what they thought was imitated. We used novice speakers and naive listeners (i.e.participants with no expertise in sound analysis or vocal production), because we wereinterested in how effectively these vocal imitations could communicate another sound, andnot in their realism (the imitations of expert practitioners have sometimes been rated asmore realistic than the actual sounds of the events - Heller & Wolf, 2002). The comparisonof the two categorizations (referent sounds vs. corresponding imitations) showed that thelisteners were able to recover the categories of sound events to which most vocal imitationscorresponded. This showed that vocal imitations enabled the identification of many soundevents. We then sought to identify the information in the successful vocal imitations thatconveyed the referent sound events. The data were submitted to a simple machine learningtechnique (binary decision tree). Finally, we tested if the classifier, trained on the vocalimitations, could predict the classification of the referent sounds, and other sounds fromthe same categories as well.
An experimental categorization of vocal imitation
This experiment focused on how listeners categorized a set of vocal imitations ofkitchen sounds. More precisely, we studied here only non-linguistic (wild) imitations. Usinga categorization task was motivated by the assumption that, if listeners are able to recoverthe sounds that are imitated (the referent sound), they should categorize the imitationsin a similar way to what they would do with the referent sounds. If kitchen sounds arecategorized according to the corresponding sound events (water flowing, food being cut,etc.), so should their imitations. Furthermore, because categorizing a set of sounds can bedone at different levels of specificity, using a categorization task allowed us to explore whatkind of information was conveyed by the imitations: for instance, a listener might not beable to identify the cause of the sound at the most specific level, but still be capable ofrecovering a more general category which the sound event belongs to.
Initial data: the categorization of kitchen sounds
The stimuli used in the experiment were based on vocal imitations of a set of everydaykitchen sounds. The selection of these sounds was made on the basis of the results of acategorization experiments reported in Houix et al. (2011). Below, we first reproduce themain outlines of this study, and describe the results that were relevant to our study.
Procedure. The initial sounds were 60 recordings of activities usually occurring in akitchen, chosen from different commercial sound libraries. The participants had to listento the sounds, group them together, and describe their grouping, following the proceduredescribed in the following paragraph. We used the data collected for 15 non-expert partici-pants, because the results of Lemaitre et al. (2010) showed that only non-expert participants

VOCAL IMITATIONS, IDENTIFICATION, SOUND EVENTS 7
used a classification strategy consistently based on the identification of the sound events(which is the focus of this study), as opposed to a classification based on acoustic similaritiesirrespective of the cause of the sounds.
Analysis and sound selection. An analysis of the categories and their descriptions canbe found in Houix et al. (2011). The upper panel of Figure 1 represents the results of thecategorization.
On this figure, we have represented the nine clusters that were highlighted by thelinguistic analysis of the subjects’ verbalizations reported in Houix et al. These clusterscorresponded to sounds made by cutting, preparing food, impact on pots and pans, crum-pling/crushing, closing, machines, water, cooking and gases. Therefore, they each corre-sponded to a specific kind of mechanical event: single impact, repeated impacts, drips,gusts, etc. In the experiment reported here, we considered the four categories of soundsof liquids (water), gases, electrical appliances (machines), and solids (cutting). The upperpanel of Figure 1 shows that these sounds were consistently clustered. We chose threesounds in each of these categories (see Table 1). These sounds were in general well identi-fiable4, although for the electrical sounds we had to choose sounds that were slightly lessidentifiable, because of the unavailability of more identifiable sounds in this category. Thelower panel of Figure 1 represents the hierarchical tree obtained for the 12 sounds usedas referent sounds only, using the same type of cluster analysis as we used to analyze theclassification of the imitations (see below). This figure shows that these 12 sounds formed 4clearly distinguishable categories. These sounds could therefore be described at two levelsof specificity: the type of sound production (solid, electric, liquid, gas), and the specificsource (cutting food, gas stove, etc.).
Imitating the kitchen sounds
Method. To provide the material for the subsequent experiment, 20 participants werehired (10 men and 10 women, aged from 18 to 50 years old). The participants were seatedin a sound attenuated booth, and required to listen to the sounds. For each sound, theyhad to record three instances of an imitation of the sound. They were required to imitatethe sounds “in such a way that another person could recognize it”. They were instructednot to use any words or onomatopoeias. They were alone in the booth, using a specificallydesigned Max/MSP interface. They could listen to their imitations and discard those theydid not like. The sounds were recorded using a Schoeps MK5 microphone and a RMEFireface 400 sound board. The sounds were recorded at 44.1 kHz/16 bits resolution.
A total of 720 (4 categories x 3 sounds x 20 participants x 3 trials) imitations wererecorded. These recordings were edited and screened to remove those that were of poorquality, and those that included words or onomatopoeias. Only the best of the three trialswas selected for each participant and each sound (as participants were recording themselves,many recordings were not of sufficient quality, due to being too close to or too far from themicrophone or stopping the recording in the middle of the imitation, etc.). Eventually, only
4The subjects’ confidence in identifying the cause of the sound was measured (see Table 1); the meanvalue was 6.07 on a scale ranging from 0 - the participant does not know at all what has caused the sound -to 8 - the participant perfectly identifies the cause of the sound.

VOCAL IMITATIONS, IDENTIFICATION, SOUND EVENTS 8
the imitations of six participants (three men and three women) were selected, making atotal of 72 imitations.
The referent sounds and their imitations. The referent sounds are described in Table1, and their spectrograms are represented in Figure 2. Within the broader categories of typesof interaction, the sounds shared some apparent similarities. The three sound of electricalappliances were produced by the rotation of a motor and the occasional the impact of bitsof food hitting an object such as a bowl. These sound therefore consisted of a low steadyfundamental frequency and occasional transients. The three sounds of gas had their noisyspectrum in common.. The three sounds of solids all consisted of the repetition of a verybrief impact-like element. The similarities between the three sounds of liquid were lessevident: for instance, the steady broadband noise resulting form water gushing from a tapwas acoustically very different from the three isolated chirps caused by water dripping in acontainer.
The 72 imitations are provided as supplemental material. Table 2 reports a phonetictranscription of these imitations. These transcriptions are approximate (and sometimesimpossible), because in many cases the imitators used other sounds than the phonemes ofFrench speech.
These transcriptions, however, showed some interesting properties. First, the imita-tions were mostly made of voiceless consonants (/S/, /f/, /k/, /p/, /s/, /t/) and the uvularand front trills (/ö/ and /r/) common in French. Second, the imitations of some soundsshared apparent phonetic similarities. For instance, most of the imitations of the sound E2consisted of the uvular trill /ö/, repeated or prolonged by an elongated vowel. It is alsoimportant to note that these sounds imitated the sound of a food processor, and that theimitators were rather successful at capturing the pitch of this sound (an aspect not apparentin the phonetic transcription). Another interesting example is the sound L2. It consistedof three drips, and the six imitations were all made of three repetitions of a similar element(often beginning with the voiceless bilabial stop /p/). More generally, it appeared that theimitations of a same specific sound or a same category of sound production sounded some-what similar, and that the temporal aspect of the imitations (pitch contour, repetitions,etc.) was an important component of the similarities between the imitations of a similar (oridentical) sound. These temporal aspects seemed to capture the main similarities betweenthe sounds of category described in the previous paragraph. The experiment reported inthe next paragraph investigated whether a set of listeners were able to use these similaritiesto recover the referent sounds.
Free classification of imitations: method
Participants Twenty participants (10 women and 10 men) volunteered for the experimentand were compensated for their participation. Ages ranged from 18 to 50 years old. Allreported having normal hearing and were native French speakers. They had no previousexperience in vocalization.
Stimuli The 72 vocal imitations described in the previous paragraph were used as stimuli.

VOCAL IMITATIONS, IDENTIFICATION, SOUND EVENTS 9
Apparatus The sounds were played on a Macintosh Mac Pro (Mac OS X v10.4 Tiger)workstation with a MOTU firewire 828 sound card. The stimuli were amplified dioticallyover a pair of YAMAHA MSP5 loudspeakers. Participants were seated in a double-walledIAC sound-isolation booth. The study was run using Matlab.
Procedure The participants were all given written instructions (in French) explainingthe sorting task. They saw a white screen, on which red dots labelled from 1 to 72 weredrawn, each dot corresponding to a sound. The labeling was different for each participant.They could hear the sound by double-clicking on a dot. Participants were asked to movethe dots to group the sounds together. They were allowed to form as many groups as theywished and to put as many sounds in each group as they desired. Participants were requiredto group together the vocal imitations “on the basis of what is imitated”. Specifically, theywere warned not to categorize the speakers. After they had made the categories, they hadto describe the categories to the experimenter.
Free classification of imitations: analysis
Descriptions of the categories. Although the descriptions provided by the participantswere collected using an informal method, and could therefore not be systematically analyzed,they nevertheless provided us with some useful indications regarding the strategies used bythe participants. Using the typology established by Lemaitre et al. (2010), these descriptionssuggested that the participants used different kinds of similarities to group sounds together.Most of the verbalizations described causal and semantic similarities (i.e. the causal event,the interpreted source and the meaning associated with it). But other kinds of similaritywere also used: acoustic properties of the sounds, feelings (called here hedonic properties),and, more rarely, similarities in the vocal production of the imitations (see Table 3 foran example of such descriptions). For some participants, the description of a given classmentioned several kinds of similarity (e.g. “Continuous sounds, with a kind of vibration,with the lips, the throat, there is something spinning, noises of machines”).
Individual differences and potential outliers. These descriptions might therefore in-dicate different strategies across the participants. In particular, the descriptions of oneparticipant appeared rather incoherent. Appendix A reports the method that we used toidentify individual differences and outliers. As a result, we eliminated one participant fromthe analyses.
Confusion matrix. A first overview of the participants’ classification is provided bythe confusion matrix represented in Figure 3. In this figure, each cell of the matrix corre-sponds to a pair of sounds, and its color represents the number of participants who placedthese two sounds in the same group. If the six imitations of each referent sound would besystematically and exclusively grouped together (i.e. with no other sounds than imitationsof the same referent sound) only the 6x6 submatrices along the main diagonal would bedark. If the imitations were only grouped together with imitations of referent sounds fromthe same category, only the 18x18 submatrices along the main diagonal would have beendark. Instead, the pattern of the confusion matrix highlights different phenomena for thefour initial categories of referent sounds. The imitations of each of the three sounds of

VOCAL IMITATIONS, IDENTIFICATION, SOUND EVENTS 10
gases were rather consistently grouped together, or with imitations of other gases. A fewerrors resulted from the improper grouping with imitations of liquids. The imitations of thesounds of electrical appliances and of the solids were not as systematically grouped together.Rather, all the classifications resulted from grouping the imitations with imitations fromthe same categories, but not necessarily with an imitation of the exact same sound. A fewmisclassifications with imitations of liquids also occurred. Finally, with the exception of theimitations of the sound L2, the imitations of liquids were all misclassified.
Analysis of the classification. These initial insights were confirmed by submittingthe data to a hierarchical clustering analysis, and representing the similarities between thesounds (two sounds are similar when they have been grouped together by a large numberof participants) in a dendrogram.
To identify significant clusters in a dendrogram, the dendrogram is usually cut at agiven fusion level. As an alternative clustering method, we used a threshold of inconsistency.The advantage of using the inconsistency coefficient is that it emphasizes compact subclassesthat would not be revealed using the fusion level (see Appendix B for a description).
The dendrogram of vocal imitations is represented in Figure 4 (using an unweightedaverage linkage method). The coefficient of cophenetic correlation is 0.95, indicating thatthe dendrogram fairly represents the proximity data. The indexes on the x-axis correspondto the vocal imitations (the first letter corresponding to the speaker, the second to theimitated sound). The branches in the gray rectangles correspond to the different clustershighlighted by setting the threshold of inconsistency to 1.45. The threshold was set bydecreasing the inconsistency, and so increasing the number of clusters, until having a set ofclusters of imitations interpretable in terms of categories of referent sounds. The rectanglesare indexed by script letters. When a cluster includes only imitations of a same referentsound, the index of clusters also receives the number corresponding to the referent sound.
Exploring the clusters of vocal imitations highlights the principles that ruled the cate-gorization of the vocal imitations, as well as the characteristics of the imitations potentiallyresponsible for the clustering. Considering the dendrogram from the highest fusion level,the first division (A) distinguished the imitations of gases from all the other sounds. Theformer imitations were clearly distinct from the others because of their breathy (unvoiced)character. The latter imitations were further divided into two clusters (division B): on theleft hand side, a cluster that includes a subcluster (division C) mostly consisting of electricalsounds (characterized by the presence of a continuous steady pitch), and a hybrid subclus-ter that mostly includes imitations of liquid sounds (sound with a rhythmic pitch). On theright hand side a cluster was further subdivided (division D) into a subcluster of imitationsof solid sounds, and a hybrid cluster of liquid and solid sounds. These imitations all had arepetitive pattern in common. Thus, the division of the dendogram results in four distinctand coherent clusters: the imitations of gases, electrical sounds, of some liquid sounds, andsounds of solid objects. The other imitations of liquids are rejected in a hybrid cluster, ormixed either with imitations of solids, or imitations of electrical sounds.
At the finest level of the hierarchy highlighted by the threshold of inconsistency, eightclusters are both mathematically consistent and consistently related to the referent sounds.These eight clusters5 correspond to the four main categories of referent sounds:
5When a cluster only incorporates imitations of the same referent sounds (e.g. G1), this cluster receives

VOCAL IMITATIONS, IDENTIFICATION, SOUND EVENTS 11
• G: imitations of gases(1) G1 made of the 6 imitations of the sound G1;(2) G2 made of 5 of the 6 imitations of the sound G2;(3) G3 made of 5 of the 6 imitations of the sound G3;
• E : imitations of electrical sounds(4) E made of 12 of the 18 imitations of the sounds E1 (4 imitations), E2 (2 imitations)and E3 (6 imitations);
• L: imitations of sounds of liquids(5) L
′ made of 6 of the 12 imitations of the sounds L1 (4 imitations) and L3 (2 imita-tions);
(6) L2 made of 6 of the 6 imitations of the sound L2;• S: imitations of sounds of solid objects
(7) S′′ made of 8 of the 18 imitations of sounds S1 (2 imitations), S2 (3 imitations) and
S3 (3 imtations);(8) S
′ made of 5 of the 12 imitations of sounds S1 (3 imitations) and S2 (2 imitations).
One cluster (X ) is mathematically consistent, but includes imitations of different sounds.
For most of the referent sounds, the majority of imitations were categorized in easilyinterpretable clusters (i.e. clusters including only imitations of the same referent sound, orgrouping imitations of sounds from the same original category). The clusters S
′ and S′′
mix imitations of the three referent solid sounds. Two sounds lead to imitations inappro-priately clustered: the sound E2 (food processor) lead to imitations either clustered withthe imitations of the sounds E1/E3, L1/L2/L3, or were not clustered. The sound L3 (waterrunning in a sink) lead to many imitations that were not consistently clustered. If it islikely that these sounds were probably more difficult to vocalize, it is also worth noticingthat the sound E2 was not as recognizable as the other sounds (see the confidence values inTable 1). In this particular case, a further assumption might be that the participants couldnot decide upon which feature to emphasize when imitating, because they were not able torecognize the original sound.
Overall, 58 imitations (out of the 72) fall in the four clusters G, E , L and S madeby grouping together the eight mathematically consistent clusters of imitations, and corre-sponding to the categories of referent sounds. Among these 58 imitations, only three areclustered in a cluster that does not correspond to the category of referent sounds. There-fore, if we consider the categories of referent sounds as an appropriate level of accuracy, 55of the vocal imitations (76.4 %) were consistently classified. This indicates that, for a largemajority of the imitations, listeners were able to access the category of the referent sound.
Looking at the dendrogram from the top, its superstructure also presents a numberof important differences from that in Figure 1. Whereas for the referent sounds the firstdivision of the dendrogram separated the sounds of solids from all the other ones, thefirst division in Figure 1 distinguishes the imitations of gases. As indicated above, theseimitations had a clear distinct breathy character that is not shared by any other sounds.Most of the imitations of liquids were inconstantly categorized.
the same name as the referent sounds (e.g. G1). When a cluster incorporates imitations of referent soundsbelonging to a similar categories (e.g. liquids), the cluster received the initial of this category (e.g. L
′).
VOCAL IMITATIONS, IDENTIFICATION, SOUND EVENTS 12
Discussion
The results of the experimental categorization of the imitations has shown that thelisteners were able to categorize the imitations in clusters that were consistent with thecategories of referent sounds, with the exception of the imitations of the liquids. Thesecategories grouped together sounds caused by similar mechanical events. Therefore, thisindicates that the participants were able to recover the categories of referent sound events,for most of the imitations. They could just as well have not recovered anything from thereferent sounds, or, despite the instructions, chosen to make categories on the basis of onlylocal similarities between the vocal sounds, not relevant to the referent sound events, if suchan organization would have been an easier principle to categorize the sounds.
However, this classification was not perfect. Except for the gases, the accuracy ofidentification was limited to the categories of referent sounds, and not to the referent soundsthemselves: the clusters included the imitations of the different referent sounds form thesame category. Furthermore, the results suggest a mix of different strategies of classificationas is also the case in the categorization of kitchen sounds reported by Lemaitre et al. (2010)and ? (?).
In particular, the imitations of liquids were inappropriately categorized. In the den-drogram of the referent sounds, the liquids were clearly distinct from the other categories.However, whereas the imitations of the sound L2 form a rather stable cluster (though asso-ciated with the clusters of imitations of solids), the imitations of the sounds L1 and L3 wereaggregated with the imitations of electrical appliances, without creating any stable cluster.The sounds L1 and L3 were long continuous steady sounds (and so were their imitations),and this characteristic might have made them close to the imitations of electrical sounds,which display a continuous steady hum. The sound L2 was made by a series of water drips.The imitations of this sound presented a rhythmic pattern that might have made themclose to the sounds of cutting food (i.e. the solids). However, despite these patterns, thereferent sounds of solids and liquids were categorized in distinct categories. This suggeststhat the listeners who categorized the referent sounds were able to use some other cuesthat were not present in the imitations. Sounds of liquids are in general characterized bythe presence of bubbles. These bubbles result in rapid frequency sweeps (chirps), occurringon top of noisier and louder components. One possible interpretation is that the imitatorswere unable to vocally render both the noisier components and these rapid sweeps, probablybecause of the physiology of the vocal apparatus. The listeners were therefore not able topick up the “liquid” identity of these sounds, and instead grouped them with imitationspresenting some other irrelevant superficial similarity, conveyed by the time course of thesounds. It is interesting to note that the imitations of the sound L2 (three drips) were allgrouped together, and that several subjects used vowel glides that somehow rendered thedrips (e.g. [ui] or [wi]).
Examining the structure of the resulting dendrogram in fact suggested that the clus-ters of imitations of a same category of events overlapped with a set of simple apparentcharacteristics of the imitations: noisy vs. periodic, continuous vs. rhythmic, etc. To verifyif such acoustic characteristics could be the basis for the categorization of the imitations, wereport in the next section how we trained an automatic classifier to categorize the imitationsin a way similar to what the listeners did. However, even if the experimental categorization
VOCAL IMITATIONS, IDENTIFICATION, SOUND EVENTS 13
may be predicted on the basis of a few of acoustic features, this does necessarily mean thatthese features can be considered as characterizing the different categories of sound events,generally. It could also be possible that the participants used an ad hoc strategy in ourexperiment, and only picked up the features that were the most efficient to form a few ofcontrasting classes in this particular set of sounds. In fact, some authors have suggestedthat listeners can use any configuration of information that is potentially useful to achievea particular task (rather than using predetermined features for predetermined tasks – seeHandel, 1989). For instance, Aldrich, Hellier, and Edworthy (2009) showed that subjectsused different features to achieve different tasks, and that the features they used were eveninfluenced by the particular set of sounds used in the experiment. Along the same idea,McAdams et al. (2010) showed that listeners presented with the same set of sounds recon-figured how much they weighed different acoustic features depending the experimental task(similarity judgment or categorization task), and that different subjects would differentlyweigh the features for the same task. Giordano, McDonnell, and McAdams (2010) showedthat listeners required to do a task in fact used a continuum of information, rather thanjust picking up only the most relevant features.
To explore the features of the imitations that the listeners used we trained an au-tomatic classifier to select the most relevant features to predict the classification of theimitations, and applied it to the referent sounds.
Predicting the classification from the acoustic features
The results of the categorization task were first used to fit a model that predictsthe categories on the basis of some acoustic features of the imitations, thus confirming thesubjects in the classification experiment grouped together imitations that shared a few ofacoustic features.
Acoustic properties of the clusters of imitations
The description of the clusters of imitations suggested that they might be charac-terized by a few distinctive acoustic features. To uncover such features, the data weresubmitted to a binary decision tree analysis. The goal of this analysis was to recursivelypredict each division in the dendrogram of imitations by a set of binary decision rulesbased on a few acoustic features. Although much more sophisticated automatic classifi-cation techniques are available, and would probably perfectly learn how to automaticallyclassify our set of vocal imitations, binary decision trees have the advantage of being verysimple: each distinction between two classes is predicted by the combination of independentbinary rules (e.g. the sounds belong to cluster C if feature F1 < threshold1 and featureF2 > threshold2). If not the most powerful, the results of a binary decision are neverthelesseasily interpretable, and therefore more appropriate to uncover the categorization princi-ples. A binary decision tree is therefore a conveniently simple model to fit the data, if weassume that the distinctions between the most consistent categories of imitations found inour data are clear-cut and depend only on a few acoustic properties of the imitations.
We will describe in the following paragraphs the result of the analysis for each divisionof the dendrogram (the indexes of the divisions make reference to Figure 4). For eachdivision, we have first considered the imitations that fell in consistent clusters. These

VOCAL IMITATIONS, IDENTIFICATION, SOUND EVENTS 14
clusters of imitations were submitted to the algorithm that selects the acoustic features thatbest predict the division. We have then shown the imitations that could not be consistentlygrouped together with any of the clusters where were located.
In many cases, several acoustic features can do the job of predicting a division equiva-lently well. We have reported here only the features that were meaningful, i.e. features thatcould be interpreted in terms of how the sound event might have structured the referentsounds. For instance, we did not report the “blind” statistics of the signal (Mel-frequencyspectral coefficients, etc.), even though they could also predict the classification. In fact wewere not interested in the computational power of the automatic classifier, but in what itmight reveal about the information that the imitators tried to convey to the listeners.
The acoustic features were computed with the IrcamDescriptor toolbox (Peeters,2004), and the Yin algorithm to compute the fundamental frequency and the aperiodic-ity of the signal (de Cheveigne & Kawahara, 2001). For this last algorithm, we set thethreshold of aperiodicity that allows the computation of a pitch to 0.5 (the usual value is0.1), because many of our signals included noisy whistles, the pitch of which would haveotherwise been missed. To ensure that the resulting fundamental frequencies were actu-ally measuring the frequency of some periodic part of the signal, we manually inspectedeach sound with Praat (Boersma & Weenink, 2009). These algorithms compute a value ofeach acoustic features for a number of time frames along the duration of each sound. Wehave used here only the statistics summarizing these features (average, standard deviation,extrema, etc.).
Division A: imitations of gases vs. all the other ones. Division A separates theimitations of gases from all the other imitations : G1, G2, G3, X vs. E , L2, S, S
′. Weconsidered all the 72 sounds here. Two features allowed one to discriminate between thesetwo classes (see the upper panel of Figure 5): the average fundamental frequency and themodulation amplitude of the energy envelope. The fundamental frequency is an acousticfeature that correlates with the sensation of pitch (Marozeau, Cheveigne, McAdams, &Winsberg, 2003). The value considered here was averaged over all the periodic parts of thesignal. The modulation amplitude measures how steady the energy envelope of a sound is.For instance, all the sounds that displayed the repetition of an element separated by periodsof silence had a high modulation amplitude. The figure shows that the imitations of gaseswere separated from all the other sounds because they were steady signals presenting a highfundamental frequency (a hiss). Seventy-one of the seventy-two imitations were correctlyclassified (98.6%). The only misclassified sound (M1L3) was an imitation that had twodifferent parts: a first part made of a low hum, followed by a breathy hiss. Because we wereonly using values averaged over the duration of the signals, we were not able to handle suchsounds.
Division B: Electrical appliances vs. solids. Division B separates the imitations ofelectrical appliances (and some liquids) from the imitations of solids (and some other liq-uids). Fifty sounds were considered here. Two features allowed one to predict this division:the modulation amplitude (already mentioned), and the effective duration of the sounds(see the middle panel of Figure 5). Accordingly, the clusters L2, S ′, and S
′′ were separatedfrom the clusters E and L because their energy envelope was modulated (remember that thesolids were sounds of food being cut whereas the electrical appliances were steady sounds

VOCAL IMITATIONS, IDENTIFICATION, SOUND EVENTS 15
of motor), and because the sounds of electrical appliances had a longer duration (note thatthe latter feature is only useful for three sounds). Forty-nine of the fifty imitations werecorrectly classified (98%). The only sound that was misclassified was an imitation of a solid(M3S1) that was in fact misclassified in the dendrogram of imitations (it did not belong toany stable cluster).
Division C: Electrical appliances vs. liquids. Division C separates the imitations ofelectrical appliances from the imitations of liquids. If we consider only the 20 imitations thatfell in one of the stable clusters, they could be perfectly (100 %) predicted from two acousticfeatures: the zero-crossing rate, reflecting the repetition rate of the signals, and the standarddeviation of the fundamental frequency (see the lower panel of Figure 5). Accordingly, theimitations of liquids had a lower zero crossing rate, and a higher standard deviation of thefundamental frequency. This latter property is interesting, because it might be related tothe short-term pitch glides characteristic of bubbles (Rocchesso & Fontana, 2003). Plottingthe locations of the nine inconsistently clustered imitations drew a coherent picture: theimitations of liquids fell with the liquids, and the electrical appliances with the electricalappliances.
Division D/E: liquids and solids. Divisions D and E separate the three categories L2,S′ and S
′′. We first ran the decision tree on the nineteen imitations that were consistentlyclustered. In this case the imitations in the three clusters L2, S
′ and S′′ were perfectly
discriminated (100 %) with two features (see the upper panel of Figure 6). The standarddeviation of the spectral centroid distinguished S
′ from L2 and S′′. These features captured
the variations of timbre across time occurring for the imitations in L2 and S′′ (whereas
imitations in S′ had a steadier timbre). Then the zero-crossing rate, reflecting the repetition
rate of the signals, discriminated between the imitations with a low pitch in L2 and thesounds with a higher pitch in S. It must therefore be noted that these three categories werediscriminated on the basis of features that were more difficult to associate with how theevent creating the sounds would have structured the sounds. Drawing the four imitationsthat were not consistently clustered showed that three of these sounds were close to thecluster L2.
Division F/G: gases G1, G2 and G3. The divisions F and G separate the imitationsof the three gases G1, G2 and G3 + X (one cluster X is at this level associated with G3).Two features allowed for the perfect discrimination (100 %) of the 20 imitations consistentlyclustered in these categories (see the middle panel of Figure 6): the effective duration of theimitations, separating the shortest imitations in G1 from the other ones, and the standarddeviation of the fundamental frequency, separating the imitations with a steady whistle inG2 from the other ones. One of the two sounds that were not well aggregated fell logicallywith the neighbor clusters G2 and X .
Division H. The division H separates the cluster of imitations G3 from the compositecluster X . The separation can be predicted from two features (see the lower panel of Figure6). The standard deviation of the aperiodicity and the range of the fundamental frequency.One sound was misclassified over the nine considered here (88.9 %). However, it must benoted that the division is very low in the dendrogram, which indicates that, overall, thesesounds were considered as similar.

VOCAL IMITATIONS, IDENTIFICATION, SOUND EVENTS 16
Applying the imitation features to the original sounds
Because the imitations corresponding to a same referent sound were grouped together,and were characterized by few number of common features, it is now tempting to observeif these features could be used to classify the referent sounds. To conduct such a test, wecomputed the same acoustic features for the referent sounds, and observed the location ofthe sounds in the feature space. However, only the first level of the categorization couldbe tested (gases vs. solids and liquids vs. electrical appliances): at finer level, either thecategories of imitations corresponded to a single referent sound (and thus, the categorizationis trivial), or the categories of imitations mixed different referent sounds. The upper panel ofFigure 7 represents the referent sounds in the modulation amplitude/minimum aperiodicityspace.
Ten of the twelve sounds were correctly classified simply by the combination of twofeatures the modulation amplitude and the average fundamental frequency (adding morefeatures would have been erring on the side of overfitting). This figure presents a number ofsimilarities with the upper panels of Figure 5, though the exact locations of the boundariesbetween the classes are different. Here, the electrical appliances were defined by theirlow fundamental frequency, and the absence of modulation. Gases were characterized bytheir high fundamental frequency, and the absence of modulation. Solids and liquids werecharacterized by their modulation. The sounds L2 and L3 were misclassified, but so weretheir imitations. There is therefore no reason to expect them to be correctly classified.
Because of the few number of sounds used here, these results should be interpretedcautiously. To assess the generality of the results, we also drew the position of the othersounds in the clusters where the referent sounds originated (Figure 1). Only four of theseeleven sounds were correctly classified (see the lower panel of Figure 7).
Discussion
The binary decision tree analysis showed that the consistent clusters of imitationsresulting from the experimental classification could be predicted from a few binary rulesbased on a few meaningful acoustic features. These clusters were therefore coherent both interms of the category of the referent sound events, and in terms of their acoustic properties.The imitations that imitate the same category of sound events were acoustically similar.It is also interesting to note that most of the imitations that could not be clustered withother imitations could in fact be grouped together with a coherent cluster if one considersonly the features of our analysis. The fact that the listeners did not group them togetherwith other sounds suggest that they might also have some idiosyncratic properties thatdistinguish them from the other sounds.
In most cases6, the similarity of the vocal production overlapped with the perceptionof the event causing the referent sound. But the acoustic analysis of some clusters (inparticular the imitations of sounds of solids) also highlighted clusters that group togethersounds sharing common acoustic properties, but mixing different events.
Finally, the success of the features found for the imitations to predict the catego-rization of the corresponding referent sounds indicates that studying the classification ofthe vocal imitations may have the potential to understand the features that characterize a
6And one might assume that these are the cases of efficient imitations.

VOCAL IMITATIONS, IDENTIFICATION, SOUND EVENTS 17
given category of sound events. However, the lack of generalization to sounds other thanthe precise referent sounds also suggests that the transposition of the vocal features to anysound might be not straightforward.
General discussion
The study reported in this article was motivated by the following observation: aspeaker very often makes use of vocal imitations to describe what he or she has in mindwhen he or she wants to communicate a sound to someone else. We then asked two questions:do the vocal imitations of sounds allow a listener to recover the imitated sound? If yes,could we study vocal imitations to assess what acoustic features are necessary for soundevent identification?
We have reported an experiment examining these questions. We studied the meaningconveyed by a set of non-conventional vocal imitations of everyday sounds, specificallycreated by a number of imitators and selected for the purpose of this study. The imitatorsvocalized a set of sounds identifiable at two levels of specificity: the specific source, orthe type of sound production. Another set of subjects (listeners) were required to sortthese vocal imitations on the basis of what they thought was imitated. The results showedthat the categories of imitations created by the listeners in general corresponded to thereferent sound. Some imitations of the same specific source were clustered together. Manyothers fell into clusters corresponding to the type of sound production. In fact, the referentsounds had been chosen precisely because they belonged to contrasting categories of differentsounding events. Therefore, these results suggest that the vocal imitations conveyed enoughinformation for the listener to recover at least the type of sound production to which thereferent sound belonged; and even in some cases the exact specific source. However, notall the sound events were correctly recovered: in particular, the imitations of liquids wereincorrectly classified. Instead, they were either clustered with other irrelevant imitations,or not consistently clustered. The analysis of these imitations suggested that the imitatorswere unable to successfully render the “liquid character” of these sounds with their voice(in particular the short chirps that are suspected to be characteristic of liquids). Thefirst possible explanation might be that the imitators did not recognize the referent soundevents, and therefore tried to vocally convey the wrong type of information. This seemsunlikely, because these referent sound events were precisely selected on the basis of theireasy identifiability. Another explanation might be that the acoustic features characteristic ofliquids were difficult to render with the human vocal apparatus. Listening to the imitationsof liquid sounds suggests that the imitators had instead emphasized some coarser features (inparticular the temporal structure) that made the listeners confound them with other soundspresenting similar patterns. This failure of communicating the liquid identity thereforeappears to have resulted at least in part from a physiological constraint: the impossibilityto render at the same time a turbulent noisy component and tonal glides.
The most striking result of this study was that the resulting clusters of imitationsappeared to be characterized by a few simple acoustic features. This intuition was confirmedby submitting the data to a very simple type of machine learning technique: a binarydecision tree analysis. This analysis showed that the clustering of the imitations could bepredicted from binary decisions based on a few of acoustic features. So it appears thatthe listeners have only used a limited number of simple acoustic features to cluster the
VOCAL IMITATIONS, IDENTIFICATION, SOUND EVENTS 18
imitations. These features did not imply any complex characteristic but, apparent simplecharacteristics: continuous vs. rhythmic sounds, tonal vs. noisy, short vs. long, etc. Thesecoarse features were sufficient for the listeners to recover the types of sound production.That these clusters corresponded to the categories of referent sound events implies that theimitators have probably chosen to vocally emphasize a few characteristics of the soundsthat they believed would be sufficient for recognition of these categories, within the limitsof what is vocally possible.
The question is then to know whether the imitators chose to emphasize these featuresbecause they were characteristic of the different categories of sound events in general, orbecause they were the most distinctive features that distinguished this particular set ofsounds. The former explanation would imply that different psychologically relevant cat-egories of sound events can be defined, in general, by a few invariant acoustic features.In fact, when we tried to use the features responsible for the clustering of imitations topredict the categorization of the referent sounds, we were fairly successful if we limitedourselves to the precise sounds that had been imitated. However, we failed to successfullypredict the categorization of other sounds (sounds that had not been imitated) from thesame categories. This suggests that, even if the vocal imitations successfully conveyed thefeatures that enabled the listeners to successfully distinguish the imitations of the differentsound events, these features were probably not sufficient to characterize these categories ingeneral.
On the basis of these observations, we can now propose an interpretation of theimitators’ strategy. Required to vocally imitate a set of sounds that clearly fell into fourcategories of sound events, they picked up a few of features: those that they could easilyrender vocally, and that they thought could maximally distinguish these categories. Butthese features were only distinctive of this particular set of sounds: the imitators selectedinformation on the basis of the task and the set of sounds. For instance, they used theduration of the sounds to distinguish some of the categories. If this was a clever choice forour particular set of sounds, the duration of the sounds cannot be thought as characteristicof certain categories of sound events in general. Such an “opportunistic” behavior can alsobe observed in free categorization experiments: presented with a number of sounds, listenerstend to pick up the acoustic information that would allow them to form not too many, nortoo few categories (an effect that is not unlike what Parducci & Wedell, 1986 have reportedfor category scales. Notice that McAdams et al. (2010) also reported that listeners couldpick up different kind of information from a same set of sounds, depending on the task). Thisalso suggests that listeners do not have definitively fixed low-dimensional representations ofsounds: they can use different aspects of the sounds to adapt their behavior to the task.
The main purpose of this report was to explore whether studying vocal imitations ofsounds could help us understand the auditory features necessary for the identification ofdifferent sound events. The answer is mixed. In the simple case that we have reported here,studying the vocal imitations showed the features of the sounds that the imitators chose toconvey to the listeners. But because these features were probably useful only locally, for ourparticular set of sounds, we did not really learn anything about what characterizes thesesound events in general. But these results nevertheless show that the process of vocallyimitating sounds consists of picking up certain characteristics of the sounds, and vocallyconveying these features to the listeners, probably in an emphasized fashion. As such,
VOCAL IMITATIONS, IDENTIFICATION, SOUND EVENTS 19
studying vocal imitations would help us understand what imitators think is important forrecognition, within the limits of what is vocally possible. More sophisticated designs arenow necessary to investigate the questions more thoroughly.
A potential limitation of this work is that we have applied the features found forthe vocal imitations to the referent sounds without any adaptation. We did not take intoaccount the important differences between vocal and non-vocal sounds. It is in fact verylikely that imitators did not try to exactly mimic the characteristics of the sounds, mainlybecause not every acoustic feature is reproducible by the human vocal apparatus. Some kindof transcription probably occurred: for instance, imitators did not try to exactly reproducethe sounds of the motors of the kitchen appliances: rather they used voiced and unvoicedvocal sounds to signify the presence or absence of a motor. Further work is now neededto understand how imitators use different places of articulation to render different kinds ofmechanical sound events.
Another interesting perspective will be to study vocal imitations during conversations.For instance, future studies could ask: In which cases do speakers use vocal imitations andonomatopoeias? How is the use of imitations related to the identifiability of the soundsource? To the availability of a relevant vocabulary? To the physiological constraints ofthe human voice? Another relevant question is that of the effectiveness of vocal imitationsto communicate a sound in the more ecological context of a conversation: for sounds thatare difficult to describe with words, how effective can speakers be, when they are allowedor forbidden to use vocal imitations?
Besides fundamental questions, a better understanding of these processes will po-tentially lead to many practical applications in audio content analysis or in sound synthe-sis: search-by-similarity, query-by-example, automatic classification, etc. More specifically,studying sound event identification and vocal imitations is expected to inform the devel-opment of cartoonification (Rocchesso et al., 2003). The advantages of such a techniqueare that it renders the information clearer, and more effective, while reducing the compu-tational costs. Using vocal imitation to control of sound synthesis is another promisingapproach (Ekman & Rinott, 2010). The development of all these applications will, par-ticularly, require us to precisely understand how speakers use different vocal sounds andmanners of articulation to communicate specific sound events (the production of vocal im-itations), and how listeners “decode” the vocal productions to recover the referent soundevents and sources (the perception and cognition of these imitations).
References
Abdi, H., Valentine, D., Chollet, S., & Chrea, C. (2007). Analyzing assessors and productsin sorting tasks: Distatis, theory and applications. Food quality and preference, 18 (4),627-640.
Aldrich, K. M., Hellier, E. J., & Edworthy, J. (2009). What determines auditory similarity?the effect of stimulus group and methodology. Quarterly Journal of ExperimentalPsychology , 62 (1), 63-83.
Ballas, J. A. (1993). Common factors in the identification of an assortment of brief everydaysounds. Journal of Experimental Psychology: Human Perception and Performance,19 (2), 250-267.

VOCAL IMITATIONS, IDENTIFICATION, SOUND EVENTS 20
Ballas, J. A., & Howard, J. H. (1987). Interpreting the language of environmental sounds.Environment and Behavior , 19 (1), 91-114.
Ballas, J. A., & Mullins, T. (1991). Effect of context on the identification of everydaysounds. Human Performance, 4 (3), 199-219.
Boersma, P., & Weenink, D. (2009). Praat: doing phonetics by computer (version 5.1.05).(Computer program. Retrieved May 1, 2009, from http://www.praat.org/)
Cabe, P. A., & Pittenger, J. B. (2000). Human sensitivity to acoustic information fromvessel filling. Journal of experimental psychology: human perception and performance,26 (1), 313-324.
Carello, C., Anderson, K. L., & Kunkler-Peck, A. J. (1998, May). Perception of objectlength by sound. Psychological science, 9 (3), 211-214.
Carello, C., Wagman, J. B., & Turvey, M. T. (2005). Acoustic specification of objectproperty. In J. D. Anderson & B. Fisher Anderson (Eds.), Moving image theory:ecological considerations (p. 79-104). Carbondale, IL: Southern Illinois UniversityPress.
Cummings, A., Ceponiene, R., Katoma, A., n, A. P. S., Townsend, J., & Dick, F. (2006).Auditory semantic networks for words and natural sounds. Brain research, 115 , 92-107.
de Cheveigne, A., & Kawahara, H. (2001). YIN, a fundamental frequency estimator forspeech and music. Journal of the Acoustical Society of America, 111 (4), 1917-1930.
Ekman, I., & Rinott, M. (2010). Using vocal sketching for designing sonic interactions.In DIS ’10: Proceedings of the 8th ACM conference on designing interactive systems(pp. 123–131). New York, NY, USA: ACM.
Escoufier, Y. (1973). Le traitement des variables vectorielles. Biometris, 29 (4), 751-760.
Gaver, W. W. (1993a). How do we hear in the world? Explorations in ecological acoustics.Ecological Psychology , 5 (4), 285-313.
Gaver, W. W. (1993b). What do we hear in the world? An ecological approach to auditoryevent perception. Ecological Psychology , 5 (1), 1-29.
Gillet, O., & Richard, G. (2005). Drum loops retrieval from spoken queries. Journal ofIntelligent Information Systems, 24 (2/3), 160-177.
Giordano, B. L., & McAdams, S. (2006, February). Material identification of real impactsounds: effect of size variation in steel, glass, wood and plexiglass plates. Journal ofthe Acoustical Society of America, 119 (2), 1171-1881.
Giordano, B. L., McAdams, S., & Rocchesso, D. (2010). Integration of acoustical informa-tion in the perception of impacted sound sources: the role of information accuracyand exploitability. Journal of experimental psychology: human perception and perfor-mance, 36 (2), 462-476.
Giordano, B. L., McDonnell, J., & McAdams, S. (2010). Hearing living symbols andnonliving icons: category specificities in the cognitive processing of environmentalsounds. Brain and cognition, 73 , 7-19.
Grassi, M. (2005). Do we hear size or sound? Balls dropped on plates. Perception andPsychophysics, 67 (2), 274-284.
Handel, S. (1989). Listening: an introduction to the perception of auditory events. In(p. 219-274). Cambridge, MA: The MIT Press.
Handel, S. (1995). Timbre perception and auditory object identification. In B. C. J. Moore

VOCAL IMITATIONS, IDENTIFICATION, SOUND EVENTS 21
(Ed.), Hearing. Handbook of perception and cognition (Second ed., p. 425-461). Aca-demic Press.
Hashimoto, T., Usui, N., Taira, M., Nose, I., Haji, T., & Kojima, S. (2006). The neuralmechanism associated with the processing of onomatopoeic sounds. Neuroimage, 31 ,1762-1170.
Heller, L. M., & Wolf, L. (2002). When sound effects are better than the real thing. InProceedings of the 143rd ASA meeting. Pittsburgh, PA.
Houben, M. M. J., Kohlrausch, A., & Hermes, D. J. (2004). Perception of the size andspeed of rolling balls by sound. Speech communication, 43 , 331-345.
Houix, O., Lemaitre, G., Misdariis, N., Susini, P., & Urdapilleta, I. (2011). A lexicalanalysis of environmental sound categories. Manuscript submitted for publication.
Howard, J. H., & Ballas, J. A. (1980). Syntactic and semantic factors in the classificationof nonspeech transient patterns. Perception and Psychophysics, 28 (5), 431-439.
Ishihara, K., Nakatani, T., Ogata, T., & Okuno, H. G. (2004). Automatic sound-imitationword recognition from environmental sounds focusing on ambiguity problem in deter-mining phonemes. In C. Zhang, H. W. Guesgen, & W.-K. Yeap (Eds.), Pricai (Vol.3157, p. 909-918). Springer.
Ishihara, K., Tsubota, Y., & Okuno, H. G. (2003). Automatic transcription of environmentalsounds into sound-imitation words based on japanese syllable structure. In Proceedingsof eurospeech 2003 (p. 3185-3188). Geneva, Swirtzerland.
Iwasaki, N., Vinson, D. P., & Vigliocco, G. (2007). What do English speakers know aboutgera-gera and yota-yota? A cross-linguistic investigation of mimetic words for laughingand walking. Japanese-language education around the globe, 17 , 53-78.
Klatzky, R. L., Pai, D. K., & Krotkov, E. P. (2000). Perception of material from contactsounds. Presence, 9 (4), 399-410.
Kunkler-Peck, A. J., & Turvey, M. T. (2000). Hearing shape. Journal of Experimentalpsychology: human perception and performance, 26 (1), 279-294.
Lakatos, S., McAdams, S., & Causse, R. (1997). The representation of auditory sourcecharacteristics: simple geometric forms. Perception & psychophysics, 59 (8), 1180-1190.
Lass, N. J., Eastham, S. K., Parrish, W. C., Sherbick, K. A., & Ralph, D. M. (1982).Listener’s identification of environnmental sounds. Perceptual and Motor Skills, 55 ,75-78.
Lass, N. J., Eastham, S. K., Wright, T. L., Hinzman, A. H., Mills, K. J., & Hefferin, A. L.(1983). Listener’s identification of human-imitated sounds. Perceptual and MotorSkills, 57 , 995-998.
Lass, N. J., Hinzman, A. H., Eastham, S. K., Wright, T. L., Mills, K. J., Bartlett, B. S., etal. (1984). Listener’s discrimination of real and human-imitated sounds. Perceptualand Motor Skills, 58 , 453-454.
Lemaitre, G., Dessein, A., Aura, K., & Susini, P. (2009). Do vocal imitations enablethe identification of the imitated sounds? In Proceedings of the 8th annual AuditoryPerception, Cognition and Action Meeting (APCAM 2009). Boston, MA.
Lemaitre, G., & Heller, L. M. (2010). Action verbs are the most accessible level of soundevent description. In Proceedings of the 9th annual Auditory Perception, Cognitionand Action Meeting (APCAM 2010). St. Louis, MO.
VOCAL IMITATIONS, IDENTIFICATION, SOUND EVENTS 22
Lemaitre, G., & Heller, L. M. (2011). Auditory perception of material is fragile, whileaction is strikingly robust. Manuscript submitted for publication.
Lemaitre, G., Houix, O., Misdariis, N., & Susini, P. (2010). Listener expertise and soundidentification influence the categorization of environmental sounds. Journal of Exper-imental Psychology: applied , 16 (1), 16-32.
Lemaitre, G., Susini, P., Winsberg, S., Letinturier, B., & McAdams, S. (2007). The soundquality of car horns: a psychoacoustical study of timbre. Acta Acustica united withAcustica, 93 (3), 457-468.
Lemaitre, G., Susini, P., Winsberg, S., Letinturier, B., & McAdams, S. (2009). The soundquality of car horns: Designing new representative sounds. Acta Acustica united withAcustica, 95 (2), 356-372.
Lutfi, R. A., & Oh, E. L. (1997, December). Auditory discrimination of material changes in astruck-clamped bar. Journal of the Acoustical Society of America, 102 (6), 3647-3656.
Marozeau, J., Cheveigne, A. de, McAdams, S., & Winsberg, S. (2003). The dependencyof timbre on fundamental frequency. Journal of the Acoustical Society of America,114 (5), 2946-2957.
McAdams, S., Chaigne, A., & Roussarie, V. (2004, March). The psychomechanics of simu-lated sound sources: material properties of impacted bars. Journal of the AcousticalSociety of America, 115 (3), 1306-1320.
McAdams, S., Roussarie, V., Chaigne, A., & Giordano, B. L. (2010). The psychomechanicsof simulated sound sources: material properties of impacted thin plates. Journal ofthe Acoustical Society of America, 128 , 1401-1413.
Nakano, T., & Goto, M. (2009). Vocalistener: a singing-to-singing synthesis system basedon iterative parameter estimation. In Proceedings of the Sound and Music Computing(SMC) conference 2009. Porto, Portugal.
Nakano, T., Ogata, J., Goto, M., & Hiraga, Y. (2004). A drum pattern retrieval methodby voice percussion. In Proceedings of the 5th International Conference on MusicInformation Retrieval (ISMIR 2004) (p. 550-553). Barcelona, Spain.
Newman, F. (2004). Mouthsounds: How to whistle, pop, boing and honk for all occasions...and then some. Workman Publishing Company.
Oswalt, R. L. (1994). Inanimate imitatives. In L. Hinton, J. Nichols, & J. Ohala (Eds.),Sound symbolism. Cambridge University Press.
Parducci, A., & Wedell, D. H. (1986). The category effect with rating scales: number ofcategories, number of stimuli and method of presentation. Journal of ExperimentalPsychology: human perception and performance, 12 (4), 496-516.
Patel, A., & Iversen, J. (2003). Acoustical and perceptual comparison of speech and drumsounds in the North India tabla tradition: an empirical study of sound symbolism. InProceedings of the 15th international congress of phonetic sciences. Barcelona, Spain.
Peeters, G. (2004). A large set of audio features for sound description (similarity and clas-sification) in the CUIDADO project (Cuidado Projet report). Paris, France: Institutde Recherche et de Coordination Acoustique Musique (IRCAM).
Pharies, D. A. (1979). Sound symbolism in the Romance languages. Unpublished doctoraldissertation, University of Columbia, Berkeley.
Proctor, M., Nayak, K., & Narayanan, S. (2010). Para-linguistic mechanisms of productionin human ’beatboxing’: a real-time mri study. In Proceedings of InterSinging 2010.

VOCAL IMITATIONS, IDENTIFICATION, SOUND EVENTS 23
Tokyo, Japan.
Rhodes, R. (1994). Aural images. In L. Hinton, J. Nichols, & J. Ohala (Eds.), Soundsymbolism. Cambridge University Press.
Rocchesso, D., Bresin, R., & Fernstrom, M. (2003, April-june). Sounding objects. IEEEMultimedia, 10 (2), 42-52.
Rocchesso, D., & Fontana, F. (Eds.). (2003). The sounding object. Florence, Italy: Edizionodi Mondo Estremo.
Sobkowiak, W. (1990). On the phonostatistics of English onomatopoeia. Studia AnglicaPosnaniensia, 23 , 15-30.
Strange, W., & Shafer, V. (2008). Speech perception in second language learners: there-education of selective perception. In J. G. Hansen Edwards & M. L. Zampini(Eds.), Phonology and second language acquisition (p. 153-192). Philapelphia, PA:John Benjamin Publishing Company.
Sundaram, S., & Narayanan, S. (2006). Vector-based representation and clustering of audiousing onomatopoeia words. In Proceedings of the American Association for ArtificialIntelligence (AAAI) symposium series. Arlington, VA.
Sundaram, S., & Narayanan, S. (2008). Classification of sound clips by two schemes:using onomatopeia and semantic labels. In Proceedings of the IEEE conference onmultimedia and expo (ICME) (p. 1341-1344). Hanover, Germany: IEEE.
Susini, P., McAdams, S., & Winsberg, S. (1999). A multidimensional technique for soundquality assessment. Acustica united with Acta Acustica, 85 , 650-656.
Takada, M., Fujisawa, N., Obata, F., & Iwamiya, S. (2010). Comparisons of auditoryimpressions and auditory imagery associated with onomatopoeic representations forenvironmental sounds. EURASIPJournal on Audio, Speech, and Music Processing .(Article ID 674248)
Takada, M., Tanaka, K., & Iwamiya, S. (2006). Relationships between auditory impressionsand onomatopoeic features for environmental sounds. Acoustic Science and Technol-ogy , 27 (2), 67-79.
Takada, M., Tanaka, K., Iwamiya, S., Kawahara, K., Takanashi, A., & Mori, A. (2001).Onomatopeic features of sounds emitted from laser printers and copy machines andtheir contributions to product image. In Proceedings of the international conferenceon acoustics ICA 2001. Rome, Italy.
Troubetzkoy, N. S. (1949). Principe de phonologie. Paris, France: Librairie Klincksieck.
Vanderveer, N. J. (1979). Ecological acoustics: human perception of environmental sounds.Unpublished doctoral dissertation, Cornell University.
Warren, W. H., & Verbrugge, R. R. (1984). Auditory perception of breaking and bouncingevents: a case study in ecological acoustics. Journal of Experimental Psychology:Human perception and performance, 10 (5), 704-712.
Wildes, R. P., & Richards, W. A. (1988). Recovering material properties from sound. InW. A. Richards (Ed.), Natural computation (p. 356-363). Cambridge, MA. London,England: A Bradford book. The MIT press.
Wright, P. (1971). Linguistic description of auditory signals. Journal of applied psychology ,55 (3), 244-250.
Zuchowski, R. (1998). Stops and other sound-symbolic devices expressing the relative lengthof referent sounds in onomatopoeia. Studia Anglica Posnaniensia, 33 , 475-485.

VOCAL IMITATIONS, IDENTIFICATION, SOUND EVENTS 24
40 84 56 6 19 20 7 97 98 29 12 72
Solids Electrical Liquids Gases
Cutting Food preparationImpactsonrecipients
Defor
matio
n
Closing Water
Cooki
ng
E1 E2 E3 G3 L1 L2 L3S3S2S2 G1 G2
Solids Electrical Gases
Specificsource
Liquids Type of soundproduction
Figure 1 Hierarchical tree representation of the categorization of the initial kitchen sounds. Thestars correspond to sounds, the imitations of which were finally selected for the subsequent exper-iments. The upper panel is adapted from Houix (2010). The lower panel corresponds to the samecluster analysis as used with the imitations (see the text for details), applied only to the 12 referentsounds. This panel shows the two levels of specificity for the description of each sound: the type ofsound production, and the specific source.
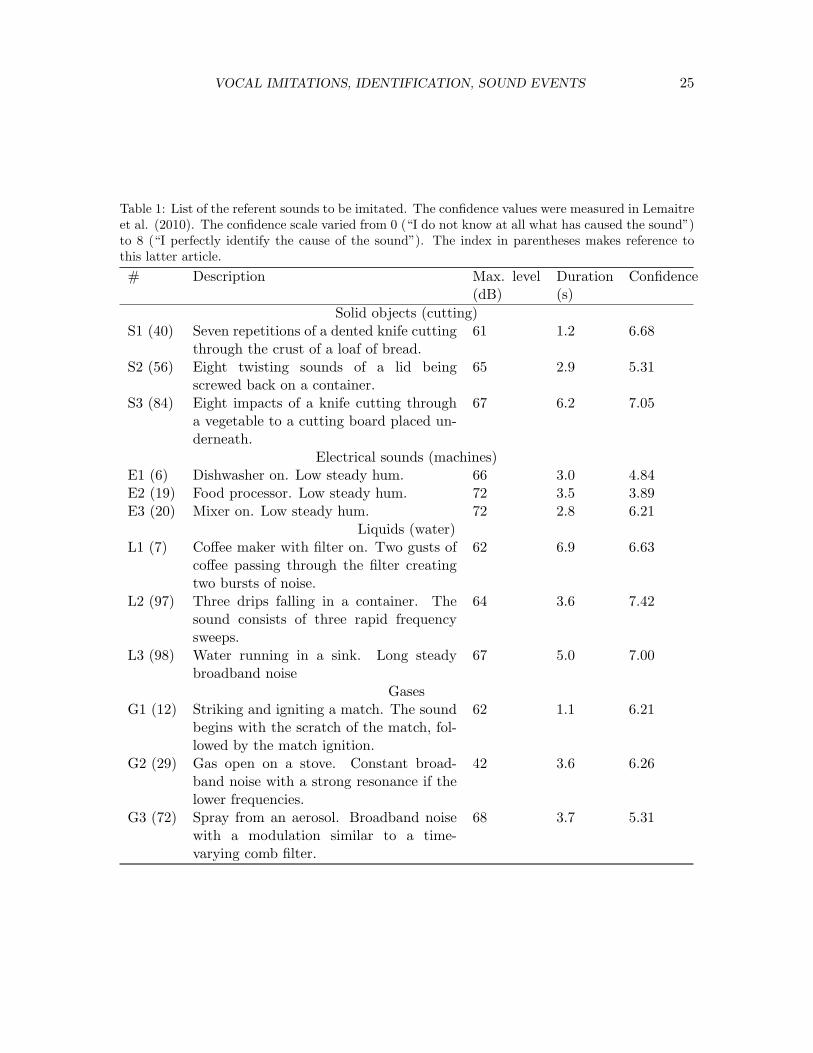
VOCAL IMITATIONS, IDENTIFICATION, SOUND EVENTS 25
Table 1: List of the referent sounds to be imitated. The confidence values were measured in Lemaitreet al. (2010). The confidence scale varied from 0 (“I do not know at all what has caused the sound”)to 8 (“I perfectly identify the cause of the sound”). The index in parentheses makes reference tothis latter article.
# Description Max. level(dB)
Duration(s)
Confidence
Solid objects (cutting)S1 (40) Seven repetitions of a dented knife cutting
through the crust of a loaf of bread.61 1.2 6.68
S2 (56) Eight twisting sounds of a lid beingscrewed back on a container.
65 2.9 5.31
S3 (84) Eight impacts of a knife cutting througha vegetable to a cutting board placed un-derneath.
67 6.2 7.05
Electrical sounds (machines)E1 (6) Dishwasher on. Low steady hum. 66 3.0 4.84E2 (19) Food processor. Low steady hum. 72 3.5 3.89E3 (20) Mixer on. Low steady hum. 72 2.8 6.21
Liquids (water)L1 (7) Coffee maker with filter on. Two gusts of
coffee passing through the filter creatingtwo bursts of noise.
62 6.9 6.63
L2 (97) Three drips falling in a container. Thesound consists of three rapid frequencysweeps.
64 3.6 7.42
L3 (98) Water running in a sink. Long steadybroadband noise
67 5.0 7.00
GasesG1 (12) Striking and igniting a match. The sound
begins with the scratch of the match, fol-lowed by the match ignition.
62 1.1 6.21
G2 (29) Gas open on a stove. Constant broad-band noise with a strong resonance if thelower frequencies.
42 3.6 6.26
G3 (72) Spray from an aerosol. Broadband noisewith a modulation similar to a time-varying comb filter.
68 3.7 5.31

VOCAL IMITATIONS, IDENTIFICATION, SOUND EVENTS 26
Figure 2 Spectrograms of the 12 referent sounds.

VOCAL IMITATIONS, IDENTIFICATION, SOUND EVENTS 27
Table 2: Phonetic transcription of the 72 imitations of the 12 referent sounds vocalized by 6 imi-tators (three men - lower panel - and three women - upper panel). The phonetic symbols refer toFrench phonemes (International Phonetic Alphabet); no distinction is here made between /ö/ and/K/. These transcription are approximative (and sometimes impossible), because in many cases theimitators used sounds that were outside of the range of sounds used in French.
Referentsound
W1 W2 W3
E1 [br@:] [kvu] [tutudu"tudu:]E2 [töu:] [pö:öœ:] [pöw@öw@öw@öw@öw@öw@öw@öw@]E3 [dZ@:] [aöœ:] [t@öœ:m@:]G1 [tu:f] [pfy:f@] [tru"tu]G2 [f@:] [ö@] [fu:]G3 [pi@wis@] [pf@:] [t@du-SySySySySy]L1 [tr@ö@öuföuföuf] [föuö@ö@ö@:] [pöuffufufuf@:pöuf]L2 [p@l@w"-pl@w"-pl@w] [ptui-tui-tui] [plwik-pluk-pluk]L3 [pwu-pZu-Zi:] [Si:u:fu:] [tö@ö@ö@-ö@ö@ö@-fu:]S1 [fr@t@tö@tö@tö@tö@] [fökö@kö@kö@kö@kö@] [föut-föutföut-föutföut]S2 [tum-tum-tum-tum] [öik-kö@kö@kö@kö@kö@kö@] [ptSyk"tudu-kSyktSyktSyktSyk]S2 [ntOk-ntOk-ntuk-ntuk] [k4@t-k4@t-k4@t-k4@t] [fut@"töutöutöutöutöut]
Referentsound
M1 M2 M3
E1 [w@:w@:] [dvu:vu:vu:vu:vu:v] [vu:]E2 [ö@wu-ö@wu-ö@wu-ö@wu] [br@:] [trrrrrrr@:]E3 [öu:] [v@:] [öE:]G1 [tSu:u] [pfSi:] [tut"fu:]G2 [s:] [S@:] [fy:]G3 [tSuf@:it] [tSi:] [psijy:]L1 not transcriptable [kööu:öu:öuö@:] [köO:k"köO:kköO:k]L2 [pöuk-pluk-plup] [Svi:-puk-puk] [klwik-pa-pa]L3 [ö@SSy:SySy:] [Sy:] [tSit@-Swaua:u:i:]S1 [ö@ö@ö@ö@ö@ö@ö@] [föuöu-öu-öu] [tœ"tœ"tœ-tœ"tœ"tœ"tœ]S2 [ö@ö@ö@ö@ö@ö@] [fö@fö@f@fö@fö@] [tr-tr-tr-tr]S3 [kwupkwupwupwup] [pu-pu-pu-pu-pu-pu] [fut-fut-fut-fut-fut]
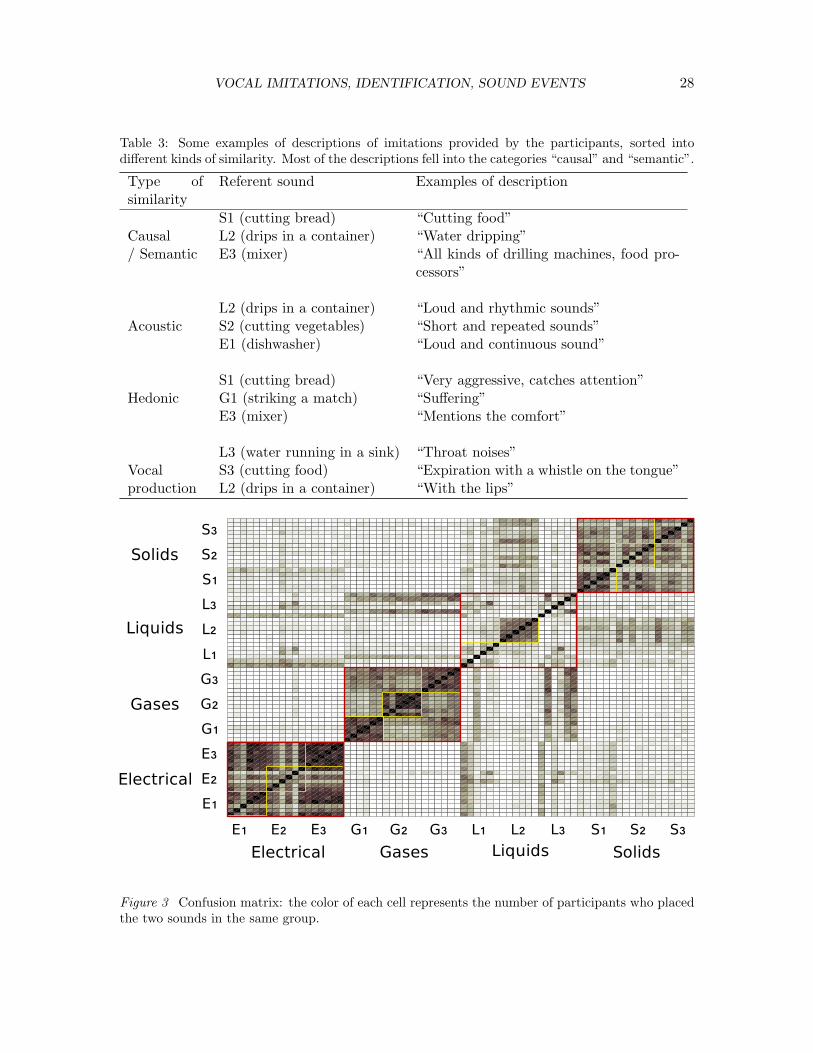
VOCAL IMITATIONS, IDENTIFICATION, SOUND EVENTS 28
Table 3: Some examples of descriptions of imitations provided by the participants, sorted intodifferent kinds of similarity. Most of the descriptions fell into the categories “causal” and “semantic”.
Type ofsimilarity
Referent sound Examples of description
S1 (cutting bread) “Cutting food”Causal L2 (drips in a container) “Water dripping”/ Semantic E3 (mixer) “All kinds of drilling machines, food pro-
cessors”
L2 (drips in a container) “Loud and rhythmic sounds”Acoustic S2 (cutting vegetables) “Short and repeated sounds”
E1 (dishwasher) “Loud and continuous sound”
S1 (cutting bread) “Very aggressive, catches attention”Hedonic G1 (striking a match) “Suffering”
E3 (mixer) “Mentions the comfort”
L3 (water running in a sink) “Throat noises”Vocal S3 (cutting food) “Expiration with a whistle on the tongue”production L2 (drips in a container) “With the lips”
G�E� S�S�S�L�L�L�G�G�E�E�
G�
E�
S�S�S�L�L�L�G�G�
E�E�
Electrical Gases Liquids Solids
Electrical
Gases
Liquids
Solids
Figure 3 Confusion matrix: the color of each cell represents the number of participants who placedthe two sounds in the same group.

VOCAL IMITATIONS, IDENTIFICATION, SOUND EVENTS 29
Mostly gases Mostly Electrical Only solidsG� G3 G� L�
Liquids Solids/liquidsE S'' S'X L'
W�L�
W�E�
W�E�
M�E�
M�E�
M�E�
W�E�
W�E�
M�E�
W�E�
M�E�
M�E�
M�E�
M�E�
W�E�
W�E�
W�L�
W�L�
W�E�
M�S�
W�L�
W�E�
W�L�
M�L�
M�L�
W�E�
M�L�
M�L�
W�G�
M�G�
M�G�
W�G�
M�G�
W�G�
W�L�
M�L�
W�G�
W�G�
M�G�
M�G�
M�G�
W�G�
M�L�
W�G�
W�G�
M�G�
W�G�
M�G�
M�G�
W�L�
W�L�
W�L�
M�L�
M�L�
M�L�
W�S�
M�S�
W�S�
W�S�
W�S�
W�S�
W�S�
M�S�
W�S�
M�S�
W�S�
M�S�
W�S�
M�S�
M�S�
M�S�
W�S�
Division A Division BDivision C
Division D
Division GDivision F
Division H
Division E
Figure 4 Dendrogram of the vocal imitations. The first letter of the index of each imitationsdescribes the imitator (M stands for man, and W for woman), whereas the second letter describesthe category of imitated sound (L is for liquid, S for solid, M for machine and G for gases), see Table1.

VOCAL IMITATIONS, IDENTIFICATION, SOUND EVENTS 30
0
600
1200
1800
Amplitude modulation
Avera
ge fu
ndam
ental
frequ
ecny
� �������
Gases
Solids��liquids and electrical appli ancesMisclassified
0
4
8
12
Effec
tive d
uratio
n
Amplitude modulation� �������
E+
S'+
L
S''L2+
Misclassifed
0.2 0.6 10
200
400
600
Average aperiodicity
Stand
ard de
viatio
n of th
e fun
dame
ntal�fe
rquen
cy
E
L
W�E�
F�L�
M�S�
F�L�
F�E�F�E�
M�E�
Figure 5 Clustering of the vocal imitations by the binary decision tree analysis. The upper panelcorresponds to Division A in the dendrogram of imitations, separating the imitations of gases fromall the other imitations. The middle panel represents Division B, and the lowest panel Division C.In these three panels, the filled symbols correspond to imitations that were consistently clustered,the empty symbols to imitations that could not be grouped together with any stable cluster.
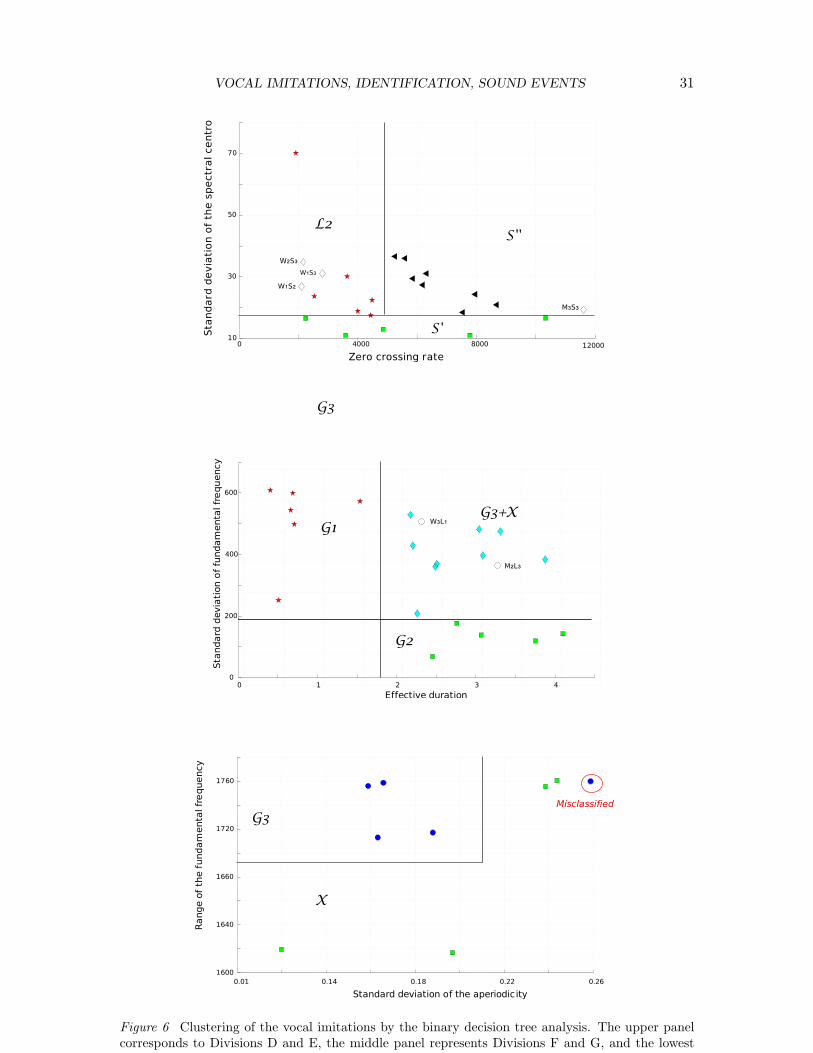
VOCAL IMITATIONS, IDENTIFICATION, SOUND EVENTS 31
0 4000 8000 1200010
30
50
70
Zero crossing rate
Stand
ard de
viatio
n of th
e spe
ctral
centr
oid
S'
S''L2
W�S�
W�S�W�S�
M�S�
0 1 2 3 40
200
400
600
Effective duration
Stand
ard de
viatio
n of fu
ndam
ental�fre
quen
cy
W�L�
M�L�
G3
G1
G2
G3+X
0.01 0.14 0.18 0.22 0.261600
1640
1660
1720
1760
Rang
e of th
e fun
dame
ntal fr
eque
ncy
Standard deviation of the aperiodicity
G3
X
Misclassified
Figure 6 Clustering of the vocal imitations by the binary decision tree analysis. The upper panelcorresponds to Divisions D and E, the middle panel represents Divisions F and G, and the lowestpanel Division H. In these three panels, the filled symbols correspond to imitations that were con-

VOCAL IMITATIONS, IDENTIFICATION, SOUND EVENTS 32
0 0.4 0.8 1.2200
600
1000
1400
Amplitude modulation
Avera
ge fu
ndam
ental�fre
quen
cy
E�E�
E�
L�
L�
L�G�
G� G�
S�
S�S�
Solids
Electricalappliances
Gases Liquids
0 0.5 1 1..5200
600
1000
1400
Amplitude modulation
Avera
ge fu
ndam
ental�fre
quen
cy
Figure 7 Upper panel: clustering of the referent sounds based on the features found for the vocalimitations. Lower panel: the sounds in the same categories of the original sounds have been added(empty symbols).
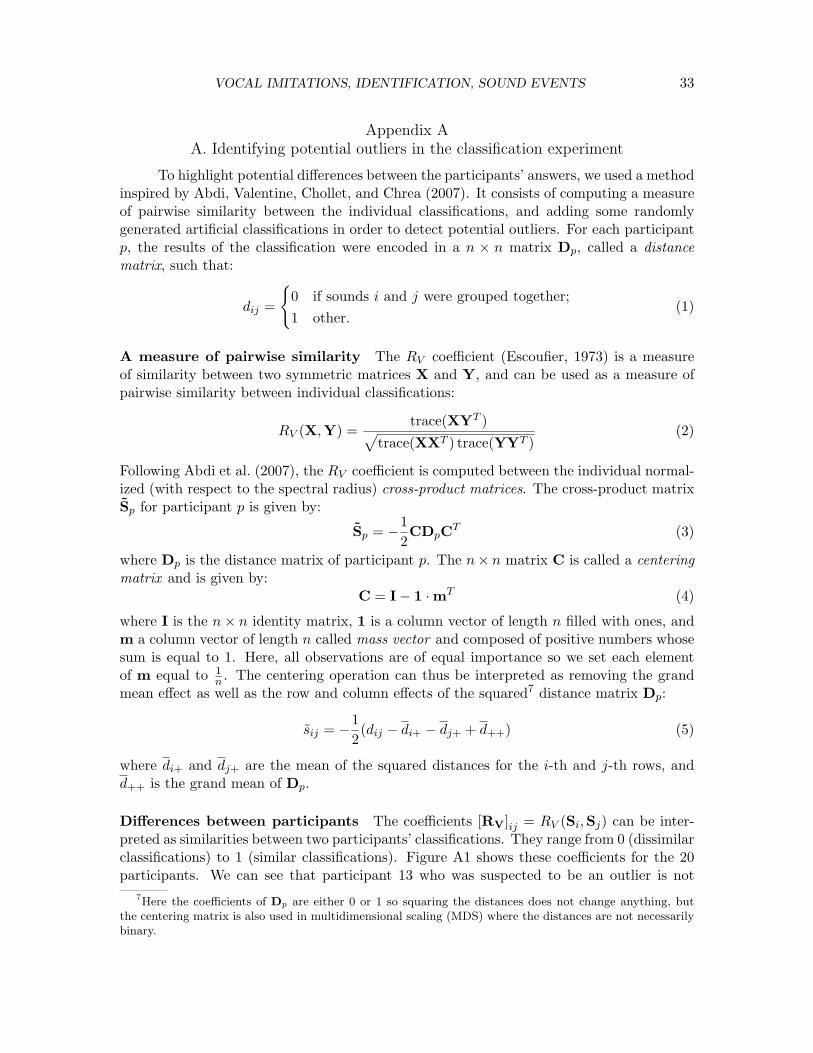
VOCAL IMITATIONS, IDENTIFICATION, SOUND EVENTS 33
Appendix A
A. Identifying potential outliers in the classification experiment
To highlight potential differences between the participants’ answers, we used a methodinspired by Abdi, Valentine, Chollet, and Chrea (2007). It consists of computing a measureof pairwise similarity between the individual classifications, and adding some randomlygenerated artificial classifications in order to detect potential outliers. For each participantp, the results of the classification were encoded in a n × n matrix Dp, called a distancematrix, such that:
dij =
{
0 if sounds i and j were grouped together;
1 other.(1)
A measure of pairwise similarity The RV coefficient (Escoufier, 1973) is a measureof similarity between two symmetric matrices X and Y, and can be used as a measure ofpairwise similarity between individual classifications:
RV (X,Y) =trace(XYT )
√
trace(XXT ) trace(YYT )(2)
Following Abdi et al. (2007), the RV coefficient is computed between the individual normal-ized (with respect to the spectral radius) cross-product matrices. The cross-product matrixSp for participant p is given by:
Sp = −1
2CDpC
T (3)
where Dp is the distance matrix of participant p. The n× n matrix C is called a centeringmatrix and is given by:
C = I − 1 · mT (4)
where I is the n × n identity matrix, 1 is a column vector of length n filled with ones, andm a column vector of length n called mass vector and composed of positive numbers whosesum is equal to 1. Here, all observations are of equal importance so we set each elementof m equal to 1
n. The centering operation can thus be interpreted as removing the grand
mean effect as well as the row and column effects of the squared7 distance matrix Dp:
sij = −1
2(dij − di+ − dj+ + d++) (5)
where di+ and dj+ are the mean of the squared distances for the i-th and j-th rows, andd++ is the grand mean of Dp.
Differences between participants The coefficients [RV]ij = RV (Si,Sj) can be inter-preted as similarities between two participants’ classifications. They range from 0 (dissimilarclassifications) to 1 (similar classifications). Figure A1 shows these coefficients for the 20participants. We can see that participant 13 who was suspected to be an outlier is not
7Here the coefficients of Dp are either 0 or 1 so squaring the distances does not change anything, butthe centering matrix is also used in multidimensional scaling (MDS) where the distances are not necessarilybinary.

VOCAL IMITATIONS, IDENTIFICATION, SOUND EVENTS 34
Participants
Partic
ipants
� �� �� �� �� ��� � � ��
�
�
�
�
��
��
��
��
��
��
Figure A1 Representation of the RV coefficients representing the similarities between the partici-pants.
similar to any of the other participants. Participant 5 also does not seem similar to theother participants. To assess the amount of dissimilarity between potential outliers andother participants, we added randomly generated classifications in the same proportion asthe number of participants, and submitted the RV coefficients to a principal componentanalysis (PCA). The generation of each random classification followed the following proce-dure:
1. We selected the maximum number Nmax of classes made by drawing uniformly anumber between 2 and 10;
2. We assigned each sound i to a class Ci by drawing uniformly the class numberbetween 1 and Nmax;
3. We computed the corresponding cooccurrence matrix to represent the classification.
The results of the PCA with real and random participants are represented in FigureA2 using the two principal components. In this two-dimensional map, the signs of thecoordinates are globally arbitrary for a given axis, meaning that they can be all reversed

VOCAL IMITATIONS, IDENTIFICATION, SOUND EVENTS 35
simultaneously, since they only depend on the choice of the corresponding unit eigenvectorin the PCA which can be chosen uniquely up to the sign. On the first principal component,all coordinates have the same sign, chosen positive by convention, as a result of Perron-Frobenius theorem. Interestingly, the RV coefficient between participants i and j can beapproximated by [RV]ij ≈ xixj + yiyj where xkand yk are the coordinates of participant krespectively on the x- and y-axis. The map thus helps to quantify the amount of dissimilaritybetween potential outliers and other participants. For example, participant 13 is almost asdissimilar to the other participants as to the random ones, and was thus considered as anoutlier whereas participant 5 was not.
Besides detecting outliers, we also tried to highlight different strategies across theparticipants. To this aim, we represented the similarities between the participants in a 3-dimensional metric Euclidean space, by applying a multi-dimensional scaling (MDS) analy-sis to the RV matrix. This did not allow us to distinguish any systematic difference betweenthe participants. As a result only the participant 13 was excluded from following analyzes.
0 0.2 0.4 0.6 0.8
-0.4
-0.3
-0.2
-0.1
0
0.1
0.2
0.3
P1
P2
P3
P4P5
P6
P7
P8
P9
P10
P11
P12
P13
P14
P15
P16
P17
P18
P19P20
R1
R2R3
R4
R5
R6
R7
R8
R9
R10
R11
R12
R13R14
R15
R16
R17
R18
R19
R20
Figure A2 Representation of the distances between the participants’ classification (RV) on the twoprincipal components of the PCA, with the real participants (P) and random participants (R).

VOCAL IMITATIONS, IDENTIFICATION, SOUND EVENTS 36
Appendix B
B. Hierarchical clustering and inconsistency
The averaged distance matrice D (averaged over all individual matrics Dp) was sub-mitted to a hierarchical clustering analysis, which represents the average classifications ina dendrogram. In such a representation, the average distance between two items (here twosounds) is represented by the fusion level linking the two items.
To identify significant clusters in a dendrogram, the dendrogram is usually cut at agiven fusion level. As an alternative clustering method, we used a threshold of inconsistency.The advantage of the inconsistency coefficient is to emphasize compact subclasses that wouldnot be revealed using the fusion level. The inconsistency coefficient characterizes a givennode by comparing its fusion level with the respective fusion levels of its non-terminalsubnodes:
inconsistency =fusion level − µd
σd
(6)
where µd and σd are respectively the mean and the standard deviation of the fusion levels ofthe d highest non-leaf subnodes. The depth d specifies the maximum number of subnodesto include in the calculation. The maximum number is used if there are enough subnodes,and in this case, the highest subnodes are included. Otherwise, all subnodes are included.The inconsistency coefficient is positive, having a value set to 0 for leaf nodes. Setting athreshold of inconsistency allows one to highlight compact clusters, and to lay aside soundsthat do not form any mathematically compact cluster. A cluster is considered as compactwhen no subcluster cannot be identified. Figure B1 illustrates a typical example wheresetting a threshold of inconsistency (1.5) allows one to highlight two compact clusters andto distinguish them from adjacent items that do not display any specific clustering pattern.In this particular example, setting a threshold of fusion level would not have allowed oneto isolate these clusters from the other items.

VOCAL IMITATIONS, IDENTIFICATION, SOUND EVENTS 37
�
���
���
���
���
���
���
���
���
Compact cluster Compact clusterNon�clustered items
����
��������
����
����
��������
����
����
������������
����
Figure B1 In this virtual example, setting a threshold of inconsistency (1.5) allows to highlight thecompact clusters of blue and yellow items. Distinguishing these two clusters from the other itemswould not have been possible by cutting the dendrogram at a given fusion level. The figures on thedendrogram represent the inconsistency of each node.