Embed Size (px)
Citation preview

Visualizing Financial Information Quality Using Heat Maps and Semantic Data Quality Rating System ABSTRACT Government regulators and investors in the global capital markets rely heavily on reported financial data and place implicit trust in the integrity and quality of this information. This financial data enters the information supply chain as manually processed data as company quarterly and annual filings. An intense focus on outlier data is of great interest as a potential compliance issue and as arbitrage opportunity for investment, also called alpha. Unfortunately, distinguishing between poor quality and valid outlier data is difficult for computers and requires manual screening. Given the vast amount of data it's also prone to human errors. We present a case study, where we applied business rules driven information quality ratings to automatically tag semantic data quality rank to each information element. Aggregated quality rank displays outliers as hot spots on heat maps enabling greater transparency and insights. BIOGRAPHY Ashu Batnagar Chief Executive Officer Good Morning Research Ashu Bhatnagar is CEO of Good Morning Research, a Softpark company that specializes in building Semantic XBRL technology for Wall Street banks, hedge funds and government regulators in USA, UK, and India. Mr. Bhatnagar has over ten years of experience in working at Wall Street banks as product manager, and before that for fifteen years in the computer industry as VLSI designer, software product manager and Internet entrepreneur. Mr. Bhatnagar also taught Advanced VLSI Design and Supercomputer Architectures courses at graduate level as adjunct professor at University of Massachusetts, Lowell. Mr. Bhatnagar has an undergraduate degree in Electrical Engineering from Indian Institute of Technology, Roorkee, and Masters in EE from University of Rhode Island. He also studied as a graduate student at MIT in the area of Advanced VLSI Design. Mr. Bhatnagar has presented papers at International Conferences on Data Quality, Semantic Technology and W3C/FDIC Workshop on XBRL.
The Fifth MIT Information Quality Industry Symposium, July 13-15, 2011
308
1
Copyright © 2011. GoodMorningResearch.com – A Softpark Company
Visualizing Financial Information QualityUsing Heat Maps and
Semantic Data Quality Rating System
Ashu Bhatnagar
Founder, CEO GoodMorningResearch.com, and
FreeXBRLonline.com
Copyright © 2011. GoodMorningResearch.com – A Softpark Company
Disclosures: This presentation is not an offer to buy or sell any security or to participate in any trading strategy. All of the sample data and information in this presentation are based on public information and modified from the original sources for this study. While every effort was made to use reliable and comprehensive information, we do not represent that it is accurate or complete. All third-party trademarks, service marks and copyrights in this presentation belong to their respective owners.
Special Acknowledgement: To Colin Ritchie, portfolio manager at an Australian hedge fund for his contributions to the case study. In particular, his use of visualization tools – RitchViewerTM for analytics and ResearchPointTM for heat map display of underlying data quality based on semantic ratings. The case study demonstrates the visualization of data quality in a realistic-day-in-the-life of a hedge fund manager.
The Fifth MIT Information Quality Industry Symposium, July 13-15, 2011
309
2
Copyright © 2011. GoodMorningResearch.com – A Softpark Company
Objectives:
Contribute to the research on Information Quality in the area of
capital markets financial data
Describe challenges and opportunities
Describe a practice-oriented solution using semantic tagging of an
algorithmically assigned Data Quality Score as linked metadata
Present a case study for visualizing data quality based on semantic
ratings and displayed as heat maps for fast drill-down analysis.
Copyright © 2011. GoodMorningResearch.com – A Softpark Company
Data Quality - Challenges
The Fifth MIT Information Quality Industry Symposium, July 13-15, 2011
310

3
Copyright © 2011. GoodMorningResearch.com – A Softpark Company
Financial Data is a Multi Dimensional Hypercube
Financial Information Set
Financial Report
Information Grouping
MeasureRelationships
Fact
Measure Value (of Fact)
Has
Has
Has Has
Has Has
Courtesy: Charlie Hoffmanhttp://xbrl.squarespace.com/xbrl-for-dummies/
Dimensions:
• Company• Period• Metric• Currency• As-Reported• Forecasted• Scale• Audited. . .
Copyright © 2011. GoodMorningResearch.com – A Softpark Company
Consider the spreadsheet (here). It takes
you only a moment to work out that the item
surrounded by the blue square is 16,000 in
Tangible Assets for the 2002/2003 financial
year. You worked that out by synthesizing all
of the context that surrounds that blue square.
Now think about the way a computer might
digest the contents of the blue square.
At best, the computer will know that the
Number 16,000 appears at cell reference C8.
At worst, it will just know "16,000".
XBRL allows systems to communicate the
entire context that a human needs to fully
understand a concept.
Challenge 1: Data has little meaning without Context
Source: http://www.kpmg.com/xbrl/context.asp
The Fifth MIT Information Quality Industry Symposium, July 13-15, 2011
311

4
Copyright © 2011. GoodMorningResearch.com – A Softpark Company
Acquire raw data, build models, develop forecasts,Manually Tag and upload financial Models toproprietary databases
Search many databases, co-mingle and massagedifferent data formats and then develop Compsand Screens under severe time pressures
Develop and distribute analytics and Alpha insightsto Buy-side clients, Traders and InvestmentBankers under business critical time pressures
ManualProcess
ManualProcess
ManualProcess
Help!“biggest frustration is the turnaround time . . .”
Analyst at a top Wall Street firm
Challenge 2: Raw Data Quality Forces Manual Scrubbing Research Analysts Work-flow
Copyright © 2011. GoodMorningResearch.com – A Softpark Company
StrategicView
Filers/Companies
Data Providers/Sell-side Analysts
Buy-sideAnalysts
Data Information Analysis Insights
Long Tail of Data OrganizationWorld of Accounting
(GAAP)
50 to 100 common Financial Metrics for
• Income Statement• Balance Sheet• Cash-flow
World of Analysts(Industry Specific Taxonomies)
World of Investors(Folksonomy)
Additional Unlimited, unstructured ‘localized’synonyms for many Financial Metrics for
• compliance with country-specific regulators• proprietary financial modeling frameworks• lack of any appropriate metrics in GAAP or readily available taxonomies, resulting in –Line 6 Items on 10-K, MDAs, and Footnotes
Long Tail View
Wiki-TaggedData
OrganizationProcess
Additional 2,000 + unique Financial Metrics for
• Financial Modeling• Valuation• Forecasts,• Trading Strategies
SEC Filings (10-K/10Q) Earnings / Call Reports
Annual Reports
Valuation/Forecast Models
Stock Recommendations
Consensus Estimates
Trading Strategies
Data Aggregators
Ratings
Screeners
Comps Back - Test
Portfolio Construction
Risk Management
Investor Presentations
Challenge 3: Diversity of Semantics
The Fifth MIT Information Quality Industry Symposium, July 13-15, 2011
312

5
Copyright © 2011. GoodMorningResearch.com – A Softpark Company
Current Data
Mid Cap
Small Cap
Historical Data Analysts Forecasted Data
Large Cap
2009200820072006 201220112010 201520142013 2016
70,000 + Listed Companieson 40+ Exchanges Globally
HIGHLOWLOW
LOW
Wall Street Data TypesReference Data
Company Fundamental DataHistorical Data
Sell-side Research DataHold-bin (unpublished) Data
Analyst Forecasted DataAs Reported DataAudited 10-K Data
UnAudited 10-Q Data Company Revised Data
Sector DataIndustry Data
Economic Data Analyst Adjusted Data
Consensus Data Cross-Asset Class Data
Fixed Income DataMarket/Trading Data
Quantity Quality(Sample representation of Data at different firms)
Challenge 4: Quantity & Quality of Data (Cost & Time Issue) Availability of Data for Institutional Investors
Copyright © 2011. GoodMorningResearch.com – A Softpark Company
Challenge 5: Distinguishing Data Error from Alpha Opportunity?
The Fifth MIT Information Quality Industry Symposium, July 13-15, 2011
313

6
Copyright © 2011. GoodMorningResearch.com – A Softpark Company
A Practice-Oriented Solution Using
Semantic Tagging For Data Quality Ranking
And
Heat Map Visualization
Copyright © 2011. GoodMorningResearch.com – A Softpark Company
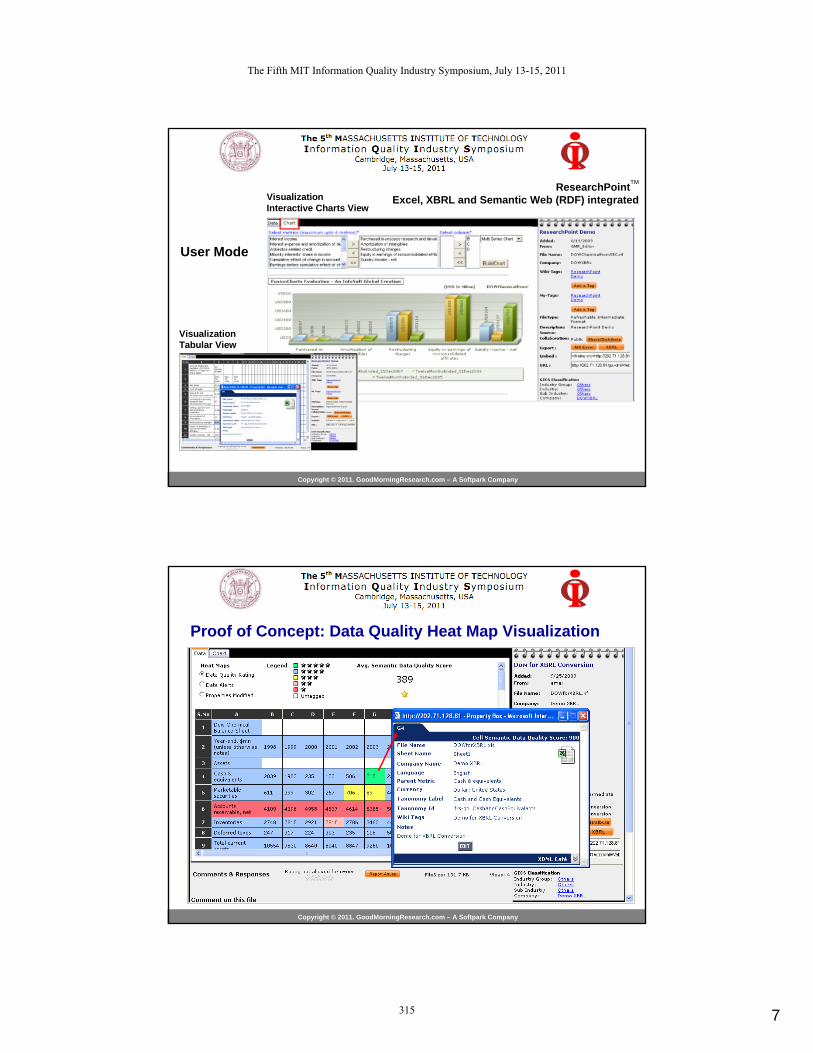
ResearchPointTM
Excel, XBRL and Semantic Web (RDF) integrated
Login
• Select Excel or XBRL file
• Select Taxonomy
• Tag, Review, Comment, Edit,
• Analyze, Chart, Share,
• Save as XBRL-Tagged-RDF in SQL Database
Upload to Web
Author Mode
The Fifth MIT Information Quality Industry Symposium, July 13-15, 2011
314
7
Copyright © 2011. GoodMorningResearch.com – A Softpark Company
VisualizationTabular View
VisualizationInteractive Charts View
User Mode
ResearchPointTM
Excel, XBRL and Semantic Web (RDF) integrated
Copyright © 2011. GoodMorningResearch.com – A Softpark Company
Proof of Concept: Data Quality Heat Map Visualization
The Fifth MIT Information Quality Industry Symposium, July 13-15, 2011
315

8
Copyright © 2011. GoodMorningResearch.com – A Softpark Company
Data Quality Rating Implementation
StandardTaxonomy
QualityRatingSet-up
Rules
Attributes
Think:FICO Scorefor Data
Copyright © 2011. GoodMorningResearch.com – A Softpark Company
Case Study: A day-in-the-life of a Hedge Fund Manager
The Fifth MIT Information Quality Industry Symposium, July 13-15, 2011
316

9
Copyright © 2011. GoodMorningResearch.com – A Softpark Company
As part of stock Analysis, Portfolio Managers and Analysts:
Read company accountsRead Trade Magazines, & News FeedsRead Broker ResearchIndustry AnalysisPeer ComparisonMacro DriversTriggers: (What will cause change)Basic FinancialsDetailed Financials (Model)
This is a day-in/day-out cycle.
Case Study: A day-in-the-life of a Hedge Fund Manager
Copyright © 2011. GoodMorningResearch.com – A Softpark Company
Current Data
Mid Cap
Small Cap
Historical Data Analysts Forecasted Data
Large Cap
2009200820072006 201220112010 201520142013 2016
70,000 + Listed Companieson 40+ Exchanges Globally
HIGH
LOW
LOW
Wall Street Data Types
Reference Data
Company Fundamental Data
Historical Data
Sell-side Research Data
Hold-bin (unpublished) Data
Analyst Forecasted Data
As Reported Data
Audited 10-K Data
UnAudited 10-Q Data
Company Revised Data
Sector Data
Industry Data
Economic Data
Analyst Adjusted Data
Consensus Data
Cross-Asset Class Data
Fixed Income Data
Market/Trading Data
Quantity Quality
(Sample representation of Data at different firms)
Company Accounts
Trade Magazines
News Feeds
Day-in/day-out cycle
Peer Comparison
Financial Model
Read company accounts Read Trade Magazines, & News Feeds
Broke
r Res
earch
Industry AnalysisMac
ro D
rivers
Basic Financials
Quality = Mixed
The Fifth MIT Information Quality Industry Symposium, July 13-15, 2011
317

10
Copyright © 2011. GoodMorningResearch.com – A Softpark Company
Trigger: Guinness World Records, the global authority on record
breaking, today confirm that the Company XYZ product
is the Fastest-Selling Consumer Electronics Device.
The sales figures outstrip both the iPhone and the iPad
for the equivalent periods after launch.
March 2011
Copyright © 2011. GoodMorningResearch.com – A Softpark Company
Start Analysis: So the Fund Manager wants to look at a Model in more detail.
At the Model stage, the choice for a Fund Manager is to build and maintain an internal model, or reach out to a favourite Sell-side analyst(s) and obtain their latest model. RitchViewerTM FinancePack Screen shots: Courtesy Colin Ritchie
The Fifth MIT Information Quality Industry Symposium, July 13-15, 2011
318

11
Copyright © 2011. GoodMorningResearch.com – A Softpark Company
Analysis for Alpha: To extract ‘alpha’ from the model, the Portfolio Manager needs to work through many components of the accounts being presented.
In this example, we are examining the Analysts’supplied Discounted Cash Flow Analysis.
A company’s value can be described as the sum of all future cash flows discounted back to today’s value.
Valuation = fcfY1/(1-dr) + fcfY2/(1-dr)^2 + … + fcfYn/(1-dr)^n-1where:fcf = Free Cash Flow, and dr = Discount Rate
Copyright © 2011. GoodMorningResearch.com – A Softpark Company
Model forecasts growth in revenue from 2009 to 2020.
Revenue growth rate is falling away from double-digit in historic years to <2% by 2020.
Analysis (walk-thru-the-data):
EBIT growing from 2010 to 2020; and as importantly as a function of Sales Revenue.
EBIT Margin (EBIT/Revenue) looks to be fairly constant over the forecast years.
So far the data looks reasonable
The Fifth MIT Information Quality Industry Symposium, July 13-15, 2011
319

12
Copyright © 2011. GoodMorningResearch.com – A Softpark Company
Analysis (walk-thru-the-data):
Model shows Depreciation of Assets growing (LHS), and
As a function of Revenue (RHS line-chart)
Capex to Revenue however looks oddas the model shows it taking until2016 for the Capex spend to get back to 2009 levels – even though Revenue is growing!
Copyright © 2011. GoodMorningResearch.com – A Softpark Company
Analysis (walk-thru-the-data):
Switching charts to depict Capex as a percentage of Revenue, we see the modelis forecasting a step-down in future capex – even though we know that Company XYZ is investing to keep up with the competition.
Typically this item is a function of the rate the company is depreciating its assets (Capex/Depn) or a rate against future Revenue (Capex/Revenue)
The Fifth MIT Information Quality Industry Symposium, July 13-15, 2011
320

13
Copyright © 2011. GoodMorningResearch.com – A Softpark Company
Moving down to Working Capital, we see a real issue with the data.
Working Capital is a function of the Capital that is need to be set aside for the Increase in Accounts Payable, Accounts Receivable, and Inventory that goes with any increase in Revenue.
Yet the Model has this data falling to zero in 2013.
Drill-downAnalysis
Copyright © 2011. GoodMorningResearch.com – A Softpark Company
For a company like Company XYZ, this item is probably less noticed than an Industrial widget maker. A quick calculation shows a 6% impact on valuation by having this number missing.
Now 6% may not appear much, but Finance Theory tells us that extracting true Alpha for a stock like Company XYZ is difficult due to the breadth of analyst’s coverage.
If we take a group of 28 Analysts in the Market we find that the Coefficient of Variation is only 2.7% for 2011. This means the 6% impact on valuation is around double one standard deviation from the mean of Analysts estimates.
Quantifying the Problem and its Impact:
The Fifth MIT Information Quality Industry Symposium, July 13-15, 2011
321

14
Copyright © 2011. GoodMorningResearch.com – A Softpark Company
Rather than walking through the Analysts model, a slow and tedious process, we upload the Excel model to ResearchPointTM and examine the quality of the Balance Sheet via semantic ratedData Quality Heat Map.
Visualizing Financial Information Quality Using Heat Maps and Semantic Data Quality Rating System
Key finding: Quickly we find that the Balance Sheet is only forecast to 2013,where as the Discounted Cash Flow relies on Data to 2020.
Copyright © 2011. GoodMorningResearch.com – A Softpark Company
Given this knowledge, the Fund Manager is left with several
choices –
a) Source a new model, or
b) rework the Working Capital component of the Discounted Cash
Flow extrapolating from Sales using Debtor Days, Creditor Days,
and Days Inventory.
In the case, the Fund Manager chose the later and discovered the
6% impact on valuation due to missing data.
Case Study Conclusion: A day-in-the-life of a Hedge Fund Manager
The Fifth MIT Information Quality Industry Symposium, July 13-15, 2011
322

15
Copyright © 2011. GoodMorningResearch.com – A Softpark Company
In Conclusion:Automated Semantic Ratings Enables Next Level of Data Quality Visualization – Faster!
Current Data
Mid Cap
Small Cap
Historical Data Analysts Forecasted Data
Large Cap
2009200820072006 201220112010 201520142013 2016
70,000 + Listed Companieson 40+ Exchanges Globally
HIGHLOWLOW
LOW
Wall Street Data TypesReference Data
Company Fundamental DataHistorical Data
Sell-side Research DataHold-bin (unpublished) Data
Analyst Forecasted DataAs Reported DataAudited 10-K Data
UnAudited 10-Q Data Company Revised Data
Sector DataIndustry Data
Economic Data Analyst Adjusted Data
Consensus Data Cross-Asset Class Data
Fixed Income DataMarket/Trading Data
Quantity Quality(Sample representation of Data at different firms)
Copyright © 2011. GoodMorningResearch.com – A Softpark Company
Thank you
Ashu Bhatnagar
Email: [email protected]
The Fifth MIT Information Quality Industry Symposium, July 13-15, 2011
323