Embed Size (px)
Citation preview
Visualizing Epigenetics: CurrentAdvances and Advantages in
HDAC PET Imaging TechniquesThe Harvard community has made this
article openly available. Please share howthis access benefits you. Your story matters
Citation Wang, C., F.A. Schroeder, and J.M. Hooker. 2014. “VisualizingEpigenetics: Current Advances and Advantages in HDAC PETImaging Techniques.” Neuroscience 264 (April): 186–197.doi:10.1016/j.neuroscience.2013.09.018.
Published Version doi:10.1016/j.neuroscience.2013.09.018
Citable link http://nrs.harvard.edu/urn-3:HUL.InstRepos:33471148
Terms of Use This article was downloaded from Harvard University’s DASHrepository, WARNING: This file should NOT have been available fordownloading from Harvard University’s DASH repository.

REVIEW
VISUALIZING EPIGENETICS: CURRENT ADVANCES ANDADVANTAGES IN HDAC PET IMAGING TECHNIQUES
C. WANG, a F. A. SCHROEDER a,b AND J. M. HOOKER a*
aAthinoula A. Martinos Center for Biomedical Imaging, Department
of Radiology, Massachusetts General Hospital, Harvard
Medical School, Charlestown, MA 02129, United States
bCenter for Human Genetic Research, Department of Psychiatry,
Massachusetts General Hospital, Harvard Medical School, Boston,
MA 02114, United States
Abstract—Abnormal gene regulation as a consequence of
flawed epigenetic mechanisms may be central to the initia-
tion and persistence of many human diseases. However,
the association of epigenetic dysfunction with disease and
the development of therapeutic agents for treatment are
slow. Developing new methodologies used to visualize
chromatin-modifying enzymes and their function in the
human brain would be valuable for the diagnosis of brain
disorders and drug discovery. We provide an overview of
current invasive and noninvasive techniques for measuring
expression and functions of chromatin-modifying enzymes
in the brain, emphasizing tools applicable to histone deace-
tylase (HDAC) enzymes as a leading example. The majority
of current techniques are invasive and difficult to translate
to what is happening within a human brain in vivo. However,
recent progress in molecular imaging provides new, nonin-
vasive ways to visualize epigenetics in the human brain.
Neuroimaging tool development presents a unique set of
challenges in order to identify and validate CNS radiotracers
for HDACs and other histone-modifying enzymes. We sum-
marize advances in the effort to image HDACs and HDAC
inhibitory effects in the brain using positron emission
tomography (PET) and highlight generalizable techniques
that can be adapted to investigate other specific compo-
nents of epigenetic machinery. Translational tools like neu-
roimaging by PET and magnetic resonance imaging provide
the best way to link our current understanding of epigenetic
changes with in vivo function in normal and diseased
brains. These tools will be a critical addition to ex vivometh-
ods to evaluate – and intervene – in CNS dysfunction.
This article is part of a Special Issue entitled: Epigenetics
in Brain Function. � 2013 IBRO. Published by Elsevier Ltd.
All rights reserved.
Key words: epigenetics, chromatin, brain, imaging, probes,
translation.
Contents
Introduction 186
Expression: visualizing evidence of protein presence 187
Invasive imaging: visualizing epigenetic targets in the ex vivo
brain (Table 1) 188
Noninvasive techniques for measuring epigenetic expression in
the brain 190
Function: visualizing the role of a protein in regulating biological
activity 193
Invasive measurement of enzyme function 193
Noninvasive measurement of HDAC activity 194
Conclusion 195
Acknowledgement 196
References 196
INTRODUCTION
An overarching goal in basic neuroscience research is to
develop knowledge and techniques that can be extended
from model systems to the living human brain.
Translational tools that can visualize brain function and
biochemical events are particularly useful because they
can provide insight into the brain as it responds to
external cues (e.g. environment, drug, and behavior).
Visualizing brain function is a major challenge given that
the human brain is inaccessible and difficult to assay
directly. Currently, noninvasive imaging tools provide the
best way to visualize changes in vivo. Importantly, the
same in vivo techniques can be used to visualize
changes in animal models and in humans, a major
translational advantage. This holds promise for great
returns in integrating existing knowledge with
observations from an intact, living brain.
In the past decade, epigenetics research has provided
new insight into almost all aspects of biology – cellular
differentiation, growth, development, and aging (Fass
et al., 2012). Changes in DNA methylation and post-
0306-4522/13 $36.00 � 2013 IBRO. Published by Elsevier Ltd. All rights reserved.http://dx.doi.org/10.1016/j.neuroscience.2013.09.018
*Corresponding author. Address: Athinoula A. Martinos Center forBiomedical Imaging, Building 149, 13th Street, Suite 2301, Charles-town, MA 02129, United States. Tel: +1-617-726-6596; fax: +1-617-726-7422.
E-mail address: [email protected] (J. M. Hooker).Abbreviations: AD, Alzheimer’s disease; BBB, Blood–brain barrier;BLT, fluorinated lysine derivative Boc-Lys-(Tfa)-OH; BOLD, bloodoxygen level dependent; ELISA, enzyme-linked immunosorbentassays; FACE, fluoroacetate; FAHA, 6-(fluoroacetamido)-1-hexanoicanilide; fMRI, functional magnetic resonance imaging;HDAC, histone deacetylase; IHC, immunohistochemistry; I.P.,immunoprecipitation; MRI, magnetic resonance imaging; mRNA,messenger RNA; MRS, magnetic resonance spectroscopy; NAD+,nicotinamide adenine dinucleotide; PET, positron emissiontomography; phMRI, pharmacologic magnetic resonance imaging;qPCR, quantitative polymerase chain reaction; SAHA, suberoylanilidehydroxamic acid; TSA, trichostatin A.
Neuroscience 264 (2014) 186–197
186

translational modification of histone proteins modulate
gene expression. These gene expression changes alter
diverse signaling pathways in the brain, and impact
brain activity from neurotransmission to functional output
at the level of behavioral response. Investigation of
epigenetic changes in the brain has provided fresh
perspective into the mediators of diverse CNS disorders
as well as potential targets in developing improved
treatments (Hasan et al., 2013). In this review, we
highlight ways to visualize epigenetic changes in the
brain and emphasize the development of in vivo
neuroimaging tools using the histone deacetylase
(HDAC) enzymes as an example. While this review
focuses on HDACs due to their progressed stage in
in vivo tool development, the themes presented herein
are no less applicable to other targets and processes.
Even with the progress made in HDAC imaging, there is
much ground left to cover before we can truly link
epigenetics and function in the human brain.
There are two main ways to think about imaging an
epigenetic target in the brain: direct observation and
functional/indirect observation and we have divided our
review into these themes (Fig. 1). To this end, the
imaging target in the brain could be an epigenetic
‘machine’ – one of the ‘readers,’ ‘writers’ or ‘erasers’ of
epigenetic change (Fass et al., 2012). Alternatively, the
target could also be an epigenetic ‘mark’ – a
modification of a protein or nucleic acid resulting from
epigenetic enzyme action. Direct observation has the
advantage of providing detailed information on a protein
target independent of its activity. This is useful as an
enzyme may have a structural as well as functional role
regulating brain function and this protein presence can
be measured by visualizing a specific, tight-binding
ligand. One obvious drawback to direct observation is
that the assumption is made that enzyme density is
related to activity and that the inferred activated
changes neural processing (in a phenotypic way).
However, using techniques in functional observation, the
impact of a protein or enzyme on brain function can be
visualized. Catalytic action on a labeled enzyme
substrate or differential binding of established
neuroimaging probes can provide a surrogate measure
of changes in brain activity with robust spatial and
temporal resolution. These methods reveal where an
enzyme is working as well as the regions of the brain
that integrate downstream signaling changes.
Evidence from human postmortem brain and animal
models has indicated that dysregulation of chromatin-
modifying enzymes may play a key role in the
transcriptional changes thought to underlie diseases
including neurodegenerative disorders, schizophrenia,
depression, mood-dysregulation and addiction. This
includes enzymes that control DNA methylation, as well
as acetylation, methylation and phosphorylation of
histone proteins.
In this review, we provide an overview of invasive
methodologies that have been used to visualize and
understand the biological role of chromatin-modifying
enzymes. A major gap exists between these methods
and evaluating how the same enzymes are expressed
and function in living human brain. Noninvasive
neuroimaging has revolutionized our understanding of
brain function. Modalities including positron emission
tomography (PET), and magnetic resonance imaging
(MRI) provide a window into the physical and
biochemical changes evident in vivo. Depending on the
nature of the PET radiotracer or MRI pulse sequence,
these techniques can be used to probe structure,
function, neurochemistry, or drug pharmacokinetics.
Combining this information with what has already been
determined about chromatin changes and their role in
biology can provide new insight into the role of
epigenetics in the brain. To this end, we highlight recent
advances in neuroimaging epigenetic regulation and
provide discussion on the challenge to develop imaging
tools to visualize chromatin-modifying enzyme
expression and function in the brain.
Expression: visualizing evidence of protein presence
In order understand how epigenetic enzymes may alter
function in the CNS, an important first step is to
investigate the distribution of each enzyme subtype
throughout the brain. This can be done using invasive or
noninvasive methods. The methods we highlight are
well established in basic neuroscience research and can
be used to investigate conceivably any epigenetic
enzyme. As an example, we focus on the HDAC family
of enzymes. This family formally comprises subtypes
from class I (HDAC 1,2,3 and 8); class IIa (HDAC
Fig. 1. Epigenetic imaging techniques can be used to visualize the
presence of chromatin-modifying enzymes as well as their function in
modulating transcription and brain activity. In the first portion of this
review, we discuss a range of ex vivo methods requiring brain
removal and homogenization with can resolve details of chromatin
modification on the order of nucleic acid enrichment and resolution of
subcellular expression (�10�8–10�6 m in resolution). We further
review efforts that can evaluate the expression and activity of
epigenetic modifiers in intact tissue from histology to autoradiogra-
phy. In the second half of the review, we highlight radioactive
chemicals that have been adapted for neuroimaging in rodent and the
potential to translate this work into human (10�3–10�2 m in resolu-
tion). Further, we provide details on optimizing probe development
design, which has progressed for the histone deacetylaseenzyme
family, but is generalizable for creating epigenetic radioligands for
any chromatin-modifying enzyme.
C. Wang et al. / Neuroscience 264 (2014) 186–197 187

4,5,7,9); class IIb (HDAC 6,10); class III (the sirtuins,
SIRT1–7); and class IV (HDAC11). Each class is
defined in part on homology to yeast enzymes and
cellular localization. Additionally, class I, II and IV
HDACs are separated from class III ‘sirtuins’ as the
sirtuins require NAD+ as an energy source and do not
respond to the prototypical HDAC inhibitor, trichostatin
A (TSA). As convention, these subgroups are thus
referred to as ‘sirtuins’ and ‘HDACs’.
Invasive imaging: visualizing epigenetic targets in the
ex vivo brain (Table 1). In situ hybridization and tran-
script measurement. The central dogma of biochemistry –
RNA toDNA to protein – provides a fundamental base from
which to evaluate messenger RNA (mRNA) levels as a
surrogate for direct measurement of translated proteins.
In situ hybridization measures the binding of radioisotope-
or fluorescent-labeled probes to a histological brain
section. Investigating regional transcript expression
differences by in situ hybridization allows novel targets to
be evaluated without the need for specific antibodies,
which can be time consuming and expensive to generate.
Major advantages of in situ include the ability to create
highly-specific oligomeric probes quickly at low cost, as
well as the benefit of visualizing probe binding to tissue
sections without destroying cellular/neuroanatomical
organization although each probe must be carefully
validated and optimized to ensure binding stringency.
(Broide et al., 2007; Janssen et al., 2010).
Comprehensive investigation of HDAC expression in
the brain has only been addressed by few select
reports. For HDAC expression in CNS, beyond early
additions to the Allen Brain Atlas, (Available from: http://
www.brain-map.org. � 2012 Allen Institute for Brain
Science.), the first resource for this information was an
in situ hybridization study of class I, II and IV subtype
expression (Broide et al., 2007). Broide and colleagues
measured HDACs throughout more than 50 regions of
the rat brain (Broide et al., 2007). This painstaking effort
revealed that the expression of HDAC subtypes was
both overlapping and distinct and supported the idea
that HDAC subtypes likely had discernible roles in
regulating brain activity.
Differences in HDAC subtype transcript levels were
investigated in postmortem brain samples from a small
cohort of amyotrophic lateral sclerosis (ALS) patients
and age-matched controls (Janssen et al., 2010) Similar
to the work in rat brain (Broide et al., 2007), the study
led by Janssen is perhaps the only one of its kind to
have examined the expression of each HDAC subtype
comprising class I, II and IV. In this case, quantitative
polymerase chain reaction (qPCR) was used which
provides a highly accurate measure of the amount of
transcript present, however with no anatomical
resolution as in in situ. Nevertheless, Janssen and
colleagues identified robust expression of HDAC 2 and
HDAC 11 in the human brain. As the authors discussed,
a notable difference between the human and rodent
datasets underscores high HDAC2 expression in the
human brain with high HDAC3 expression in the rat
(Broide et al., 2007; Janssen et al., 2010). This
indicates that HDAC2 may play a more predominant
role in modulating brain activity in humans.
Although relatively limited differences were found in
the expression of HDACs in the brain between rodents
and human (Broide et al., 2007; Janssen et al., 2010),
there are obviously major differences between the
species. Indeed, there may be homology in regional
protein expression between rodent and man, however
the context in which functional changes modulate
complex behaviors will likely be impossible to replicate
in any animal model. This supports that tools to
visualize epigenetic changes in humans, including those
changes related to nuanced behaviors encoded by
healthy and diseased brain signaling, will require
neuroimaging in people.
Adapting in situ for noninvasive use in humans is not
likely. There are significant technological hurdles for an
in vivo nucleic acid probe including crossing the blood–
brain barrier (BBB) and surviving degradation in the
bloodstream. Given the readily available alternatives
and the limitations in measuring transcript levels as a
surrogate for protein expression, in situ will likely remain
a useful tool for use in ex vivo systems.
Measurement of protein and mRNA levels ex vivo can
also be done in humans and capture expression
information at the molecular level. However, post-
mortem brain tissue work has limitations including (i)
limited tissue resources, (ii) confounds of post-mortem
interval, (iii) disease state- and (iv) drug treatments at
time of death. These factors can be accounted for using
carefully matched control samples. However, post-
mortem studies can nevertheless only provide data to
Table 1. Methods for visualizing evidence of epigenetic change ex vivo
Method Pros Cons
In situ hybridization � Detects mRNA at mm scale
� Determines in which cells a protein is transcribed
� Does not require antibody
� Detects mRNA, not protein
� Binding of oligo-probe can be non-specific
� Time intense to complete
Reductive immunostain (western, ELISA) � Detects protein
� Measures relative or absolute protein amount
� High throughput/sensitive
� Endogenous anatomy destroyed
� Requires antibody
� Requires tissue dissection
Immunohistochemistry � Potential to multiplex
� Fast to complete
� Neuroanatomy remains intact
� Requires antibody
� Antibody quality often unknown
Autoradiography � Highly sensitive
� Results are quantifiable
� Neuroanatomy remains intact
� Custom radiolabeling expense
� Ligands are not always specific
� Long exposures required for finer resolution
188 C. Wang et al. / Neuroscience 264 (2014) 186–197

be used to help understand disease and design improved
treatments for future patients.
Transcript levels encoding for a protein can be
sensitively measured using qPCR, however this method
typically begins with tissue homogenization. Laser
capture microdissection or cell sorting can be used to
resolve transcript levels at a single-cell or population
level. However coupling these techniques is not
practical from the standpoint of investigating a family of
epigenetic enzymes, such as HDACs, throughout the
brain.
Immunoreactive, reductive methods: immunoblotting,
enzyme linked immunosorbent assays (ELISA) and
immunoprecipitation (I.P.). Perhaps the most common
methods to investigate protein presence are each based
in part on antibody affinity and begin with sample
homogenization. Indeed, established techniques
including Western blotting, ELISA, and I.P. allow
visualization of a protein. A shared drawback, however,
is that samples are homogenized at the outset, thus, the
neuroanatomical detail maintained is limited to the
accuracy of brain tissue dissection. To this point,
subpopulations of cells may differentially express an
epigenetic target within the same brain structure.
However homogenizing whole tissue regions dilutes the
immunoreactive signal and prevents identification of
localized expression differences.
Investigating protein expression using western blotting
rather than a related nucleic acid sequence circumvents
the potential issue that transcript levels may not faithfully
represent protein levels. Western blotting can provide a
relatively fast way to visualize the presence of a protein in
a homogenized sample, accurately resolving molecular
weight. This method is frequently applied to HDAC
proteins in homogenized brain tissue (Zhou et al., 2001;
Mielcarek et al., 2011), developmental HDAC11 (Liu
et al., 2008). A disadvantage here is the dependence on
an antibody raised against the protein of interest to
visualize immunoreactivity. Further, immunoreactive
signal captured from a western blot is at best semi-
quantitative. ELISA utilizes specific antibodies bound to a
substrate to capture proteins from a sample preparation.
Comparing signal generated from an enzymatic reaction
to a within-experiment standard curve is accepted to
provide quantitiative results on the amount of protein in
the sample. Quantitiative ELISA methods have been
adapted into commercially available HDAC kits, however
their application to brain tissue homogenates is likely
bypassed for alternative methods, or assessment of
HDAC function.
We mention here the rich data from I.P. studies
examining the role of HDAC proteins. This methodology
utilizes the same antibodies as in western and ELISA,
and likewise begins with tissue homogenization, thus
neuroanatomy is lost. Nevertheless, this method
uniquely provides information on the physical interaction
of the proteins and nucleic acids co-precipitated with an
antibody against a target protein which can be resolved
with subsequent immunoblotting, qPCR or intense
sequencing and genomic alignment. This was
exemplified by the work of Wang in 2009 demonstrating
the relationship between the localization of HDAC
subtypes and transcriptional regulatory protein across
the genome in a cellular system.
Immunohistochemistry (IHC). Visualizing epigenetic
enzyme expression using histochemical techniques can
provide a high-resolution view of protein presence in the
brain while maintaining neuroanatomy. Further,
visualizing the regional expression patterns of protein
targets co-labeled with colorimetric or fluorescent
markers using high-magnification microscopy can
discriminate protein localization to or neural cell types or
sub-cellular cellular compartments.
In the example of HDAC enzymes, Broide and
colleagues, as an additional component to their in situwork, used immunolabeling to demonstrate that HDAC
subtypes had preferential expression in either neurons
or glia (Broide et al., 2007). MacDonald and Roskam
extended this in 2008 showing that HDAC subtypes 1
and 2 in mouse brain had differential expression both in
neural cell types and in development. (MacDonald and
Roskams, 2008). This group more recently showed that
HDACs are differentially expressed in neural stem cell
subtypes in mouse and that neural migration and
differentiation are impacted by HDAC inhibitor treatment
(Foti et al., 2013). Takase also investigated HDAC
expression in mouse brain using co-labeling of a
number of neuronal cell types to resolve a new level of
specificity in the expression of class I, II and IV HDAC
subtype expression (Takase et al., 2013). HDAC
expression was recently examined in sections from
non-human primate brain (Yeh et al., 2013) as part
of a non-invasive imaging study on a labeled HDAC
substrate.
Histological techniques are a necessary component in
evaluating pathological differences in clinical samples. To
this end, interpreting the immunoreactive signal depends
heavily on the specificity of antibodies to visualize a
protein of interest. As the tissue remains intact, it is
important to validate at a minimum that the immuno-
reactivity of an antibody corresponds to the expected
molecular weight of a protein target. IHC, like western
blotting, is a semiquantitative approach. As in the cited
examples for HDAC expression, careful scoring can be
applied to evaluate ‘high’ or ‘low’ expression, but are not
a measure of protein concentration.
As with other invasive techniques mentioned
above, IHC has a highly limited potential for in vivotranslation. Indeed, while new methods are being
developed to enhance BBB penetration of antibodies
(Bacskai et al., 2001; Frenkel and Solomon, 2002; Atwal
et al., 2011) the increased uptake is still orders of
magnitude below what would be required for probe
development.
Autoradiography. Autoradiography is a technique
closely related to IHC. Compared to IHC, a major
advantage of autoradiography is the incorporation of a
C. Wang et al. / Neuroscience 264 (2014) 186–197 189

radiolabel to visualize the binding of a ligand to the protein
target which provides high-resolution, quantifiable results
of protein density and pharmacokinetic properties of the
ligand. The benefit autoradiography offers in a
quantifiable result bears emphasis. The radioactivity
associated with a bound probe can be decay corrected
for time and used to determine the number of molecules
of probe bound. Expressed relative to tissue volume, this
readily provides an absolute measure of protein in any
brain region. The most common isotope used for
autoradiography experiments is tritium (3H) which has a
half-life of �12.5 years. This long half-life is an important
feature and allows radioactive signal to be captured
slowly over the course of weeks to provide fine
anatomical detail from histological sections. Custom
compound labeling with tritium can be applied to almost
any molecule, but is cost intense based in large part on
the cost of tritium itself. Tritium labeled HDAC inhibitors,
particularly those with selectivity for a subset of class I, II
and IV subtypes would be a highly useful tool for ex vivodetermination of the HDAC binding capacity in the brain,
as recently described for HDACs1–3 using the [3H]-
benzamide, CI-994 (Wang et al., 2013b). Indeed, tritiated
acetyl groups have been utilized in biochemical assays to
measure HDAC activity (further described in section two)
but so far only one study has applied this technique to
brain samples (Qiu et al., 2006; Lee et al., 2011). As a
disadvantage, using radiolabeled compounds requires
special training and poses greater safety and workflow
challenges than nonradioactive probes used in IHC.
Further, the issue of non-specific probe binding requires
careful control experiments to provide confidence that the
radioactive signal accurately represents target protein
expression.
Animal models: visualizing genetic disruption. At the
whole-organism level, genetic mutation or disruption of
protein expression can provide a means to visualize the
importance of a protein in basic biological function.
Classical genetics, cre-transgenic and small RNA-
mediated knockdown and viral overexpression have each
been used to begin to clarify the role of HDACs in
modulating brain function. (Guan et al., 2009; Kennedy
et al., 2013; Morris and Monteggia, 2013) Traditional
genetic methods can be time consuming and expensive
and require multiple filial generations to ensure observed
effects are not artefacts of mixed (heterogeneous)
genetic backgrounds or by physical disruption of brain
tissue in focal injection of viral particles. To this end,
optogenetic techniques – gene expression modulated via
stimulation with a specific wavelength of light – hold
immense promise in providing a way to view gene
expression changes in the brain with unprecedented
spatial and temporal control as reviewed elsewhere in
this edition. Likewise, the cutting-edge methods using
CRISPR/Cas systems for rapid genome engineering will
no doubt revolutionize the way in which chromatin-
modifying enzymes are investigated in rodent models,
although their application to HDAC enzymes has not
been examined (Cong et al., 2013; Li et al., 2013; Wang
et al., 2013a).
In any case, genetic models are a critical tool in
visualizing the influence of protein expression on brain
function and remain an important part of investigating
epigenetics in the CNS. A drawback to these techniques
is that altered expression of chromatin-modifying
enzymes changes both the function and expression of
the target. Thus, it is difficult to interpret whether effects
in a genetic model are the result of structural or
functional change in epigenetic enzymes. Subsequent
characterization of specific brain regions can provide
evidence of epigenetic mechanisms regulating
behavioral response – examples relevant to mood
disorders are highlighted throughout another review in
this special issue of Neuroscience (Fass et al., 2013).
Although in any case, this requires that the brain be
assayed ex vivo, thus limiting the extent to which
analogous work can be done in humans.
Noninvasive techniques for measuring epigeneticexpression in the brain. Numerous efforts have been
made to develop noninvasive tools for imaging
epigenetic modulators which permit detection and
quantification of expression in vivo is critical to assess
the efficacy of therapies targeting epigenetic
mechanisms and to clarify the understanding of the
mechanism of enzyme dysfunction in disease (Table 2).
PET is an excellent tool for the in vivo quantification of
HDAC biological processes and is well-suited to
evaluate the pattern of HDAC distribution in animals and
human. A major advantage of PET as a technique is its
extraordinarily high sensitivity (10�9–10�12 M), much
more than MRI (10�4 M) or magnetic resonance
spectroscopy (MRS) (10�3–10�5 M). PET is also able to
quantify the distribution of radiotracers in the brain
providing in vivo correlates of in vitro measurement
outcomes with invasive techniques such as
autoradiography, IHC and Western immunoblotting.
Importantly, the specificity of PET probes to detect a
particular protein or enzyme of interest cannot be readily
matched by MRI modalities. Therefore, we consider
PET to provide the greatest advantage as an imaging
tool in characterizing protein expression of the highly
related HDAC family members as well as other
chromatin-modifying enzymes.
A PET radiotracer is a chemical in which one atom has
been replaced by positron emission isotopes (e.g.,
carbon-11, half-life of 20.38 min; fluorine-18, half-life of
109.8 min), allowing in vivo characterization and
measurement of biological processes at the cellular and
molecular levels on a timescale of minutes to hours.
The development of a PET radiotracer to visualize
epigenetic enzymes and their activity would allow
characterization of normal epigenetic status in vivo as a
function of normal processes. This could be used as a
powerful tool for early diagnosis of human diseases with
abnormal epigenetic status (e.g. cancer, cognitive and
psychiatric disorders, and heart and inflammatory
diseases). A PET radiotracer can also be used to
measure the effects of therapeutic drug treatment.
Radiotracer imaging is very different from PET imaging
with radiolabeled drugs (or drug candidates).
190 C. Wang et al. / Neuroscience 264 (2014) 186–197
Radiolabeled drugs can be used to trace the biological
pathway of any compound in living humans and allows
assessment of pharmacokinetic parameters such as
drug absorption, biodistribution, metabolism, and
excretion in preclinical studies (Fig. 2). However, to
date, there has been limited progress for the
observation of any epigenetic processes. In the
following sections, we will continue using HDAC as an
example to point out how PET tracers are developed
and differentiated from radiolabeled drugs and how each
is used in PET brain imaging.
Criteria for development of HDAC radiotracers for
PET. Development of novel CNS-penetrant and specific
PET radiotracers for HDAC and any epigenetic
processes is challenging. There are a number of major
factors that determine the success of a CNS-penetrant
radiotracer candidate which we describe here:
(a) BBB penetration: Small molecular weight
(<400 Da) and a high degree of lipophilicity are
required for a tracer to pass the BBB which is
composed of a lipid bilayer. Generally, increasing
lipophilicity increases the permeability of the
compound, but it also tends to increase plasma
protein binding (PPB), thereby decreasing the
concentration of free drug available to cross the
BBB. Once a drug is in the brain, specific and
nonspecific binding must be taken into account. As
such, high BBB penetration may be achieved by
increasing lipophilicity, however this may result in
increased nonspecific binding in the brain. Thus,
BBB penetrance, lipophilicity and binding specificity
are inextricably linked properties. In general, for
brain radiotracers, a partition coefficient (logP) value
between 1.5 and 3 is optimal to enable the labeled
molecule to cross the BBB.
Table 2. In vivo imaging methods to measure epigenetic ‘function’
Method Applications (Examples) Refs.
Direct observation � HDAC inhibitor pharmacokinetics [11C]MS-275 Hooker et al. (2010)
� Radiotracer for direct binding [18F]SAHA Hendricks et al. (2011)
� Radiotracer for HDAC activity [18F]FAHA Reid et al. (2009), Yeh et al. (2013)
� Activity of HDAC via MR spectroscopy Sankaranarayanapillai et al. (2006, 2008)
Indirect observation � Assess brain glucose metabolism [18F]FDG-PET Mayberg et al. (2000), Mosconi et al. (2008)
� Measure the effects of drug treatment fMRI, phMRI, BOLD MRI Febo et al. (2009), Jang et al. (2011), Wang et al. (2012)
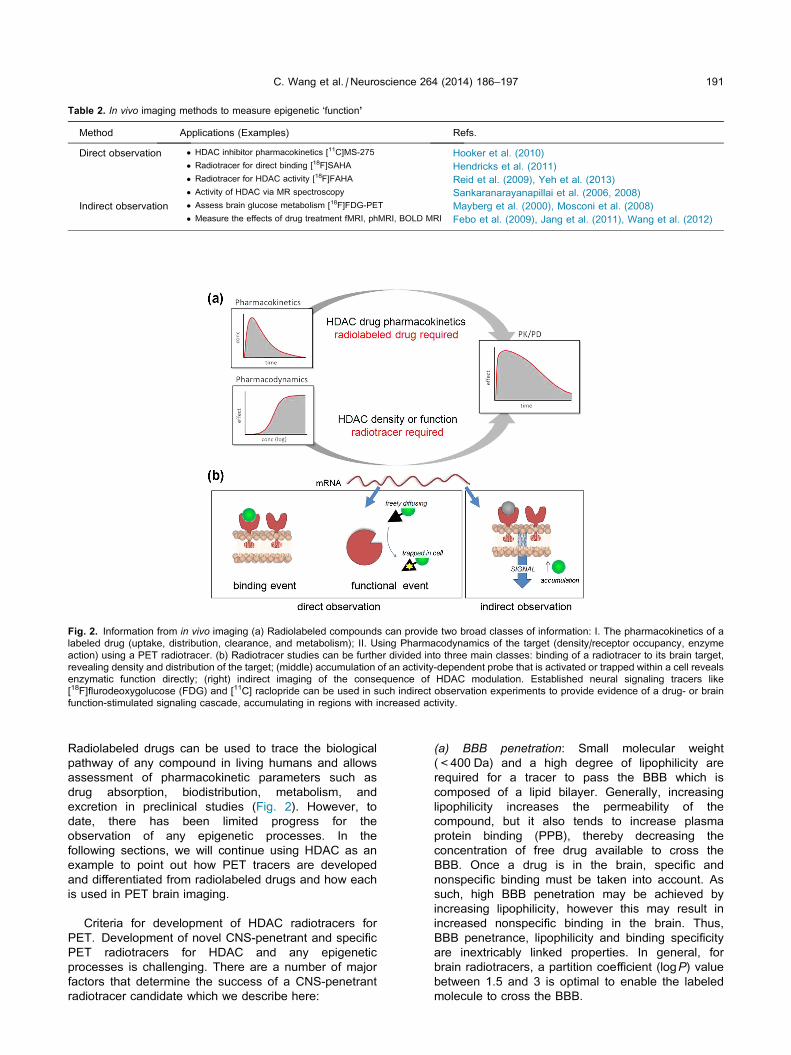
Fig. 2. Information from in vivo imaging (a) Radiolabeled compounds can provide two broad classes of information: I. The pharmacokinetics of a
labeled drug (uptake, distribution, clearance, and metabolism); II. Using Pharmacodynamics of the target (density/receptor occupancy, enzyme
action) using a PET radiotracer. (b) Radiotracer studies can be further divided into three main classes: binding of a radiotracer to its brain target,
revealing density and distribution of the target; (middle) accumulation of an activity-dependent probe that is activated or trapped within a cell reveals
enzymatic function directly; (right) indirect imaging of the consequence of HDAC modulation. Established neural signaling tracers like
[18F]flurodeoxygolucose (FDG) and [11C] raclopride can be used in such indirect observation experiments to provide evidence of a drug- or brain
function-stimulated signaling cascade, accumulating in regions with increased activity.
C. Wang et al. / Neuroscience 264 (2014) 186–197 191

(b) Specific and selective binding: Radiolabeled
compounds show different types of binding,
depending on their physicochemical and
pharmacological properties. There is specific binding
to the target receptor, and it is saturable, typically
reversible and can be inhibited by the unlabeled
form of the molecule. Nonspecific binding, due to
adsorption to tissue, is linearly proportional with the
labeled ligand concentration and non-saturable. By
experimentally varying the concentration of
radiolabeled compound, unlabeled compound and
incubation time, ex vivo experiments and curve
fitting can provide a detailed understanding of the
level of specific and nonspecific binding of a tracer
candidate. A radiotracer should have high specific
binding (and low nonspecific binding), which is
challenging to predict although some headway is
being made. (Li et al., 2009; Poulin and Haddad,
2011) Binding specificity is different from binding
selectivity. Selective binding means the radiolabeled
compounds only bind to very limited types of
receptors, whereas non-selective binding refers to
radiolabeled compounds that bind to several types of
receptors. This is a particularly important concept
when considering a family of related targets that
may each have a distinct function, such the HDACs.
Given a putative HDAC radiotracer, specific binding
to HDAC targets is expected. Experimentally, this
would be visualized as binding of an unlabeled form
of the radiotracer would saturate the HDACs in the
brain resulting in decreased binding of the
radiotracer to its target. Likewise, unlabeled
compound binding would also be expected to alter
the distribution and pharmacokinetics the radioligand
in the brain. Regarding selectivity, it is worth pointing
out that class- or isoform-selective HDAC
radiotracers would greatly facilitate efforts to
investigate the distribution and function of each class
or subtype of HDACs in the brain. As a first step,
subtype selective HDAC radiotracers may be
constructed from recently reported isoform-specific
HDAC inhibitors. (Malvaez et al., 2013; Wagner
et al., 2013)
(c) Binding affinity: The binding affinity of a radiotracer
for the target must be high enough to produce
sufficient signal for detection, but it must
dissociate from the target quickly enough to allow
binding equilibrium to be reached within the
timeframe of the scan (typically 1–2 h). After the
administration of carbon-11 or fluorine-18-labeled
radiotracers in the subject, the time–activity curve of
the brain is characterized by uptake and clearance
of activity. The rate of tissue clearance is in
part determined by the affinity of the tracer. Ligands
with higher affinity will remain bound to their
target longer, although as binding affinity affects
both specific and nonspecific binding, it should not
be so high that some kinetic data (e.g. washout
data) are unavailable to calculate receptor levels
in the brain due to the slow clearance from the
brain.
The affinity of the tracer must balance the opposing
goals of tight binding and fast washout from the brain. In
general, the higher the affinity of a probe for its target,
the higher the signal-to-background ratio of the PET
radiotracer (with the assumption that non-specific
binding is minimal). Additionally, it is preferred if the
radiotracers have fast-on, slow-off binding kinetics to
visualize in a relevant time setting. As expected, a slow-
on compound would likely not be appropriate for in vivoimaging. For example, the benzamide-based HDAC
inhibitors have been shown to exhibit slow-on kinetics in
binding to HDACs. (Malvaez et al., 2013) Given
radioisotope labeling with carbon-11 for PET imaging,
the short half-life of the radioisotope is largely decayed
before sufficient binding has occurred; longer targeting
time and thus longer-lived isotopes would therefore be
required to obtain sufficient detectable signal to visualize
HDAC binding with slow-on inhibitors.
These parameters are not required for therapeutic
agents (e.g., fast uptake may not be necessary a drug)
or for in vitro tracers (most nonspecific binding can be
eliminated with extended wash times). To this end, it
should be appreciated that desirable properties of
radiotracers are usually different from those of drugs.
For example, slow clearance of drugs from the brain
may maintain effective receptor occupancy for a long
period of time and result in a beneficial therapeutic
effect. However, for a radiotracer, slowing clearance
may induce high nonspecific binding in the brain. This
contributes to the reality that only a small percentage of
in vitro tracers and therapeutic agents are useful as
in vivo imaging agents. In this case, a compound with
sub-optimal properties as a drug could still be a useful
PET radiotracer and vice versa.
(d) Metabolites: Besides the challenging design
factors described above, a tracer candidate can still
be rendered unusable in vivo if it is metabolized
rapidly and those metabolites pervade regions of
interest (e.g. the brain). If tracer metabolism
generates lipophilic radioactive metabolites, they
may enter the brain in significant concentration. If
they do not bind to the target, they will increase
nonspecific binding and thereby decrease the signal-
to-background measurement of the target. On the
other hand, if the radioactive metabolites bind to the
target, quantification is highly confounded because
the measured signal represents undetermined
proportions of parent tracer and metabolite, each of
which may have a different affinity for the target. The
problem of lipophilic radioactive metabolites may
sometimes be avoided by selecting a labeling
position in the chemical structure with a built-in
liability such that labeled metabolites will be
sufficiently polar to minimize brain uptake and
retention. If the uptake and washout of the parent
tracer are fast relative to the production of
radioactive metabolites, then their contribution to the
total measured activity may be negligible. In
summary, PET radiotracers for brain imaging can be
designed by labeling at a metabolically labile position
(e.g., methylation at nitrogen site) in the molecule to
192 C. Wang et al. / Neuroscience 264 (2014) 186–197
produce hydrophilic radiolabeled metabolites in the
peripheral organs which are not able to cross over
the BBB; therefore, the nonspecific binding can be
minimized by careful design.
One example of a potential 18F-labelled PET
radiotracer for HDAC imaging is [18F]-suberoylanilide
hydroxamic acid ([18F]SAHA), which is a close analogue
of the clinically relevant HDAC inhibitor SAHA and was
reported (Hendricks et al., 2011). Reported findings
from pharmacokinetic studies indicate that [18F]SAHA
has near-identical biochemical activity profiles to that of
SAHA. Using a murine ovarian cancer model, Hendricks
and colleagues demonstrated that HDAC inhibitor
target-binding efficacy can be quantitated within 24 h of
administration of [18F]SAHA. However, in this case, the
brain penetrance was also low, indicating that the utility
of [18F]SAHA may not be ideal for evaluating HDAC
expression in the brain.
Radiolabeled HDAC inhibitors for PET imaging. There
are two ways to radiolabel drugs for PET imaging: one
method is by isotopic substitution, such as 11C for 12C
or 18F for 19F, wherein the physicochemical
characteristics of the drug remain constant; the other
method is bio-isosteric substitution (for example, 18F for
a proton or 11C-labelled methyl group or 18F-labelled
fluoroalkyl for a proton). By a careful design of the
substitutions, it is possible for a radiolabeled drug to
retain similar characteristics to the parent drug
(Willmann et al., 2008).
One published example investigating a radiolabeled
HDAC inhibitor for PET imaging features MS-275, an
HDAC inhibitor in clinical trials for the treatment of
several types of cancer. Recent studies have indicated
that MS-275 can cross the BBB and cause region-
specific changes in rodent brain histone acetylation
(Simonini et al., 2006). However, using PET, [11C]MS-
275 showed low uptake in the brain tissue when
administered intravenously to nonhuman primates, and
pharmacokinetics and brain accumulation of [11C]MS-
275 were not changed by the co-administration of large
doses of unlabeled MS-275 in rodent (Hooker et al.,
2010). These results indicated that the efficacy of MS-
275 for the treatment of neurological disorders by
targeting HDACs in the CNS may be limited unless
administered at high doses – which may lead to
undesired off-target and toxicity-related effects. There is
significant value in radiolabeling HDAC-modulating
drugs; however, we must re-emphasize that these
efforts are often distinct from the development of a
radiotracer designed to visualize HDAC in the brain.
Function: visualizing the role of a protein inregulating biological activity
Invasive measurement of enzyme function. Chroma-
tin-modifying enzymes each function to catalyze
posttranslational changes on proteins or nucleic acids.
Visualizing this function is more difficult than imaging
static protein presence but provides insight into how
changes in brain activity could be regulated by
epigenetic change. After methylation of DNA,
modification of nucleosomal histone proteins is
arguably the best characterized evidence of epigenetic
function. HDAC enzymes catalyze the removal of
acetyl-groups from the amino-terminal tails of core
histone proteins as well as non-histone proteins. Using
similar techniques we have reviewed for measuring
protein expression, antibodies raised against modified
(acetylated) protein targets can be used to
demonstrate a change in HDAC activity.
Methodologically, the same limitations apply to the
semi-quantitative western blotting and IHC. Using a
labeled substrate, HDAC activity can be assayed and
measured in brain homogenates. This method can
provide a relative measure of HDAC activity, but as the
substrate selectivity for HDACs is limited, the activity
contributed by each subtype currently remains an open
question. (Faraco et al., 2006).
Activatable fluorescent HDAC probe. Kazuya Kikuchi
and colleagues described a one-pot fluorogenic HDAC
probe, a nine-residue piece of the histone H3N-terminus
with acetylation on the fourth amino acid and has an
acylated coumarin at the C-terminus. An acyl group
functions to ‘‘quench’’ the fluorescence under normal
conditions, and when a transesterification reaction
transfers the acyl group from the dye to the lysine in the
presence of HDAC, the reaction works to ‘‘switch-on’’
the fluorophore. This unique probe will undoubtedly
provide a tool for epigenetic research and the discovery
of HDAC-targeted drugs in vitro. (Baba et al., 2012). A
similar strategy may be explored in developing reagents
to probe methylation and demethylation reactions which
are relevant to chromatin modifications of histones as
well as DNA.
Measuring transcriptional effects. A well-described
role of chromatin-modifying enzymes is to regulate
transcriptional activity by modulating chromatin
structure. Thus, one technique to visualize the impact
of HDAC enzyme function is to use chromatin
immunoprecipitation (ChIP) using a modified histone
antibody. Co-precipitated DNA can then be assayed by
qPCR, microarray or deep sequencing to visualize the
local enrichment of histone acetylation – the result of
altered enzyme function – as well as changes in
transcription. (Peleg et al., 2010; McFarland et al.,
2013). These methods can reveal transcriptional
changes that are the result of changes in promoter
region chromatin structure. Such changes are likely
direct effects of epigenetic enzymes, as well as those
genes whose expression is altered downstream of
primary response genes. These methods can be used
to understand the impact of HDAC function using
treatment with small molecule HDAC inhibitor
compounds.
Impact of chromatin-modifying drugs. The early
identification that small molecule inhibitors that can
block HDAC activity, such as TSA (Korzus et al.,
2004) has led to a vast literature base using HDAC
C. Wang et al. / Neuroscience 264 (2014) 186–197 193

inhibitors to understanding the impact of inhibited
function. Small molecules that block the activity of a
number of class I, II and IV HDAC enzymes (TSA,
butyrate, and crebinostat) have been used to clarify the
role of HDAC activity in modulating synaptic growth,
cellular differentiation, and onward to diverse, complex
behavioral response in rodent models. As mentioned
above, disruption of enzyme expression can also be
interpreted in terms of a change in enzyme activity.
Efforts to resolve small molecules that can inhibit a
single HDAC subtype are emerging (Malvaez et al.,
2013; Wagner et al., 2013) and will be invaluable in
further resolving the impact of suppressing a specific
HDAC subtype on brain function.
Noninvasive measurement of HDAC activity. PET
imaging with a radiolabeled HDAC substrate [18F] 6-
(fluoroacetamido)-1-hexanoicanilide (FAHA). [18F]FAHA,
a labeled HDAC substrate, was used to show
accumulation of the major metabolite, [18F]fluoroacetate
(FACE), in rat brain. This compound was further used to
visualize target binding in non-human primate brain
which was modulated in a dose-dependent manner by
the administration of SAHA, indicating that [18F]FAHA
and SAHA share the same biological targets (Reid
et al., 2009). Very recently, Yeh and colleagues clarified
these results, demonstrating that FAHA has substrate
selectivity for class IIa HDAC enzyme subtypes (HDAC
4, 5, 7, and 9) compared to other HDAC classes (Yeh
et al., 2013). Further, using the radiolabeled metabolite
of [18F]FAHA, [18F]FACE, Yeh showed that the
accumulation of radioactivity in the brain following
[18F]FAHA administration was the result of its
catabolism by class IIa HDAC to [18F]FACE, and further,
to [18F]flurocitrate (Yeh et al., 2013). Importantly, both
studies examining [18F]FAHA highlight its rapid
metabolism in vivo and, thus, that accumulated
radioactive signal attributed to binding of labeled parent
probe to HDAC targets is difficult to distinguish from
metabolites. The primary challenge, however, is that
systemic blockade of HDAC to determine specific
binding leads to an increase in the uptake of [18F]FAHA.
While this may seem counterintuitive, it is expected that
brain uptake will increase when peripheral HDAC is
blocked (and thus more radiotracer is available in the
blood for brain binding). Deconvolving and interpreting
the uptake of [18F]FAHA is not trivial and could limit its
utility for brain HDAC imaging. This tool is, however, a
remarkable advance for PET HDAC imaging. Given that
the HDAC selectivity of SAHA has been shown to be
class I HDAC subtypes HDAC1–3, 8 and the class IIb
HDAC, HDAC6, it is possible that the SAHA-mediated
depletion of signal from [18F]FAHA may result from a
compensatory increase in the activity of class IIa HDAC
enzymes following inhibition of class I and IIb subtypes
by SAHA.
Together, these studies provide evidence of a tool to
image HDAC activity in vivo. Importantly, [18F]FAHA is a
substrate that is targeted specifically by class IIa HDAC
enzymes (HDAC 4,5,7,9). Additionally, [18F]FAHA can
facilitate the development and clinical translation of
novel class-IIa HDAC inhibitors (Yeh et al., 2013). Given
the importance implicated in class I HDAC enzymes
(HDAC 1,2,3,8) in CNS disease-related behaviors, there
remains a great need to develop tools to measure the
activity of class I HDACs or to synthesize radiolabeled
ligands to visualize the expression of these enzymes in
normal and diseased brains.
Even without a dedicated radiolabeled substrate like
[18F]FAHA, the downstream impact of chromatin-
modifying enzymes can be visualized using existing
PET tracers or other imaging modalities, such as MRI.
For example, uptake of the glucose analog
[18F]fluorodeoxyglucose ([18F]FDG) can be measured by
PET and is an established surrogate for evaluating
changes in brain activity. (Mosconi et al., 2008)
Differential binding of the D2-antagonist radiotracer,
[11C]raclopride, can provide insight into the
dopaminergic impact of a genetic model or drug-
treatment regimen. These techniques are currently used
in clinical medicine and represent part of continued
investigation to clarify brain activity changes associated
with drug treatment and behavioral response in humans
and rodent models (Mayberg et al., 2000; Patel et al.,
2008; Busto et al., 2009; Jang et al., 2011; Williams
et al., 2011).
MRI measurement of drug effects. MRI is a
noninvasive medical imaging technique used in
radiology to visualize detailed internal structures and
limited functions of the body. MRI is used to create
images of the body in extraordinary detail, including the
brain, by applying the nuclear magnetic resonance
phenomena. The distribution of hydrogen nuclei found in
water depends on the tissue type and whether or not
the tissue is healthy or diseased. At the most basic
level, MRI measures and records changes in the
magnetic properties of protons in water.
Despite a vast and growing literature base on the
behavioral effects of HDAC inhibitor treatment in
rodents, few studies have utilized in vivo MRI imaging to
assess the impact of HDAC inhibition on brain activity.
Circumventing the challenges of PET-probe
development, established techniques in MRI – and
variations thereof – can provide detailed information on
the impact of disease and drug treatment on changes in
brain structure, blood flow and metabolite density. In the
context of addiction, blood-oxygen level-dependent
(BOLD) activation of cortico-limbic circuitry in rat was
shown to be increased after subchronic treatment with
the HDAC inhibitor, sodium butyrate (Febo et al., 2009).
This study was the first of its kind to couple chromatin-
modifying drug treatment with in vivo brain imaging.
While the result of the study advanced that HDAC
inhibition may functionally activate cortio-limbic
neurocircuitry and enhance brain activation following co-
treatment with cocaine, it also provided insight that
neuroimaging tools could be effectively applied to
investigate epigenetic mechanisms in animal models
and, as discussed, provide a forward view on the
therapeutic potential of HDAC inhibitors. Related,
functional MRI (fMRI) and functional connectivity MRI
194 C. Wang et al. / Neuroscience 264 (2014) 186–197

(fcMRI) relates the BOLD signal between different parts of
the brain to resolve putative connections between brain
nuclei. This is most often coupled to a change in brain
function based on a visual or cognitive task in awake
subjects – a decided challenge for research animals,
though analogies can be made for connectivity using
pharmacological MRI (phMRI). The impact of chromatin-
modifying drugs can be investigated using phMRI, which
couples the functional changes in cerebral blood flow to
pharmacological drug challenge. As recently reviewed,
this method provides high temporal resolution and, like
PET, has virtually identical methods that can be
translated to human phMRI imaging experiments
(Jenkins, 2012).
High-resolution structural information can be used to
investigate the impact of chromatin-modifying drugs on
parameters such as hippocampal volume, a phenotype
linked to a rodent model of schizophrenia (Sandner
et al., 2011). Likewise, in a model of ischemic stroke,
MRI was used to measure infarct size induced by
medial cerebral artery occlusion as well as the
functional recovery promoted by chronic treatment with
the HDAC inhibitor sodium valproate (Wang et al.,
2012). These studies represent important milestones in
epigenetics research in which imaging tools are applied
to understand the functional and structural changes in
the brain regulated in part by HDAC activity.
Proton (1H) MRS utilizes spectroscopy and the
exquisite temporal resolution of MRI to link functional
changes in tissues including brain to concentrations of
metabolic biomarkers. Altered levels of N-acetyl
aspartate, choline, and myoinositol have been identified
in the brain of patients with neurodegenerative diseases,
cognitive deficits and psychiatric phenotypes. HDAC
inhibitor treatment has been linked to restoration of
MRS-measured levels of choline and N-acetyl-aspartatein cellular and animal tumor models (Beloueche-Babari
et al., 2012; Wei et al., 2012; Ward et al., 2013)
although in each case these are indirect measures of
changes in HDAC activity.
Advancing on this limitation, an 19F-labeled HDAC
substrate was developed which allowed the activity of
HDAC enzymes to be visualized using MRS
(Sankaranarayanapillai et al., 2006, 2008). 19F-MRS of
the targeted molecular imaging agent fluorinated lysine
derivative Boc-Lys-(Tfa)-OH (BLT) can be used to
monitor delivery and activity of HDACis at the tumor
site, whereas 31P-MRS can be used to monitor the
downstream metabolic consequences of HDAC
inhibition. Together, these two MRS methods provide
both a direct marker of HDAC inhibition and a
downstream biomarker of cellular response to the
inhibition. The combination of 19F and 31P-MRS has the
potential to serve as a reliable noninvasive modality to
assess HDAC inhibition. Importantly, the acetyl
substrates of most class I and II HDAC enzymes are
not unique to any one HDAC subtype. Therefore, the
specific HDAC subtypes responsible for any observed
changes using 19F-BLT or another labeled HDAC
substrate by MRI or PET would be difficult or impossible
to interpret.
Using multiple modalities in concert presents new
imaging frontiers. The simultaneous acquisition of
different functional parameters using PET, fMRI or MRS,
in addition to high-resolution anatomic MRI information,
creates enormous possibilities and provides completely
new opportunities to study pathology and biochemical
processes in vivo. With this combined imaging system,
both modalities preserve their functionality. We
simultaneously acquired functional and morphological
PET–MRI data from living subjects. MR-PET will improve
the diagnostic relevance and functional consequence of
PET imaging. The simultaneous scanning will not only
resolve many of the impediments to precise
coregistration of anatomo-molecular information, but also
be used to develop receptor occupancy and function
correlations; this new imaging tool will lead us to discover
a new MR-PET imaging technology to ask roles of
chromatin modifications in brain disorders and explore
the correlation between the therapeutic treatment and
brain’s responses and might have strong potential for
drug development.
CONCLUSION
In this review, we have provided an overview of
methodology used to visualize chromatin-modifying
enzymes and their function in the brain. We highlight the
tools used so far to extend these findings to visualize
the brain in vivo and the powerful translational aspect of
neuroimaging in animals and humans. Integrating the
knowledge base from biochemical, in vitro and ex vivostudies with an understanding of what is happening in
the living brain is inextricably linked to techniques in
noninvasive neuroimaging. Beyond providing a better
understanding of how to interpret results from basic
research, developing in vivo imaging tools will give a
chance to intervene in brain disease.
Identification and approval of the beta amyloid
radiotracer, [18F]fluorbetapir was a major breakthrough
in linking what basic science and ex vivo studies have
shown regarding amyloid accumulation and what
changes are evident in the brains from patients living
with frontotemporal dementia, including Alzheimer’s
disease (AD). This stands as a powerful example of
how neuroimaging could change the trajectory of a
disease. Nevertheless, treatment options for AD remain
limited. However, like the number of tools available for
imaging the dopaminergic system especially the
D2-antagonist radiotracer, [11C]raclopride, dedicated
in vivo imaging tools will help us understand protein
expression and function in the context of many diseases.
An understanding of the role of chromatin-modifying
enzymes such as DNA and histone methyltransferases,
lysine-specific demethylases is emerging, however
evaluating how the expression and activity of these
enzymes are distributed throughout the healthy and
diseased brain in vivo remains an open question.
Similar to the evidence we presented for the HDAC
family of enzymes, many additional chromatin-modifying
enzymes are already well positioned to be investigated
using neuroimaging techniques as specific chemical
C. Wang et al. / Neuroscience 264 (2014) 186–197 195

activators and inhibitors have been described and provide
an important foothold to initiate characterization using
in vivo imaging tools.
Acknowledgement—The authors would like to thank Drs. Nicole
R. Zurcher and Genevieve Van de Bittner for their help in figure
preparation.
REFERENCES
Atwal JK, Chen Y, Chiu C, Mortensen DL, Meilandt WJ, Liu Y, Heise
CE, Hoyte K, Luk W, Lu Y, Peng K, Wu P, Rouge L, Zhang Y,
Lazarus RA, Scearce-Levie K, Wang W, Wu Y, Tessier-Lavigne
M, Watts RJ (2011) A therapeutic antibody targeting BACE1
inhibits amyloid-beta production in vivo. Sci Transl Med 3:84ra43.
Baba R, Hori Y, Mizukami S, Kikuchi K (2012) Development of a
fluorogenic probe with a transesterification switch for detection of
histone deacetylase activity. J Am Chem Soc 134:14310–14313.
Bacskai BJ, Kajdasz ST, Christie RH, Carter C, Games D, Seubert P,
Schenk D, Hyman BT (2001) Imaging of amyloid-beta deposits in
brains of living mice permits direct observation of clearance of
plaques with immunotherapy. Nat Med 7:369–372.
Beloueche-Babari M, Arunan V, Troy H, te Poele RH, te Fong AC,
Jackson LE, Payne GS, Griffiths JR, Judson IR, Workman P,
Leach MO, Chung YL (2012) Histone deacetylase inhibition
increases levels of choline kinase alpha and phosphocholine
facilitating noninvasive imaging in human cancers. Cancer Res
72:990–1000.
Broide RS, Redwine JM, Aftahi N, Young W, Bloom FE, Winrow CJ
(2007) Distribution of histone deacetylases 1–11 in the rat brain. J
Mol Neurosci 31:47–58.
Busto UE, Redden L, Mayberg H, Kapur S, Houle S, Zawertailo LA
(2009) Dopaminergic activity in depressed smokers: a positron
emission tomography study. Synapse 63:681–689.
Cong L, Ran FA, Cox D, Lin S, Barretto R, Habib N, Hsu PD, Wu X,
Jiang W, Marraffini LA, Zhang F (2013) Multiplex genome
engineering using CRISPR/Cas systems. Science 339:819–823.
Faraco G, Pancani T, Formentini L, Mascagni P, Fossati G, Leoni F,
Moroni F, Chiarugi A (2006) Pharmacological inhibition of histone
deacetylases by suberoylanilide hydroxamic acid specifically
alters gene expression and reduces ischemic injury in the
mouse brain. Mol Pharmacol 70:1876–1884.
Fass DM, Kemp MM, Schroeder FA, Wagner FF, Wang Q, Holson
EB (2012) Histone acetylation and deacetylation. In: Meyers RA,
editor. Meyers: encyclopedia of molecular cell biology and
molecular medicine: epigenetic regulation and
epigenomics. Wiley-VCH Verlag GmbH & Co. KGaA. p.
515–562. Available from: <http://www.scribd.com/doc/
142807477/Epigenetic-Regulation-and-Epigenomics>.
Fass DM, Schroeder FA, Perlis RH, Haggarty SJ (2013) Epigenetic
mechanisms in mood disorders: targeting neuroplasticity.
Neuroscience.
Febo M, Akbarian S, Schroeder FA, Ferris CF (2009) Cocaine-
induced metabolic activation in cortico-limbic circuitry is increased
after exposure to the histone deacetylase inhibitor, sodium
butyrate. Neurosci Lett 465:267–271.
Foti SB, Chou A, Moll AD, Roskams AJ (2013) HDAC inhibitors
dysregulate neural stem cell activity in the postnatal mouse brain.
Int J Dev Neurosci 31:434–447.
Frenkel D, Solomon B (2002) Filamentous phage as vector-mediated
antibody delivery to the brain. Proc Natl Acad Sci U S A
99:5675–5679.
Guan JS, Haggarty SJ, Giacometti E, Dannenberg JH, Joseph N,
Gao J, Nieland TJ, Zhou Y, Wang X, Mazitschek R, Bradner JE,
DePinho RA, Jaenisch R, Tsai LH (2009) HDAC2 negatively
regulates memory formation and synaptic plasticity. Nature
459:55–60.
Hasan A, Mitchell A, Schneider A, Halene T, Akbarian S (2013)
Epigenetic dysregulation in schizophrenia: molecular and clinical
aspects of histone deacetylase inhibitors. Eur Arch Psychiatry
Clin Neurosci.
Hendricks JA, Keliher EJ, Marinelli B, Reiner T, Weissleder R,
Mazitschek R (2011) In vivo PET imaging of histone deacetylases
by 18F-suberoylanilide hydroxamic acid (18F-SAHA). J Med
Chem 54:5576–5582.
Hooker JM, Kim SW, Alexoff D, Xu Y, Shea C, Reid A, Volkow N,
Fowler JS (2010) Histone deacetylase inhibitor, MS-275, exhibits
poor brain penetration: PK studies of [C]MS-275 using Positron
Emission Tomography. ACS Chem Neurosci 1:65–73.
Jang JY, Jang M, Kim SH, Um KB, Kang YK, Kim HJ, Chung S, Park
MK (2011) Regulation of dopaminergic neuron firing by
heterogeneous dopamine autoreceptors in the substantia nigra
pars compacta. J Neurochem 116:966–974.
Janssen C, Schmalbach S, Boeselt S, Sarlette A, Dengler R, Petri S
(2010) Differential histone deacetylase mRNA expression
patterns in amyotrophic lateral sclerosis. J Neuropathol Exp
Neurol 69:573–581.
Jenkins BG (2012) Pharmacologic magnetic resonance imaging (phMRI):
imaging drug action in the brain. NeuroImage 62:1072–1085.
Kennedy PJ, Feng J, Robison AJ, Maze I, Badimon A, Mouzon E,
Chaudhury D, Damez-Werno DM, Haggarty SJ, Han MH, Bassel-
Duby R, Olson EN, Nestler EJ (2013) Class I HDAC inhibition
blocks cocaine-induced plasticity by targeted changes in histone
methylation. Nat Neurosci 16:434–440.
Korzus E, Rosenfeld MG, Mayford M (2004) CBP histone
acetyltransferase activity is a critical component of memory
consolidation. Neuron 42:961–972.
Lee SC, Magklara A, Smith CL (2011) HDAC activity is required for
efficient core promoter function at the mouse mammary tumor
virus promoter. J Biomed Biotechnol 2011:416905.
Li H, Sun J, Sui X, Liu J, Yan Z, Liu X, Sun Y, He Z (2009) First-
principle, structure-based prediction of hepatic metabolic
clearance values in human. Eur J Med Chem 44:1600–1606.
Li D, Qiu Z, Shao Y, Chen Y, Guan Y, Liu M, Li Y, Gao N, Wang L, Lu
X, Zhao Y, Liu M (2013) Heritable gene targeting in the
mouse and rat using a CRISPR-Cas system. Nat Biotechnol
31:681–683.
Liu H, Hu Q, Kaufman A, D’Ercole AJ, Ye P (2008) Developmental
expression of histone deacetylase 11 in the murine brain. J
Neurosci Res 86:537–543.
MacDonald JL, Roskams AJ (2008) Histone deacetylases 1 and 2 are
expressed at distinct stages of neuro-glial development. Dev Dyn
237:2256–2267.
Malvaez M, McQuown SC, Rogge GA, Astarabadi M, Jacques V,
Carreiro S, Rusche JR, Wood MA (2013) HDAC3-selective
inhibitor enhances extinction of cocaine-seeking behavior
in a persistent manner. Proc Natl Acad Sci U S A 110:2647–2652.
Mayberg HS, Brannan SK, Tekell JL, Silva JA, Mahurin RK, McGinnis
S, Jerabek PA (2000) Regional metabolic effects of fluoxetine in
major depression: serial changes and relationship to clinical
response. Biol Psychiatry 48:830–843.
McFarland BC, Gray GK, Nozell SE, Hong SW, Benveniste EN (2013)
Activation of the NF-kappaB Pathway by the STAT3 Inhibitor JSI-
124 in Human Glioblastoma Cells. Mol Cancer Res 11:494–505.
Mielcarek M, Benn CL, Franklin SA, Smith DL, Woodman B, Marks
PA, Bates GP (2011) SAHA decreases HDAC 2 and 4 levels
in vivo and improves molecular phenotypes in the R6/2 mouse
model of Huntington’s disease. PLoS One 6:e27746.
Morris MJ, Monteggia LM (2013) Unique functional roles for class I
and class II histone deacetylases in central nervous system
development and function. Int J Dev Neurosci 31:370–381.
Mosconi L, Tsui WH, Herholz K, Pupi A, Drzezga A, Lucignani G,
Reiman EM, Holthoff V, Kalbe E, Sorbi S, Diehl-Schmid J,
Perneczky R, Clerici F, Caselli R, Beuthien-Baumann B,
Kurz A, Minoshima S, de Leon MJ (2008) Multicenter
standardized 18F-FDG PET diagnosis of mild cognitive
impairment, Alzheimer’s disease, and other dementias. J Nucl
Med 49:390–398.
196 C. Wang et al. / Neuroscience 264 (2014) 186–197

Patel VD, Lee DE, Alexoff DL, Dewey SL, Schiffer WK (2008) Imaging
dopamine release with Positron Emission Tomography (PET) and
(11)C-raclopride in freely moving animals. Neuroimage
41:1051–1066.
Peleg S, Sananbenesi F, Zovoilis A, Burkhardt S, Bahari-Javan S,
Agis-Balboa RC, Cota P, Wittnam JL, Gogol-Doering A, Opitz L,
Salinas-Riester G, Dettenhofer M, Kang H, Farinelli L, Chen W,
Fischer A (2010) Altered histone acetylation is associated with
age-dependent memory impairment in mice. Science
328:753–756.
Poulin P, Haddad S (2011) Microsome composition-based model as
a mechanistic tool to predict nonspecific binding of drugs in liver
microsomes. J Pharm Sci 100:4501–4517.
Qiu Y, Zhao Y, Becker M, John S, Parekh BS, Huang S,
Hendarwanto A, Martinez ED, Chen Y, Lu H, Adkins NL,
Stavreva DA, Wiench M, Georgel PT, Schiltz RL, Hager GL
(2006) HDAC1 acetylation is linked to progressive modulation
of steroid receptor-induced gene transcription. Mol Cell
22:669–679.
Reid AE, Hooker J, Shumay E, Logan J, Shea C, Kim SW, Collins S,
Xu Y, Volkow N, Fowler JS (2009) Evaluation of 6-
([(18)F]fluoroacetamido)-1-hexanoicanilide for PET imaging of
histone deacetylase in the baboon brain. Nucl Med Biol
36:247–258.
Sandner G, Host L, Angst MJ, Guiberteau T, Guignard B, Zwiller J
(2011) The HDAC Inhibitor Phenylbutyrate Reverses Effects of
Neonatal Ventral Hippocampal Lesion in Rats. Front Psychiatry
1:153.
Sankaranarayanapillai M, Tong WP, Maxwell DS, Pal A, Pang J,
Bornmann WG, Gelovani JG, Ronen SM (2006) Detection of
histone deacetylase inhibition by noninvasive magnetic
resonance spectroscopy. Mol Cancer Ther 5:1325–1334.
Sankaranarayanapillai M, Tong WP, Yuan Q, Bankson JA, Dafni H,
Bornmann WG, Soghomonyan S, Pal A, Ramirez MS,
Webb D, Kaluarachchi K, Gelovani JG, Ronen SM (2008)
Monitoring histone deacetylase inhibition in vivo: noninvasive
magnetic resonance spectroscopy method. Mol Imaging
7:92–100.
Simonini MV, Camargo LM, Dong E, Maloku E, Veldic M, Costa E,
Guidotti A (2006) The benzamide MS-275 is a potent, long-lasting
brain region-selective inhibitor of histone deacetylases. Proc Natl
Acad Sci U S A 103:1587–1592.
Takase K, Oda S, Kuroda M, Funato H (2013) Monoaminergic and
neuropeptidergic neurons have distinct expression profiles of
histone deacetylases. PLoS One 8:e58473.
Wagner FF, Olson DE, Gale JP, Kaya T, Weiwer M, Aidoud N,
Thomas M, Davoine EL, Lemercier BC, Zhang YL, Holson EB
(2013) Potent and Selective Inhibition of Histone Deacetylase 6
(HDAC6) Does Not Require a Surface-Binding Motif. J Med Chem
56:1772–1776.
Wang Z, Zang C, Cui K, Schones DE, Barski A, Peng W, Zhao K
(2009) Genome-wide mapping of HATs and HDACs reveals
distinct functions in active and inactive genes. Cell
138:1019–1031.
Wang Z, Tsai LK, Munasinghe J, Leng Y, Fessler EB, Chibane F,
Leeds P, Chuang DM (2012) Chronic valproate treatment
enhances postischemic angiogenesis and promotes functional
recovery in a rat model of ischemic stroke. Stroke 43:2430–2436.
Wang H, Yang H, Shivalila CS, Dawlaty MM, Cheng AW, Zhang F,
Jaenisch R (2013a) One-step generation of mice carrying
mutations in multiple genes by CRISPR/Cas-mediated genome
engineering. Cell 153:910–918.
Wang Y, Zhang YL, Hennig K, Gale JP, Hong Y, Cha A, Riley M,
Wagner F, Haggarty SJ, Holson E, Hooker J (2013b) Class I
HDAC imaging using [(3)H]CI-994 autoradiography. Epigenetics
8.
Ward CS, Eriksson P, Izquierdo-Garcia JL, Brandes AH, Ronen SM
(2013) HDAC inhibition induces increased choline uptake and
elevated phosphocholine levels in MCF7 breast cancer cells. PloS
one 8:e62610.
Wei L, Hong S, Yoon Y, Hwang SN, Park JC, Zhang Z, Olson JJ, Hu
XP, Shim H (2012) Early prediction of response to Vorinostat in an
orthotopic rat glioma model. NMR Biomed 25:1104–1111.
Williams LM, Rush AJ, Koslow SH, Wisniewski SR, Cooper NJ,
Nemeroff CB, Schatzberg AF, Gordon E (2011) International
study to predict optimized treatment for depression (iSPOT-D), a
randomized clinical trial: rationale and protocol. Trials 12:4.
Willmann JK, van Bruggen N, Dinkelborg LM, Gambhir SS (2008)
Molecular imaging in drug development. Nat Rev Drug Discov
7:591–607.
Yeh HH, Tian M, Hinz R, Young D, Shavrin A, Mukhapadhyay U,
Flores LG, Balatoni J, Soghomonyan S, Jeong HJ, Pal A,
Uthamanthil R, Jackson JN, Nishii R, Mizuma H, Onoe H,
Kagawa S, Higashi T, Fukumitsu N, Alauddin M, Tong W,
Herholz K, Gelovani JG (2013) Imaging epigenetic regulation by
histone deacetylases in the brain using PET/MRI with (1)(8)F-
FAHA. Neuroimage 64:630–639.
Zhou X, Marks PA, Rifkind RA, Richon VM (2001) Cloning and
characterization of a histone deacetylase, HDAC9. Proc Natl
Acad Sci U S A 98:10572–10577.
(Accepted 9 September 2013)(Available online 17 September 2013)
C. Wang et al. / Neuroscience 264 (2014) 186–197 197