Embed Size (px)
Citation preview

2
Starting Data
Genome
Read 1 Read 2 Read 3
L001_bismark_bt2_pe.deduplicated.bam
CHG_OB_L001_bismark_bt2_pe.deduplicated.txt.gzCHG_OT_L001_bismark_bt2_pe.deduplicated.txt.gzCHH_OB_L001_bismark_bt2_pe.deduplicated.txt.gzCHH_OT_L001_bismark_bt2_pe.deduplicated.txt.gzCpG_OB_L001_bismark_bt2_pe.deduplicated.txt.gzCpG_OT_L001_bismark_bt2_pe.deduplicated.txt.gz
3
Starting Data• Mapped Reads– BAM file format– Contains positions of mapped reads– Useful for looking at coverage biases
• Methylation Calls– Delimited text file– Individual calls for single cytosines– Useful for looking at methylation patterns

4
Checking Coverage

5
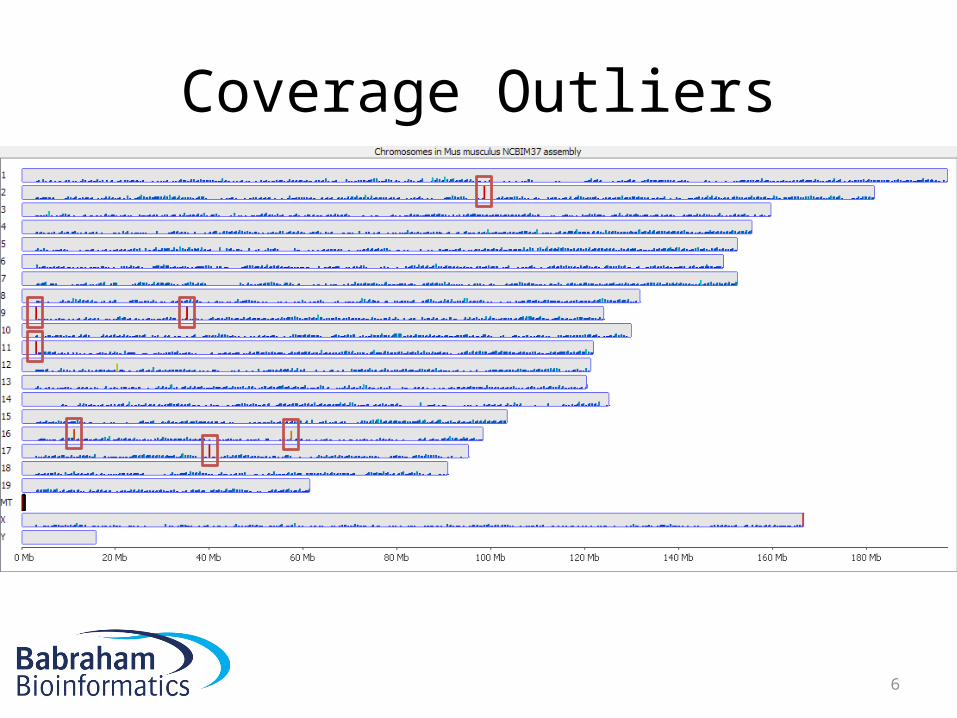
Coverage Outliers
Around 600x average genome density
6
Coverage Outliers

7
Coverage Outliers
• Normally the result of mis-mapping repetitive sequences not in the genome assembly
• Centromeric / temomeric sequences are common
• Can be a significant proportion of all data• Can throw off calculations of overall
methylation• Should be removed

8
Which data to use?
• Methylation contexts– CpG: Only generally relevant context for mammals– CHG: Only known to be relevant in plants– CHH: Generally unmethylated
• Methylation strands– CpG methylation is generally symmetric– Normally makes sense to merge OT / OB strands

9
Quantitating Methylation
Total methylated calls = 15Total unmethylated calls = 10
Methylation level = (15/(15+10))*100 = 60%

10
Quantitating Methylation
Total methylated calls = 20Total unmethylated calls = 5
Methylation level = (20/(20+5))*100 = 80%

11
Total methylated calls = 12Total unmethylated calls = 14
Methylation level = (12/(12+14))*100 = 46%?
Quantitating Methylation

12
Quantitating Methylation
100% 100% 100% 100% 0%
Methylation level = (100+100+100+100+0)/5 = 80%

13
Quantitating Methylation
Methylation level = (100*5)+(0*5)/10 = 50% ?
100% 0% 100% 100% 100% 100% 0%0% 0% 0%
Methylation level = (100*5)/5 = 100%

14
Quantitating Methylation
57%
33%
Common = 300/6 = 50% in both

15
More Complex Methods
• Factors to consider during quantitation– Surrounding methylation levels• Assume that methylation doesn’t change over very
short distances
– Coverage of individual bases• Down-weight very low or high values
– Density of CpGs• Apply the level to all bases within a region

16
Where to make measures
• Per base– Very large number of measures– Poor accuracy for individual bases
• Unbiased windows– Tiled over whole genome– Need to decide how they will be defined
• Targeted regions– Which regions– What context

17
Unbiased analysis• What basis do you use for creating the windows?– Fixed size?
• Uneven CpG distribution can be problematic
– Fixed CpG count?• Different resolution
• Need to tailor the window sizes to the data density• Can relate windows to features later

18
Fixed size windows
CpG content /5kb
0
300
150
Differences between replicates
1kb 2kb 5kb 10kb 25kb 50kb
Must balance technical considerations and biology

19
Fixed CpG windows
• More even noise profile– Fairer statistics– More comparable methylation values– Length differences are not very dramatic
50 CpG window lengths

20
Viewing quantitated methylation

21
Large sample numbers

22
Large sample numbers

23
Targeted Quantitation
• Measure over features– CpG islands• Be careful where you get your locations
– Promoters• Should probably split into CpG island and non-CpG island
– Gene bodies• Filter by biotype to remove small RNA genes?

24
Viewing comparisons

25
Viewing comparisons

26
Viewing differences

27
Viewing differences

28
Trends
• Effects at individual loci can be subtle• Want to find more generalised effect• Collate information across whole genome• Look for general trend

29
Considerations for trend plots
• What features to use– Fixed vs relative scale
• How much context– Variable scales
• How to calculate base measures– What window size– Aligned vs unaligned windows
• Missing values• Scale

30
Simple Example
Methylation profile centred on CpG islands +/- 10kb

31
More complex example
Methylation profile over genes +/- 5kb

32
Clustering
0
10
20
30
40
50
60
70
80
90
100
Sample 1 Sample 2 Sample 3
Perc
enta
ge M
ethy
latio
n
Probe A
Probe B
Probe C

33
Clustering
• Correlation Clustering– Focusses on the differences between conditions– Absolute values not important– Look for similar trends– Show median normalised values
• Euclidean Clustering– Focusses on absolute differences between conditions– Look for similar levels– Show raw values

34
Clustering