Embed Size (px)
Citation preview
Visual Pathway Study Using In VivoDiffusion Tensor Imaging Tractography
to Complement Classic AnatomyThe Harvard community has made this
article openly available. Please share howthis access benefits you. Your story matters
Citation Wu, Wentao, Laura Rigolo, Lauren J. O?Donnell, Isaiah Norton,Sargent Shriver, and Alexandra J. Golby. 2012. “Visual PathwayStudy Using In Vivo Diffusion Tensor Imaging Tractography toComplement Classic Anatomy.” Operative Neurosurgery 70 (March):ons145–ons156. doi:10.1227/neu.0b013e31822efcae.
Published Version doi:10.1227/neu.0b013e31822efcae
Citable link http://nrs.harvard.edu/urn-3:HUL.InstRepos:32490981
Terms of Use This article was downloaded from Harvard University’s DASHrepository, and is made available under the terms and conditionsapplicable to Other Posted Material, as set forth at http://nrs.harvard.edu/urn-3:HUL.InstRepos:dash.current.terms-of-use#LAA

Visual Pathway Study Using in vivo DTI Tractography toComplement Classical Anatomy
Wentao Wu, M.D.1,3,4, Laura Rigolo, M.A.1, Lauren J. O’Donnell, Ph.D.2, Isaiah Norton, B.S.1, Sargent Shriver, B.S.1, and Alexandra J. Golby, M.D.1,2
1Brigham & Women’s Hospital, Department of Neurosurgery, Harvard Medical School, Boston,MA, USA2Brigham & Women’s Hospital, Department of Radiology, Harvard Medical School, Boston, MA,USA3West China Hospital, Department of Radiology, Sichuan University, Chengdu, Sichuan, China4West China Hospital, Department of Neurosurgery, Sichuan University, Chengdu, Sichuan,China
AbstractBackground—Knowledge of the individual course of the optic radiations (OR) is important toavoid post-operative visual deficits. Cadaveric studies of the visual pathways are limited because ithas not been possible to accurately separate the OR from neighboring tracts and results may notapply to individual patients. Diffusion tensor imaging (DTI) studies may be able to demonstratethe relationships between the OR and neighboring fibers in vivo in individual subjects.
Objective—To use DTI tractography to study the OR and Meyer’s loop (ML) anatomy in vivo.
Methods—Ten healthy subjects underwent magnetic resonance imaging with diffusion imagingat 3T. Using a fiducial-based DTI tractography tool (Slicer 3.3), seeds were placed near the lateralgeniculate nucleus (LGN) to reconstruct individual visual pathways and neighboring tracts.Projections of the optic radiations onto 3D brain models were shown individually in order toquantify relationships to key landmarks.
Results—Two patterns of visual pathways were found. The OR ran more commonly deep in thewhole superior and middle temporal gyri and superior temporal sulcus. The OR was closelysurrounded in all cases by an inferior longitudinal fascicle and a parieto/occipito/temporo-pontinefascicle. The mean left and right distances between the tip of the OR and temporal pole were39.8± 3.8mm and 40.6±5.7 mm, respectively.
Conclusion—DTI tractography provides a practical complementary method to study the OR andML anatomy in vivo, and with reference to individual 3D brain anatomy.
Address for corresponding author: Alexandra J. Golby, M.D. Department of Neurosurgery, Brigham and Women’s Hospital, 75Francis Street, Boston, MA 02115, [email protected], Telephone: 617-525-6776, Fax: 617-713-3050.The authors do not hold any significant financial conflict of interest relating to topics of the manuscript.Funding DisclosureNIH 1P41RR019703-01A2NIH P01-CA67165Brain Science FoundationKlarman Family FoundationState Scholarship Fund from China Scholarship Council (CSC)
NIH Public AccessAuthor ManuscriptNeurosurgery. Author manuscript; available in PMC 2013 March 1.
Published in final edited form as:Neurosurgery. 2012 March ; 70(OPERATIVE): ons145–ons156. doi:10.1227/NEU.0b013e31822efcae.
NIH
-PA Author Manuscript
NIH
-PA Author Manuscript
NIH
-PA Author Manuscript

Keywordsanatomy; DTI tractography; visual pathway; optic radiations; Meyer’s loop; white matter
IntroductionThe optic radiations(OR) were first identified and described by Louis-Pierre Gratiolet usingbrain fixation and dissection 1. Since then, anatomists have displayed the course of the ORusing Klingler’s fiber dissection technique in cadaveric study 2. Three bundles of the ORwere found in the classic cadaveric study by Meyer, which were named inferior, central, andsuperior bundles 3. It is believed that the inferior and superior bundles represent fibers of thelower and upper quadrants of the retina respectively, and the central bundle carries macularinformation 3,4. The inferior bundle starts from the lateral geniculate nucleus (LGN), runs inan anterolateral direction into the anterior temporal lobe, rounds the roof of temporal horn(TH) of the lateral ventricle, and loops back to occipital cortex. This loop of the OR is calledMeyer’s loop (ML) 3. However, this classical description of the OR has been called intoquestion by recent cadaveric studies 5,6, in which the authors thought it was not possible toaccurately delineate the anterior tip of the OR even using micro-dissection techniques incadaveric studies, particularly amongst a dense network of many neighboring fibers.
Diffusion tensor imaging (DTI) is an MR imaging technique that can be used to characterizethe directional properties of the diffusion of water molecules 7. Application of this techniqueto the human brain can provide unique in vivo visualization of white matter architecture 8.DTI fiber tractography(DTI-FT) is a mathematical technique to reconstruct white mattertract representations in three-dimensional (3D) space based on DTI. Since DTI-FT offers theonly non-invasive method of demonstrating white matter tracts in vivo, it may be useful foridentifying the OR and ML non-invasively 4,9–13. However, diffusion tensor fibertractography for the OR, particularly for ML, is still challenging because tracking algorithmsand technique limitations may fail to demonstrate oblique or parallel fiber tracts or tractswith large and/or sharp curvature 9,12,14,15. Several groups have used DTI tractography todemonstrate the OR and ML and have quantified distances from these structures to thetemporal pole, temporal horn and occipital pole 4,15,16. The results have varied with thelargest difference between studies over 20mm. The most powerful validation is comparisonof visual field deficits (VFDs) pre- and post-operatively 15,17,18. Unfortunately, the resultseven after applying VFD comparison are still quite variable 15,17,18.
The OR are surrounded by numerous neighboring tracts which are not easily dissected fromthe OR in cadaveric study, especially the anterior part of the OR 5,6. Little work hasspecifically described the relationships of the OR, inferior longitudinal fascicle (ILF) andparieto/occipito/temporo-pontine fascicle (POTPF) either in cadaveric or DTI tractographystudies 19,20. Those fascicles are very close to each other, potentially affecting theassessment of location and size of the OR in cadaveric and DTI tractography studies. Inaddition, no previous work has described the projection of the OR onto a 3D brain surface,within a subject-specific 3D brain model reconstructed from the T1-weighted MR images.Such a model could provide useful information for pre-operative planning. In order tocharacterize the course and location of the OR and its relationships with other neighboringfascicles, we studied10 healthy subjects.
Wu et al. Page 2
Neurosurgery. Author manuscript; available in PMC 2013 March 1.
NIH
-PA Author Manuscript
NIH
-PA Author Manuscript
NIH
-PA Author Manuscript

MethodsSubjects
Ten healthy subjects (three males) without history of neurological disease, head injury, orpsychiatric disorder were included (mean age =30±8y). Subjects were recruited afterInstitutional Review Board approval (Partners Healthcare, Brigham and Women’s Hospital,BWH, Boston, MA, USA) and written informed consent was obtained from all subjects.
MRI acquisitionMRI was performed using a 3.0 Telsa machine (GE Sigma, General Electronic, Milwaukee,WI, USA). Whole brain T1-weighted axial 3D-SPGR(spoiled gradient recalled) MR images(TR = 7500ms, TE = 30ms, flip angle = 20°, matrix = 512×512, 176 slices, voxel size =0.5×0.5×1mm3) were acquired. A single shot spin-echo echo-planar sequence was used forDTI with diffusion gradients in 31 non-collinear directions (b = 1.000 s/mm2, matrix =256×256, 44 slices to cover the whole brain, voxel size = 1×1×3mm3).
Data processingDTI computed fractional anisotropy (FA) maps were individually registered with T1-weighted images using Slicer 3.3 (Surgical Planning Laboratory, Brigham and Women’sHospital, Harvard Medical School, Boston, Massachusetts, USA; www.slicer.org). FA mapswere displayed as color-orientation FA maps (green: anterior-posterior, red: superior-inferior, blue: left-right). The registration and superimposition of color-orientation FA mapswith T1-weighted MR images (anatomic reference) used linear rigid registration suggestedby Pataky et al. 21 (Figure 1). This was done by automatically and then manually modifyingthe linear transformation, such as translation and rotation of FA maps. Then nonlineartransformations, such as inter-slice space resizing of FA maps, were manually modified inSlicer in order to compensate for non-linear deformations inherent in diffusion MRI data 22.Anatomic precision of the registration was then reviewed by visual analysis of mergedimages and iterative test-re-test using several landmarks. Landmarks used were: putamen,pallidum, corpus callosum (whole body and/or major and minor forceps), anterior andposterior limbs of the internal capsule, cerebellar contour, tentorium of the posterior fossa,cerebral lobe contour, sylvian regions, upper brainstem contour, ventricular system (frontalhorns and trigone), inter hemispheric fissure and several main gyrations (Figure 1). For eachsubject we generated a 3D brain model and a model of the temporal and occipital horns ofthe lateral ventricle based on the individual T1-weighted MR images (Figure 2).
TractographyDTI fiducial-based seeding tractography (continuous diffusion tensor algorithm, 23) in Slicerwas applied. To reconstruct the relevant white matter fascicles, multiple fiducial volumeswere seeded along the optic tracts, near the LGN or next to the OR according to anatomicalreferences methods to identify the LGN and optic tracts in T1-weighted images and FAmaps as previously described 15,24,25. The LGN is described as a lenticular-shaped structurewith high signal intensity, lateral and caudal to the pulvinar of the thalamus in T1-weightedmagnetization-prepared rapid gradient-echo image (13.5/7/2; inversion time, 300ms; matrix,192×3×256; field-of-view, 200 mm; 48 sections of 72-mm slab thickness 26). On FA maps,the LGN is a black area medial to the green color region representing fiber tracts that runthrough temporal stem 24,25. The optic tracts partially encircle the hypothalamus and therostral portions of the crus cerebri on T1-weighted images. The multi-colored region (mix ofall 3 colors) lateral to the blue and red crus cerebri in FA map also represented the optictracts 24,25 (Figure 3-A).
Wu et al. Page 3
Neurosurgery. Author manuscript; available in PMC 2013 March 1.
NIH
-PA Author Manuscript
NIH
-PA Author Manuscript
NIH
-PA Author Manuscript

DTI fiducial seeding tractography was performed with linear measurement stopping modeand tracking curvature thresholds, respectively, of 0.12–0.15 and 0.4–0.6 degree/mm assuggested by Dauguet et al.’s study 27. Four white matter fascicles were reconstructed: theoptic tract-optic radiation fascicle (OR), Meyer’s loop (ML), the fronto-occipital part of theinferior longitudinal fascicle (IFOF), and the parieto/occipito/temporo-pontine fascicle(POTPF). To ensure that reconstructed OR fascicles connected the optic chiasm andoccipital lobes through the LGN, fiber tracking was seeded from multiple fiducial volumes(cubic seeder of 0.5mm edge) placed on the optic tracts near LGN. After comparing with themethods and results of classical DTI studies 4,15,16,17,18, we hypothesized that our methodshould be more accurate than seeding directly in the LGN based on the following threeconsiderations. First, the boundary between the optic tracts and crus cerebri was moreobvious than that between the LGN and neighboring tracts, because different color-codeddirections of tracts could be easily identified. Second, we could also check whether the ORcould pass the LGN and connect the optic chiasm or not, to make sure the tractsreconstructed belong to the visual pathways. Third, in their cadaveric study, Türe andYasargil also thought the beginning part of OR was amongst a dense network of manyneighboring fibers 5,6, so seeding directly in the LGN may increase the possibility ofincluding neighboring tracts.
The number of fiducial volumes did not have a predefined upper limit; rather, fiducialscontinued to be added until no further expected fibers were found. After the OR wasidentified, fiducial volumes or seeders for the IFOF were placed lateral to the OR toreconstruct fascicles connecting the frontal lobe and the occipital lobe and next to the OR.Fiducial volumes for the POTPF were placed medial to the OR to reconstruct fasciclesconnecting the parietal/occipital/temporal lobe and the pons. The number of streamlines ofthe reconstructed OR was counted in all subjects. A paired t-test was applied to the resultscomparing left and right OR with a significant difference set at P<0.05.
To verify the reproducibility across observers, we involved seven clinicians as raters (twoneurosurgeons, two radiologists, two oncologists, and one psychiatrist). They were shownhow to use the software and were asked to independently reconstruct the right visualpathway of one healthy subject using our method. The number of streamlines of thereconstructed OR was counted.
Data analysisThree distances were measured: between the anterior tip of the OR (Tor) and the temporalhorn of the lateral ventricle (Tor-TH), Tor and temporal pole (Tor-TP), and between Tor andoccipital pole (Tor-OP) (Figure 3-B). These distances were measured parallel to the AC-PCplane and perpendicular to the coronal plane of T1-weighted images. Because of inherentdistortion in the FA maps 22 despite co-registration and manual modification of the twoimages, the T1-weighted images and FA maps still were not exactly aligned. Themesencephalons in T1-weighted images were always a little longer than those in FA maps,so the LGN in T1-weighted images were always a little posterior to those in FA maps.Therefore, we calculated a compensated anterior-posterior distance (Ca-p) between the T1-weghted image and the FA map(Figure 3-C). The Ca-p distances were measured betweenthe posterior edges of the mesencephalon in the T1-weighted images and FA maps. The Tor-TH and Tor-TP were corrected by adding the Ca-p distances, and the Tor-OP were correctedby subtracting the Ca-p distances.
Wu et al. Page 4
Neurosurgery. Author manuscript; available in PMC 2013 March 1.
NIH
-PA Author Manuscript
NIH
-PA Author Manuscript
NIH
-PA Author Manuscript
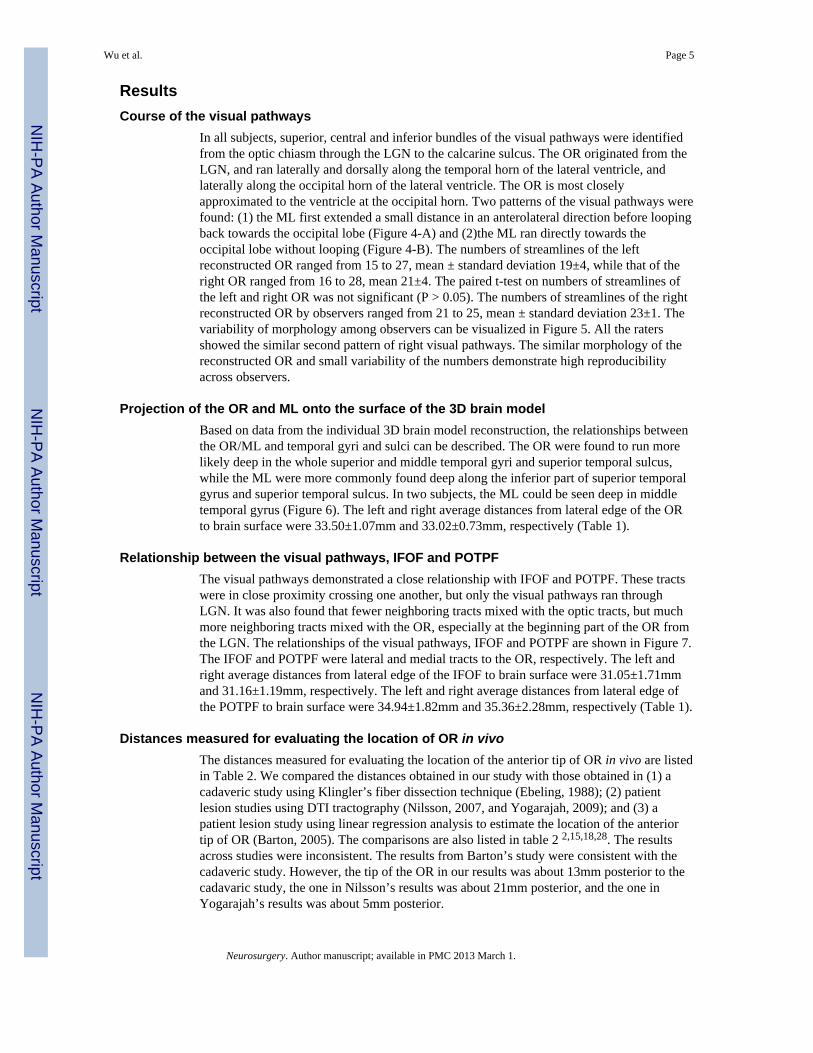
ResultsCourse of the visual pathways
In all subjects, superior, central and inferior bundles of the visual pathways were identifiedfrom the optic chiasm through the LGN to the calcarine sulcus. The OR originated from theLGN, and ran laterally and dorsally along the temporal horn of the lateral ventricle, andlaterally along the occipital horn of the lateral ventricle. The OR is most closelyapproximated to the ventricle at the occipital horn. Two patterns of the visual pathways werefound: (1) the ML first extended a small distance in an anterolateral direction before loopingback towards the occipital lobe (Figure 4-A) and (2)the ML ran directly towards theoccipital lobe without looping (Figure 4-B). The numbers of streamlines of the leftreconstructed OR ranged from 15 to 27, mean ± standard deviation 19±4, while that of theright OR ranged from 16 to 28, mean 21±4. The paired t-test on numbers of streamlines ofthe left and right OR was not significant (P > 0.05). The numbers of streamlines of the rightreconstructed OR by observers ranged from 21 to 25, mean ± standard deviation 23±1. Thevariability of morphology among observers can be visualized in Figure 5. All the ratersshowed the similar second pattern of right visual pathways. The similar morphology of thereconstructed OR and small variability of the numbers demonstrate high reproducibilityacross observers.
Projection of the OR and ML onto the surface of the 3D brain modelBased on data from the individual 3D brain model reconstruction, the relationships betweenthe OR/ML and temporal gyri and sulci can be described. The OR were found to run morelikely deep in the whole superior and middle temporal gyri and superior temporal sulcus,while the ML were more commonly found deep along the inferior part of superior temporalgyrus and superior temporal sulcus. In two subjects, the ML could be seen deep in middletemporal gyrus (Figure 6). The left and right average distances from lateral edge of the ORto brain surface were 33.50±1.07mm and 33.02±0.73mm, respectively (Table 1).
Relationship between the visual pathways, IFOF and POTPFThe visual pathways demonstrated a close relationship with IFOF and POTPF. These tractswere in close proximity crossing one another, but only the visual pathways ran throughLGN. It was also found that fewer neighboring tracts mixed with the optic tracts, but muchmore neighboring tracts mixed with the OR, especially at the beginning part of the OR fromthe LGN. The relationships of the visual pathways, IFOF and POTPF are shown in Figure 7.The IFOF and POTPF were lateral and medial tracts to the OR, respectively. The left andright average distances from lateral edge of the IFOF to brain surface were 31.05±1.71mmand 31.16±1.19mm, respectively. The left and right average distances from lateral edge ofthe POTPF to brain surface were 34.94±1.82mm and 35.36±2.28mm, respectively (Table 1).
Distances measured for evaluating the location of OR in vivoThe distances measured for evaluating the location of the anterior tip of OR in vivo are listedin Table 2. We compared the distances obtained in our study with those obtained in (1) acadaveric study using Klingler’s fiber dissection technique (Ebeling, 1988); (2) patientlesion studies using DTI tractography (Nilsson, 2007, and Yogarajah, 2009); and (3) apatient lesion study using linear regression analysis to estimate the location of the anteriortip of OR (Barton, 2005). The comparisons are also listed in table 2 2,15,18,28. The resultsacross studies were inconsistent. The results from Barton’s study were consistent with thecadaveric study. However, the tip of the OR in our results was about 13mm posterior to thecadavaric study, the one in Nilsson’s results was about 21mm posterior, and the one inYogarajah’s results was about 5mm posterior.
Wu et al. Page 5
Neurosurgery. Author manuscript; available in PMC 2013 March 1.
NIH
-PA Author Manuscript
NIH
-PA Author Manuscript
NIH
-PA Author Manuscript

DiscussionThis study uses a novel interactive selective tractography method to demonstrate theindividual anatomy of the visual pathways in the temporal lobe. After comparing with themethods and results of classical DTI studies 4,15,16,17,18, we hypothesized that our methodshould be more accurate than seeding directly in the LGN. However, in the future astatistical comparison should be applied between different algorithms to verify thesuperiority of our method. By serially adding seeder volumes until no further anatomicallyplausible tracts were found, the proposed method may allow a more exhaustive accountingof the anatomy in this complex small region. Using this approach we were able todemonstrate three bundles of the OR in most patients and two patterns of the visualpathways (Figure 4). The reproducibility of the visual pathway reconstruction wasdemonstrated to be high by seven clinicians as raters (Figure 5). The first pattern had beendescribed in the classical anatomy of the OR, and the second one was also delineated in aprevious cadaveric study. Using reconstructed individual 3D brain models, projection of theOR onto the brain surface could be shown (Figure 6), which could be useful for clinicaldecision-making such as neurosurgical guidance and planning. We were also able to revealthe relationship between the OR and neighboring tracts (Figure 7), which showed that theIFOF and POTPF were lateral and medial tracts to the OR, respectively.
Two patterns of visual pathways may exist in healthy subjectsRecent cadaveric studies have demonstrated OR and ML with consistent shape and patternas the classical course of the OR 29,30. This classical course had also been reconstructed andidentified by many investigators using DTI tractography in vivo by manually choosing tworegions of interest (ROIs) at LGN and calcarine sulcus, respectively 4,15,16. Based on ourresults, we hypothesized that two patterns of visual pathways may exist in healthy subjects.The first pattern demonstrated in our study (Figure 4-A) was similar to the classical course.The second pattern seen in our results (Figure 4-B) has also been described in one cadavericstudy 5. The authors of that study concluded “that the classical description of the opticradiation reported by Meyer is incomplete and that further investigation is necessary for anunderstanding of this complex structure”. Yasargil et al. also thought it was not possible toaccurately delineate the anterior tip of the OR, even using micro-dissection techniques incadaveric studies, particularly amongst a dense network of many neighboring fibers 6.Although the reproducibility test in our study demonstrated high reliability, due to thetechnical limitations of the cadaveric study and algorithmic errors of DTI tractography, thereal anatomy of the visual pathways still remains unclear, and will need to be investigated inthe future research combining cadaveric and DTI tractography results in more subjects.
Significant variability of delineation of the OR exists among healthy subjects and betweendifferent studies
In each of the cadaveric and DTI tractography studies, including ours, there are importantcomplexities associated with complete and accurate delineation of the OR and ML.Significant variability was seen not only in each study, but also between different studies.The most significant disparities concerned the average distance from anterior tip of the ORto temporal horn. Distances from different studies varied over 20mm, particularly amongDTI studies (Table 2) 2,4,15–18,28–30. As cadaveric study was still regarded as the goldstandard, the findings from Sherbondy et al. seem most accurate because they matched mostclosely with anatomic results. Nilsson et al. found that VFDs were consistent with DTItractography changes after they made comparisons between pre- and post-surgery DTItractography, but the results differed the most from those previously described in anatomicdissection. Many DTI studies used the same two ROIs (LGN and calcarine sulcus), butapplied different algorithms for tractography. Chen et al. used the multi-volume of interest
Wu et al. Page 6
Neurosurgery. Author manuscript; available in PMC 2013 March 1.
NIH
-PA Author Manuscript
NIH
-PA Author Manuscript
NIH
-PA Author Manuscript

approach (multi-VOIs) at the LGN and occipital cortex and seeding tractography to displaythe ML pre- and post-operatively in temporal lobe epilepsy surgery in 48 patients. Theirresults were consistent with gross anatomy findings from cadaveric studies. These variousresults indicated that DTI tractography of the OR might not be accurate for estimating thelocation of the OR. However, with the help of individual 3D brain models, the relativelocation and projection of the OR can be shown individually (Figure 6), which could makethe results of DTI tractography more practical and more reliable. The combination of 3Dbrain modeling and DTI tractography could provide useful guidance for neurosurgeons toestimate resection margins and entry site of surgical approaches.
Our results also suggested that one of the reasons for discrepancies between studies could bethe underlying individual significant variability of the OR in vivo. Another possible reasonmight be due to unclear relationships of the OR and neighboring tracts, which can beintermixed and difficult to separate even in cadaveric study 6. Another reason should be dueto the wide variability of measurements, which could be caused by distortion of differentmeasurement modalities in cadaveric and DTI studies, distortion of MRI and DTI images,error of algorithms and so on. Although our reproducibility test showed small variabilityacross observers, it still affected the accuracy of distance measurement.
The classical course of the OR may include many neighboring tracts and the actual size ofthe OR may be not as large as the classical one
Our results demonstrated that the lateral and medial margins of the OR were the IFOF andPOTPF, respectively (Figure 7). One cadaveric study also displayed the relationshipbetween the IFOF and OR 19, but did not mention the relationship between the OR andPOTPF. This is likely because it was not possible to separate them, even when applyingmeticulous microtechniques 6. We found these tracts were mixed and crossing with eachother, and even formed similar loops as ML, which may help to explain why micro-dissection is not able to separate them accurately 6.
The advantages of cadaveric study are that the results are intuitively plausible and, becauseno co-registration is needed, structural relationships may be clearly observed. Thedisadvantages are the difficulty in differentiating the real tracts of interest from neigboringtracts due to limitation of dissection techniques 5,6,31. The potential exists that“demonstrating one fiber tract often resulted in the destruction of another fiber tract” incadaveric study 6 limit the conclusions which can be inferred from classical gross anatomyof the OR and ML 5,6. Finally, such an approach could not inform understanding of theindividual anatomy in vivo. However, the advantages of DTI are the study of individuals invivo and non-invasiveness, but the disadvantages are distortion of FA map, co-registrationerror, and the inherent calculation error of the tractography algorithm. Distortion of the FAmap is related to unfavorable effects of eddy currents 22. Diffusion tensor images wereobtained with echo planar imaging (EPI), which was highly sensitive to eddy currents. Thecaculation of the diffusion tensors could be impractical if different volumes of the serieswere distorted relative to each other, and finally resulted in distortion of the FA maps 22.The distortion of the FA maps leads to misregistration of FA maps relative to the T1-weighted images. Nilsson et al 15 thought classical anatomical “optic radiations” mightoverestimate the actual size of the OR because they might include part of neighboring tracts,but DTI tractography still might underestimate the actual size of the OR because tracts couldbe lost or mistakenly reconstructed by mathmatical error of algorithm in LGN.
Using in-vivo DTI tractography described in our study, the neighboring tracts could bedifferentiated from the OR properly because they did not originate from the optic chiasmthrough LGN to the occipital lobe. Thus, this approach using individualized application of
Wu et al. Page 7
Neurosurgery. Author manuscript; available in PMC 2013 March 1.
NIH
-PA Author Manuscript
NIH
-PA Author Manuscript
NIH
-PA Author Manuscript

DTI tractography in individuals could provide complementary information for description ofthe visual pathways.
Future work regarding anatomical investigation of the visual pathways and its applicationfor pre-surgical planning
The real anatomy of the visual pathways should be verified by cadaveric study because it isstill the gold standard. However, so far it is not sufficient, nor is DTI study. Our future workwill focus on the development of micro-dissection techniques in cadaveric study and thecombination of different algorithms of DTI tractography. One of our aims is to find the realanatomical description of the visual pathways and their neighboring tracts.
Patients with pathological conditions are different from healthy subjects. Another aim in ourfuture work is to use DTI tractography to study the course of the visual pathways in differentkinds of patients, and to measure the difference between healthy subjects and patients. Thisapproach has many potential practical surgical applications. Accurate individualizedanatomical delineation of the visual pathways and 3D models of brain and lateral ventriclecould provide in-vivo location, size and edge of optic radiation for pre-surgical planning inpatients with tumor, epilepsy, stroke, brain trauma and so on. Neurosurgeons could choosesurgical approaches based on this information. In addition, the real-time reconstructedstreamlines would be shown in the neuronavigation system by connecting with the Slicersoftware, so neurosurgeons could accurately evaluate and reduce the deficit of visualfunctions as much and as early as possible.
ConclusionThe visual pathways are complex structures whose anatomic details remain unclear.Presently, neither cadaveric study nor DTI tractography can fully describe the visualpathways. Although cadaveric study still remains the gold standard to delineate the opticradiations and Meyer’s loop, DTI tractography with an individual 3D brain model provides acomplementary method to study the OR and ML in vivo. In cadaveric study, it is difficult toseparate the visual pathways from neighboring tracts and not suitable to apply the resultsdirectly to individual patients. Using the in-vivo DTI tractography described in our study, theneighboring tracts can be differentiated from the real OR, and the results are directly derivedfrom the data of individual patients, though there remain problems of distortion andalgorithm errors. Therefore, by combining the two approaches, it may be possible to balanceout the weakness of each approach to produce a more comprehensive and accurate picture ofthe anatomic configuration of these structures, and apply the results for individual clinic andsurgery more reliably.
AcknowledgmentsThis work was supported by NIH Grants 1P41RR019703-01A2 (National Center for Image Guided Therapy) andP01-CA67165, the Brain Science Foundation, the Klarman Family Foundation, and the State Scholarship Fund(File NO. 2008624048) from China Scholarship Council (CSC). We thank Kun Wang, Jie Duan, Fei Li, Na Hu,Ning He, Jiewei Liu, Tingting Jiang for their work as raters in the reproducibility test.
References1. Leuret, F.; Gratiolet, L-P. Anatomie comparée du Systéme Nerveux. Vol. II. Paris: J-B Baillére et
fils; 1839.2. Ebeling U, Reulen HJ. Neurosurgical topography of the optic radiation in the temporal lobe. Acta
Neurochirurgica. 1988; (92):29–36. [PubMed: 3407471]3. Meyer A. The connections of the occipital lobes and the present status of the cerebral visual
affections. Transactio Association of the American Physicians. 1907; (22):7–23.
Wu et al. Page 8
Neurosurgery. Author manuscript; available in PMC 2013 March 1.
NIH
-PA Author Manuscript
NIH
-PA Author Manuscript
NIH
-PA Author Manuscript

4. Yamamoto T, Yamada K, Nishimura T, Kinoshita S. Tractography to depict three layers of visualfield trajectories to the calcarine gyri. American Journal of Neuroradiology. 2005; (140):781–785.
5. Türe U, Yaşargil MG, Friedman AH, Al-Mefty O. Fiber Dissection Technique: Lateral Aspect ofthe Brain. Neurosurgery. 2000; 47(2):417–427. [PubMed: 10942015]
6. Yasargil MG, Türe U, Yasargil DC. Impact of temporal lobe surgery. J Neurosurg. 2004; (101):725–738. [PubMed: 15540909]
7. Basser PJ, Mattiello J, LeBihan D. MRdiffusion tensor spectroscopy and imaging. Biophys J. 1994;(66):259–267. [PubMed: 8130344]
8. Pierpaoli C, Jezzard P, Basser PJ, Barnett A, Di Chiro G. Diffusion tensor MR imaging of thehuman brain. Radiology. 1996; (201):637–648. [PubMed: 8939209]
9. Okada T, Miki Y, Kikuta K, Mikuni N, Urayama S, Fushimi Y. Diffusion tensor fiber tractographyfor arteriovenous malformations: Quantitative analyses to evaluate the corticospinal tract and opticradiation. American Journal of Neuroradiology. 2007; (28):1107–1113. [PubMed: 17569969]
10. Ciccarelli O, Toosy AT, Hickman SJ, et al. Optic radiation changes after optic neuritis detected bytractography-based group mapping. Human Brain Mapping. 2005; (25):308–316. [PubMed:15834863]
11. Kikuta K, Takagi Y, Nozaki K, et al. Early experience with 3-T magnetic resonance tractographyin the surgery of cerebral arteriovenous malformations in and around the visual pathway.Neurosurgery. 2006; (58):331–337. [PubMed: 16462487]
12. Powell HW, Parker GJ, Alexander DC, Symms MR, Boulby PA, Wheeler-Kingshott CA. MRtractography predicts visual field defects following temporal lobe resection. Neurology. 2005;(65):596–599. [PubMed: 16116123]
13. Taoka T, Sakamoto M, Iwasaki S, et al. Diffusion tensor imaging in cases with visual field defectafter anterior temporal lobectomy. American Journal of Neuroradiology. 2005; (26):797–803.[PubMed: 15814923]
14. Miller NR. Diffusion tensor imaging of the visual sensory pathway: Are we there yet? AmericanJournal of Ophthalmology. 2005; (140):896–897. [PubMed: 16310467]
15. Nilsson D, Starck G, Ljungberg M, et al. Intersubject variability in the anterior extent of the opticradiation assessed by tractography. Epilepsy Research. 2007; (77):11–16. [PubMed: 17851037]
16. Sherbondy AJ, Dougherty RF, Napel S, Wandell BA. Identifying the human optic radiation usingdiffusion imaging and fiber tractography. Journal of Vision. 2008; 8(10):12,01–11. [PubMed:19146354]
17. Chen X, Weigel D, Ganslandt O, Buchfelder M, Nimsky C. Prediction of visual field deficits bydiffusion tensor imaging in temporal lobe epilepsy surgery. Neuro Image. 2009; (45):286–297.[PubMed: 19135156]
18. Barton JJ, Hefter R, Chang B, Schomer D, Drislane F. The field defects of anterior temporallobectomy: a quantitative reassessment of Meyer’s loop. Brain. 2005; (128):2123–2133. [PubMed:15917289]
19. Kier EL, Staib LH, Davis LM, Bronen RA. MR Imaging of the Temporal Stem: AnatomicDissection Tractography of the Uncinate Fasciculus, Inferior Occipitofrontal Fasciculus, andMeyer’s Loop of the Optic Radiation. AJNR Am J Neuroradiol. 2004; (25):677–691. [PubMed:15140705]
20. Garaci FG, Cozzolino V, Nucci C, et al. Advances in neuroimaging of the visual pathways andtheir use in glaucoma. Progress in Brain Research. 2008; (173):165–177. [PubMed: 18929108]
21. Pataky TC, Goulermas JY, Crompton RH. A comparison of seven methods of within-subjectsrigid-body pedobarographic image registration. J Biomech. 2008; 41(14):3085–3089. [PubMed:18790481]
22. Yoshikawa T, Aoki S, Abe O, et al. Diffusion tensor imaging of the brain: effects of distortioncorrection with correspondence to numbers of encoding directions. Radiat Med. 2008; 26(8):481–487. [PubMed: 18975049]
23. Basser PJ, Pajevic S, Pierpaoli C, Duda J, Aldroubi A. In vivo fiber tractography using DT-MRIdata. Magnetic Resonance in Medicine. 2000; (44):625–632. [PubMed: 11025519]
24. Niewenhuys, RVJ.; Van Huijzen, C. The Human Central Nervous System. Berlin: Springer-Verlag; 1988.
Wu et al. Page 9
Neurosurgery. Author manuscript; available in PMC 2013 March 1.
NIH
-PA Author Manuscript
NIH
-PA Author Manuscript
NIH
-PA Author Manuscript

25. Saeki N, Fujimoto N, Kubota M, Yamaura A. MR demonstration of partial lesions of the lateralgeniculate body and its functional intra-nuclear topography. Clin Neurol Neurosurg. 2003; 106(1):28–32. [PubMed: 14643913]
26. Fujita N, Tanaka H, Takanashi M, et al. Lateral geniculate nucleus: anatomic and functionalidentification by use of MR imaging. AJNR Am J Neuroradiol. 2001; 22(9):1719–1726. [PubMed:11673167]
27. Dauguet J, Peled S, Berezovskii V, et al. Comparison of fiber tracts derived from in-vivo DTItractography with 3D histological neural tract tracer reconstruction on a macaque brain. NeuroImage. 2007; (37):530–538. [PubMed: 17604650]
28. Yogarajah M, Focke NK, Bonelli S, et al. Defining Meyer’s loop-temporal lobe resections, visualfield deficits and diffusion tensor tractography. Brain. 2009; 132(Pt 6):1656–1668. [PubMed:19460796]
29. Mahaney KB, Abdulrauf SI. Anatomic Relationship of the optic radiations to the atrium of thelateral ventricle: description of a novel entry point to the trigone. Neurosurgery. 2008; 63:195–203. [PubMed: 18981826]
30. Rubino PA, Rhoton AL Jr, Tong X, Oliveira E. Three-dimensional relationships of the opticradiation. Neurosurgery. 2005; (57):219–227. [PubMed: 16234668]
31. Wang F, Sun T, Li XG, Liu NJ. Diffusion tensor tractography of the temporal stem on the inferiorlimiting sulcus. J Neurosurg. 2008; (108):775–781. [PubMed: 18377258]
Wu et al. Page 10
Neurosurgery. Author manuscript; available in PMC 2013 March 1.
NIH
-PA Author Manuscript
NIH
-PA Author Manuscript
NIH
-PA Author Manuscript

Figure 1.The first step of co-registration is rigid linear registration and superposition of color-orientation FA maps with T1-weighted MR images. It was done by automatically and thenmanually modifying linear transformation, such as translation and rotation of the FA maps.The blue ellipse shows the FA maps were still longer and higher than the T1-weightedimages after the first step of co-registration. The second step of co-registration is inter-slicespace resizing of the FA maps by manually modifying in Slicer to review the anatomicprecision of the registration (visual analysis of merged images, iterative test-re-test) usingseveral landmarks: putamen, pallidum, corpus callosum (whole body and/or major andminor forceps), anterior and posterior limbs of the internal capsule, cerebellar contour,tentorium of the posterior fossa, cerebral lobe contour, sylvian regions, upper brainstemcontour, ventricular system (frontal horns and trigone), inter hemispheric fissure and severalmain gyrations.
Wu et al. Page 11
Neurosurgery. Author manuscript; available in PMC 2013 March 1.
NIH
-PA Author Manuscript
NIH
-PA Author Manuscript
NIH
-PA Author Manuscript

Figure 2.Individual 3D brain model and model of the temporal and occipital horns of the lateralventricle based on the individual T1-weighted MR images. The model shows the gyri andsulci of the frontal and temporal lobes and show the projection of the OR and ML onto thecortical surface. The model of lateral ventricle demonstrates its relationship with the nervefiber bundles reconstructed.
Wu et al. Page 12
Neurosurgery. Author manuscript; available in PMC 2013 March 1.
NIH
-PA Author Manuscript
NIH
-PA Author Manuscript
NIH
-PA Author Manuscript

Figure 3.A) Color-coded axial FA maps demonstrate placement of the fiducial volume seeders forreconstruction of four white matter fascicles of interest. The fiducial volumes were placed inthe optic tract near LGN (green indicates fascicles running in an anterior-posterior direction,red superior-inferior, and blue left-right). B) Three distances were measured in everysubject: the distances between the anterior tip of the OR (Tor) and the temporal horn of thelateral ventricle (Tor-TH), Tor and temporal pole (Tor-TP), Tor and occipital pole (Tor-OP).Red tracts represent reconstructed visual pathways and blue indicates temporal and occipitalhorns of the lateral ventricle. C) The compensated anterior-posterior distance (Ca-p)wasmeasured between the posterior edges of mesencephalon of superimposed T1-weightedimages (blue image) and FA maps (purple image). LGN: lateral geniculate nucleus; OT:optic tract; OC: optic chiasm
Wu et al. Page 13
Neurosurgery. Author manuscript; available in PMC 2013 March 1.
NIH
-PA Author Manuscript
NIH
-PA Author Manuscript
NIH
-PA Author Manuscript

Figure 4.A) The first pattern of visual pathways in which the tractography demonstrates the ML firstextending a small distance in an anterolateral direction before looping back towards theoccipital lobe. B) A second pattern of visual pathways in which the tractographydemonstrates the ML running directly to occipital lobe without looping. Visual pathways areshown in orange, which include the optic tracts, ML and OR. Individual models of thetemporal and occipital horns of the lateral ventricle are shown in blue. Background imagesare individual T1-weighted axial and sagittal images.
Wu et al. Page 14
Neurosurgery. Author manuscript; available in PMC 2013 March 1.
NIH
-PA Author Manuscript
NIH
-PA Author Manuscript
NIH
-PA Author Manuscript

Figure 5.Reproducibility across observers was verified using seven clinicians as raters. The rightvisual pathways of the same subject were reconstructed individually and visualized to checkthe variability. All the raters showed the similar second pattern of right visual pathways, inwhich the ML ran directly towards the occipital lobe without looping. The ML lied in thebottom part of the OR. The numbers of streamlines of the right reconstructed OR byobservers ranged from 21 to 25, mean ± standard deviation 23±1. The similar morphology ofthe reconstructed OR and small variability of the numbers demonstrate high inter-observeragreement.
Wu et al. Page 15
Neurosurgery. Author manuscript; available in PMC 2013 March 1.
NIH
-PA Author Manuscript
NIH
-PA Author Manuscript
NIH
-PA Author Manuscript

Figure 6.Individually reconstructed 3D brain model demonstrates projection of the OR and ML ontothe brain surface. The OR were found to run deep to the whole superior and middle temporalgyri and superior temporal sulcus, while the ML were found deep along the inferior part ofsuperior temporal gyrus, superior temporal sulcus and middle temporal gyrus. Visualpathways are shown in orange, which include the optic tracts, ML and OR. Individualmodels of the temporal and occipital horns of the lateral ventricle are shown in blue.Background images are individually reconstructed as the 3D brain model. The opacitydegree of brain model ranges from 0 (transparent) to 1 (completely opaque). The opacity infigure A is 1, to best depict the gyral surface. The opacity in B and C is 0.5, to bestdemonstrate the projection of fiber tracts onto the brain surface.
Wu et al. Page 16
Neurosurgery. Author manuscript; available in PMC 2013 March 1.
NIH
-PA Author Manuscript
NIH
-PA Author Manuscript
NIH
-PA Author Manuscript

Figure 7.The relationship among the visual pathways, IFOF and POTPF using DTI tractographydemonstrates the IFOF and POTPF are lateral and medial tracts to the OR respectively.Visual pathways are shown in orange, which include the optic tracts, ML and OR. The IFOFand POTPF are shown in blue and green respectively. Individual models of the temporal andoccipital horns of the lateral ventricle are shown in blue. Background images are individualT1-weighted axial and sagittal images.
Wu et al. Page 17
Neurosurgery. Author manuscript; available in PMC 2013 March 1.
NIH
-PA Author Manuscript
NIH
-PA Author Manuscript
NIH
-PA Author Manuscript

NIH
-PA Author Manuscript
NIH
-PA Author Manuscript
NIH
-PA Author Manuscript
Wu et al. Page 18
Tabl
e 1
The
dist
ance
s fro
m la
tera
l edg
es o
f the
OR
, IFO
F, P
OTP
F to
the
brai
n su
rfac
e. T
he O
R is
just
bet
wee
n th
e IF
OF
and
POTP
F. T
he IF
OF
and
POTP
F ar
ela
tera
l and
med
ial t
ract
s to
the
OR
resp
ectiv
ely.
LE O
R re
fers
to la
tera
l edg
e of
the
OR
, LE I
FOF
refe
rs to
late
ral e
dge
of th
e IF
OF,
LE P
OTP
F re
fers
to la
tera
led
ge o
f the
PO
TPF,
and
BS
refe
rs to
bra
in su
rfac
e.
LE
OR
-BS
(X±S
D m
in-m
ax(m
m))
LE
IFO
F-B
S (X
±SD
min
-max
(mm
))L
EPO
TPF
-BS
(X±S
D m
in-m
ax(m
m))
LR
LR
LR
33.5
0±1.
0733
.02±
0.73
31.0
5±1.
7131
.16±
1.19
34.9
4±1.
8235
.36±
2.28
32.5
1~35
.64
32.0
4~33
.96
29.3
3~34
.72
29.1
1~33
.10
32.9
7~38
.33
33.0
9~39
.30
Neurosurgery. Author manuscript; available in PMC 2013 March 1.

NIH
-PA Author Manuscript
NIH
-PA Author Manuscript
NIH
-PA Author Manuscript
Wu et al. Page 19
Tabl
e 2
Com
paris
on o
f dis
tanc
es in
cad
aver
ic st
udy
usin
g K
lingl
er’s
fibe
r dis
sect
ion
tech
niqu
e, p
atie
nt st
udie
s and
our
stud
y us
ing
DTI
trac
togr
aphy
. The
ante
rior-
post
erio
r dis
tanc
es in
our
stud
y w
ere
com
pens
ated
indi
vidu
ally
usi
ng th
e co
mpe
nsat
ion
dist
ance
met
hod
desc
ribed
(Ca-
p). P
oste
rior i
s pos
itive
rela
tive
to th
e te
mpo
ral h
orn
(TH
) whi
le a
nter
ior i
s neg
ativ
e re
lativ
e to
the
tem
pora
l hor
n (T
H) i
n To
r-TH
dis
tanc
es.
Cad
aver
ic st
udy
Patie
nt st
udie
sPr
esen
t stu
dy
Ebe
ling
2 , 19
88N
ilsso
n 15
, 200
7Y
ogar
ajah
28, 2
009
Bar
ton
18, 2
005
Wen
tao,
200
9
Mea
sure
men
tX
±SD
min
-max
(mm
)X
(mm
)X
(mm
)X
(mm
)X
±SD
min
-max
(mm
)
LR
Tor-
TH−5±3.2
160
8.69
±1.9
39.
94±2
.63
(dis
tanc
e)−10~5
8~21
−9~15
7~11
.16.
2~14
.7
Tor-
TP27
±3.5
4434
39.8
6±3.
8240
.67±
5.74
(dis
tanc
e)22
~37
34~5
124
~43
24~2
834
.8~4
9.5
34.6
~53.
6
Tor-
OP
98±6
.287
.19±
5.45
85.7
1±5.
38
(dis
tanc
e)85
~108
79.2
~95
80.3
~94.
1
Neurosurgery. Author manuscript; available in PMC 2013 March 1.