Embed Size (px)
Citation preview

Pilot Findings Report Activity 3.5 Submission Date: December 14, 2018 AID-OAA-TO-16-00017 Number: REQ-ASIA-16-00017 TOCOR: Mitch Kirby Prepared by: RTI International 3040 Cornwallis Road Research Triangle Park, NC 27709-0155 Tel: (919) 541-6000 This document was produced for review by the United States Agency for International Development.
All Children Reading – Asia
Vision and Hearing Screening Tools Pilot Activity in the Philippines

i
Table of Contents List of Figures ................................................................................................................. iii
List of Tables .................................................................................................................. iii
Acronyms ........................................................................................................................ iv
Introduction ............................................................................................................ 1
Research Methodology and Sample ................................................................. 2
2.1 Research Questions ........................................................................................................ 2 2.2 Data Collection Instruments ......................................................................................... 2 2.3 Sample Descriptives—School and Student Sample ................................................. 4
Pilot Findings ........................................................................................................... 4
3.1 Vision Screening Results ................................................................................................. 4 3.2 Hearing Screening Results ............................................................................................. 6 3.3 Electronic Screening Results Compared to Washington Group Short Set of
Questions on Disability .................................................................................................. 8 3.4 Using Schools as Screening Spaces ............................................................................ 10 3.5 Screener Type ................................................................................................................. 14 3.6 Training Duration and Design ..................................................................................... 17 3.7 Parent Notification and Referral Process ................................................................ 18
Conclusions .......................................................................................................... 19
4.1 Are the selected screening tools able to appropriately and reliably detect children with vision and hearing difficulties within the Filipino context? ......... 19
4.2 What are the necessary conditions to reliably and effectively administer the selected tools?................................................................................................................. 20
4.3 Can the screening tools be effectively used by teachers in the Philippines to screen and detect students with vision and hearing difficulties? ........................ 20
4.4 How much training is needed to ensure reliable screening results? ................. 21
ii
Next Steps ............................................................................................................ 21
Works Cited ........................................................................................................ 22
Annex A: User Adoption Test ................................................................................. 24
Annex B: Student Interview ...................................................................................... 26
Annex C: Principal Interview .................................................................................... 32
Annex D: VI, HI, Difficulty Seeing and Difficulty Hearing ................................. 40
Annex E: Guidelines for Screeners and School Screening using Electronic Screening Tools ................................................................................................... 41

iii
LIST OF FIGURES Figure 1. Percent of screened children with potential vision Impairment by severity
(n=1,218) ................................................................................................................................ 5 Figure 2. Hearing screening results by severity for pilot days 6—8 .......................................... 8 Figure 3. Self-reported difficulties from Washington Group Short Set of Disability
Questions ............................................................................................................................... 9 Figure 4. Testing spaces used in pilot schools............................................................................... 11 Figure 5. Screener-reported testing conditions ............................................................................ 12 Figure 6. Average ambient noise level by day and frequency and average referral rate of
students screened ............................................................................................................... 13 Figure 7. Percent of screeners’ performance observations without errors by screener
type......................................................................................................................................... 16 Figure 8. Percent of students who request assistance in the classroom ................................ 17 Figure 9. Rapid User Adoption Test results .................................................................................. 18
LIST OF TABLES Table 1. Severity level with LogMAR score and Snellen equivalencies .................................... 4 Table 2. Vision screening results by region .................................................................................... 5 Table 3. Vision screening results by gender (all schools combined) ........................................ 6 Table 4. Hearing screening referral and pass rates (pilot days 1—8) ...................................... 6 Table 5. Severity protocol referral standards (pilot days 4–5) .................................................. 7 Table 6. Modified severity protocol referral standards (pilot days 6–8) ................................. 7 Table 7. Test-retest results ................................................................................................................ 8 Table 8. Peek Acuity results compared to Washington Group Vision Question ............... 10 Table 9. hearScreen results compared to Washington Group Vision Question ................ 10 Table 10. Average ambient noise levels (in dB) by day, frequency, and ear ........................... 12 Table 11. Average age and years of experience by screener type ............................................ 15

iv
ACRONYMS DepEd Philippines Department of Education dB decibel(s) kHz kilohertz MFAT Multifactored Assessment Tool NCR National Capital Region SPED Special Education in the Philippines USAID US Agency for International Development WHO World Health Organization

1
INTRODUCTION Inclusive education has gained increasing priority within the US Agency for International Development (USAID) and the countries in which the agency works. USAID missions in Asia are more and more developing strategies for how best to support ministries of education to better promote and enable early grade reading programs that are responsive to needs of students with all levels of abilities. One such approach is early screening of students for disabilities, such as vision or hearing impairments.
Screening is a process conducted by non-medical staff or personnel to determine whether a student might have a potential disability. A screening activity does not result in, or replace, a medical diagnosis by a trained professional, as it is by definition a rapid and simplified measure. Screening activities typically test only for some aspects of a potential disability and are intended to inform whether a person may need a referral for further evaluation.
Globally and in the Asia region, the importance of early screening for disabilities is critical to reduce and mitigate potential long-term effects, including on education, employment, and overall economic and socio-emotional well-being. As highlighted by the World Health Organization (World Health Organization [WHO], 2011) children with disabilities continue to be less likely to attend school and, even less so, to complete school. Students with disabilities also have lower transition rates to secondary and higher education. Indicatively, for Vietnam, the country’s 2010 census data revealed a 48% primary school completion rate among persons with disabilities compared to an 83% completion rate for persons without disabilities (United Nations Population Fund [UNFPA], 2011). Existing data also suggests that persons with disabilities are less likely to be employed (Mitra, Posarac, & Vick, 2013). Reduced access to education and employment, in turn, considerably shapes the socio-economic well-being of households that include a person with a disability (Banks & Polack, 2014). This not only affect individuals and their families, but societies at large. Illustratively, the World Bank estimated the economic loss from lack of education and employment of households that include someone with a disability in Bangladesh of US$1.2 billion annually (World Bank, 2008).
Yet, data across the region highlight the lack of empirical evidence and data on inclusive education, including the prevalence of disabilities (Strigel, 2018). Specific data deficits exist on enrollment and academic achievement, as well as on social and affective outcomes of inclusive education for students with disabilities (Banks & Polack, 2014; Filmer, 2008; Wapling, 2016). In its 2011 World Report on Disabilities, the WHO also highlighted these challenges with prevalence data on disabilities, stating problems with the standardization of definitions, categorizations, and related measurement.
The lack of reliable data on disability and disability prevalence rates is not only caused by challenges with the standardization of instruments and classifications, and but also due to the absence of systematic early disability screening (Scherzer, Chhagan, Kauchali, & Susser, 2012; WHO, 2011). These data gaps limit the region’s access to reliable records on the school enrollment of students with disabilities and, at the community and school level, early support and intervention.
For the Philippines, data from the 2010 census suggested a 1.57% disability prevalence rate nationwide (Government of the Philippines, 2013). Data from census surveys are customarily self-reported. Rarely, national prevalence data stem from large-scale medical examinations that constitute a diagnostic, rather than a self-report, of potential disabilities. As recognized in the literature, such self-report measures are likely to underestimate true prevalence rates (Male & Wodon, 2017). In recent years the Government of the Philippines, as well as the civil society sector and others, have expanded efforts to accelerate early screening and intervention services. Indicative of this work is the Multifactored Assessment Tool (MFAT) recently introduced by the Department of Education (DepEd).
The MFAT is an activity-based observational measure for children, designed to be administered by teachers only to those students who might exhibit delays in their developmental advancement or learning. The tool contains items to screen for potential delays along five domains, including the cognitive, communication, socio-emotional, motor, and daily living skills domains. The MFAT also

2
includes observational items for vision screening, for example whether the child holds materials too close to their eyes, squints when performing a task, or rubs the eyes. At the time of writing this report, the tool was just being piloted. In addition to the MFAT, there are a range of disability screening approaches employed in the country, including through the country’s network of medical officers in the DepEd. Anecdotal evidence indicates that screening efforts continue to rely on tools that, while low-cost, appear to have gaps in reliability and validity (Dey, Davessar, Kumar, & Sharma, 2016). Furthermore, efforts to date have not been systematic across the education sector and rarely included teachers as screeners.
The present report documents the outcomes of a study, implemented jointly by DepEd and RTI International, to pilot a set of electronic vision and hearing screening tools that have been successfully used elsewhere, including by teachers (Strigel, 2017). These tools hold the promise for easy administration, even with limited training, and more reliable data, especially when screening for hearing impairments. The specific purpose of the pilot and its research questions and methodology are described in more detail in the next sections.
RESEARCH METHODOLOGY AND SAMPLE The purpose of this activity was to pilot screening tools as a proof of concept. The screening tools are intended to help assist Filipino teachers to detect students in their classroom with vision or hearing difficulty who may need additional support. Establishing options of reliable tools that can be administered by teachers at the classroom level with minimal training will ultimately help prepare the stage for interventions that can respond with inclusive education activities to maximize learning for students with vision or hearing difficulties.
The sections below outline the proof-of-concept methodology that was used to explore the use of Peek Vision1 and hearScreen2 software to conduct vision and hearing screenings in Filipino schools.
2.1 Research Questions The primary research questions that were answered through this pilot study are:
Are the selected screening tools able to appropriately and reliably detect children with vision and hearing difficulties within the Filipino context?
What are the necessary conditions to reliably and effectively administer the selected tools?
Can the screening tools be effectively used by teachers in the Philippines to screen and detect students with vision and hearing difficulties?
How much training is needed to ensure reliable screening results?
2.2 Data Collection Instruments Eight different tools were used throughout the training and pilot to answer the research questions at hand.
Rapid user adoption test
This tool is a pre- and post-test that was administered individually to all participants at the start and end of training. The purpose of this tool is to gauge what experience participants had prior to training (use of electronics, use of the specific software) compared with their abilities at the end of training. Annex A provides a copy of the test. The test was administered to all 18 participants who served as screeners for the pilot data collection.
1 For more information, see https://www.peekvision.org 2 For more information, see https://www.hearxgroup.com

3
hearScreen
hearScreen is a smartphone-based hearing test developed by hearX, a South African-based organization. To administer the hearing test, the screener places a headset on the student and stands behind them and then asks the student to respond to a series of beeps by raising their hand. The screening app plays beeps at various frequencies and at different noise levels (decibels) to detect to what degree a student may have trouble hearing and in which ear(s). In a validation study with 1,070 school-aged children in South Africa, hearScreen obtained a sensitivity of 75.0% and specificity of 98.5% compared to conventional screening audiometry (Mahomed-Asmail, Swanepoel, Eikelboom, Myburgh, & Hall, 2016).
Peek Acuity
Peek Acuity is a mobile software, developed by a UK-based organization (Peek Vision), that enables eye checks in homes, communities, and schools. To administer the Peek Acuity test, the screener stands facing the student and holds a tablet where the student can see it. The student covers one eye at a time. The symbol “E” appears on the screen of the tablet and rotates and changes in size throughout the duration of the test. The child is asked to respond by pointing in the direction that the symbol is facing. The test detects whether a child is experiencing difficulty seeing, at what severity level, and for which eye. In total, 1,218 students were screened using the vision application. A recent validation study conducted with 393 children aged 6–16 years in Paraguay obtained a sensitivity of 48% and 83% specificity compared to a medical evaluation by a pediatric ophthalmologist. While sensitivity was relatively low, two alternative approaches for vision screening by non-medical professionals, a single line of tumbling E optotypes set at 20/40 and the Spot Vision Screener, yielded similar scores to Peek Acuity (De Venecia, Bradfield, Møller Trane, Bareiro, & Scalamogna, 2018).
Student background interview
A brief interview was conducted with children who received a vision and hearing screening (see Annex B). The interview included the Washington Group Short Set of Disability Questions.3 This instrument includes five questions, directly asking children whether they have difficulties in hearing, seeing, walking/climbing, concentrating, and self-care. Children answer choosing one of the following responses: “Cannot do at all”; “Yes, a lot of difficulty”; “Yes, some difficulty”; “Some difficulty”; and “No, no difficulty.”
Principal interview
The principal from each school participated in a brief interview to answer background questions about the school, known disabilities among students in the school, and the school’s inclusive education program (see Annex C).
Screener performance observation
This instrument was used to collect data on the accuracy of screeners in administering vision and hearing tests. A total of 103 screen performance checks were conducted; however, the number of checks per screener varies depending on number of data collection days for which the screener was present. Each evaluation was set up such that there was one main screener screening the child. Additional screeners observed and recorded the accuracy of the main screener throughout the duration of the screening. The observation included 18 tasks for the vision screening and 11 tasks for the hearing screening.
Screener exit interviews
At the conclusion of data collection, screeners were interviewed to get feedback regarding the tools and the training and data collection process. Teachers were interviewed individually (8 interviews in
3 For more information, visit http://www.washingtongroup-disability.com/washington-group-question-sets/short-set-of-disability-questions/

4
total); group interviews were conducted with school administrators (6 participants) and medical officers (4 participants).
2.3 Sample Descriptives—School and Student Sample Two regions in the Philippines were selected to participate in the pilot study. The National Capital Region (NCR) and Region IV-A were selected based on 2016–2017 school year Special Education in the Philippines (SPED) data that indicated these two regions had the highest prevalence rates for diagnosed and undiagnosed vision and hearing impairments among elementary and high school aged children (see Annex D). A convenience sample of four schools was selected in each region. The schools were easily accessible to minimize travel time of screeners. The schools in NCR were located in and around Manila, and the schools in Region IV-A were located in and around Batangas City and Lipa City.
A total of 1,218 children were screened. Students who participated in the screenings were not randomly sampled. Rather, a specific grade was selected at each school and the screening team accommodated as many sections within the grade as possible during the duration of the visit/school day. Of the children screened, 551 were from NCR, and 667 were from schools in Region IV-A. Within the sample, roughly 50% of the children were boys and 50% were girls; 190 were Grade 1 students, 814 were Grade 2 students, and 214 were Grade 3 students.
PILOT FINDINGS
3.1 Vision Screening Results Children in the selected schools were screened for potential vision impairments using a visual acuity mobile screening tool called Peek Acuity. While the screening tool cannot replace traditional eye examinations that are conducted by specialized optometrist, the Peek Acuity test is specifically designed to be used by untrained persons in schools and community settings to help identify those who may need further examination. Each child who is screened is classified under one of the following categories: 1) normal, 2) mild impairment, 3) moderate impairment, 4) severe impairment, and 5) blindness. As shown in Table 1, these categories align with the WHO categories (WHO, 2010) and correspond with the numerical LogMAR and Snellen scores visual acuity is commonly expressed in.
Table 1. Severity level with LogMAR score and Snellen equivalencies
Vision Category LogMAR Score | Snellen
Normal 0–0.3 | 6/6–6/12 Mild visual impairment >0.3–0.48 | >6/12–6/18 Moderate visual impairment >0.48–1.0 | >6/18–6/60 Severe visual impairment >1.0 | >6/60–3/60
Blindness >1.3 | >3/60 Figure 1 presents the percent of screened children with potential vision impairments by severity level. Nearly 94% children who were screened were categorized as having normal vision, with only 6% of children identified as having potential vision difficulties ranging from mild to severe.

5
Figure 1. Percent of screened children with potential vision Impairment by severity (n=1,218)
Table 2 presents the number of referred students by region and severity level.4 The number of referrals was higher in NCR than in Region IV-A. These findings align with DepEd’s Consolidated SPED Data 2016—2017, which shows NCR has the highest numbers of diagnosed and undiagnosed vision impairments among elementary-aged students (see Annex D).
Table 2. Vision screening results by region
NCR
(n=551) %
Region IV-A
(n=667) %
Mild Impairment
27 4.90 2 .30
Moderate Impairment
39 7.08 5 .75
Severe Impairment
3 .54 -- --
Total 69 12.52 7 1.05
As indicated in Table 3, overall more girls were referred for having potential vision impairments. Across all eight schools, 45 out of the 76 referrals were for girls.
4 It is important to note the difference in the sample sizes per region.
93.68%
2.38%3.61%
0.25%
Normal Mild Impairment Moderate Impairment Severe Impairment

6
Table 3. Vision screening results by gender (all schools combined)
Boys (n=611) %
Girls (n=607) %
Mild Impairment
8 1.31 21 3.46
Moderate Impairment
23 3.76 21 3.46
Severe Impairment
0 -- 3 .49
Total 31 5.07 45 7.41
3.2 Hearing Screening Results Conducting hearing screenings during childhood is critical as a method of early identification. Pure tone audiometry assessments are commonly used to assess children’s inner ear using responses to tones at inter-octave frequencies (hearX group, n.d.). School and community-based settings are common place for conducting hearing screenings, especially in low-resourced contexts, as they provide a cost-efficient way to detect late onset or progressive hearing loss.5
For this pilot, students were screened using hearScreen, a pure tone audiometry screening mobile application developed by hearX. After a 2015 study conducted in South Africa, hearX developed its standard protocol for hearing screening in schools in resource-limited contexts. The protocol begins testing at 25 decibels (dB) rather than 20 dB as it produces more acceptable referral rates for school screening environments (Mahomed-Asmail, Swanepoel, & Eikelboom, 2016). According to hearX experts, referral rates in these settings should be below 10%, ideally between 3%–7% (hearX group, n.d.).
Table 4 presents hearScreen results from the eight pilot schools in the Philippines. The results are presented by day and indicate the percent of students passed or referred. As this was a pilot test of the screening tool, adjustments were made to improve the protocol throughout the pilot and are described in more detail below.
Table 4. Hearing screening referral and pass rates (pilot days 1—8)
NCR Region IV-A
Day 1 (n=66)
Day 2 (n=164)
Day 3 (n=144)
Day 4 (n=205)
Day 5 (n=112)
Day 6 (n=178)
Day 7 (n=201)
Day 8 (n=190)
Referred 89% 96% 90% 76% 78% 7% 7% 2%
Passed 11% 4% 10% 24% 22% 93% 93% 98%
Protocol Used Standard Protocol
Standard Severity Protocol 25 dB
Modified Severity Protocol 30 dB & 2 failed frequencies
5 For more information, see the resources at the American Speech-Language-Hearing Association (ASHA): https://www.asha.org/Practice-Portal/Professional-Issues/Childhood-Hearing-Screening/)

7
During pilot days 1–3, the hearScreen standard protocol, starting at 25dB, was used. In line with typical audiology tests, the hearScreen standard protocol tests at three main frequencies, and first tests the left ear followed by the right ear.
Prior to starting the screening, the hearScreen standard protocol first presents a conditioning (or practice) tone at 1 kilohertz (kHz) at an intensity level of 35 dB. Following the conditioning tone, the left ear is tested at 1 kHz, 2 kHz, and 4 kHz at a 25 dB intensity level. If the child does not respond to a beep at any of the given frequencies on the first time it is presented, a second beep (at the same frequency and intensity) is presented immediately after. No response on the second beep at the 25 dB intensity level constitutes a referral. The same procedures are then followed for the right ear. The referral rates using the standard protocol were extremely high; between 88% to 95% of students did not pass the screening using this protocol.
On days 4 and 5, the protocol was modified to screen for severity levels. With the hearScreen severity protocol, again, each ear is tested separately. Children are first presented with a conditioning tone at 1 kHz at 30 dB. If the child does not respond, a second conditioning tone at the same frequency is presented at an intensity of 70 dB. After conditioning, the protocol presents tones at 1 kHz starting at an intensity of 25 dB. If the child is unresponsive on the first beep, the tone is presented at the same frequency and intensity a second time. If no response on the second beep, the intensity of the tone increases until the child responds. No response at 25 dB on any of the three frequencies constitutes a referral. Table 5 indicates the referral criterial (in dB) for each severity level in the hearScreen severity protocol.
Table 5. Severity protocol referral standards (pilot days 4–5)
Student responds at Severity
25 dB None
<45 dB Mild
<60 dB Moderate
<=70 dB Moderate-Severe
Adjusting the protocol to use the severity protocol did result in a slight increase in the number of students who passed the screening; however, the referral rates on days 4 and 5 were still much higher than expected.
On days 6—8, the severity protocol was modified, and the protocol was adjusted to begin the test at an intensity of 30 dB instead of 25 dB. The referral criteria for the modified severity protocol are presented in Table 6.
Table 6. Modified severity protocol referral standards (pilot days 6–8)
Student Responds at Severity
30 dB None
<45 dB Mild
<60 dB Moderate
<=70 dB Moderate-Severe
In addition, the modified severity protocol refers any child who does not pass two or more of the frequencies. There were sustainably fewer referrals on days 6–8 as a result of the increase in the number of required failed frequencies from one to two and the increase in intensity. Using this protocol, referral rates fell below the desired 10% (see Table 4). It is important to note that the tool still recorded a potential impairment and the severity level after one failed frequency. The

8
percentages of screened students with potential impairments by severity level are presented in Figure 2.
Figure 2. Hearing screening results by severity for pilot days 6—8
As shown in other studies using hearScreen mobile software, immediately rescreening students can further reduce referral rates (Mahomed-Asmail, Swanepoel, & Eikelboom, 2016). Students in the Philippines pilot were randomly selected to undergo rescreening. Rescreening reduced referral rates by nearly 30% (see Table 7). This is likely because the child was more familiar with the process and the sound of the beeps and, therefore, more responsive during the second screening. In most cases (about 18%), when results changed after a second screening, students’ severity decreased from mild to pass/none.
Table 7. Test-retest results
First Test Result Last Test Result
Number of Students (n=162) Percent
Fail Fail 107 66%
Pass Pass 11 7%
Fail Pass 44 27%
3.3 Electronic Screening Results Compared to Washington Group Short Set of Questions on Disability
The Washington Group developed a short set of questions that are intended to gather data on individuals who experience difficulty or limitations in performing universal functional activities (e.g., walking, seeing, remembering) (Washington Group on Disability Functioning, 2018). In the case of
79%
90% 91%
16%
5% 6%4% 3% 2%1% 3% 1%0%
20%
40%
60%
80%
100%
Day 6 Day 7 Day 8
% o
f scr
eene
d st
uden
ts
None Mild Moderate Moderate Severe

9
this pilot, the questions were self-reported by students and asked as part of the Student Background Questionnaire before the electronic screenings were conducted.
According to sampled student responses, 10% of students reported having some difficulty seeing, while 2% of the sampled students indicated they have a lot of difficulty seeing. Similarly, 10% of the sampled students indicated difficulty in hearing, while another 2% of the students indicated a lot of difficulty or no ability to hear at all. Among the sample of students, difficulty concentrating was the most commonly reported disability, with 19% of students indicating some level of difficulty (Figure 3).
Figure 3. Self-reported difficulties from Washington Group Short Set of Disability Questions
There was a slight overlap between self-report and electronic screening methods. For this analysis, categories for the Washington Group questions were condensed by grouping “Cannot do at all”, “Yes, a lot of difficulty”, and “Yes, some difficulty” together into a new group: “Some difficulty.” Categories in the hearScreen and Peek Acuity tools were condensed by grouping mild, moderate, and moderate-severe into a single category labeled “Some Impairment.” Table 8 shows that the two screening methods produced similar results for 85% of sampled children (n=1,218) (i.e., 83% no impairment/no difficulty and 2% some impairment/some difficulty). In total, 204 students were flagged for a potential vision impairment by one or both methods; 56 children were identified by only Peek Acuity, while 127 were identified by only the Washington Group Questionnaire. Only a very small number of students (21) were flagged for potential vision disability by both methods. In this case, the self-report method appears to have resulted in a notably larger number of students reporting a potential vision impairment, compared to the direct vision testing conducted with Peek Acuity.
Self-reporteddifficulty hearing
Self-reporteddifficulty seeing
Self-reporteddifficulty
walking/climbing
Self-reporteddifficulty
concentrating
Self-reporteddifficulty with
self careCannot do at all 1% 0% 0% 1% 1%
Yes, a lot of difficulty 1% 2% 1% 0% 1%
Yes, some difficulty 10% 10% 7% 18% 7%
No, no difficulty 88% 88% 91% 80% 91%
0%
10%
20%
30%
40%
50%
60%
70%
80%
90%
100%
% o
f scr
eene
d st
uden
ts

10
Table 8. Peek Acuity results compared to Washington Group Vision Question
Peek Acuity
No impairment
Some impairment
Washington Group Question
No Difficulty 83%
(n=1,014) 5% (n=56)
Some Difficulty 10% (n=127) 2% (n=21)
Table 9 indicates that 83% of sampled children had comparable results for hearScreen and the Washington Group question on hearing difficulty (82% no difficulty/no impairment and 1% some difficulty/some impairment). The results for this analysis include pilot days 6–8 (n=555). While this overlap seems substantial, it is important to recognize that out of the 101 children identified by one or both screening methods, only 4 children were identified by both (about 4%). Therefore, there is very little overlap between the two screening methods in regard to the students being identified as having potential hearing impairment.
Such gaps in overlap also existed in other studies comparing screening approaches. Mactaggart, Kuper, Murthy, Oye, and Polack (2016) conducted a study in Cameroon and India aimed at examining the interrelationship between clinically measured impairments and self-reported functional limitations using the United Nations Children’s Fund/Washington Group Extended Set on Child Functioning and Disability for children. The study found that 45% of the participants identified as having a disability were both self-reported and clinically screened and examined to have a disability. A small proportion, 14%, of cases found to have a disability were only self-reported and not possible to confirm clinically. However, 41% of the participants in the India study who were identified with a disability were only identified through the clinical screening process, and not from the self-reports.
Table 9. hearScreen results compared to Washington Group Vision Question
hearScreen
No impairment
Some impairment
Washington Group Question
No Difficulty 82% (n=454) 12% (n=68)
Some Difficulty 5% (n=29) 1% (n=4)
3.4 Using Schools as Screening Spaces Schools and other public community settings present a unique set of challenges when it comes to conducting mobile screenings. One major challenge, especially with electronic hearing screenings, is that the noise levels in these particular settings may be higher than desired and may create false positive results. If too many referrals are given due to false positives, screening programs are no longer sustainable and run the risk of overloading health facilities. One way to minimize false positives is to adjust the intensity of the screening protocol to account for the higher than normal noise levels. However, if the screening protocol is modified too far from recommended practices, mild cases of hearing loss may be overlooked.

11
The Philippines and schools selected for this particular pilot were no exception to high ambient noise levels. The schools were all located in and around cities and were easily accessible for screeners to visit. However, this also meant that they were located on or near busy roads and often surrounded by other businesses and/or construction. Throughout the school day, breaks occurred and shifts of students and parents came in and out of the schools.
Upon arrival at a school, the screening team identified the most ideal location to conduct screenings. Most often, screeners used empty classrooms. In some cases, there were multiple screeners assigned to one room, meaning other screeners and children were present as the screenings were being conducted (see Figure 4).
Figure 4. Testing spaces used in pilot schools
Additional information presented in Figure 5 was collected from screeners regarding the screening locations. During nearly 80% of the screenings, screeners noted that noise distractions were present. Almost all screenings took place where adequate lighting was available; however, during about 60% of the screenings, screeners noted that visual distractions were present.
45%
38%
8%
6%
2%
2%
0% 10% 20% 30% 40% 50%
Inside an empty classroom
Inside a classroom with otherstudents/teachers present
Inside a small, private office
Outside in a public area (others arepresent)
Outside in a private area
Other
Dr. Perla Vicenta M. De Castro, MD, of Region IV-A,
conducts a vision screening (RTI, 2018).

12
Figure 5. Screener-reported testing conditions
The hearScreen software constantly monitors ambient noise levels to ensure that maximum ambient noise levels are not exceeded during the screening process. If maximum levels are exceeded, the screening software will automatically retest the student on the frequencies that were failed as a possible consequence of high background noise. When screening at 25 dB using the Sennheiser HDA 280 Pro headphones, permissible ambient noise levels are 49, 57, and 61 dB for 1, 2, and 4 kHz respectively (Mahomed-Asmail, Swanepoel, Eikelboom, Myburgh, & Hall, 2016). Table 10 presents the average ambient noise levels by day and frequency per ear. As can be seen in the table, noise levels were considerably high in NCR; the high number of referrals during these days may be attributed to the background noise within the testing spaces.
Table 10. Average ambient noise levels (in dB) by day, frequency, and ear
Region Day
1000 2000 4000
Left ear
Right ear
Left ear
Right ear
Left ear
Right ear
NCR
Day 1 50 50 45 44 39 38
Day 2 50 50 44 44 37 37
Day 3 48 48 42 42 36 36
Day 4 45 45 40 40 36 36
Region IV-A
Day 5 43 44 39 39 35 35
Day 6 44 43 39 39 34 34
Day 7 41 41 37 36 33 32
Day 8 39 39 36 35 32 32
While the changes made to the screening protocol did have drastic effects on the referral rates, the decrease in ambient noise levels in the Region IV-A schools also likely contributed to reduced referral rates and, likely, to the number of false positives during pilot days 5–8 (see Figure 6).
0%
20%
40%
60%
80%
100%
Visual distractionspresent
Noise distractionspresent
Adequate lightingavailable
Yes No

13
Figure 6. Average ambient noise level by day and frequency and average referral rate of students screened
In 1997, the Philippines Department of Health issued The Code of Sanitation, which has specific guidelines on school sanitation and health services. The code indicates acceptable noise levels in the school per type of room. Based on the readings from the hearScreen tool, there is a possible concern more generally related to noise levels in schools and the potential affect the high noise levels might have on the conduciveness for learning by all children.
Philippines Department of Health: The Code of Sanitation
It is important to be aware that school settings generally will present challenges for audiometry testing with sensitive electronic equipment. However, the background noise levels found at the pilot schools presented a challenge for the functionality of the tools that could not be addressed through changing locations, as the noise levels were pervasive on the school grounds. The ambient noise readings indicate a larger problem for young learners, which is that, simply put, learners cannot hear well in schools.
0
10
20
30
40
50
60
70
80
90
100
20.0
25.0
30.0
35.0
40.0
45.0
50.0
Day 1 Day 2 Day 3 Day 4 Day 5 Day 6 Day 7 Day 8
Refe
rral
rat
e of
stu
dent
s (%
)
Am
bien
t noi
se le
vel i
n dB
s
1 kHz 2 kHz 4 kHz Fail Rate

14
Appropriately identifying a good screening space is critical to the performance of the tools. In order for the tools to function well, it is recommended that only one or two screeners are present in a room. Screeners should also be aware of schools’ schedules and shift changes so that they can halt screening during heightened periods of commotion. When possible, it is best to use small offices or empty rooms that have windows and doors that can shut completely to help tune out noise. If feasible, screening programs can consider screening outside the normal school day (for example, screening at the end of the school day, before the school year starts, or on Saturdays).
Testing and adjusting tool settings and protocol should be done before using the screening tool in a new context. In the case of the Philippines, the most optimal screening protocol was determined to be the modified severity protocol starting at 30 dB and referring after two or more failed frequencies. In addition, it is important to monitor the data during piloting and throughout a screening program. Closely watching the incoming screening data will allow program administrators to recognize whether referral rates might be too high and the testing protocols need to be reexamined.
3.5 Screener Type The Philippines research pilot was designed to determine whether the screening tools could be effectively used by teachers in the Philippines to screen and identify students with potential vision and hearing difficulties. There are benefits to using teachers as screeners; it can help them better understand which students in their classroom are experiencing difficulties with vision and hearing, which could influence them to adjust their teaching and classroom practices to provide necessary assistance to students most in need. A recent study (Strigel, 2017) using the same screening tools for vision and hearing impairment, coupled with a three-month intervention, indicated that knowledge about their students’ potential vision and hearing difficulties, coupled with 32 hours of professional development, and lesson plans with explicit instructional accommodations, can significantly improve teachers’ attitudes regarding inclusive education, their self-efficacy in teaching children with sensory disabilities, and their adoption of inclusive instructional practices in the classroom.
Trained medical professionals, however, tend to have more experience with screening and referral processes, which can lead to better communication with parents regarding screening programs and students’ results. School administrators are often called upon to collect school-level data and have experience assessing students. They also tend to have a key role in the school programs and the parent notification process. The Philippines pilot included teachers, medical officers, and school administrators.
In total, 18 people were trained as screeners for the pilot exercise: 8 teachers, 4 medical officers (under the School Health Division), and 6 school administrators.6 The training was 16 hours and included a practical site visit where the participants practiced the tools in a school setting. Table 11 below summarizes average age and experience per each category of screener.
6 Of typical or similar capacity to government personnel who are called upon to collect school-based survey data, (e.g., school principal, municipal/district supervisor).

15
Table 11. Average age and years of experience by screener type
Screener Type Average
Age Average Years of Experience
(range)
Teacher (n=8) 39 11 years (2–20 years)
Medical Officer (n=4) 40 10 years (1–11 years)
School Administrators (n=6)
50 21 years (9–28 years)
All teachers indicated they had previous training related to inclusive education; similarly, nearly all of the school administrators and medical officers also indicated some previous inclusive education training. None of the participating teachers or school administrators had previous experience using screening tools, while nearly all of the medical officers indicated having previous experience using screening tools (note: it was not specified if the tools were electronic or paper-based).
To help determine if teachers are suitable for administering screenings, all screeners participated in multiple screening performance evaluations to evaluate their performance in using the hearScreen and Peek Acuity applications. Each evaluation was set up so that one main screener screened the child. Additional screeners observed and recorded the accuracy of the main screener throughout the duration of the screening. The observation included 18 tasks for the vision screening and 11 tasks for the hearing screening.
Two screeners observe Dr. Khareen M. Cadano, MD, of Region IV-A and
score her accuracy as she performs a hearing screening (RTI, 2018).
Indicated in Figure 7, all three types screeners performed above the desired benchmark of 90% accuracy. However, teachers recorded responses with higher accuracy for both vision and hearing screenings. The n values differ for each screener type due to differing numbers of participants per category and varying number of days for which each person participated in the pilot.

16
Figure 7. Percent of screeners’ performance observations without errors by screener type
Based on the screener performance observations, it is clear that teachers (similar to school administrators or those in the medical field) are able to use the screening tools easily and accurately. Additionally, teachers tended to have strong rapport when working with students, likely due to the students’ familiarity with the teacher compared to the school administrators or medical officers.
In addition to performance, another consideration related to screener type is how screeners intend to use the information. At the end of the pilot, screeners participated in an exit interview that gathered information on their experience screening students. When screeners were asked, “How do you plan on using the results of today’s screenings?” responses differed across teachers, medical officers, and school administrators.
• Teachers: Teachers tended to focus on follow-up that could be taken by individual children/families. Relatively few teachers responded with action items that they could take themselves within the classroom or related to their teaching practices that would provide additional support to the children identified by screening tools as having potential difficulties with vision or hearing.
• Medical Officers: Medical officers expressed a desire to use the data to look deeper into the issues related to potential impairments. Additionally, they mentioned an interest in working with teachers to understand results of the screenings.
• School Administrators: School administrators described using the data to advise and inform parents on follow-up actions such as further diagnostic tests. They also mentioned the data would be useful in seeking community sponsors that could assist children/families who are seeking further intervention.
Based on screener responses, it is clear that continuing to involve medical officers and school administrators could be important for successful school screening programs. School administrators can play an important role in the parent engagement process (notifying parents, gaining consent), while medical officers may be able to better communicate screening results to concerned families.
The use of teachers in the screening process could have a number of positive effects that could directly lead to improved learning for children with potential vision and hearing difficulties as well as all children in the classroom. As part of the background interview, students were asked if they sought assistance from teachers when they were unable to hear or see something in class. More than 50% of the students in the pilot indicated they did not ask teachers to write down things when
86%
88%
90%
92%
94%
96%
98%
100%
Vision tasks (18) Hearing tasks (11)
% o
f per
form
ance
obs
erva
tions
School Admin. (n=61) Medical Officer (n=27) Teacher (n=15)

17
they could not see or repeat/write down things when they could not hear (see Figure 8). Using teachers as screeners would provide them with firsthand knowledge of which students may have difficulties seeing and/or hearing and the severity of the potential impairment and allow them to provide assistance to students even when students do not ask for help directly.
Based on information gathered during the pilot, it is evident that teachers did not immediately know how to use the screening results to adjust their classroom practices and teaching to provide additional support to the children flagged as having potential difficulties. Additional training and support are likely needed for teachers in order to produce change at the classroom level. In the recent intervention study in Ethiopia (Strigel, 2017), the original intervention anticipated 16 hours of teacher training. The initial teacher training included an introduction to inclusive education, a refresher on the main principles of evidence-based reading instruction, and practice in administering the screening tools and using the accommodated lesson plans. After four weeks of implementation and classroom observations, the Ethiopia study organized a two-day refresher training as it became clear that the initial 16-hours of training were not sufficient to allow teachers to develop confidence and fluency in administrating the screening tools. The additional two days of training contributed to over 95% of teachers reporting to be comfortable in using the screening tool at endline.
Figure 8. Percent of students who request assistance in the classroom
3.6 Training Duration and Design Electronic screening tools such as the ones deployed in this pilot are relatively new in schools in resource-constrained settings. There are not many data on the training program designs and training time that is necessary prior to using the tools. During the pilot training, a Rapid User Adoption Test was used to gather information about the effectiveness of the training content and duration. The performance-based test records participants’ abilities to perform tasks related to the screening process. Figure 9 displays pre- and post-scores for the Rapid User Adoption Test by screener type. Gains in performance from the start of training to the end were similar across all screener types. However, what is evident from the data is that none of the participants was able to complete all the required screening tasks after two days of training.
0%
10%
20%
30%
40%
50%
60%
70%
80%
90%
100%
Asks teacher to write down somethingwhen can't see
Asks teacher to repeat/write downsomething when can't hear
No Yes

18
Figure 9. Rapid User Adoption Test results
Teachers, government-employed school administrators, and medical officers all reported the tools as easy to administer. Over 64% of teachers, however, wanted more training to perfect their skills. The school administrators highlighted the usability of the tools, recognizing that their confidence and mastery of the tools improved throughout the pilot. This group of screeners found the two-day initial training to be adequate, hands-on, and practical. Medical officers noted that the tools were easy to use and (with adjustments throughout the pilot) seemed to produce accurate results. They also expressed a desire for more training and practice on using the tools in advance of the screenings. In future efforts, we recommend extending the training to three days (24 hours) to allow for more time practicing with the tools. Practice with children in school settings is more ideal than practicing with fellow participants in a training setting.
3.7 Parent Notification and Referral Process Parent engagement, especially with regards to notification and referrals, is critical to the success of a community or school-based screening program. This is particularly the case in the Filipino context, where parent consent is required for student participation in screenings administered at schools. As part of the pilot study, parents were notified and asked to provide consent through a letter sent home by the teachers or school principal. However, many parents did not provide consent, likely because of concerns raised by not fully understanding the screening process.
42%50%
42%
75%
85%78%
33% 35% 36%
0%10%20%30%40%50%60%70%80%90%
Teachers Medical Officers Data Collectors
Average Pre Score Average Post Score Average Gain

19
Prior to conducting screenings, the School Division Superintendent addressed screeners, teachers, and students at San Juan
Elementary School, Division of San Juan City, NCR (RTI, 2018).
Screening programs must carefully consider context-specific, socio-culture aspects and barriers to parent engagement. There are various methods that can better inform parents and help reduce concerns, like using parent-teacher association or other face-to-face meetings with parents to communicate about the screening process, providing an opportunity for parents to ask questions, or using videos to show the simplicity and benefits of the screening process and program. Screeners should also be prepared to clearly articulate the results and next steps to parents. Next steps should include options for in- and out-of-school support for students who are identified as having potential difficulties. Screening programs should also consider ways to sensitize and support parents and teachers.
CONCLUSIONS
4.1 Are the selected screening tools able to appropriately and reliably detect children with vision and hearing difficulties within the Filipino context?
The pilot activity was able to confirm that electronic vision and hearing screening tools can provide effective screening approaches in Filipino schools. Screening tools, electronic or not, must be carefully selected in consideration of the type of disability to screen for, the purpose of the screening activity (and related use of the resulting data), the age of the child, the resources available for screening and screening follow-up, and the screening context. Related to the latter, screening efforts must invest in careful initial field tests to establish locally appropriate logistics guidance for screeners regarding where and how to set up adequate screening spaces, especially in noisy school environments.
The hearing screening protocol had to be adjusted repeatedly throughout the pilot due to significant ambient noise levels, despite screeners’ efforts to find quiet places on school grounds. Across the eight schools, screeners noted noise distractions for nearly 75% of the screenings. Ambient noise can distort results and falsely indicate a potential hearing impairment when there is none. The pilot activity thus examined feasibility of different protocols available within the hearScreen application, incrementally adjusting the sound level at which the beeps were being played and the number of frequencies a child needed to fail to be referred for a potential hearing impairment.

20
The current recommended protocol for electronic hearing screenings of students in schools in the Philippines starts at 30 dB. Additionally, it is suggested to provide referrals after two or more failed frequencies in at least one ear. Lastly, conducting immediate re-screenings of students can help to reduce the number of false positives. While this protocol produced the most viable results during the pilot, data should be continuously and closely monitored to ensure that the tool continues to produce reliable results.
4.2 What are the necessary conditions to reliably and effectively administer the selected tools?
Screeners must be aware of and have adequate understanding of the tools they are using. This is especially the case when using electronic screening tools that tend to be sensitive to environmental factors such as light and noise. It is critical to provide screeners with training and clear guidance on how to appropriately select and set up screening spaces in schools. It can be useful to select screening tools with built-in features that notify screeners when conditions are not optimal (e.g., noise and light monitoring).
Based on experiences and observations from the pilot study, it is recommended that screenings take place in empty classrooms or small offices. If possible, the selected rooms should have doors and windows to shut out outside noise. Only one to two screeners should be assigned to a single room. Screening should not take place near electrical fans or air conditioning units as these devices are noisy. Screening should not be conducted during shift changes, student break time, or any other times during the school day when there are increased disturbances or commotion. Future school screening programs may even consider conducting screenings outside of the normal school day (e.g., at the end of the day, on Saturdays, or before the start of the school year).
Another key consideration for the effective use of the screening tools is the socio-cultural dimension. There are potential risks of labeling and stigmatization should students’ screening outcomes become wider knowledge or result in specific activities to improve the child’s educational experience that may be different from those of the other children (e.g., sitting in the front, receiving different materials or auditory supports, engaging differently with the teacher). School and community disability awareness initiatives are thus important accompaniments to screening efforts. Screening activities also raise expectations among students, parents, and teachers for follow-up and support that must be acknowledged and planned for. As was the case in this screening pilot, a significant number of parents did not give consent to have their children screened. Exploring the use of verbal communication or the videos to explain the screening process could help improve the consent process. Parent and community engagement will continue to be critical for effective use of the screening tools.
4.3 Can the screening tools be effectively used by teachers in the Philippines to screen and detect students with vision and hearing difficulties?
The screening tools can be effectively used by teachers in the Philippines to screen and detect students with vision and hearing difficulties. The teachers performed slightly better than medical officers and school administrators when using the electronic screening tools during the pilot activity. One benefit of deploying teachers as screeners is that, as a result, they would be immediately aware of a potential vision or hearing impairment among their students. Having this knowledge can be useful to better align their instruction with diverse students’ needs. Findings from the pilot indicate, however, that teachers might not be aware of specific approaches to modify their classrooms and practices to teach more inclusively. When asked about how they might use the results from the screenings, most teachers indicated informing the students’ parents for follow-up. Few teachers responded with action items they could take in their classrooms. Furthermore, most participating teachers struggled to specify what support might help them better meet the needs of students with a vision or hearing impairment in their classrooms. Even if and where resources are limited, teachers

21
and schools should receive some form of guidance and support in how to follow up screening efforts. This might include locally appropriate information packages on foundational inclusive practices (e.g., repeating important questions and responses, describing pictures, writing in large letters on the blackboard, speaking loudly, and clearly facing the class), materials, or training. However, more consideration, training, and/or intervention programs may be necessary to support teachers in using the results effectively to improve all students’ learning in the classroom.
4.4 How much training is needed to ensure reliable screening results? When asked about their overall experience with the tools, teachers, medical officers, and school officials all responded that the tools were easy to use while several others recognized and commented on the benefits of the tools to their students. The majority of screeners responded, however, that they would prefer more time to perfect their skills with the tools before conducting screenings. After 16 hours of training, none of the screeners was able to perform 100% of the desired screening tasks (based on the Rapid User Adoption Test). It is recommended that, at minimum, screeners receive 24 hours of training with 8 hours of practical application in school settings where the tools will be deployed.
NEXT STEPS Following the analysis of the pilot data, a dissemination event took place in Manila in October 2018, followed by one week of a train the trainer workshop. The aim of the workshop was to allow participants to learn how to use the hearing and vision screening tools, how to properly set up screening spaces in school settings, to understand screening results, and to train others in the use of the tools. Participants included one medical officer and one educator from each of the country’s 17 regions, as well as representatives of several organizations providing support for persons with disabilities. After spending several days learning and practicing the screening tools, the training participants mapped out context-specific guidance that they see as critical to the successful use of the tools and school-based screening in the future. These guidelines can be found in Annex E. As part of the dissemination and capacity building activities, USAID provided 35 sets of screening kits—one tablet device, one calibrated headset, and a one-year unlimited hearing and vision screening software license—to DepEd. In addition to this training, six staff from the Philippines DepEd Central Office (Bureau of Education Assessment-Education Assessment Division and Bureau of Learning Delivery-School Inclusion Division) also took part in several training sessions on planning large-scale, school-based screening programs, managing the data portal for the vision and hearing screening tools, monitoring screening data as they are being uploaded to the server, and analyzing the screening data.
As part of this capacity building effort, participating DepEd Central Office staff also started to sketch out a school-based screening program for further refinement in November 2018 and ultimate presentation and approval by DepEd leadership. The initial plan by DepEd entailed pooling the screening kits and human capacity developed throughout the screening pilot and related training workshops and implementing a systematic school-based screening program at regional level. The DepEd team suggested to screen, at minimum all Grade 1 and 2 students in the most remote schools in the country, where the likelihood for existing screening programs and families’ access to early screening services may be lower compared to the more urban areas of the country. As such, at the time of writing this report, the DepEd team was refining a school sampling plan, an activity schedule, and school support programs, as well as mapping organizations in the selected regions to provide follow-up evaluations and support services to children identified with a potential disability, as well as their teachers.

22
WORKS CITED Banks, L. M., & Polack, S. (2014). The economic costs of exclusion and gains of inclusion of people with
disabilities: Evidence from low and middle income countries. Retrieved September 15, 2016, from http:// disabilitycentre.lshtm.ac.uk/files/2014/07/Costs-of- Exclusion-and-Gains-of-Inclusion-Report.pd
De Venecia, B., Bradfield, Y., Møller Trane, R., Bareiro, A., & Scalamogna, M. (2018). Validation of
Peek Acuity application in pediatric screening programs in Paraguay. International Journal of Ophthalmology, 11(8), 1384–1389. doi:10.18240/ijo.2018.08.21
Dey, R., Davessar, J. L., Kumar, S., & Sharma, T. (2016). Behavioral screening tests to detect hearing
loss in school aged children: A review. International Journal of Community Health and Medical Research, 2(2), 73–79. doi:10.21276/ijchmr.2016.2.2.11
Mahomed-Asmail, F., Swanepoel, D. W., Eikelboom, R. H., Myburgh, H. C., & Hall, J. (2016). Clinical
validity of hearScreen™ smartphone hearing screening for school children. Ear and Hearing, 37(1). doi:10.1097/AUD.0000000000000223
Filmer, D. (2008). Disability, poverty, and schooling in developing countries: Results from 14
household surveys. World Bank Economic Review, 22(1), 141–163. doi:10.1093/wher/lhm021 Government of the Philippines. (2013). Persons with disability in the Philippines (results from the 2010
census). Retrieved from https://psa.gov.ph/content/persons-disability-philippines-results-2010-census
HearX group, n.d. Screening programme implementation guide v1.0 Mactaggart, I., Kuper, H., Murthy, G. V. S., Oye, J., & Polack, S. (2016). Measuring disability in
population based surveys: The interrelationship between clinical impairments and reported functional limitations in Cameroon and India. PLoS ONE, 11(10), 1–18. doi: 0.17037/DATA. 116.
Mahomed-Asmail, F., Swanepoel, D., & Eikelboom, R. H. (2016). Referral criteria for school-based
hearing screening in South Africa: Considerations for resource-limited contexts. Health SA Gesondheid, 21(1), 96-103. doi: 10.1016/j.hsag.2015.11.003
Male, C., & Wodon, Q. (2017). The price of exclusion: Disability and education. Disability gaps in
education attainment and literacy. The World Bank. Retrieved from http://documents.worldbank.org/curated/en/396291511988894028/Disability-gaps-in-educational-attainment-and-literacy
Mitra, S., Posarac, A., & Vick, B. (2013). Disability and poverty in developing countries: A
multidimensional study. World Development, 41, 1–18. doi:10.1016/j.worlddev.2012.05.024 Scherzer, A. L., Chhagan, M., Kauchali, S., & Susser, E. (2012). Global perspective on early diagnosis
and intervention for children with developmental delays and disabilities. Developmental medicine and child neurology, 54(12), 1079-84. doi:10.1111/j.1469-8749.2012.04348.x
Strigel, C. (2017). Assistive Technology Capacity Building Initiative - Endline Report - Reading for Ethiopia’s
Achievement Developed Technical Assistance (READ TA). RTI International. USAID Cooperative Agreement No.: AID-663-A-12-00013. Retrieved from https://shared.rti.org/content/endline-report-ethiopia-assistive-technology-initiative-early-reading-classrooms

23
Strigel, C. (2018). Inclusive education screening tool and pilot activity – desk review. RTI International.
USAID agreement AID-OAA-TO-16-00017; REQ-ASIA-16-00017. UN Population Fund (UNFPA). (2011). People with disabilities in Viet Nam. Key Findings from the 2009
Viet Nam population and housing census. Retrieved from http://vietnam.unfpa.org/sites/default/files/pub-pdf/Disability_ENG.pdf
Wapling, L. (2016). Inclusive education and children with disabilities: Quality education for all in low and
middle income countries. CBM. Retrieved from http://www.cbm.org/article/downloads/54741/Quality_Education_for_All_LMIC_Evidence_Review_CBM_2016_Full_Report.pdf
Washington Group on Disability Functioning. (2018). Short set of disability questions. Retrieved from
http://www.washingtongroup-disability.com/washington-group-question-sets/short-set-of-disability-questions/
World Bank. (2008). Project appraisal document on a proposed credit in the amount of SDR 21.9 million
(US$35 million equivalent) to the People’s Republic of Bangladesh for a disability and children-at-risk project. Retrieved from http://documents.worldbank.org/curated/en/485601468003560874/pdf/417950PAD0P1061ly100IDAR20081021911.pdf
World Health Organization (WHO). (2011). World report on disability. Geneva: WHO. Retrieved
from http://www.who.int/disabilities/world_report/2011/en/

24
ANNEX A: USER ADOPTION TEST Vision and Hearing Screening Tools Pilot Activity in the Philippines Initial Tablet and Screening Tools: User Adoption Test – June 2018
As part of this pilot project, we want to evaluate our training materials and methods. We need your help to determine if our content is appropriate and if the time we spend in training is enough. I am going to give you various instructions and record notes as you follow the instructions I am giving you. If you don’t know how to do something I ask, that’s okay! Just do your best to complete the tasks that I ask, but please remember, it is fine if you aren’t able to complete these tasks. Name of Observer: Date: Pre-test Post-test
1. Screener/Assessor/or Teacher?
Are you a medical professional, assessor, or a teacher?
2. Personal ownership of Android phone/tablet? [yes/no]
Do you own an Android phone or tablet?
3. Ease of starting tablet: Did person do it in 1 min or less? [yes/no]
Can you please turn on the tablet in front of you.
4. Ease of finding Tangerine app and starting it: Did person do it in 1 min or less? [yes/no]
Can you find and open the Tangerine application on the tablet? (If no, skip to Q7)
5. How long does it take to sign up for a Tangerine user account? [in min]
Can you “sign-up” for a new account on Tangerine. You should use the first letter of your first name and your last name as your username. For example, my name is Kellie Betts so my username is kbetts. You will use this as your password as well so that it is easy to remember. (If no, skip to Q8)
6. Ease of finding Tangerine student interview instrument? [in min]
Can you start the Student interview in Tangerine? (If yes, instruct the participant how to get past school information and consent screen. The participant will generate and write on paper the Student ID)
7. Ease of finding Tangerine upload function: Did person do it in 1 min or less? [yes/no]
Can you show me where the upload function is on Tangerine?

25
Pre-test Post-test
8. Ease of finding m Health Studio application and starting it: Did person do it in 1 min or less? [yes/no]
Can you find the m Health Studio on the tablet and open the application? (If no, skip to end)
9. How long does it take to sign up for a m Health Studio user account? [in min]
Sign in to your account using the following username and password. (If no, skip to end)
10. Did user struggle with using the tablet keyboard? [yes/no]
11. As user is practicing the interview workflows in Tangerine, what problems does he/she face (e.g., font size, calling up/typing on keyboard, selecting options, hitting next, saving entry, etc.)? [write in problems]
12. Ease of copying Student ID into Medical Record Number field into Hear Screen: Did person do it in 1 min or less? [yes/no]
Select add a new patient and enter the Student ID from Tangerine? (If no, skip to end)
13. As user is practicing the screening workflows in hearScreen, what problems does he/she face? [write in problems]
Can you demonstrate how you conduct Vision/Hearing screening?
14. Ease of finding screening upload function: Did person do it in 1 min or less? [yes/no]
Can you show me where the upload feature is to send your screening data?
15. Other comments?

26
ANNEX B: STUDENT INTERVIEW Panayam sa Estudyante
Impormasyon Tungkol sa Paaralan/ School Information Rehiyon/Region: Dibisyon/Division: Pangalan ng Paaralan/School Name:
Code ng Paaralan/School Code:
Oras ng Simula ng Panayam/Interview Start Time:
Pagsang-ayon/Assent
Hello, ang pangalan ko ay ____________. Hayaan mong sabihin ko sa iyo kung bakit ako naririto ngayon. Ako ay nakikipagtulungan sa Kagawaran ng Edukasyon, at sinusubukan naming maintindihan kung paano ang mga batang nahihirapang makakita at makarinig ay natututong magbasa. Gusto namin na matulungan mo kami rito. Iniimbita kita na samahan ako sa paglalaro ng isang laro sa paningin at isang laro sa pandinig, para malaman kung nakakakita at nakakarinig ka na mabuti. / Hello, my name is ____________. Let me tell you why I am here today. I work with the Department of Education, and we are gathering information on how many children have difficulty in seeing or hearing learn to read. We would like your help in this. I invite you to join me in playing a seeing game and a hearing game, to find out how well you can see and hear. HINDI ito isang pagsusulit, at hindi ito makakaapekto sa iyong grado sa eskuwelahan. Hindi ko sasabihin ang impromasyong ito sa sinuman sa iyong mga kaklase. Ang mga laro sa pandinig at paningin ay tatagal ng mga 15 minuto para makumpleto. Muli, hindi mo kailangang sumali kung ayaw mo nito. / This is NOT a test, and it will not affect your grade at school. I will not share this information with any of your classmates. The hearing and seeing games will take about 15 minutes to complete. Once again, you do not have to participate if you do not wish to. Mayroon ka bang mga tanong sa akin? / Do you have any questions? Sumasang-ayon ka bang sumali? / Do you agree to participate? OO/Yes HINDI/No
27
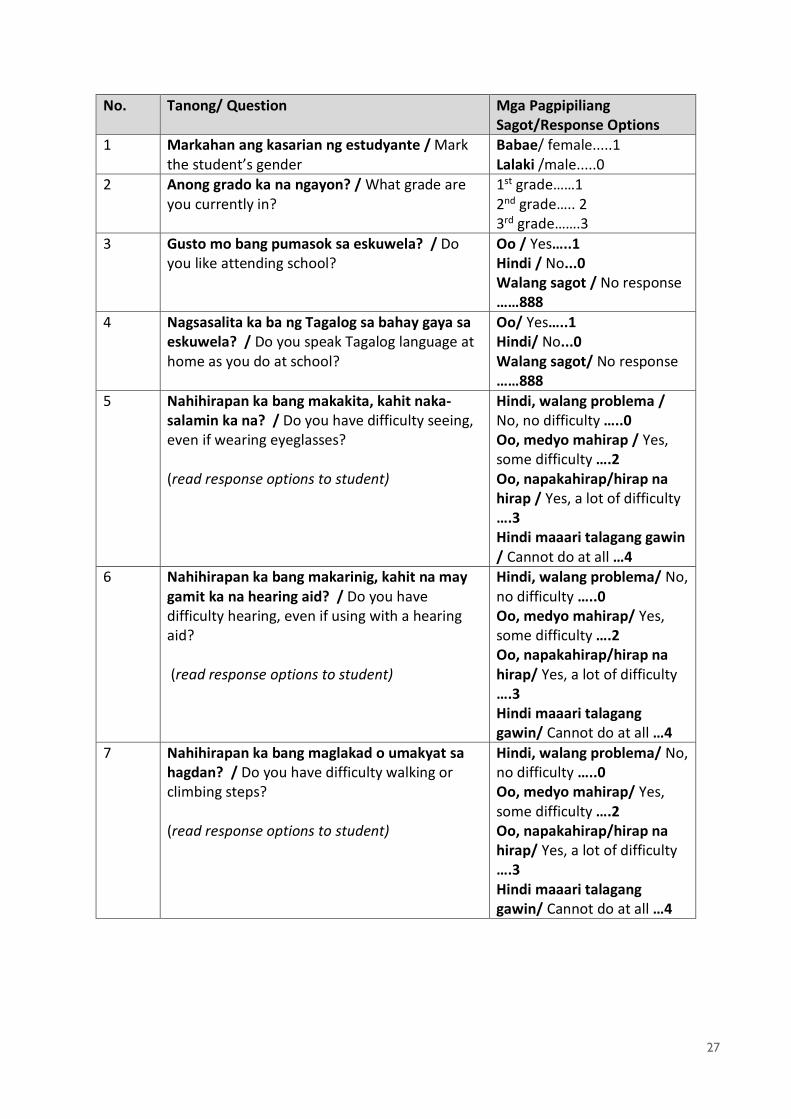
No. Tanong/ Question Mga Pagpipiliang Sagot/Response Options
1 Markahan ang kasarian ng estudyante / Mark the student’s gender
Babae/ female.....1 Lalaki /male.....0
2 Anong grado ka na ngayon? / What grade are you currently in?
1st grade……1 2nd grade….. 2 3rd grade…….3
3 Gusto mo bang pumasok sa eskuwela? / Do you like attending school?
Oo / Yes…..1 Hindi / No...0 Walang sagot / No response ……888
4 Nagsasalita ka ba ng Tagalog sa bahay gaya sa eskuwela? / Do you speak Tagalog language at home as you do at school?
Oo/ Yes…..1 Hindi/ No...0 Walang sagot/ No response ……888
5 Nahihirapan ka bang makakita, kahit naka-salamin ka na? / Do you have difficulty seeing, even if wearing eyeglasses? (read response options to student)
Hindi, walang problema / No, no difficulty …..0 Oo, medyo mahirap / Yes, some difficulty ….2 Oo, napakahirap/hirap na hirap / Yes, a lot of difficulty ….3 Hindi maaari talagang gawin / Cannot do at all …4
6 Nahihirapan ka bang makarinig, kahit na may gamit ka na hearing aid? / Do you have difficulty hearing, even if using with a hearing aid? (read response options to student)
Hindi, walang problema/ No, no difficulty …..0 Oo, medyo mahirap/ Yes, some difficulty ….2 Oo, napakahirap/hirap na hirap/ Yes, a lot of difficulty ….3 Hindi maaari talagang gawin/ Cannot do at all …4
7 Nahihirapan ka bang maglakad o umakyat sa hagdan? / Do you have difficulty walking or climbing steps? (read response options to student)
Hindi, walang problema/ No, no difficulty …..0 Oo, medyo mahirap/ Yes, some difficulty ….2 Oo, napakahirap/hirap na hirap/ Yes, a lot of difficulty ….3 Hindi maaari talagang gawin/ Cannot do at all …4

28
8 Nahihirapan ka bang maka-alala o makapag-isip na mabuti? / Do you have difficulty remembering or concentrate? (read response options to student)
Hindi, walang problema/ No, no difficulty …..0 Oo, medyo mahirap/ Yes, some difficulty ….2 Oo, napakahirap/hirap na hirap/ Yes, a lot of difficulty ….3 Hindi maaari talagang gawin/ Cannot do at all …4
9 Nahihirapan ka bang (mangalaga sa sarili gaya ng) maghugas nang buong katawan o magbihis? / Do you have difficulty (with self-care such as) Can you take a bath and dress up by yourself? washing all over or dressing? (read response options to student)
Hindi, walang problema/ No, no difficulty …..0 Oo, medyo mahirap/ Yes, some difficulty ….2 Oo, napakahirap/hirap na hirap/ Yes, a lot of difficulty ….3 Hindi maaari talagang gawin/ Cannot do at all …4
10 Ngayon naman ay tatanungin kita tungkol sa iyong klase at mga kaklase. Mayroon ka bang kaklase na may kapansanan? / Now I am going to ask you about your class and your classmates. Do you have a classmate with a disability?
Oo / Yes…..1 Oo / Yes...0 Walang sagot / No response ……888
11 Mayroon ka bang mga kaibigan sa eskuwalahan na may kapansanan? / Do you have friends at school who have disabilities?
Oo / Yes…..1 Hindi / No...0 Walang sagot / No response ……888
12 Sumama ka ba sa ibang estudyante sa mga gawain sa silid-aralan? / Do you work with other students in the classroom?
Oo / Yes…..1 Hindi / No...0 Walang sagot / No response ……888
13 Sumasama ka ba sa recess o sa libreng oras mo na makipaglaro sa iyong mga kaklase? / Do you spend recess or break time to play with your classmates?
Oo / Yes…..1 Hindi / No...0 Walang sagot / No response ……888
14 Pinupuri ka ba ng iyong guro kapag mahusay ka sa klase? / Does your teacher praise you when you do good in class?
Oo / Yes…..1 Hindi / No...0 Walang sagot / No response ……888
15 Kung hindi ka makakita sa klase o makarinig, sinasabi mo ba sa iyong guro na isulat ito para sa iyo? / If you can’t see something in class, do you ask your teacher to write it down for you?
Oo / Yes…..1 Hindi / No...0 Walang sagot / No response ……888

29
16 Kung hindi ka makarinig sa klase, sinasabi mo ba sa iyong guro na isulat ito o ulitin ito para sa iyo? /If you can’t hear something in class, do you ask your teacher to write it down or repeat it for you?
Oo / Yes…..1 Hindi / No...0 Walang sagot / No response ……888
17 Tinatawag ka ba ng iyong guro sa klase para sumagot ng mga tanong? / Does your teacher call on you in class to answer questions?
Oo / Yes…..1 Hindi / No...0 Walang sagot / No response ……888
18 Ano ang sinasabi o ginagawa ng iyong guro kapag naging mahusay ka sa talakayan sa klase o sa isang pagsusulit? / What does your teacher say or do when you perform well on a class discussion or a test?
Wala / Nothing…..0 Pinupuri ang estudiante / Gives praise to the student ….1 Nagbibigay ng premyo sa estudiante / Gives a prize to the student….….2 Sinasabi sa mga estudyante na pumalakpak / Ask students to clap him or her ….3 Walang sagot / No response ……888
19 Ano ang karaniwang ginagawa ng iyong guro kung hindi ka makasagot sa isang tanong o kung hindi ka makapagbigay ng tamang sagot? / What does your teacher normally do if you are unable to respond to a question or give the correct answer?
Wala / Nothing …..0 Binabago/Ipinapaliwanag ng guro ang tanong / Teacher rephrases/explains the question ……1 Hinihikayat ang estudyante ng guro na subukan uli / Teacher encourages the student to try again ……2 Sinasabi ng guro sa isa pang estudyante na tumulong / Teacher asks another student to help …….3 Tinatanong ulit ng guro / Teacher asks again …..4 Itinatama ako ng guro, ngunit hindi ako pinapagalitan / Teacher corrects me, but does not scold me ….5 Pinapagalitan ako ng guro / Teacher scolds me …..6 Pinapalabas ako guro sa silid-aralan / Teacher sends me outside of classroom …..7

30
Sinasaktan ako ng guro / Teacher hits me ……8 Pinapapunta ako ng guro sa sulok ng silid-aralan / Teacher sends me to corner of classroom ……9 Walang sago t/ No response ……888
Mga Detalye ng Kapaligiran ng Pagsusuri / Details of Screening Environment 20a Mahigit pa ba sa isang tao ang nagtatala ng
mga sagot para sa pagsusuri sa paningin at pandinig ng estudyante? / Is more than one person recording responses for this student’s vision and hearing screening?
Oo/ Yes…..1 Hindi/ No…..0
20b Mayroon bang mga ingay na nakakagambala? (mga motorsiklo, kotse/sasakyan, estudyante, ulan, atbp.) / Are noise distractions present? (motor bikes, cars, students, rain, etc.)
Oo / Yes…..1 Hindi / No...0
20c Mayroon bang nakakagambala sa paningin naroroon? (hal. iba pang mga estudyante/guro na nasa loob o paligid ng lugar ng pagsusuri) / Are visual distractions present? (e.g., other students/teachers in or around the testing area)
Oo / Yes…..1 Hindi / No...0
20d Mayroon bang sapat na liwanag/ilaw? / Is adequate lighting available?
Oo / Yes…..1 Hindi / No...0

31
20e Piniling lugar ng pagsusuri / Select the testing location
Sa loob ng bakanteng silid-aralan / Inside an empty classroom …..1 Sa loob ng silid-aralan na may ibang mga estudyante/guro na naroon / Inside a classroom with other students/teachers present …..2 Sa loob ng maliit, pribadong opisina / Inside a small, private office …..3 Sa labas sa isang pribadong lugar / Outside in a private area …...4 Sa labas sa isang pampublikong lugar (may mga ibang naroroon) / Outside in a public area (others are present)………….5 Iba ba (tukuyin) / Other (specify)…..777

32
ANNEX C: PRINCIPAL INTERVIEW Panayam sa Head Teacher / Principal/Head Teacher Interview
Impormasyon tungkol sa Paaralan/ School Information Rehiyon/Region: Dibisyon/Division: Pangalan ng Paaralan/ School Name:
Code ng Paaralan/ School Code:
Oras ng Simula ng Panayam/ Interview Strart Time:
Pagsang-ayon ng Head Teacher/ Principal/Head Teacher Consent
Hello po, ang pangalan ko ay ____________. Ako ay nakikipagtulungan sa Kagawaran ng Edukasyon sa pagsisikap na tumulong mapabuti ang pagkatuto sa mga nauunang grado. Susubukan namin ang ilang bagong pamamaraan upang mahayaan ang mga guro na suriin ang mga estudyante sa kanilang mga silid-aralan at matuklasan ang mga mayroong problema sa paningin at pandinig. / Hello, my name is ____________. I am working with the Department of Education on an effort to help improve learning in the early grades. We will try out some new tools that could allow teachers to screen students in their classrooms and detect those that have difficulties seeing and hearing. Sa huli, ang aming layunin ay tumulong sa mga batang maaaring mayroong problema sa paningin o pandinig upang matutong bumasa. Dito namin kakailanganin ang inyong tulong. Nais naming tanungin kayo ng ilang pangkalahatang mga tanong tungkol sa pag-enrol, pagsasanay, at mga magagamit na pantulong o materyales na nasa eskuwelahang ito. Ang impormasyong inyong ipagkakaloob sa panayam na ito ay magiging kompidensiyal. Hindi itatala ang inyong pangalan bilang bahagi ng panayam na ito. / Ultimately, our aim is help children that may have difficulty seeing or hearing learn how to read. We would like your help in this. We would like to ask you a few general questions about enrollment, training, and resources or materials that are available at this school. The information you will provide in this interview will be confidential. Your name will not be recorded as part of this interview. Ang panayam ay tatagal ng mga 10 minuto para makumpleto. Kung hindi ninyo nais na lumahok sa panayam na ito, wala kayong kailangang gawin. Kung mayroong mga partikular na tanong sa panayam na hindi ninyo nais sagutin, hindi ninyo kailangang sumagot. / The interview will take about 10 minutes to complete. If you do not want to participate in this interview, you do not have to. If there are particular questions during the interview that you do not wish to answer, you do not have to. Mayroon pa ba kayong mga tanong?/ Do you have any questions?

33
Sumasang-ayon ba kayong lumahok? / Do you agree to participate? OO/ Yes HINDI/ No
No. Tanong/ Question Mga Pagpipiliang Sagot/ Response
Options 1 Ano ang inyong posisyon? / What is your
position? Principal ……1 Head Teacher …..2 Iba pa (sabihin) / Other (specify)….. 777
2 Markahan ang kasarian ng Head Teacher / Mark the Principal/Head Teacher’s gender
Babae / Female.....1 Lalaki / Male.....0
3 Ilang mga estudyante ang naka-enrol sa eskuwelahan ngayong taon (school year)? / How many students are enrolled in the school this school year? (Kung hindi tiyak ang Principal/Head Teacher, ilagay ang 888)/ (If the Principal/Head Teacher is unsure, enter 888)
# ng estudyante / # of students _______
4 Ilang estudyante ang kasalukuyang naka-enrol sa sa grade 1? / How many students are currently enrolled in grade 1? (Kung hindi tiyak ang Principal/Head Teacher, ilagay ang 888)/ (If the Principal/Head Teacher is unsure, enter 888)
# ng estudyante / # of students _______
5 Ilang estudyante ang kasalukuyang naka-enrol sa grade 2? / How many students are currently enrolled in grade 2? (Kung hindi tiyak ang Principal/Head Teacher, ilagay ang 888)/ (If the Principal/Head Teacher is unsure, enter 888)
# ng estudyante / # of students _______

34
6 Ilang estudyante ang kasalukuyang naka-enrol sa grade 3? / How many students are currently enrolled in grade 3? (Kung hindi tiyak ang Principal/Head Teacher, ipasok ang 888)
# ng estudyante / # of students _______
7 Ano ang inyong pinakamataas na antas ng edukasyon at pagasanay (training)? / What is your highest level of education training?
Doctor of Education….1 Master of Arts….2 Bachelor of Arts….3 Iba pang espesyalisasyon (sabihin)/ Other specialization (specify)________
8 Tumanggap ba kayo ng pagsasanay sa Inklusibong Edukasyon (Inclusive Education) o may-kaugnayan sa Espesyal na Edukasyon (Special Education)? / Have you received training on Inclusive Education or related to Special Needs Education? (Kung hindi, pumunta sa tanong 9)/ (If no, skip to question 9)
Oo/ Yes…..1 Hindi/ No…..0 Walang sagot/ No response ……888
8a Kung oo, ano ang mga pagsasanay na inyong natanggap? / If yes, what trainings have you received?
Pangangasiwa ng MFAT (MFAT Administration) / MFAT Administration…..…..1 Pagsasanay sa Pananaliksik sa SPED (SPED Research Training) / SPED Research Training ……2 Mga Panuntunan sa Paglahok ng mga Atletang May-kapansanan sa mga Natatanging Palaro (Guidelines on Participation of Disabled Athletes in the Special Games) / Guidelines on Participation of Disabled Athletes in the Special Games ……3 Pangkalahatang Impormasyon sa Inklusibong Edukasyon / Overview of Inclusive Education …...4 Mga iba pa (sabihin) / Other (specify)________
9 Ilan taon na ang inyong karanasan bilang isang Principal/Head Teacher? How many years of experience do you have as a Principal/Head Teacher?
# ng taon # of years:______

35
10 Ilang taon na kayo rito sa eskuwelahan bilang Principal/Head Teacher? / How many years have you been employed as a Principal/Head Teacher at this school?
# ng taon /# of years:______
11 Mayroon bang mga estudyante sa paaralang ito na nasuring may kapansanan? / Are there students in this school who are diagnosed with a disability? (Kung hindi, pumunta sa tanong 12)/ (If no, skip to question 12)
Oo / Yes…..1 Hindi / No...0 Walang sagot / No response ……888
11a Anong mga uri ng nasuring kapansanan ang mayroon sa mga estudyante sa eskuwelahang ito? / What types of diagnosed disabilities do students in this school have? (Maaaring pumili ng maraming sagot/Piliin ang lahat ng naaangkop na sagot)/ (Can select multiple options)
Kapinsalaan sa paningin /Vision impairment....1 Kapinsalaan sa pandinig / Hearing impairment ……2 Kapansanang intelektwal at kognitibo / Intellectual or cognitive disability…..3 Pisikal na mga kapinsalaan / Physical impairment(s)……4 Mga hamon sa emosyon at pag-uugali / emotional and behavior challenges……5 Iba pa (sabihin) / Other (specify)….. 777 Walang sagot / No response ……888
12 Mga ilang estudyante sa eskuwelahang ito ang nasuri na may kapansanan? / About how many students in this school have a diagnosed disability?
# ng estudyante /# of students______ Walang sagot /No response…………888
13 Sa inyong palagay, mayroon bang mga estudyante sa eskuwelahang ito na may kapansanan ngunit hindi pa nasusuri? / Do you think there are students in this school who have disabilities but are not diagnosed? (Kung hindi, pumunta sa tanong 14)/ (If no, skip to question 14)
<Oo / Yes…..1 Hindi / No...0 Walang sagot / No response ……888

36
13a Kung mayroon, ilang estudyante? / If so, how many?
1 lang o 2 estudyante/ Only 1 or 2 students................1 3 o 4 na estudiante/ Between 3 and 4 students ……………….2 5 hanggang 7 estudyante/ Between 5-7 students ……………….3 8 hanggang 10 estudyante/ Between 8-10 students ………………..4 11 hanggang 15 estudyante/ Between 11 and 15 students ……………….5 16 hanggang 20 estudyante/ Between 16 and 20 students ……………….6 Mahigit sa 21/ More than 21………...7 Walang sagot / No response…………888
14 Mga ilang estudyante sa eskuwelahang ito ang nasuri na may kapinsalaan sa PANDINIG (HEARING impairments)? / About how many students in this school diagnosed HEARING impairments?
# ng estudyante/# of students______ Walang sagot /No response…………888
15 Sa inyong palagay, mayroon bang mga estudyante sa eskuwelahang ito na may problema sa pandinig ngunit hindi pa nasusuri? / Do you think there are students in this school who have difficulty seeing but not diagnosed? (Kung hindi, pumunta sa tanong 16)/ (If no, skip to question 16)
Oo / Yes…..1 Hindi / No...0 Walang sagot / No response ……888
15a Kung mayroon, ilang esudyante? / If so, how many?
1 lang o 2 estudyante/ Only 1 or 2 students................1 3 o 4 na estudiante/ Between 3 and 4 students ……………….2 5 hanggang 7 estudyante/ Between 5-7 students ……………….3 8 hanggang 10 estudyante/ Between 8-10 students ………………..4 11 hanggang 15 estudyante/ Between 11 and 15 students ……………….5 16 hanggang 20 estudyante/ Between 16 and 20 students ……………….6 Mahigit sa 21/ More than 21………...7 Walang sagot / No response…………888
16 Mga ilang estudyante sa eskuwelahang ito ang nasuri na may mga kapinsalaan sa PANINGIN (VISION impairments)? /About
# ng estudyante/# of students______ Walang sagot /No response…………888

37
how many students in this school have a diagnosed VISION impairment?
17 Sa inyong palagay, mayroon bang mga estudyante sa eskuwelahang ito na may problema sa paningin ngunit hindi pa nasusuri? / Do you think there are students in this school who have difficulty seeing but are not diagnosed? (Kung hindi, pumunta sa tanong 18)/ (If no, skip to question 18)
Oo / Yes…..1 Hindi / No...0 Walang sagot / No response ……888
17a Kung mayroon, ilang estudyante? / If so, how many?
1 lang o 2 estudyante/ Only 1 or 2 students................1 3 o 4 na estudiante/ Between 3 and 4 students ……………….2 5 hanggang 7 estudyante/ Between 5-7 students ……………….3 8 hanggang 10 estudyante/ Between 8-10 students ………………..4 11 hanggang 15 estudyante/ Between 11 and 15 students ……………….5 16 hanggang 20 estudyante/ Between 16 and 20 students ……………….6 Mahigit sa 21/ More than 21………...7 Walang sagot /No response…………888
18 Ang eskuwelahan bang ito ay may partikular na badyet para sa edukasyon ng mga estudyanteng may kapansanan? / Does this school have specific budget for educating students with disabilities? (Kung hindi, pumunta sa tanong 9)/ (If no, skip to question 9)
Oo / Yes…..1 Hindi / No...0 Walang sagot / No response ……888
19 Anong mga uri ng tulong ang mayroon, kung mayroon man, sa eskuwelahang ito para sa mga batang may kapansanan? / What, if any, types of supports are available in this school for children with disabilities? (maaaring pumili ng maraming sagot/piliin ang lahat ng naaangkop na sagot) / (can select multiple options)
Mga materyales sa Braille/ Braille materials ……1 Pagsasanay sa guro/ Teacher training ……2 Mga aklat na may malalaking titik (Large print books) / Large print books …..3 Mga magnifying glass o reading glass para sa mga guro/estudyante / Magnifying glasses or reading glasses for teachers/students …4 Mga Brailler / Braillers …...5

38
Transportasyon para sa mga estudyanteng may kapansanan/ Transportation for students with disabilities …..6 Serbisyo sa pagsusuri/pagtataya ng kapansanan (Disability screening/evaluation services) / Disability screening/evaluation services ……7 Guro ng special education (regular [full time] o pansamantala) / Special education teacher (full time or itinerant …..8 Serbisyo ng pagsangguni (Referral services) / Referral services)…..9 Iba pa (sabihin) / Other (specify)…..777 Walang sagot/ No response…..888
20 May alam ba kayong mga batang may kapansanan na hindi pumapasok sa eskuwela sa lugar na ito? / Are you aware of children with disabilities who are not enrolled in school in this area?
Oo / Yes…..1 Hindi / No...0 Walang sagot / No response ……888
21 Ang mga guro ba sa eskuwelahang ito ay mayroong mga oportunidad na kumuha ng mga pagsasanay kaugnay sa espesyal na edukasyon? / Do teachers in this school have opportunities to take trainings related to special education? (kung hindi, pumunta sa tanong 22)/ (If no, skip to question 22)
Oo / Yes…..1 Hindi / No...0 Walang sagot / No response ……888
21a Kung gayon, sino sa mga guro ang nagkakaroon ng mga oportunidad na kumuha ng mga pagsasanay kaugnay sa espesyal na edukasyon? / If so, which teachers have opportunities to take trainings related to special education?
Lahat ng mga guro ay may oportubidad na dumalo sa pagsasanay tungkol sa espesyal na edukasyon/ All teachers have opportunities to attend special needs education training ….1 Ang mga guro lamang sa espesyal na edukasyon ang may oportunidad para sa pagsasanay/ Only special needs teachers have the opportunity for training ….2 Walang sagot// No response ….888
22 Ilang mga guro sa eskuwelahang ito ang mayroong pagsasanay sa espesyal na edukasyon? / How many teachers in this school have training in special education?
# ng mga guro / # of teachers ______

39
(kung hindi tiyak ang Head Teacher, ilagay ang 888)/ (If the Principal/Head Teacher is unsure, enter 888)
23 Kapag kailangan ninyo ng impormasyon tungkol sa mga pangangailangan ng espesyal na edukasyon, anong mga pantulong (resources) ang inyong ginagamit? / When you need information about special education needs, what resources do you use?
Wala/ None…..0 SPED sa Eskuwelahan/ School SPED…….1 SPED sa Distrito/ District SPED……2 SPED sa Dibisyon/ Division SPED……3 Mga Website ng DepED/ DeptED Websites…….4 Iba pa (sabihin) / Other (specify)________ Walang sagot / No reponse….888
Salamat po sa paglaan ng inyong panahon!/ Thank you for your time!

40
ANNEX D: VI, HI, DIFFICULTY SEEING AND DIFFICULTY HEARING
with Medical Diagnosis without Medical Diagnosis Region Visual Impairment Hearing Impairment Difficulty Seeing Difficulty Hearing
Non Graded
Elementary
Graded Elementary
High School
Total Non Graded
Elementary
Graded Elementary
High School
Total Non Graded
Elementary
Graded Elementary
High School
Total Non Graded
Elementary
Graded Elementary
High School
Total
ARMM 2 222 33 257 4 72 27 103 0 47 103 150 0 55 42 97 CAR 16 110 197 323 44 39 40 123 0 119 855 974 1 38 124 163 CARAGA 89 98 104 291 172 86 102 360 11 94 105 210 15 53 23 91 NCR 126 489 4,580 5195 735 671 818 2,224 10 1,364 9,304 10,678 2 179 1,269 1,450 NIR 59 115 465 639 240 63 182 485 34 256 1,796 2,086 104 65 439 608 Region I 77 234 455 766 291 177 233 701 5 157 787 949 9 66 137 212 Region II 49 226 443 718 198 105 82 385 3 221 532 756 10 34 95 139 Region III 148 497 1,109 1754 687 302 325 1,314 16 486 2,477 2,979 40 110 308 458 Region IV-A 211 527 3,521 4259 1,047 434 593 2,074 16 650 7,896 8,562 93 120 1,176 1,389 Region IV-B 32 168 376 576 102 104 111 317 13 143 802 958 19 97 244 360 Region IX 134 110 125 369 288 140 70 498 21 86 272 379 61 33 111 205 Region V 114 234 391 739 356 297 204 857 15 261 1,254 1,530 33 149 290 472 Region VI 108 129 336 573 376 116 174 666 7 153 586 746 24 58 150 232 Region VII 104 243 569 916 358 317 411 1,086 40 306 1,308 1,654 22 85 284 391 Region VIII 96 205 199 500 239 180 135 554 13 160 348 521 66 108 120 294 Region X 152 151 335 638 226 118 190 534 18 200 846 1,064 64 134 325 523 Region XI 86 119 350 555 183 228 222 633 17 171 1,366 1,554 29 105 549 683 Region XII 80 147 240 467 190 120 141 451 15 91 750 856 23 36 249 308
Total 1,683 4,024 13,828 19535 5,736 3,569 4,060 13,365 254 4,965 31,387 36,606 615 1,525 5,935 8,075
Source: Philippines Department of Education Consolidated SPED Data 2016—2017. Note: Autonomous Region in Muslim Mindanao (ARMM); Cordillera Administrative Region (CAR); Caraga Administrative Region (CARAGA); National Capital Region (NCR); Negros Island Region (NIR).

41
ANNEX E: GUIDELINES FOR SCREENERS AND SCHOOL SCREENING USING ELECTRONIC SCREENING TOOLS Screening Equipment and Process
1. Screeners must learn and master the screening device, including its use, features procedures, and processes, is critical before using it in the field. The screening requires much patience and understanding, and age-appropriate language should be used during the screening, and especially during the practice, to ensure the child responds accurately to the stimuli.
2. Instruction to the student should be given simply and clearly and must include return demo/practice for the student.
3. Using and taking care of tablets and gadgets—everyone should take time to learn to use a tablet; proper care is needed in handling and in ticking the tablet screen to avoid unnecessary commands. Learn the value of patience in waiting for the tablet to give its response.
Screening Setting 4. Finding the right testing venues is important in achieving accurate results. This means the
screener must identify spaces with proper lighting and ventilation. The screening space should be a noise-regulated room that is away from other classrooms. The screener should also be aware of unnecessary noise from other appliances such as air conditioning and fans or from construction or noisy roads that are close by.
5. The noise check should always be conducted in the screening area, and the screener should continuously use the noise monitoring feature.
6. Ideally, there will only be one screener and one child per screening room.
Consent 7. As a prerequisite, ask for the patients’ consent prior to conducting the screening. A written
parent or guardian consent is required prior to conducting the screening in compliance with the data privacy act.
Results/Referrals 8. All records must be saved; data entry must be accurate.
9. Patients with “refer” results should be handled by medical officers who are in authority to inform and explain and to counsel the parents.
10. Students’ results must be confidential.
11. Results will the basis for recommendation and further intervention.