Embed Size (px)
Citation preview

Visible and near‐infrared multispectral analysis of geochemicallymeasured rock fragments at the Opportunity landing sitein Meridiani Planum
Catherine M. Weitz,1 William H. Farrand,2 Jeffrey R. Johnson,3 Iris Fleischer,4
Christian Schröder,5,6 Aileen Yingst,1 Brad Jolliff,7 Ralf Gellert,8 Jim Bell,9
Kenneth E. Herkenhoff,3 Göstar Klingelhöfer,4 Barbara Cohen,10 Wendy Calvin,11
Malcolm Rutherford,12 and James Ashley13
Received 25 May 2010; revised 28 July 2010; accepted 12 August 2010; published 20 November 2010.
[1] We have used visible and near‐infrared Panoramic Camera (Pancam) spectral dataacquired by the Opportunity rover to analyze 15 rock fragments at the Meridiani Planumlanding site. These spectral results were then compared to geochemistry measurementsmade by the in situ instruments Mössbauer (MB) and Alpha Particle X‐ray Spectrometer(APXS) to determine the feasibility of mineralogic characterization from Pancam data. Ourresults suggest that dust and alteration rinds coat many rock fragments, which limits ourability to adequately measure the mineralogy of some rocks from Pancam spectra relative tothe different field of view and penetration depths of MB and APXS. Viewing and lightinggeometry, along with sampling size, also complicate the spectral characterization of therocks. Rock fragments with the same geochemistry of sulfate‐rich outcrops have similarspectra, although the sulfate‐rich composition cannot be ascertained based upon Pancamspectra alone. FeNi meteorites have spectral characteristics, particularly ferric oxidecoatings, that generally differentiate them from other rocks at the landing site. Stonymeteorites and impact fragments with unknown compositions have a diverse range ofspectral properties and are not well constrained nor diagnostic in Pancam data. BounceRock, with its unique basalt composition, is easily differentiated in the Pancam data from allother rock types at Meridiani Planum. Our Pancam analyses of small pebbles adjacent tothese 15 rock fragments suggests that other rock types may exist at the landing site but havenot yet been geochemically measured.
Citation: Weitz, C. M., et al. (2010), Visible and near‐infrared multispectral analysis of geochemically measured rock fragmentsat the Opportunity landing site in Meridiani Planum, J. Geophys. Res., 115, E00F10, doi:10.1029/2010JE003660.
1. Introduction
[2] Fifteen rock fragments at the Opportunity landing sitehave been analyzed as of sol 2004 by both the rover visibleand near‐infrared Panoramic Camera (Pancam), and the insitu instruments, Mössbauer (MB) and Alpha Particle X‐raySpectrometer (APXS). Several of the rocks were largeenough for the Rock Abrasion Tool (RAT) to either brush orgrind, thereby exposing a fresher, cleaner surface. The rocks
analyzed in this study include Bounce Rock, Lion Stone,Barberton, Heat Shield Rock, Russet, Arkansas, Persever-ance, Antistasi, Santa Catarina, Santorini, Kos, Tilos,Rhodes, Kasos, and Block Island. Note that these names areinformal and not approved by the International Astronomi-cal Union. The rock fragments vary in size from pebbles (4–64 mm) and cobbles (64–256 mm) to boulders (>256 mm)based upon the Wentworth scale.
1Planetary Science Institute, Tucson, Arizona, USA.2Space Science Institute, Boulder, Colorado, USA.3Astrogeology Science Center, U.S. Geological Survey, Flagstaff,
Arizona, USA.4Institut für Anorganische Chemie und Analytische Chemie, Johannes
Gutenberg‐Universität, Mainz, Germany.5Department of Hydrology, University of Bayreuth, Bayreuth,
Germany.
6Center for Applied Geoscience, Eberhard Karls University ofTübingen, Tubingen, Germany.
7Department of Earth and Planetary Sciences, Washington University inSt. Louis, St. Louis, Missouri, USA.
8Department of Physics, University of Guelph, Guelph, Ontario,Canada.
9Department of Astronomy, Cornell University, Ithaca, New York,USA.
10NASA Marshall Space Flight Center, Huntsville, Alabama, USA.11Department of Geological Science and Engineering, University of
Nevada, Reno, Nevada, USA.12Department of Geological Sciences, Brown University, Providence,
Rhode Island, USA.13Mars Space Flight Facility, Arizona State University, Tempe,
Arizona, USA.Copyright 2010 by the American Geophysical Union.0148‐0227/10/2010JE003660
JOURNAL OF GEOPHYSICAL RESEARCH, VOL. 115, E00F10, doi:10.1029/2010JE003660, 2010
E00F10 1 of 29

[3] There are several proposed hypotheses for the origin ofthe rock fragments at Meridiani [Jolliff et al., 2006; Fleischeret al., 2010b]: (1) fragments of meteorites, (2) resistantmaterial eroded from the outcrop, (3) erosional remnants of alayer that once existed above or is currently located belowthe present outcrops, (4) fragments of impact ejecta, and(5) impact breccias derived from the outcrop and perhapsmixed with underlying strata. It should be noted that thesemodels are not mutually exclusive.[4] In general, the rock fragments can be divided into
three groups based upon their mineralogy (Figure 1)[Fleischer et al., 2010b]: (1) outcrop fragments, includingLion Stone and Russet, that have the same compositions asthe light‐toned sulfate outcrop rocks [Clark et al., 2005;McLennan et al., 2005]; (2) meteorite candidates, includingBarberton, Santa Catarina, Santorini, and Kasos, which havehigh Ni contents and the presence of kamacite and troiliteand Heat Shield Rock and Block Island, which are iron‐nickel meteorites [Schröder et al., 2008; J. W. Ashley et al.,Evidence for mechanical and chemical alteration of iron‐nickel meteorites on Mars ‐ Process insights for MeridianiPlanum, submitted to Journal ofGeophysical Research, 2010];and (3) impact fragments, including Bounce Rock, Arkansas,Perseverance, Antistasi, Joseph McCoy, Haiwassee, Tilos,Kos, and Rhodes. Bounce Rock has a basaltic compositionsimilar to the shergottite meteorite EETA79001 [Klingelhöfer
et al., 2004; Rieder et al., 2004; Squyres et al., 2006]. Theother impact fragments have compositions intermediatebetween sulfate‐rich outcrop and basaltic soil, consistent withimpact melt. They could also represent a layer at depth orfrom somewhere else on Mars that has been mixed andbrought to the surface as impact ejecta [Fleischer et al.,2010b].[5] Here we report on individual rocks in order of the sols
they were examined by rover instruments. There are twocobbles (Joseph McCoy and Haiwassee) that were analyzedby APXS and MB but the cobbles could not be confidentlyidentified in the Pancam scene among dozens of similarlooking cobbles. However, these two cobbles have a geo-chemistry similar to several other cobbles (Arkansas, Per-severance, and Antistasi) [Fleischer et al., 2010b] wherePancam spectra were acquired.
2. Data Sets and Analysis Methods
[6] The Pancam multispectral camera on the Opportunityrover acquired the main data set discussed in this paper.Pancam consists of two cameras mounted 1.5 m above theground on a mast to provide stereo separation [Bell et al.,2003]. Each camera has an eight‐position filter wheel with13 filters covering 11 unique visible/near‐infrared (VNIR)wavelengths. Table 1 lists the 13 filter positions. All anal-
Figure 1. Composition of rock fragments compared to Meridiani outcrop and soil. Outcrop fragments(OF) are indistinguishable from other outcrop rocks; Barberton group cobbles (BG) are clearly differentfrom any other material, and Arkansas group cobbles (AG) appear compositionally close to soil for anumber of elements. All three APXS spots on Bounce Rock are plotted.
WEITZ ET AL.: ROCK FRAGMENTS AT MERIDIANI PLANUM E00F10E00F10
2 of 29

yses conducted in this investigation used data sets that wereacquired using all 13 of these bands.[7] Spectra from regions of interest (rectangles that
encompassed between 10 and 100 pixels) were collectedmanually from common areas in each camera. The spectrawere then scaled such that they matched at the L2 and R2channels (centered at 753 and 754 nm, respectively). Thestandard deviation shown in the spectral plots represents thepixels that have been averaged together to form the spectra,but do not represent instrumental error. A calibration targetwas also acquired for each multispectral image and used inconjunction with prelaunch calibration information to con-vert the raw image data to calibrated radiance and then toradiance factor (I/F, where I is the measured radiance and Fis the incident solar irradiance) [Bell et al., 2003, 2006]. Thedata was then converted to relative reflectance (R*, definedas I/F divided by the cosine of the incidence angle [Reid et al.,1999; Bell et al., 2006]) using the solar incidence angle foreach scene. Calibration of the images to R* results in a first‐order correction of the diffuse sky illumination for surfacesat or near the same solar incidence angle as the calibrationtarget. Absolute reflectance levels of these data are believedto be accurate to within ∼10% for the shorter wavelengthsand slightly less (better) at longer wavelengths [Bell et al.,2006]. Data were typically compressed on the rover beforedownlink and effects from the compression are estimated tocause < 1% error on the radiometric precision [Bell et al.,2006]. More details concerning the calibration and sourcesof error of the Pancam data can be found in the work of Bellet al. [2006], Farrand et al. [2007, 2008], and Johnson et al.[2006].[8] Simple three band color composites and decorrelation
stretches have been produced for each of the cobbles. Thethree band color composites consist of the L2, L5, L6(L256) bands. In order to increase the subtle differences incolor, we applied decorrelation stretches to the bands[Gillespie et al., 1986; Farrand et al., 2007]. The colorrepresentations in the decorrelation stretch images dependupon the materials and variations of spectra within the sceneso the colors only apply to a given scene. Decorrelationstretch images consist of the L2, L5, L7 (L257) or R2, R6,R7 (R267) bands.[9] Most soils on the Meridiani plains and within impact
craters have millimeter size spherules informally referred toas “blueberries.” The hematite‐rich spherules are postulated
Table 1. Pancam Band Names and Centers
Band Center (nm)
L2 753L3 673L4 601L5 535L6 482L7 432R1 436R2 754R3 803R4 864R5 904R6 934R7 1009
Figure 2. Traverse of Opportunity rover through sol 2027.Rock fragments analyzed in this study are shown along thetraverse path, with the colors representing the type of rock(blue for outcrop fragments, pink for meteorite fragments,and red for impact fragments). Informal names for impactcraters are also shown.
WEITZ ET AL.: ROCK FRAGMENTS AT MERIDIANI PLANUM E00F10E00F10
3 of 29

to have formed by secondary alteration of the sulfate‐richoutcrop as water permeated through the rocks and producedconcretions [McLennan et al., 2005]. Proposed origins forthe exposed outcrop at the landing site include impact surgedeposits [Knauth et al., 2005], a basaltic pyroclastic depositsubsequently altered through reaction with an aqueous sul-phuric acid solution [McCollom and Hynek, 2005], anderosion and redistribution of sand grains that originally werederived by chemical weathering of olivine basalt in aqueoussolutions of sulfuric acid, forming sulfate salts that accu-mulated with fine grained silicates [Squyres et al., 2004,2006; Grotzinger et al., 2005]. The spherules are moreresistant to erosion and collect as a soil lag on the surface asthe friable outcrop is eroded and removed by the wind.[10] In order to explore possible illumination effects for
Pancam images of the rock fragments, we have alsoacquired spectra of blueberries and outcrop within any given
scene if they are visible and resolvable. Thus far, nochemical variations have been identified in the blueberriesthroughout the landing site, although their small size (∼1–4 mm diameter) makes it impossible to acquire an in situmeasurement of individual blueberries and thus an average ismade for a cluster of spherules that fill the field of view for theIDD instruments (∼1.5 cm for MB and ∼2.5 cm for APXS).We assume for this study that all blueberries share the samechemistry, and consequently, Pancam spectra for blueberriesshould not reflect any intrinsic mineralogic differences. Wedo, however, expect to see different amounts of air fall duston individual blueberries, specular reflections, and lightinggeometry variations that would affect the spectra acquiredfor blueberries depending upon the scene. Indeed, by com-paring spectral variability of blueberries within a givenscene, we can better understand variations in Pancamspectra of the rock fragments. In general, each spectrum
Figure 3. MI mosaic of Bounce Rock acquired (left) pre‐RAT and (right) post‐RAT.
Figure 4. (a) Pancam color composite with L2 in red, L5 in green, and L6 in blue of Bounce Rock takenafter the RAT hole was made. Locations A, B, and C are where spectra were extracted and shown inFigure 5. (b) Decorrelation stretch with L2 in red, L5 in green, and L7 in blue. (c) Decorrelationstretch with R2 in red, R6 in green, and R7 in blue.
WEITZ ET AL.: ROCK FRAGMENTS AT MERIDIANI PLANUM E00F10E00F10
4 of 29

shown for blueberries represents an average of between 3and 10 blueberries from the same scene.[11] Outcrop spectra are more variable owing to subtle
chemical, alteration, and other surficial processes that haveaffected the outcrop over time. Farrand et al. [2007] notedthat Meridiani outcrop can be divided into two spectralclasses: (1) HFS (High Four hundred eighty‐two to 535 nm
Slope): more oxidized, lighter‐toned and buff colored inL256 composites and (2) LFS (Low Four hundred eighty‐two to 535 nm Slope): less oxidized, darker‐toned and purplecolored in L256 composites. Consequently, we expect toobserve a larger degree of spectral heterogeneity for outcropexposures compared to blueberries.
Figure 5. Spectra from Bounce Rock with surfaces A, B, and C shown in Figure 4. Surface A ischaracteristic of dust, while the RAT hole and surfaces B and C are consistent with pyroxene. Thespectrum for the blueberries has an absorption in the NIR with a strong upturn between 934 and 1009 nm.
Figure 6. (a) MI image of Lion Stone surface. Embedded blueberries are shown by red arrows. (b) MImosaic of RAT hole in Lion Stone with embedded blueberry shown by red arrow.
WEITZ ET AL.: ROCK FRAGMENTS AT MERIDIANI PLANUM E00F10E00F10
5 of 29

[12] We also use data acquired by several of the in situinstruments on the robotic arm, including: MicroscopicImager (MI) with a resolution of 30 mm/pixel or images31x31 mm across [Herkenhoff et al., 2003, 2008]; APXS forelemental composition [Rieder et al., 2003]; and MB for Feoxidation states and Fe‐bearing mineral measurements[Klingelhöfer et al., 2003]. The geochemistry measurementsof the rock fragments are not a focus of this paper, however,and have been discussed in other publications [e.g., Schröderet al., 2008; Fleischer et al., 2010b; Schröder et al., 2010].Instead, we focus on Pancam spectral analyses and compar-ison of the VNIR spectral interpretations of mineralogy tomeasurements made by the in situ instruments.[13] In addition to spectral analyses, we have also used
Pancam data in combination with MI images to analyze theshape, roundness, and textures of the rock fragments [Yingstet al., 2008]. The shape of a rock can provide importantinsight about formation and modification. Sphericity is theratio that determines how close a particle approximates asphere, with 1.0 representing a perfect sphere. Roundness isa measure of the sharpness of grain corners. Together, thesephysical attributes and spectral results have been used toinfer likely origins and alteration mechanisms for each rockfragment. Note that in most cases, measurements ofroundness and sphericity are based on images acquired froma single viewpoint, and the unseen portions of the rock mayhave exhibited a different surface shape that could have
influenced the overall roundness/sphericity calculations hadthey been observed.
3. Data Analysis of Individual Rock Fragments
[14] In this section we describe analyses conducted oneach rock fragment by the rover instruments. The resultsfrom MI, APXS and MB are discussed along with Pancamspectra. A comparison of the spectral properties for all therocks is described in section 4.
3.1. Bounce Rock (Sols 66–70)
[15] After egress from Eagle Crater, Opportunity analyzedan unusual loose rock about 20 m beyond the crater rim(Figure 2). The rock had been pushed slightly into theground by the impact from one of the lander inflatable air-bags and was hence dubbed “Bounce Rock.” The rock is∼40 cm long and irregular in shape with a sphericity of 0.62and roundness of 0.53 (qualitative roundness is angular).The results from miniThermal Emission Spectrometer(miniTES), APXS and MB analyses indicate the rock isdominated by pyroxene, consistent with a basaltic compo-sition similar to the shergottite meteorite EETA79001[Klingelhöfer et al., 2004; Rieder et al., 2004; Christensenet al., 2004; Squyres et al., 2006; Zipfel et al., 2010]. Therock is most likely an impact fragment not locally derivedbut potentially from a crater 75 km to the southwest[Squyres et al., 2004].
Figure 7. (a) L2, L5, and L6 composite of Lion Stone. The top surface appears dusty. Blueberries (bluespherules) can be seen in the soils around Lion Stone. (b) L257 decorrelation stretch image. (c) R267decorrelation stretch image. (d) L256 composite after grinding the RAT hole.
WEITZ ET AL.: ROCK FRAGMENTS AT MERIDIANI PLANUM E00F10E00F10
6 of 29

[16] Mosaics of MI images taken before and after use ofthe RAT are shown in Figure 3. The RAT produces ∼4.5 cmdiameter holes that are typically several millimeters deep[Gorevan et al., 2003]. None of the MI images show con-vincing evidence for phenocrysts. The pre‐RAT surfaceshows fractures and small pits, many of which are filled inwith sand and millimeter size pebbles. The surface displayssmall amounts of brightness variations that can be attributedto variable degrees of dust. The RAT hole exposes smallfractures but no significant heterogeneities in brightness,roughness, or evidence of crystals.[17] Pancam false color images of Bounce Rock are
shown in Figure 4. The RAT hole created a large amount offine debris that obscured the original surface of the rock. Inthe composite and decorrelation stretches, color variationscan be seen in the right portion of Bounce Rock where thereis no contamination by RAT hole cuttings. Spectra wereacquired from three locations (Figure 4a) on the surface ofBounce Rock that were distinguishable in the color images.In addition, a spectrum of spherule‐free soil and a spectrumthat represents the average of several blueberries in the soilare shown in Figure 5. As noted by others [e.g., Weitz et al.,2006] the blueberries have an upturn inflection between the934 and 1009 nm bands that is characteristic of hematite.Location A on Bounce Rock has a spectrum that is similar todust (Figure 5). In contrast, spectra from locations B and Chave long wavelength absorptions that could match pyrox-ene or olivine. The RAT hole spectrum has the same longwavelength absorption but not as steep a slope in the visible,probably due to lack of dust. Bell et al. [2004] interpreted
the presence of pyroxene or olivine within the rock basedupon similar Pancam spectra of Bounce Rock. Conse-quently, the Pancam spectra of Bounce Rock are consistentwith the basaltic composition determined by APXS and MB.
3.2. Lion Stone (Sols 106–108)
[18] Before entering Endurance crater, Opportunity ana-lyzed a 35 cm long rock dubbed Lion Stone. The rock iselongated and has thin bedding with a sphericity of 0.63 androundness of 0.11 (qualitative roundness is very angular). Itdoes not appear to be loose lying on the surface but ratherconnects to underlying partially buried outcrop. Lion Stonewas analyzed before and after use of the RAT grind. MIimages show a surface similar to that seen in outcrop withembedded blueberries and vugs (Figure 6a). A fracture andblueberry can be seen in the RAT hole MI mosaic image(Figure 6b).[19] APXS and MB measurements indicate the composi-
tion is dominated by silica and sulfur and sulfate minerals.Both the pre‐ and post‐RAT chemical measurements aresimilar to those of typical outcrop exposures. Hence, therock is either a high‐standing outcrop or proximal craterejecta from the outcrop.[20] Figure 7 shows the pre‐ and post‐RAT Pancam
images of Lion Stone. Much of the top surface has a dif-ferent color than the remainder of the rock. The darker RAThole represents a dust‐free and fresher surface (Figure 7d)and its spectrum is similar to the side of the rock (Figure 8).Spectra for blueberries embedded within the rock are similarto spherules adjacent to Bounce Rock on the ground. When
Figure 8. Spectra from Lion Stone. The sides and RAT hole are different from the upper surface of therock, perhaps due to weathering rinds and dust coatings on the flatter top surface. The spectrum for theblueberries has a strong upturn between 934 and 1009 nm, characteristic of the hematite‐rich compositionof the spherules.
WEITZ ET AL.: ROCK FRAGMENTS AT MERIDIANI PLANUM E00F10E00F10
7 of 29

compared to other outcrop spectra from Farrand et al.[2008], the RAT hole and side spectra for Lion Stoneclosely match outcrop with steeper faces and at the distalportions of layers (LFS spectral class). In contrast, the uppersurface of the rock has spectra comparable to the HFSoutcrops, which are typically buff colored with flattersurfaces [Farrand et al., 2008]. Based upon these Pancamresults, it would be difficult to uniquely determine themineralogy of the rock (i.e., that the rock is dominated bysilica and sulfates) without the geochemistry measurements.
3.3. Barberton (Sols 121–123)
[21] Barberton is a ∼3 cm pebble on the rim of Endurancecrater (Figure 9a). In MI images (Figures 9b and 9c), thepebble has an indistinct surface texture that could resultfrom dust accumulation. Its shape is angular with flat facetsintersecting at sharp angles. No layering or crystals arevisible. The sphericity is 0.89 and the roundness is 0.74(qualitative roundness is subangular).[22] APXS measurements show high Ni, Mg and low Al,
Ca contents (Figure 1), although the pebble was smallenough that it probably did not completely fill the field of
view. MB measurements are dominated by pyroxene andolivine, with evidence for metallic iron in the form of ka-macite and the sulfide troilite, characteristic of meteorites[Schröder et al., 2008]. Comparison to known meteoritessuggests a chemical similarity to mesosiderite silicate clasts[Schröder et al., 2008]. Mesosiderites are stony irons andrelatively rare on Earth. Barberton’s proximity to Endurancecrater suggests that it could represent a piece of the impactorthat created the crater.[23] Pancam false color and decorrelation stretch images
of Barberton are shown in Figure 10. The pebble is situatedon a flat outcrop exposure and surrounded by loose blue-berries. The MB imprint into a nearby soil is also visible inthe Pancam scene. The spectrum for the outcrop (Figure 11)is consistent with other outcrop exposures seen at Meridiani.The spectrum for blueberries is atypical, with two apparentabsorptions at 754 nm and 904 nm compared to the typicalone absorption seen at 904 nm in other Pancam scenes,although the error bars are very large. The blueberriesspectrum does have the characteristic strong upturn betweenthe 934 and 1009 nm filters.
Figure 9. (a) Front Hazard Camera showing Barberton on the edge of Endurance crater, seen in thebackground. (b) MI image of Barberton. (c) MI image of Barberton and blueberries.
Figure 10. Pancam scene of Barberton and adjacent soils. (a) False color composite with Barberton(blue rock fragment) and MB imprint into fine soil (purple arrow). (b) L257 decorrelation stretch and(c) R267 decorrelation stretch with blowup of Barberton showing surfaces where spectra were extracted(locations 1 and 2).
WEITZ ET AL.: ROCK FRAGMENTS AT MERIDIANI PLANUM E00F10E00F10
8 of 29
[24] In the decorrelation image (Figure 10c), Barbertonexhibits some spectral variation. Extracted spectra from twolocations on Barberton indicate these variations could beattributed to different amounts of atmospheric or outcrop‐derived dust, as indicated by the larger reflectance andabsorption at 1009 nm band in Barberton 1. Barberton 2 hastwo apparent absorptions, one around 803 nm and the otheraround 900 nm. Based upon the Pancam spectra of Bar-berton, we cannot adequately determine mineralogy norconfirm whether it is a stony meteorite. However, Barber-
ton’s distinct spectra from outcrop material and its locationalong the rim of Endurance would evoke a nonlocal, andtherefore possibly meteoritic, origin.
3.4. Heat Shield Rock (Sols 347–352)
[25] The rover analyzed a 31 cm size boulder that wasonly a few meters from the heat shield used during descentof the lander. The MER team dubbed it “Heat Shield Rock,”although it is officially recognized as a meteorite with thename “Meridiani Planum.” The rock has a pitted surface
Figure 11. Spectra of Barberton and other nearby materials.
Figure 12. MI mosaics of Heat Shield Rock acquired (a) pre‐RAT and (b) post‐RAT brush.
WEITZ ET AL.: ROCK FRAGMENTS AT MERIDIANI PLANUM E00F10E00F10
9 of 29

with quasi‐specular reflections (Figure 12) and hollows,some of which resemble regmaglypts (J. W. Ashley et al.,submitted manuscript, 2010), giving it a distinct appearancefrom the typical rocks seen along the Meridiani plains byOpportunity. The sphericity is 0.79 and roundness is 0.198(qualitative roundness is subround). Heat Shield Rock wasanalyzed by the IDD instruments both pre‐ and post‐RATbrush.[26] Initial remote sensing by MiniTES indicated the rock
was metallic [Schröder et al., 2008; Ruff et al., 2008]. Thecomposition of the rock is dominated by 93% Fe with 7%nickel as measured by the APXS [Schröder et al., 2008] andthe mineral kamacite was determined on the basis of theFe/Ni ratio using the MB [Morris et al., 2006; Fleischeret al., 2010a]. Based upon these compositions, the rock is
classified as an IAB complex iron meteorite [Schröder et al.,2008].[27] Pancam images, especially the L257 decorrelation
stretch image, show heterogeneities on the surface of therock (Figure 13). Spectra extracted from the brushed region(Figure 14) indicate that the purple material has a deeper535 nm band most likely attributable to more oxidationrelative to the bluer material [Schröder et al., 2008]. MIimages reveal the pits in the rock are filled with small par-ticles. A Pancam spectrum from one of the pits (Figure 14,Heat Shield Pit) is characteristic of air fall or outcrop‐derived dust. Most of the surface of Heat Shield Rock has abroad but shallow absorption in the NIR region. Schröder etal. [2008] determined that the brushed surface spectrum issimilar to the iron meteorite Canyon Diablo laboratory
Figure 13. Pancam images of Heat Shield Rock taken post‐RAT brush. (a) L256 color composite. (b)L257 decorrelation stretch. Yellow box identifies blowup shown in Figure 14. (c) R267 decorrelationstretch. Note that a portion of the rover deck is visible in the bottom of each image.
Figure 14. (left) Pancam decorrelation stretch L257 overlain on MI mosaic. The brushed area has twodistinct surfaces (brushed 1 in blue and brushed 2 in purple). The unbrushed surface looks green, while apit appears orange and covered by fine particles. (right) Associated Pancam spectra of these same regionsas well as blueberries that are found adjacent to Heat Shield Rock.
WEITZ ET AL.: ROCK FRAGMENTS AT MERIDIANI PLANUM E00F10E00F10
10 of 29

spectrum. Hence, the Pancam spectra when combined withmorphological features, thermal infrared spectra [Ruff et al.,2008], and chemistry of Heat Shield Rock, can be used toinfer an iron meteorite.
3.5. Russett (Sols 381–382)
[28] Russett is an unusual shaped rock about 10 cm longwith a bumpy, irregular profile. Its sphericity is 0.75 and theroundness value is 0.18 (qualitative roundness is very angu-lar). Because of its odd shape and location along the rippledplains away from outcrop exposures, it was initially thoughtthat the rock could be of impact origin. Closer inspection ofthe rock showed embedded blueberries (Figure 15), indi-cating it was probably derived as an impact fragment fromoutcrop material. Its composition is similar to other Mer-idiani outcrops with low Fe and high Mg, Si, and S, con-sistent with the rock being a fragment of outcrop material. Alocal impact event that displaced a small fragment of out-crop is the most plausible origin for Russett.[29] Pancam images reveal slight heterogeneities in color
across the surface of Russett (Figure 16). The color varia-tions could reflect different amounts of coatings along sur-faces rather than intrinsic mineralogic variability in the rock.
A spectrum for Russett (Figure 17) has a steep upward slopein the visible and an absorption at the longer wavelengthsaround 900 nm. This spectrum is also characteristic ofoutcrop exposures, although Pancam spectra of many out-crop exposures throughout the landing site show somevariability [Farrand et al., 2007]. Spectrally, Russett issimilar to the purple‐colored LFS unit identified by Farrandet al. [2007] for steeper‐faced outcrop surfaces in the BurnsFormation. Spectra for several blueberries in the scene havethe characteristic strong upturn between 953 and 1009 nm,as well as the broad absorption around 900 nm that is typicalof the hematite‐rich spherules.
3.6. Arkansas and Perseverance (Sols 551–554)
[30] Arkansas and Perseverance are two of dozens ofcobbles clustered together along small patches of outcropjust north of Erebus crater (Figure 2). The 9.4 cm longArkansas shows no evidence of individual grains, althoughthe surface texture has heterogeneities [Herkenhoff et al.,2008]. MI images (Figure 18a) were acquired in shadowso lighting conditions are not ideal for determining brightnessand luster. In contrast, sunlit MI images of Perseverance(Figure 18b) reveal a mottled, heterogeneous appearance for
Figure 15. MI images of Russett reveal a cracked surface with embedded blueberries (black arrows).
Figure 16. Pancam images of Russett. (a) L256 color composite shows numerous small fragments on theground that are most likely pieces that broke off of Russett. (b) L257 decorrelation stretch and (c) R267 dec-orrelation stretch image. There are slight color variations across the rock surface that could result frompatchy dust or alteration coatings.
WEITZ ET AL.: ROCK FRAGMENTS AT MERIDIANI PLANUM E00F10E00F10
11 of 29

Figure 17. Spectrum of Russett is consistent with other outcrop materials at Meridiani Planum. Theblueberries also have a spectrum typical of other hematite‐rich spherules seen elsewhere at the site.
Figure 18. (a) MI image of the 9.4 cm long Arkansas. (b) MI image of the 10.2 cm long Perseverance.Letters denote regions that appear bright (B) and dark (D). (c and d) Pancam L257 color merged with MIimages.
WEITZ ET AL.: ROCK FRAGMENTS AT MERIDIANI PLANUM E00F10E00F10
12 of 29

the 10.2 cm long cobble [Herkenhoff et al., 2008]. Lighterirregular areas 1–20 mm across appear mixed into a darkermatrix. Small (<1 mm) dark spots could be basaltic sand anddiffuse bright areas in the crevices could represent dust. Thetextures seen in both cobbles are consistent with breccias. Thesphericities are 0.78 and 0.82 and roundness values are 0.12and 0.37 (angular/subangular for qualitative roundness) forArkansas and Perseverance, respectively.[31] The MB mineralogy of Arkansas looks similar to
outcrop but with less hematite and no jarosite. In addition,there is no evidence for kamacite or troilite, indicating it isnot a meteorite. APXS data indicate relatively high amountsof Al, P and less S than in the outcrop (Figure 1) with amore soil‐like composition. Their compositions are similarto rocks and especially soils at the landing site suggestingthey either represent outcrop that has been altered (perhapsby impact processes) or they are impact melt derived frommixtures of soil and outcrop found at Meridiani Planum[Fleischer et al., 2010b].[32] Because the two cobbles are near each other, one
Pancam scene was acquired to image both of them simul-taneously, as well as several other cobbles in the samelocation. The soil at this location is covered with blueberries
but unfortunately the Pancam resolution is not sufficient toresolve the spherules individually for spectral analysis.[33] All the cobbles appear blue in the L256 composite
and L257 decorrelation stretch images (Figure 19). How-ever, in the R267 decorrelation stretch image, the cobblesshow color variations. Arkansas and Perseverance appearsimilar to the majority of cobbles in the scene with darkpurple sides and bright green top surfaces. The top surfacesof several of the cobbles, including Arkansas and Persever-ance, have spectra consistent with dust or outcrop‐derivedmaterials, including steep slopes in the visible and strongdownward slopes between 934 and 1009 nm (Figure 20).However, several cobbles appear red in the R267 decorr-elation stretch image. Relative to Arkansas and Persever-ance, the red cobbles have a strong absorption around 934nm and a steeper slope in the visible characteristic ofpyroxene (Figure 20). The difference in spectra between redcobbles and Arkansas/Perseverance cobbles could be due tovariable amounts of coatings on the surfaces. Alternatively,there could be two different cobble lithologies at this loca-tion. Spectrally, the cobbles are all distinct from outcropmaterials.
Figure 19. Pancam scene of the cobbles Arkansas and Perseverance. (a) All the cobbles appear blue inthis color composite. (b) L257 decorrelation stretch image. (c) R267 decorrelation stretch image revealscolor variations between the cobbles. Arkansas and Perseverance appear purple with green top surfaces,while other cobbles appear red. (d) Locations where spectra were extracted.
WEITZ ET AL.: ROCK FRAGMENTS AT MERIDIANI PLANUM E00F10E00F10
13 of 29

3.7. Antistasi (Sols 641–645)
[34] The MI images of the ∼10 cm diameter Antistasi wereacquired in shadow but the surface shows heterogeneities inbrightness with bright spots and rings in a dominantly dar-ker matrix (Figure 21), similar to the appearance of Perse-verance. The cobble also has cracks and pits, with somesmooth and rounded edges suggesting weathering with time[Herkenhoff et al., 2008]. Bright fines occur along shallowpits and could be collections of dust and other eolian debris.The sphericity is 0.86 and the roundness is 0.065 (qualita-tive roundness is angular/subangular).[35] The chemistry of Antistasi is slightly different from
Arkansas and Perseverence, with lower amounts of SO3 andhigher Ni contents. Relative to Arkansas, MB measurementsdetect higher amounts of olivine and pyroxene and lowervalues of hematite, indicating a larger basaltic contribution[Fleischer et al., 2010b].[36] Pancam false color images of Antistasi suggest pat-
ches of dust atop the rock’s surface (Figure 22). Additionalcolor variations in the L257 decorrelation stretch imageinclude green and blue. Spectral variations between thesegreen and blue areas are very subtle. A smaller cobble a fewcm to the right of Antistasi has the same spectra, suggesting
both cobbles were derived from the same material. Althoughall cobbles appear blue in the L256 color composite, theR267 decorrelation stretch shows at least two types ofcobbles: red and purple. The purple cobbles have a slightlysteeper downward slope between 673 and 904 nm and astronger upturn between 934 and 1009 nm relative to Anti-stasi (Figure 23, Little Cobble). These purple cobbles havespectra very similar to the blueberries, although they appearlarger and more irregular in shape than typical spherules thatmake up the blueberry population. They could representAntistasi‐like material with more hematite. The outcropmatches the HFS spectral unit identified by Farrand et al.[2007] for flat‐lying outcrop exposures at Meridiani Planum.
3.8. Santa Catarina (Sols 1045–1055)
[37] Santa Catarina is a 14 cm long cobble found alongthe rim of Victoria crater. MI images (Figure 24) showjagged edges and large, bright rounded clasts that appear tobe phenocrysts. Semicircular cavities and subplanar protru-sions with highly irregular edges result in an angular sur-face. The cavities are consistent with abrasion througheolian activity or scouring by impact ejecta, while theirregularity of the protrusions is more consistent with thesebeing a product of the underlying lithology. Qualitative
Figure 20. Spectra extracted from various targets, including the cobbles Arkansas and Perseverance.The spectra for the top surfaces of the cobbles are consistent with dust or outcrop‐derived coatings.The cobbles that appear red in the R267 decorrelation stretch image have a strong absorption centeredaround 934 nm relative to the Arkansas and Perseverance types.
WEITZ ET AL.: ROCK FRAGMENTS AT MERIDIANI PLANUM E00F10E00F10
14 of 29

roundness of the cobble is angular to very angular. How-ever, the sphericity of this cobble could not be determinedbased on MI images.[38] APXS measurements indicate an ultramafic com-
position with high Ni contents. MB measurements showmore olivine than pyroxene, similar to Barberton, as wellas the mineral troilite [Schröder et al., 2008; Fleischer et al.,2010b]. The geochemistry is consistent with a stony meteorite.
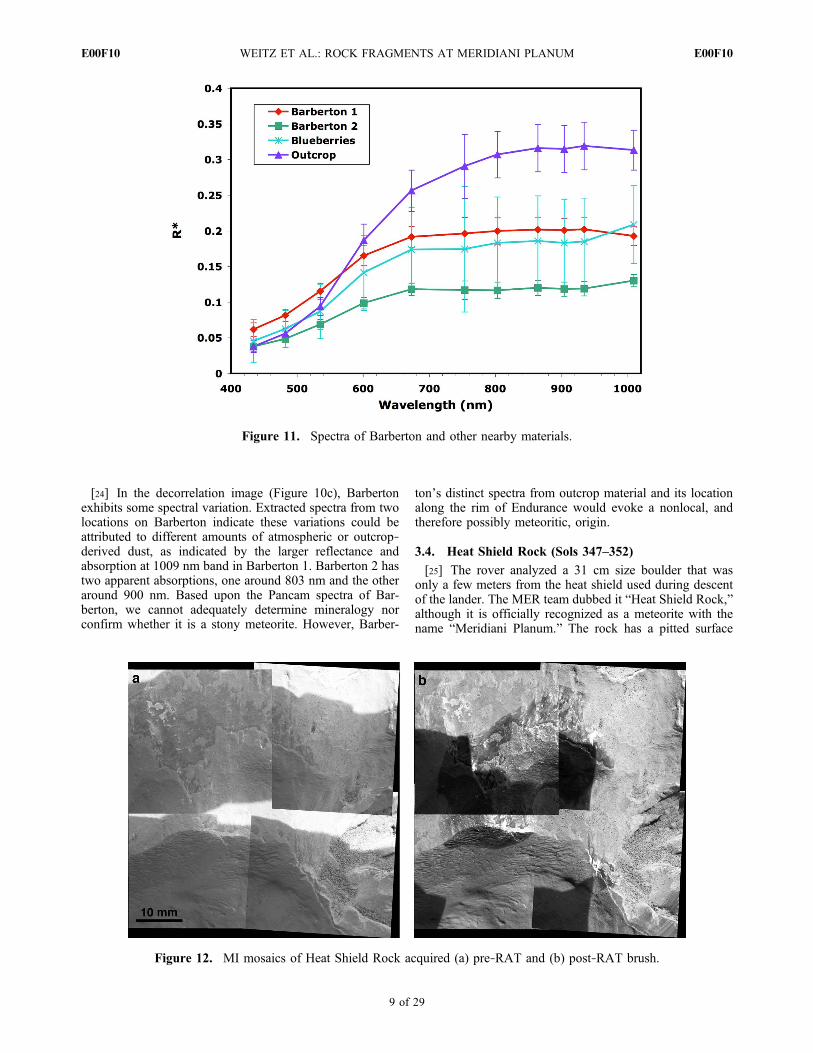
[39] Unfortunately, the rover was so close to the rock thatthe left side of the rock is only visible in the Pancam leftfilters while the right side of the rock is seen only in theright filters (Figure 24). Only the center of the rock has thefull spectral range with all 13 bands. In the decorrelationstretch images, the upper surface of the rock has consider-able eolian debris. The blueberries and outcrop have spectra(Figure 25) consistent with these same units found else-where at the landing site.[40] The clasts in the rock that appear to be phenocrysts
are spectrally distinct from the rock matrix. One phenocrystthat has the full spectrum is shown in Figure 25. It has asteeper visible slope and a stronger long wavelengthabsorption than the rock matrix. Its spectrum is similar to thebasaltic meteorite Bounce Rock, which indicates the phe-nocryst is likely a pyroxene based on the ∼930 nm apparentabsorption band center. The spectrum of the Santa Catarinamatrix combined with pyroxene phenocrysts is consistentwith a stony meteorite as measured by the geochemistryinstruments.
3.9. Santorini (Sols 1741–1748)
[41] The 8 cm long cobble Santorini is located on outcropsto the south of Victoria crater (Figure 2). The cobble has amassive lithology, with angles and facets at both the centi-meter scale and in MI images. Portions of its surface appearlustrous in MI images (Figure 26), although many fineparticles probably represent dust and other eolian debris.The surface texture is dominated by somewhat blocky facetsand angles. Some of these show a higher reflectance inPancam images. The texture is similar to coarser‐grained(millimeter scale), blocky, unweathered basalt clasts.Numerous pits are also visible, typically 300–400 mm indiameter. These pits have very angular edges, indicatingthey are not due to in situ wear, but are intrinsic to thelithology of the cobble itself. The sphericity is approxi-mately 0.75, and the quantitative roundness is less than 0.15(very angular clast). This indicates the cobble has notundergone significant wear during or after transport to itscurrent location.
Figure 21. MI mosaic of the 10 cm cobble Antistasi. Blackarrows identify rounded clasts in the darker matrix.
Figure 22. Pancam scene of Antistasi (largest) and several smaller cobbles. (a) L256 color of Antistasiand other blue cobbles. Outcrop exposures are also within the scene. (b) L257 decorrelation stretch imageshows the cobbles have both blue and green colors. (c) R267 decorellation stretch image. Antistasi andseveral other cobbles appear red with small patches of green. Other cobbles appear dark purple like theblueberries that cover most of the soils here.
WEITZ ET AL.: ROCK FRAGMENTS AT MERIDIANI PLANUM E00F10E00F10
15 of 29

Figure 23. Pancam spectra of Antistasi and nearby rocks. A smaller cobble that appears purple in theR267 decorellation stretch image (Little Cobble) has a spectrum similar to the blueberries, indicating per-haps more hematite in some of the cobbles relative to the Antistasi type.
Figure 24. (a) L257 decorrelation stretch image of the left side of Santa Catarina with large phenocrystscircled. (b) MI mosaic merged with Pancam L257 color. The two large phenocrysts resolved in Pancamare circled. Only the phenocryst on the right side (purple circle) is visible in both the left and right Pancamfilters. (c) R267 decorrelation stretch image of the right side of the cobble.
WEITZ ET AL.: ROCK FRAGMENTS AT MERIDIANI PLANUM E00F10E00F10
16 of 29
[42] APXS measurements show an ultramafic composi-tion with high Ni and Cr similar to Santa Catarina, sug-gesting it is a meteorite. MB detected troilite with possiblekamacite, along with olivine and pyroxene [Schröder et al.,2010; Fleischer et al., 2010b]. Fe oxidation states from theMB data suggest weathering [Schröder et al., 2010].[43] Pancam false color and decorrelation images reveal
some color variations (Figure 27). There are areas of blueand green in the L257 decorrelation stretch image while theR267 decorrelation stretch image shows regions of red andgreen. Spectra from the cobble are shown in Figure 28.Spectral differences between blue and green areas in theL257 decorrelation stretch image are subtle and could beindicative of greater dust contamination in the green areas.The stronger 535 nm band depth in Santorini 1 could indi-cate the presence of higher abundances of oxides as shownby the MB measurements.[44] The outcrop is consistent with the flat‐lying HFS type
from Farrand et al. [2007], although there is an unusualabsorption around 800 nm not typically seen in outcrop,perhaps an instrumental effect. The blueberries show thecharacteristic strong upturn between 934 to 1009 nm. Severalof the centimeter size nearby cobbles are spectrally similar toSantorini but others differ. In particular, a cobble that appears
bright red in the R267 decorrelation stretch (Figure 27, LittleCobble 2) has a strong absorption at the longer wavelengths,perhaps due to pyroxene. Little Cobble 1 does not have thedownward slope between 934 to 1009 nm found in theSantorini spectra, suggesting a different mineralogy.
3.10. Kos, Tilos, and Rhodes (Sols 1877–1882)
[45] These three pebbles are clustered along with othersmaller pebbles to the south of Victoria crater. Each pebbleis a few cm across and has been measured by APXS only.Pebble surface textures are difficult to discern due to thevery low contrast of MI images. However, they appearsimilar: smooth and relatively featureless (Figure 29). Noindividual grains are present. Kos has submillimeter‐scalepits, with smoothed rims. Rhodes is about 4 cm in size witha sphericity of 0.79 and a roundness of 0.54 (rounded towell rounded). Tilos is 1.5 cm in size with a sphericity of0.79 and a roundness of 0.61 (rounded). Kos is about 1 cmin size with a sphericity of 0.86 and a roundness of 0.81(well rounded).[46] Their composition is best matched to a mixture of
dust and basaltic soil. None of the cobbles show enrichmentof Ni. However, due to uncertainties in the placement of theAPXS for Tilos and Kos, as well as the comparatively large
Figure 25. Pancam spectra taken of Santa Catarina and nearby rocks. The eolian debris seen on sometop surfaces could be dust or outcrop‐derived material. A large phenocryst within the cobble is spectrallyconsistent with pyroxene.
WEITZ ET AL.: ROCK FRAGMENTS AT MERIDIANI PLANUM E00F10E00F10
17 of 29

4 cm offset in standoff distance from the pebbles (normalAPXS standoff distances are 1–2 cm), adjacent soil (basalticsand, blueberries, and dust) was measured along with thepebbles. Because no MB was acquired for any of thesepebbles and because there is contamination in the APXSmeasurements by soil components, the precise mineralogy isunconstrained.[47] All three pebbles appear blue in the L256 color com-
posite and L257 decorrelation stretch images (Figure 30).They have similar spectra (Figure 31) and were most likelyderived from the same parental material. Most of the smallerpebbles in the same Pancam scene appear spectrally similarto these three pebbles. The pebble mineralogy cannot bedetermined from their spectra due to the lack of diagnosticabsorption features. The outcrops have spectra consistentwith flat‐lying HFS spectral class from Farrand et al.[2007]. The blueberries show a weaker absorption at thelonger wavelengths compared to other spherules at thelanding site, perhaps because their small size in this Pancam
scene makes them difficult to resolve, or because of air falldust.
3.11. Kasos (Sols 1884–1890)
[48] Kasos is only a few meters away from Kos, Tilos andRhodes (Figure 2). It is about 8 cm across. In the MI images(Figure 32), the rock has a glassy, lustrous appearance.There appear to be both bright and dark surfaces on the rockbut it is difficult to decipher if the bright areas are dustcovered or represent brighter crystals within a darker matrix.Alternatively, darker and lighter areas could be products ofdiffering response of topography to illumination. The cobblehas a grainy texture, more fine scale than the blockier, moremassive texture seen in Santorini and lacking the arcuatefeatures and flaky texture of Santa Catarina. The sphericityis a rather high 0.86, indicating it to be nearly equant.Quantitative roundness is less than 0.13 (very angular).[49] The composition is very similar to Santorini with
high Mg and Ni. However, the Fe mineralogy is differentfrom Santorini, Barberton, and Santa Catarina with more
Figure 26. (left) Pancam L257 color merged with MI mosaic of Santorini and (right) portion of MIimage where arrows point to possible phenocrysts.
Figure 27. (a) L256 composite of Santorini cobble. Numerous smaller cobbles as well as blueberries arealso visible in the scene. A portion of the rover arm and instruments obscures the bottom of the image.(b) L257 decorrelation stretch image shows blue and green colors for the cobble. Numbers identify loca-tions where spectra were extracted. (c) The cobble appears red and green in this R267 decorrelationstretch image. Two smaller cobbles where spectra were extracted are identified.
WEITZ ET AL.: ROCK FRAGMENTS AT MERIDIANI PLANUM E00F10E00F10
18 of 29

pyroxene relative to olivine [Fleischer et al., 2010b]. Thereis a troilite signature in the MB spectra, consistent with ameteorite origin. Schröder et al. [2010] propose that Bar-berton, Santa Catarina, Santorini, and Kasos are fragmentsof the same larger body given their similar chemistry.Because the fragments are separated over a 10 km distance,they could be part of a meteorite strewn field, or fragmentsspalled off from the impactor that created Victoria crater.[50] Pancam color images do not show any hetero-
geneities in the rock except where there may be accumula-tions of dust (Figure 33). The spectrum of Kasos has arelatively strong 535 nm band depth and a downward slopefrom 673 nm to 1009 nm (Figure 34). Two other smallercobbles appear spectrally distinct which suggests there maybe multiple rock compositions at this location. Cobble 1appears purple while cobble 2 appears bright red in theR267 decorrelation stretch (Figure 33). Cobble 1 is spec-trally distinct from Kasos while cobble 2 could containpyroxene. The blueberries lack a broad absorption at thelonger wavelengths and a pronounced upturn between the934 and 1009 nm wavelengths that are characteristics of theblueberries elsewhere at the landing site. However, the smallsize of the blueberries in this Pancam scene may limit our
ability to adequately sample their spectra or they could becoated with dust.
3.12. Block Island (Sols 1961–2003)
[51] Block Island is a 60 cm diameter pitted boulder dis-covered along the plains toward Endeavor crater. The geo-chemistry indicates a FeNi meteorite with enrichment in S,Cl, and P. Block Island may have originated from the sameparental meteorite as Heat Shield Rock based upon theiridentical compositions [Fleischer et al., 2010a]. False colordecorrelation stretch images reveal spectral heterogeneitiesacross the surface (Figure 35), although much of the surfaceis dust covered. The surface texture is metallic, withnumerous hallows and caverns giving it a pitted appearance.Much of the surface, especially within the caverns, ismantled with a thin coating of dust, while the larger cavernsalso contain sand and blueberries. The largest cavern is 20 cmacross and is rimmed by metal protuberances that could haveformed by acidic corrosion (J. W. Ashley et al., submittedmanuscript, 2010). MI images are consistent with themetallic, meteoritic nature of the rock, showing slightlyraised (resistant) linear features indicative of the Widman-stätten pattern common to iron‐nickel meteorites (Figure 36).Qualitative roundness of the meteorite is very angular while
Figure 28. Two spectra extracted from Santorini correspond to the blue (Santorini 1) and green (Santor-ini 2) regions shown in the L257 decorrelation stretch (Figure 27b). Also shown are spectra from twosmaller cobbles. Both smaller cobbles are spectrally distinct from Santorini.
WEITZ ET AL.: ROCK FRAGMENTS AT MERIDIANI PLANUM E00F10E00F10
19 of 29

sphericity is a very low 0.6, comparable to freshly brokengrains.[52] In general, spectra of Block Island are bland and
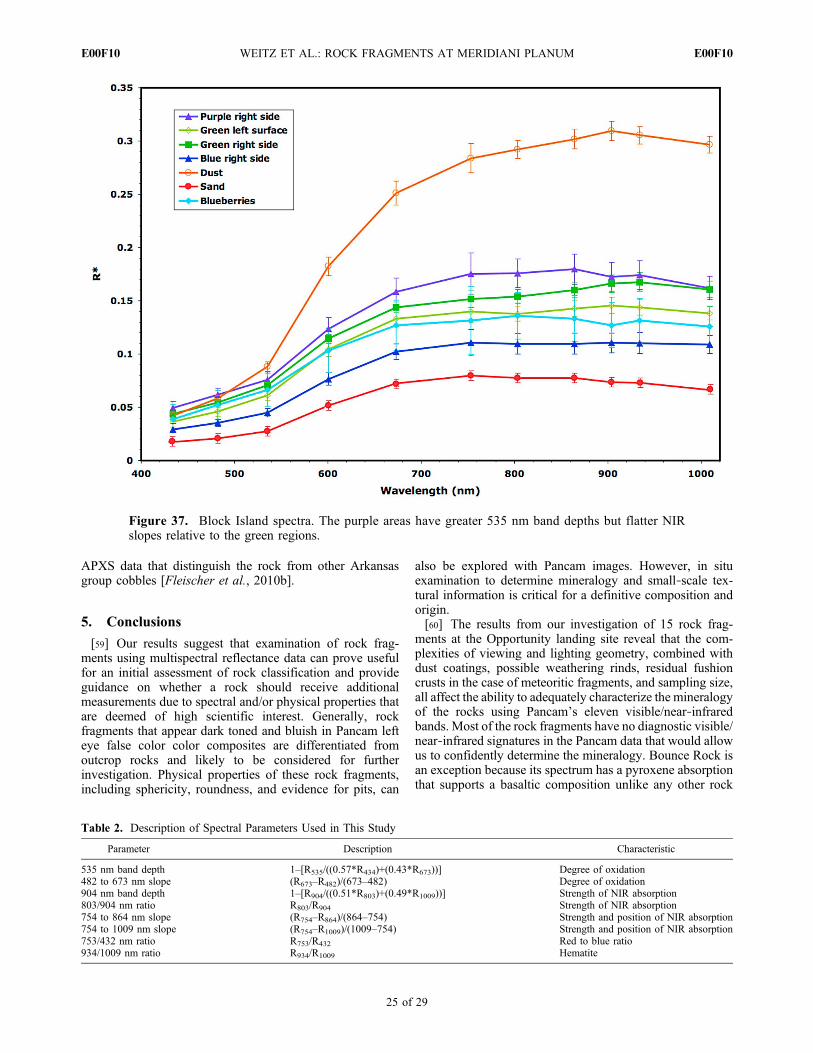
similar to soil and sand (Figure 37). Relative to the greenareas, the purple regions appear lobate and are unlikely to befushion crusts (J. W. Ashley et al., submitted manuscript,
2010) more probably representing weathering rinds instead[Ashley et al., 2010; Johnson et al., 2010]. The purple areashave a greater 535 nm band depth but flatter NIR slopesrelative to the green regions, suggesting more oxidation[Johnson et al., 2010] and consistent with MB data thatindicate phases of ferric oxide that have undergone a low
Figure 29. MI images of the cobbles Tilos, Kos, and Rhodes. Kos is spherical while the other cobblesare angular. Other smaller cobbles as well as the blueberries are also visible.
Figure 30. Pancam scene of the cobbles Rhodes, Tilos, and Kos. (a) L256 composite image with thelocations of the three cobbles. Numerous other cobbles are also visible in the image. (b) L257 decorrela-tion stretch image. (c) R267 decorrelation stretch image. All the cobbles appear similar in color and couldhave been derived from the same parental material.
WEITZ ET AL.: ROCK FRAGMENTS AT MERIDIANI PLANUM E00F10E00F10
20 of 29
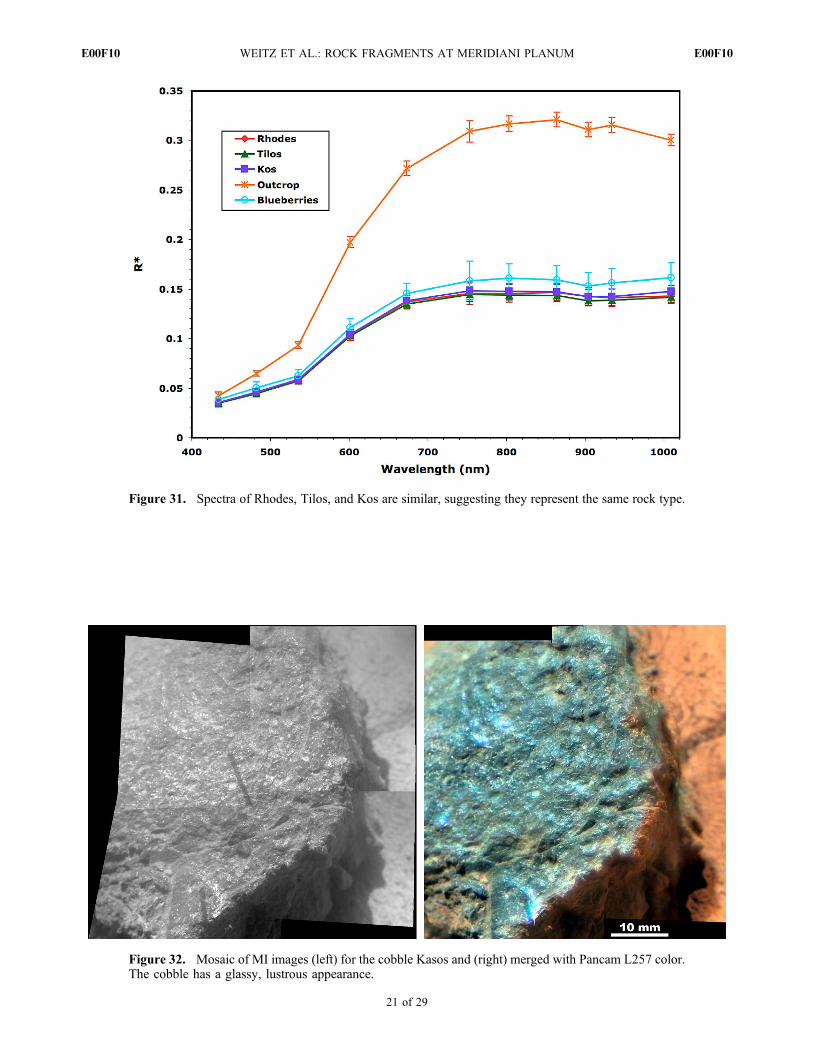
Figure 31. Spectra of Rhodes, Tilos, and Kos are similar, suggesting they represent the same rock type.
Figure 32. Mosaic of MI images (left) for the cobble Kasos and (right) merged with Pancam L257 color.The cobble has a glassy, lustrous appearance.
WEITZ ET AL.: ROCK FRAGMENTS AT MERIDIANI PLANUM E00F10E00F10
21 of 29

degree of chemical weathering [Fleischer et al., 2010a].Similar coatings of ferric oxides were also seen in spectra ofHeat Shield Rock [Schröder et al., 2008]. Note that theblueberries spectrum has a downturn between 934 to 1009 nm,unlike the typical upturn seen in blueberries elsewhere at
the landing site. A dust coating on the surfaces of the blue-berries could explain their unusual spectra at this location.
4. Discussion
[53] In order to quantify color differences between therock fragments, we have applied a set of spectral parameters
Figure 33. (a) L256 composite shows Kasos resting on outcrop exposure. (b) L257 decorrelation stretchdoes not reveal any heterogeneities across Kasos. (c) R267 decorrelation stretch of Kasos and two smallercobbles.
Figure 34. Spectra of Kasos and other nearby cobbles.
WEITZ ET AL.: ROCK FRAGMENTS AT MERIDIANI PLANUM E00F10E00F10
22 of 29

selected on the basis of their ability to highlight uniquespectral differences between the rocks. Table 2 lists thespectral parameters for this study. Materials with high 535nm band depth values are generally outcrop or dusty. Theinflection in the spectral slope at the 535 nm band can beused to measure the degree of crystallinity of ferric oxideminerals and/or particle size. The 535 nm band depthparameter has also been found to have a direct relation to theFe3+/FeTotal value returned by in situ measurements of rocksby the Spirit rover’s Mössbauer spectrometer [Farrand etal., 2006, 2008]. The red/blue (753/432 nm) ratio and 482to 673 nm slope are important discriminators of the degreeof oxidation. The 934/1009 nm ratio is useful for identifyingthe inflection at the longest wavelengths. Hematite‐richblueberries are best seen by low 934/1009 nm values. The754–864 nm slope and the 754–1009 nm slope are used todetermine the strength and position of the NIR absorption.The 803/904 nm ratio is also used to determine the strengthof the NIR absorption. Spectral parameter plots for all rockfragments are shown in Figure 38.[54] We have also calculated spectral parameters for
blueberries and outcrop from the same Pancam scenes thatcontain rock fragments. In addition, a typical soil with noblueberries along the Meridiani plains (sol 68 soil) and somedarkish sand trapped within a Block Island pit (sand inBlock Island) are plotted for comparison. Finally, we showthe pre‐RAT and RAT’ed blueberries at two locations inorder to infer possible chemical alteration or dust cover.
After the RAT ground away a portion of a few blueberries inthe outcrop, we assume that the spectra extracted from thecut blueberries represents clean material (i.e., no dust oratmospheric alteration). The plots do show that the RAT’edblueberries have higher 754 to 1009 nm slopes and anincrease in the 535 nm band depth relative to the non‐RAT’ed blueberries, consistent with hematite‐rich materials.We note that the RAT’ed blueberries from each site (sols 35and 405) do not always plot close together even though theyare likely the same in composition. These observationssuggest that other factors, such as illumination geometryand/or residual dust, affect spectra and calculated spectralparameters.[55] The iron meteorites (Table 3), Heat Shield Rock and
Block Island, have spectral heterogeneities due to patches offerric oxide coatings as well as eolian debris on their sur-faces. The purple RAT brushed region on Heat Shield Rock(Figure 38, Heat Shield Brushed 2) and the unbrushedpurple region on Block Island have greater 535 nm banddepths relative to other areas on the meteorites, consistentwith some type of ferric oxide. The blue and purple patcheson each rock have slightly higher 904 nm band depths and803/904 nm ratios than the typical greener surfaces on themeteorites. Relative to other rock fragments, the iron me-teorites have generally lower 904 nm band depths and 803/904 nm ratios and higher 754 to 864 nm slopes.[56] The four stony meteorites with similar geochemistry
(Table 3; Barberton, Santorini, Santa Catarina, and Kasos)
Figure 35. Left and right side views of the boulder Block Island. (a) L256 composite of the left side witha portion of the robotic arm in the lower left. (b) L257 decorrelation stretch image with locations of somesurfaces where spectra were extracted and shown in Figure 37. (c) R267 decorrelation stretch image. (d)L256 color composite of the right side of Block Island and a small portion of the rover deck in the lowerleft. A large cavern is partially filled with sand and dust. (e) L257 decorrelation stretch with locations ofsome surfaces where spectra were extracted and shown in Figure 37. (f) R267 decorrelation stretch image.
WEITZ ET AL.: ROCK FRAGMENTS AT MERIDIANI PLANUM E00F10E00F10
23 of 29

have distinct spectral parameters. Two spectra extractedfrom Barberton have different 934/1009 nm ratios and 482to 673 nm slopes, suggesting mineralogic heterogeneitieswithin individual rock fragments. As noted previously, thetwo spectra differ significantly in the longest wavelengthswith Barberton 1 showing a downturn between 934 to 1009nm whereas Barberton 2 has an upturn. The other stonymeteorites plot closer to Barberton 1 with a high 934/1009nm ratio, suggesting that Barberton 2 may be anomalous.Because the 535 nm band depth is similar for both Bar-berton locations and slightly lower than the other stonymeteorites, dust contamination may not be the cause of thespectral variations on Barberton. Relative to all the otherrock fragments, the stony meteorites lie in the middle for allspectral parameters.[57] Bounce Rock, an impact ejecta fragment dominated
by basalt, has the lowest 754 to 1009 nm and 754 to 864 nmslopes and highest 803/904 nm ratio relative to all otherunits at the Meridiani Planum landing site. Pancam spectrasupport a basaltic composition and the spectral parametersdifferentiate Bounce Rock from all other rock fragmentsseen at the landing site thus far (through sol 2004). The rockfragments Lion Stone and Russett have spectral propertiescharacteristic of outcrop exposures, although they havehigher 904 nm band depths but lower 482 to 673 nm and754 70 864 nm slopes and lower 934/1009 nm ratioscompared to outcrop exposures. These differences couldresult from thinner weathering rinds on the two rocks rela-
tive to the outcrops. This hypothesis is consistent with workby Farrand et al. [2008] that distinguishes flatter buff‐colored oxidized outcrops with weathering rinds (HFSspectral class) from steeper purple‐colored less oxidizedoutcrops (LFS spectral class).[58] Arkansas, Perseverance, Antistasi, Tilos, Kos, and
Rhodes are also believed to be impact ejecta fragments withunknown origins (Table 3). Arkansas and Perseverance arespectrally similar with minor differences in the 904 nm banddepth and 934/1009 nm ratio. Kos, Tilos, and Rhodescluster together in all four spectral parameter plots. Relativeto Arkansas and Perseverance, they have higher 535 nmband depths, 482 to 673 nm slopes, and 753/432 ratios.These higher values could reflect thicker dust coatingsbecause the values plotted for Arkansas and Perseveranceare from the sides of the rocks whereas the spectra extractedfrom the smaller Kos, Tilos, and Rhodes pebbles coversboth upper and side surfaces. Antistasi appears to have themost unique spectral parameters relative to these five otherimpact fragments. It has spectral parameter values close toBounce Rock, including a low 535 nm band depth, high904 nm band depth, high 803/904 nm ratio, and low 754to 1009 nm slope. One possibility is that the spectra wereextracted in a region that had pyroxene and/or olivinecrystals, consistent with a larger basaltic contribution mea-sured by MB [Fleischer et al., 2010b]. Based upon thespectral characteristics, Antistasi mineralogy appears to bedistinct from the other impact fragments, consistent with
Figure 36. MI mosaics acquired along the left side of Block Island. The L257 decorrelation stretchimage has been overlain to show color. Arrows identify raised linear features characteristic of Widman-stätten pattern. The purple areas correspond to lobate smooth regions within the green matrix.
WEITZ ET AL.: ROCK FRAGMENTS AT MERIDIANI PLANUM E00F10E00F10
24 of 29
APXS data that distinguish the rock from other Arkansasgroup cobbles [Fleischer et al., 2010b].
5. Conclusions
[59] Our results suggest that examination of rock frag-ments using multispectral reflectance data can prove usefulfor an initial assessment of rock classification and provideguidance on whether a rock should receive additionalmeasurements due to spectral and/or physical properties thatare deemed of high scientific interest. Generally, rockfragments that appear dark toned and bluish in Pancam lefteye false color color composites are differentiated fromoutcrop rocks and likely to be considered for furtherinvestigation. Physical properties of these rock fragments,including sphericity, roundness, and evidence for pits, can
also be explored with Pancam images. However, in situexamination to determine mineralogy and small‐scale tex-tural information is critical for a definitive composition andorigin.[60] The results from our investigation of 15 rock frag-
ments at the Opportunity landing site reveal that the com-plexities of viewing and lighting geometry, combined withdust coatings, possible weathering rinds, residual fushioncrusts in the case of meteoritic fragments, and sampling size,all affect the ability to adequately characterize the mineralogyof the rocks using Pancam’s eleven visible/near‐infraredbands. Most of the rock fragments have no diagnostic visible/near‐infrared signatures in the Pancam data that would allowus to confidently determine the mineralogy. Bounce Rock isan exception because its spectrum has a pyroxene absorptionthat supports a basaltic composition unlike any other rock
Figure 37. Block Island spectra. The purple areas have greater 535 nm band depths but flatter NIRslopes relative to the green regions.
Table 2. Description of Spectral Parameters Used in This Study
Parameter Description Characteristic
535 nm band depth 1–[R535/((0.57*R434)+(0.43*R673))] Degree of oxidation482 to 673 nm slope (R673–R482)/(673–482) Degree of oxidation904 nm band depth 1–[R904/((0.51*R803)+(0.49*R1009))] Strength of NIR absorption803/904 nm ratio R803/R904 Strength of NIR absorption754 to 864 nm slope (R754–R864)/(864–754) Strength and position of NIR absorption754 to 1009 nm slope (R754–R1009)/(1009–754) Strength and position of NIR absorption753/432 nm ratio R753/R432 Red to blue ratio934/1009 nm ratio R934/R1009 Hematite
WEITZ ET AL.: ROCK FRAGMENTS AT MERIDIANI PLANUM E00F10E00F10
25 of 29

Figure 38. Spectral parameter plots for rock fragments and other geologic units at Meridiani Planum(see text for a discussion).
WEITZ ET AL.: ROCK FRAGMENTS AT MERIDIANI PLANUM E00F10E00F10
26 of 29
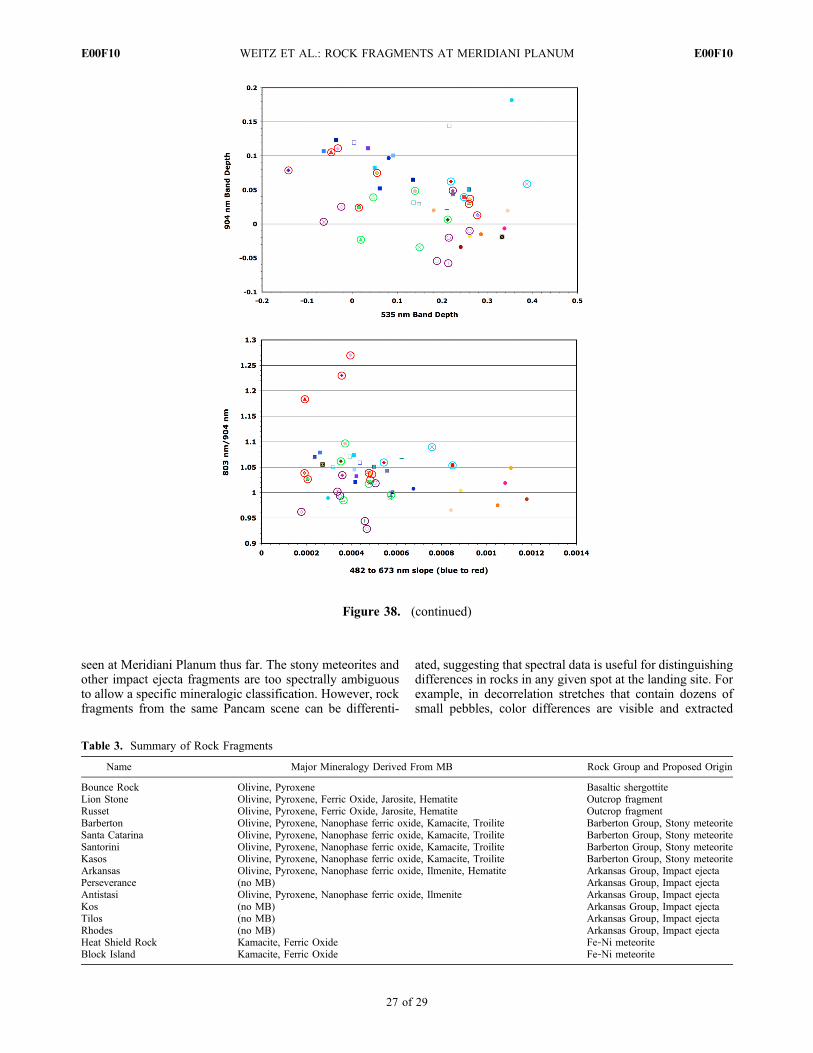
seen at Meridiani Planum thus far. The stony meteorites andother impact ejecta fragments are too spectrally ambiguousto allow a specific mineralogic classification. However, rockfragments from the same Pancam scene can be differenti-
ated, suggesting that spectral data is useful for distinguishingdifferences in rocks in any given spot at the landing site. Forexample, in decorrelation stretches that contain dozens ofsmall pebbles, color differences are visible and extracted
Table 3. Summary of Rock Fragments
Name Major Mineralogy Derived From MB Rock Group and Proposed Origin
Bounce Rock Olivine, Pyroxene Basaltic shergottiteLion Stone Olivine, Pyroxene, Ferric Oxide, Jarosite, Hematite Outcrop fragmentRusset Olivine, Pyroxene, Ferric Oxide, Jarosite, Hematite Outcrop fragmentBarberton Olivine, Pyroxene, Nanophase ferric oxide, Kamacite, Troilite Barberton Group, Stony meteoriteSanta Catarina Olivine, Pyroxene, Nanophase ferric oxide, Kamacite, Troilite Barberton Group, Stony meteoriteSantorini Olivine, Pyroxene, Nanophase ferric oxide, Kamacite, Troilite Barberton Group, Stony meteoriteKasos Olivine, Pyroxene, Nanophase ferric oxide, Kamacite, Troilite Barberton Group, Stony meteoriteArkansas Olivine, Pyroxene, Nanophase ferric oxide, Ilmenite, Hematite Arkansas Group, Impact ejectaPerseverance (no MB) Arkansas Group, Impact ejectaAntistasi Olivine, Pyroxene, Nanophase ferric oxide, Ilmenite Arkansas Group, Impact ejectaKos (no MB) Arkansas Group, Impact ejectaTilos (no MB) Arkansas Group, Impact ejectaRhodes (no MB) Arkansas Group, Impact ejectaHeat Shield Rock Kamacite, Ferric Oxide Fe‐Ni meteoriteBlock Island Kamacite, Ferric Oxide Fe‐Ni meteorite
Figure 38. (continued)
WEITZ ET AL.: ROCK FRAGMENTS AT MERIDIANI PLANUM E00F10E00F10
27 of 29

spectra suggest that minor compositional variations mayexist, such as more hematite in some pebbles. Unfortunately,the pebbles were too small for in situ measurements but theydo indicate that numerous other rock assemblages may existat the landing site but have not yet been geochemicallyanalyzed. Hopefully, Opportunity will continue to makeadditional measurements on rock fragments at the site inorder to further our understanding of the geologic processesthat have operated and continue to occur in this region.
[61] Acknowledgments. We thank Onur Karahayit and Ron Li forproducing the Opportunity traverse map and Ella Mae for providing severalof the MI‐Pancam color merges. Steve Ruff, Larry Soderblom, and ananonymous reviewer provided comments that improved the quality of thispaper. We acknowledge the outstanding efforts of everyone on the JPLengineering and MER Athena science teams. This work was supportedthrough NASA MDAP grant NNG05GB16G.
ReferencesAshley, J. W., M. P. Golombek, C. Schröder, I. Fleischer, T. J. McCoy, P. R.Christensen, and T. J. Parker, and the Athena Science Team (2010), Mor-phologic evidence for mechanical and chemical weathering of three newIron‐Nickel meteorites on Mars: Process insights for Meridiani Planum,Lunar Planet. Sci., XLI, Abstract 2208.
Bell, J. F., III, et al. (2003), Mars Exploration Rover Athena PanoramicCamera (Pancam) investigation, J. Geophys. Res., 108(E12), 8063,doi:10.1029/2003JE002070.
Bell, J. F., III, et al. (2004), Pancam multispectral imaging results from theOpportunity Rover at Meridiani Planum, Science, 306, 1703–1709,doi:10.1126/science.1105245.
Bell, J. F., III, J. Joseph, J. N. Sohl‐Dickstein, H. M. Arneson, M. J. Johnson,M. T. Lemmon, and D. Savransky (2006), In‐flight calibration and perfor-mance of theMars Exploration Rover Panoramic Camera (Pancam) instru-ments, J. Geophys. Res., 111, E02S03, doi:10.1029/2005JE002444.
Christensen, P. R., et al. (2004), Mineralogy at Meridiani Planum from theMini‐TES experiment on the Opportunity Rover, Science, 306(5702),1733–1739, doi:10.1126/science.1104909.
Clark, B. C., et al. (2005), Chemistry and mineralogy of outcrops at Meridia-ni Planum, Earth Planet. Sci. Lett., 240, 73–94, doi:10.1016/j.epsl.2005.09.040.
Farrand, W. H., J. F. Bell III, J. R. Johnson, S. W. Squyres, J. Soderblom,and D. W. Ming (2006), Spectral variability among rocks in visible andnear infrared multispectral Pancam data collected at Gusev Crater: Exam-inations using spectral mixture analysis and related techniques, J. Geo-phys. Res., 111, E02S15, doi:10.1029/2005JE002495.
Farrand, W. H., et al. (2007), Visible and near‐infrared multispectral anal-ysis of rocks at Meridiani Planum, Mars by the Mars Exploration RoverOppor tuni ty , J. Geophys. Res. , 112 , E06S02, doi :10.1029/2006JE002773.
Farrand, W. H., J. F. Bell III, J. R. Johnson, R. E. Arvidson, L. S. Crumpler,J. A. Hurowitz, and C. Schröder (2008), Rock spectral classes observed bythe Spirit rover’s Pancam on the Gusev crater plains and in the ColumbiaHills, J. Geophys. Res., 113, E12S38, doi:10.1029/2008JE003237.
Fleischer, I., G. Klingelhöfer, C. Schröder, D. W. Mittlefehldt, R. V. Morris,M. Golombek, and J. W. Ashley (2010a), In situ investigation of iron me-teorites atMeridiani Planum,Mars, Lunar Planet. Sci.,XLI, Abstract 1791.
Fleischer, I., et al. (2010b), Mineralogy and chemistry of cobbles at Meri-diani Planum, Mars, J. Geophys. Res., 115, E00F05, doi:10.1029/2010JE003621.
Gillespie, A. R., A. B. Kahle, andR. E.Walker (1986), Color enhancement ofhighly correlated images: 1. Decorrelation and HIS contrast stretches,Remote Sens. Environ., 20, 209–235, doi:10.1016/0034-4257(86)90044-1.
Gorevan, S. P., et al. (2003), Rock Abrasion Tool: Mars Exploration Rovermission, J. Geophys. Res., 108(E12), 8068, doi:10.1029/2003JE002061.
Grotzinger, J. P., et al. (2005), Stratigraphy, sedimentology and deposi-tional environment of the Burns formation, Meridiani Planum, Mars,Earth Planet. Sci. Lett., 240, 11–72, doi:10.1016/j.epsl.2005.09.039.
Herkenhoff, K. E., et al. (2003), Athena Microscopic Imager investigation,J. Geophys. Res., 108(E12), 8065, doi:10.1029/2003JE002076.
Herkenhoff, K. E., et al. (2008), Surface processes recorded by rocks andsoils onMeridiani Planum,Mars: Microscopic Imager observations duringOpportunity’s first three extended missions, J. Geophys. Res., 113,E12S32, doi:10.1029/2008JE003100.
Johnson, J. R., et al. (2006), Spectrophotometric properties of materialsobserved by Pancam on the Mars Exploration Rovers: 1. Spirit, J. Geo-phys. Res., 111, E02S14, doi:10.1029/2005JE002494.
Johnson, J. R., K. E. Herkenhoff, J. F. Bell III, W. H. Farrand, J. Ashley,C. Weitz, and S. W. Squyres (2010), Pancam visible/near‐infrared spec-tra of large Fe‐Ni meteorites at Meridiani Planum, Mars, Lunar Planet.Sci., XLI, Abstract 1974.
Jolliff, B. L., W. H. Farrand, J. R. Johnson, C. Schröder, C. M. Weitz, andthe Athena Science Team (2006), Origin of rocks and cobbles on theMeridiani Plains as seen by Opportunity, Lunar Planet. Sci., XXXVII,Abstract 2401.
Klingelhöfer, G., et al. (2003), Athena MIMOS II Mössbauer spectrometerinvestigation, J. Geophys. Res., 108(E12), 8067, doi:10.1029/2003JE002138.
Klingelhöfer, G., et al. (2004), Jarosite and hematite at Meridiani Planumfrom Opportunity’s Mössbauer spectrometer, Science, 306, 1740–1745,doi:10.1126/science.1104653.
Knauth, L. P., D. M. Burt, and K. H. Wohletz (2005), Impact origin of sedi-ments at the Opportunity landing site on Mars, Nature, 438, 1123–1128,doi:10.1038/nature04383.
McCollom, T. M., and B. M. Hynek (2005), A volcanic environment forbedrock diagenesis at Meridiani Planum on Mars, Nature, 438, 1129–1131, doi:10.1038/nature04390.
McLennan, S. M., et al. (2005), Provenance and diagenesis of the evapo-rite‐bearing Burns formation, Meridiani Planum, Mars, Earth Planet.Sci. Lett., 240, doi:10.1016/j.epsl.2005.09.041.
Morris, R. V., et al. (2006), Mossbauer mineralogy of rock, soil, and dust atMeridiani Planum, Mars: Opportunity’s journey across sulfate‐rich out-crop, basaltic sand and dust, and hematite lag deposits, J. Geophys.Res., 111, E12S15, doi:10.1029/2006JE002791.
Reid, R. J., et al. (1999), Imager for Mars Pathfinder (IMP) image calibra-tion, J. Geophys. Res., 104, 8907–8926.
Rieder, R., R. Gellert, J. Brückner, G. Klingelhöfer, G. Dreibus, A. Yen,and S. W. Squyres (2003), The new Athena Alpha Particle X‐Ray Spec-trometer for the Mars Exploration Rovers, J. Geophys. Res., 108(E12),8066, doi:10.1029/2003JE002150.
Rieder, R., et al. (2004), Chemistry of rocks and soils at Meridiani Planumfrom the Alpha Particle X‐ray Spectrometer, Science, 306, 1746–1749,doi:10.1126/science.1104358.
Ruff, S. W., P. R. Christensen, T. D. Glotch, D. L. Blaney, J. E. Moersch,and M. B. Wyatt (2008), The mineralogy of Gusev Crater and MeridianiPlanum derived from the Miniature Thermal Emission Spectrometers onthe Spirit and Opportunity rovers, in The Martian Surface: Composi-tion, Mineralogy, and Physical Properties, edited by J. F. Bell III,pp. 315–338, Cambridge Univ. Press, New York, doi:10.1017/CBO9780511536076.015.
Schröder, C., et al. (2008), Meteorites on Mars observed with the MarsExploration Rovers, J. Geophys. Res., 113, E06S22, doi:10.1029/2007JE002990.
Schröder, C., et al. (2010), Properties and distribution of paired stony mete-orite candidate rocks at Meridiani Planum, Mars, J. Geophys. Res.,doi:10.1029/2010JE003616, in press.
Squyres, S. W., et al. (2004), The Opportunity rover’s Athena Scienceinvestigation at Meridiani Planum, Mars, Science, 306, 1698–1703,doi:10.1126/science.1106171.
Squyres, S. W., et al. (2006), Overview of the Opportunity Mars Explora-tion Rover Mission to Meridiani Planum: Eagle Crater to Purgatory Rip-ple, J. Geophys. Res., 111, E12S12, doi:10.1029/2006JE002771.
Weitz, C.M., R. C. Anderson, J. F. Bell III, W. H. Farrand, K. E. Herkenhoff,J. R. Johnson, B. L. Jolliff, R. V. Morris, S. W. Squyres, and R. J. Sullivan(2006), Soil grain analyses at Meridiani Planum, Mars, J. Geophys. Res.,111, E12S04, doi:10.1029/2005JE002541.
Yingst, R. A., L. Crumpler, W. H. Farrand, R. Li, N. A. Cabrol, and L. D.Neakrase (2008), Morphology and texture of particles along the Spiritrover traverse from sol 450 to sol 745, J. Geophys. Res., 113, E12S41,doi:10.1029/2008JE003179.
Zipfel, J., et al. (2010), Bounce Rock‐A Shergottite‐like Basalt Encoun-tered at Meridiani Planum, Mars, Meteorit. Planet. Sci., in press.
J. Ashley, Mars Space Flight Facility, Arizona State University, Tempe,AZ 85287, USA.J. Bell, Department of Astronomy, Cornell University, 428 Space
Sciences Bldg., Ithaca, NY 14853, USA.W. Calvin, Department of Geological Science and Engineering,
University of Nevada, Reno, NV 89557, USA.B. Cohen, NASA Marshall Space Flight Center, VP62, 320 Sparkman
Dr., Huntsville, AL 35805, USA.W. H. Farrand, Space Science Institute, 4750 Walnut St., Ste. 205,
Boulder, CO 80301, USA.
WEITZ ET AL.: ROCK FRAGMENTS AT MERIDIANI PLANUM E00F10E00F10
28 of 29

I. Fleischer and G. Klingelhöfer, Institut für Anorganische Chemie undAnalytische Chemie, Johannes Gutenberg‐Universität, Staudinger Weg 9,D‐55128 Mainz, Germany.R. Gellert, Department of Physics, University of Guelph, Guelph, ON
N1G 2W1, Canada.K. E. Herkenhoff and J. R. Johnson, Astrogeology Science Center, U.S.
Geological Survey, 2255 N. Gemini Dr., Flagstaff, AZ 86001, USA.
B. Jolliff, Department of Earth and Planetary Sciences, WashingtonUniversity in St. Louis, One Brookings Drive, St. Louis, MO 63130, USA.M. Rutherford, Department of Geological Sciences, Brown University,
Providence, RI 02912, USA.C. Schröder, Center for Applied Geoscience, Eberhard Karls University
of Tübingen, Sigwartstr. 10, D‐72076 Tübingen, Germany.C. M. Weitz and A. Yingst, Planetary Science Institute, 1700 East Fort
Lowell, Ste. 106, Tucson, AZ 85719, USA. ([email protected])
WEITZ ET AL.: ROCK FRAGMENTS AT MERIDIANI PLANUM E00F10E00F10
29 of 29