Embed Size (px)
Citation preview
National Report on Biochemical Indicators of Diet and Nutrition in the U.S. Population 1999-2002
Water-Soluble Vitamins & Related Biochemical Compounds
Folate and vitamin B12 belong to the group of water-soluble B vitamins that occur naturally in food. Leafy green vegetables (such as spinach and turnip greens), fruits (such as citrus fruits and juices), and dried beans and peas are all natural sources of folate. Folic acid is the synthetic form of folate found in supplements and added to fortified foods. Because of wide consumption of fortified foods in the United States, these products have become an important contributor of folic acid to the U.S. diet. Folate functions as a coenzyme in single-carbon transfers in the metabolism of nucleic and amino acids and is therefore especially important during periods of rapid cell division and growth, such as occurs during infancy and pregnancy.
Vitamin B12 (cobalamin) is found naturally in animal foods including fish, meat, poultry, eggs, milk, and milk products. For vegetarians, fortified breakfast cereals are a particularly valuable source of vitamin B12. Vitamin B12 functions as a coenzyme for a critical methyl transfer reaction that converts homocysteine to methionine and for a separate reaction that converts L-methylmalonyl-coenzyme A to succinyl-coenzyme A.
Homocysteine (Hcy) is an amino acid naturally found in the blood. Plasma Hcy concentrations are strongly influenced by diet as well as by genetic factors. Elevated concentrations are found in people whose folate, vitamin B12, or vitamin B6 status is suboptimal (Selhub 1993), and in people with impaired renal function (Wollensen 1999).
Methylmalonic acid (MMA) is a dicarboxylic acid naturally found in the blood. Plasma MMA concentrations are elevated when serum vitamin B12 concentrations are low or intermediate and are therefore a useful diagnostic test for confirming vitamin B12 deficiency (Baik 1999).
A chronic dietary deficiency of either folate or vitamin B12 causes macrocytic anemia, although strict dietary deficiencies are rare. Certain drugs (e.g., alcohol, methotrexate, anticonvulsants, sulfa drugs) may interfere with the absorption or utilization of folate, and disorders of the small bowel that limit absorption (e.g., Crohn’s disease, jejunal bypass
1 Water-Soluble Vitamins & Related Biochemical Compounds 13
surgery) can cause folate deficiency (Halsted 1990). Most people who develop a vitamin B12 deficiency have an underlying stomach or intestinal disorder that limits the absorption of vitamin B12. Subtly reduced cognitive function resulting from early vitamin B12 deficiency is sometimes the only symptom of these intestinal disorders. Severe vitamin B12 deficiency can cause permanent nerve damage and dementia. Hematologic signs, however, are not always present in vitamin B12 deficiency and hematologic signs and neurologic abnormalities can be inversely correlated (Baik 1999).
Clinical trials have shown that folic acid supplementation effectively reduces the number of neural tube birth defects (NTDs) (Czeizel 1992; MRC Vitamin Study Research Group 1991). Thus, CDC and the U.S. Public Health Service have recommended that every woman who could become pregnant consume at least 400 micrograms (µg) of folic acid each day (U.S. Centers for Disease Control and Prevention 1992). Since 1998, the U.S. Food and Drug Administration (FDA) has required the addition of folic acid to enriched breads, cereals, flours, corn meals, pastas, rice, and other grain products (U.S. Food and Drug Administration 1996a). Recent observational studies have suggested potential benefits of the U.S. folic acid fortification, such as reduced NTD rates (Williams 2005), decreased prevalence of inadequate serum and RBC folate concentrations (Pfeiffer 2005), and declines in the incidence of stroke (Yang 2006) and neuroblastoma (French 2003). Potential roles are currently being studied for 1) folate in altering the risks for heart disease and cancer, 2) vitamin B12 in modulating the risks for cognitive impairment, and 3) Hcy as a risk factor for or a marker of cardiovascular disease.
The recommended dietary allowance (RDA) for both men and women is 400 µg per day of dietary folate equivalents (DFEs). DFEs adjust for the nearly 50 percent lower bioavailability of dietary folate compared with the bioavailability of folic acid: 1 µg of dietary folate equivalent equals 0.6 µg of folic acid from fortified food or from a supplement taken on an empty stomach (Institute of Medicine 1998). The RDA for vitamin B12 for adults is 2.4 µg per day. Because as many as 10 to 30 percent of older people may be unable to absorb naturally occurring vitamin B12, it is advisable for people older than 50 years to meet their RDA mainly by consuming foods fortified with vitamin B12 or by taking a supplement containing vitamin B12. People with vitamin B12 deficiency caused by a lack of intrinsic factor or intestinal malabsorption require parenteral B12 treatment (Institute of Medicine 1998).
Excess folic acid may mask and potentially delay diagnosis of anemia among people with vitamin B12 deficiency resulting in increased risk for neurological damage. Consequently, the Institute of Medicine (1998) recommends that folic acid intake for adults (aged 19 years and older) not exceed 1000 µg per day. Because no data were available for children, the Institute of Medicine used the level for adults adjusted by weight: 300–800 µg per day, depending on the age group. Folate intake from food is not associated with any health risk.
Clinical laboratories typically use conventional units for measuring concentrations of folate (nanograms per milliliter [ng/mL]) and vitamin B12 (picograms [pg]/mL) but use international system (SI) units for Hcy and MMA (micromole per liter [µmol/L]).
National Report on Biochemical Indicators of Diet and Nutrition in the U.S. Population 1999-2002 14
Conversion factors to SI units are as follows: 1 ng/mL = 2.266 nanomol (nmol)/L for folate and 1 pg/mL = 0.738 picomol (pmol)/L for vitamin B12.
Several methods measure concentrations in blood of these B vitamins and related biochemical compounds. Because of significant differences in measuring folate concentrations, caution should be used when comparing other data sets with the tables in this report. Method-specific cut-off values and reference ranges should be used in medical diagnostics (Life Sciences Research Office 1994). Folate data presented in this report were generated using the BioRad Quantaphase II radioassay. This assay measures approximately 35 percent lower than the microbiologic gold-standard assay (Life Sciences Research Office 1994). As a result, for this report, the conventional cut-off values of less than 3 ng/mL for low serum folate concentrations and less than 140 ng/ mL for low red blood cell (RBC) folate concentrations (Life Sciences Research Office 1984) should be adjusted to less than 2 ng/mL and less than 95 ng/mL, respectively. Common methods for measuring serum vitamin B12, plasma Hcy, and MMA generally produce comparable results. A widely used cutoff value for low serum vitamin B12 concentrations is 200 pg/mL (Gibson 1990). Generally used cut-off values for elevated concentrations of plasma Hcy and MMA are 13 µmol/L (Jacques 1999) and 0.37 µmol/L (Hølleland 1999), respectively.
For more information on B vitamins and related biochemical indicators, see the Institute of Medicine’s Dietary Reference Intake reports (Institute of Medicine 1998), fact sheets from the National Institutes of Health (NIH), Office of Dietary Supplements (http://ods.od.nih.gov/Health_Information/Information_About_Individual_Dietary_Supplements.aspx), as well as information from the American Society for Nutrition (http://jn.nutrition.org/ nutinfo/).
One national health objective for Healthy People 2010 is to increase the proportion of pregnancies for which RBC folate concentration is optimum by increasing the median RBC folate concentration to 220 ng/mL among women aged 15–44 years (objective 16.16b; U.S. Department of Health and Human Services 2000).
Monitoring the folate status of the U.S. population over time has been a priority since serum and RBC folate results from NHANES II (1976–1980) (Senti 1985) and NHANES III (1988–1994) (Wright 1998) suggested that the folate status of some population groups might be of public health concern. Vitamin B12 status of the U.S. population has been monitored since the second phase of NHANES III (1991–1994) (Wright 1998). In
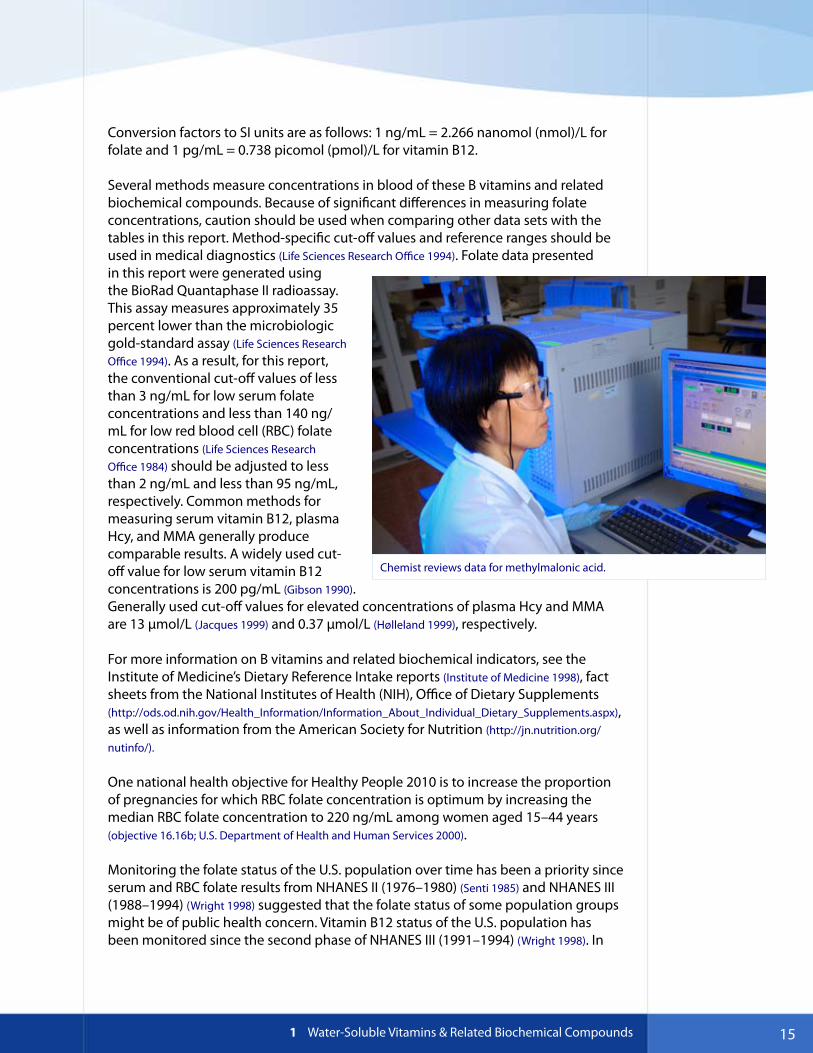
Chemist reviews data for methylmalonic acid.
1 Water-Soluble Vitamins & Related Biochemical Compounds 15
a recent (2007) study, Pfeiffer et al. showed that, in women of childbearing age, the introduction of folic acid fortification has dramatically lowered the prevalence of low serum (< 3 ng/mL) and RBC folate concentrations (< 140 ng/mL) from 21 percent and 38 percent, respectively, to less than 1 percent and 5 percent, respectively. Serum vitamin B12 concentrations, however, did not change appreciably. Circulating Hcy concentrations from prefortification to postfortification decreased by approximately 10 percent in a national sample of the U.S. population (Pfeiffer 2008).
Selected Observations and Highlights The following representative observations are taken from the tables of 1999–2002 data contained in this report. Statements about categorical differences between demographic groups noted below are based on non-overlapping confidence limits from univariate analysis without adjusting for demographic variables (e.g., age, sex, race/ethnicity) or other blood concentration determinants (e.g., dietary intake, supplement usage, smoking, BMI). A multivariate analysis may alter the size and statistical significance of these categorical differences. Furthermore, additional significant differences of smaller magnitude may be present despite their lack of mention here (e.g., if confidence limits slightly overlap or if differences are not statistically significant before covariate adjustment has occurred). For a selection of citations of descriptive NHANES papers related to these biochemical indicators of diet and nutrition, see Appendix E.
General Observations
• Serum and RBC folate concentrations show a U-shaped age pattern with higher concentrations in children and older people (≥ 60 years) than in young or middle-aged adults.
• Serum vitamin B12 concentrations first decline from childhood to middle-age, then stabilize. Plasma MMA concentrations are similar across all age groups, except that older people have higher concentrations.
• Plasma Hcy concentrations increase with age. • Women have higher serum and RBC folate concentrations than do men, and
men have higher plasma Hcy and MMA concentrations. • For serum and RBC folate, non-Hispanic whites have higher concentrations
than do Mexican Americans, who themselves have higher concentrations than do non-Hispanic blacks.
• Serum vitamin B12 concentrations are higher in non-Hispanic blacks than in the other two racial/ethnic groups, and plasma MMA concentrations are higher in non-Hispanic whites than in either Mexican Americans or in non-Hispanic blacks.
• Plasma Hcy concentrations are higher in non-Hispanic whites than in the other two racial/ethnic groups.
National Report on Biochemical Indicators of Diet and Nutrition in the U.S. Population 1999-2002 16
• Less than 5 percent of adolescent and adult women have low serum (< 2 ng/ mL) and RBC folate concentrations (< 95 ng/mL)–cut-off values indicative of inadequate folate status (based on 5th percentile).
• Approximately 5 percent of older people have moderately low concentrations of serum vitamin B12 (< 200 pg/mL) (based on 5th percentile), and over 5 percent of older people have elevated concentrations of plasma Hcy (> 13 µmol/L) and of MMA (> 0.37 µmol/L) (based on 95th percentile).
Highlights
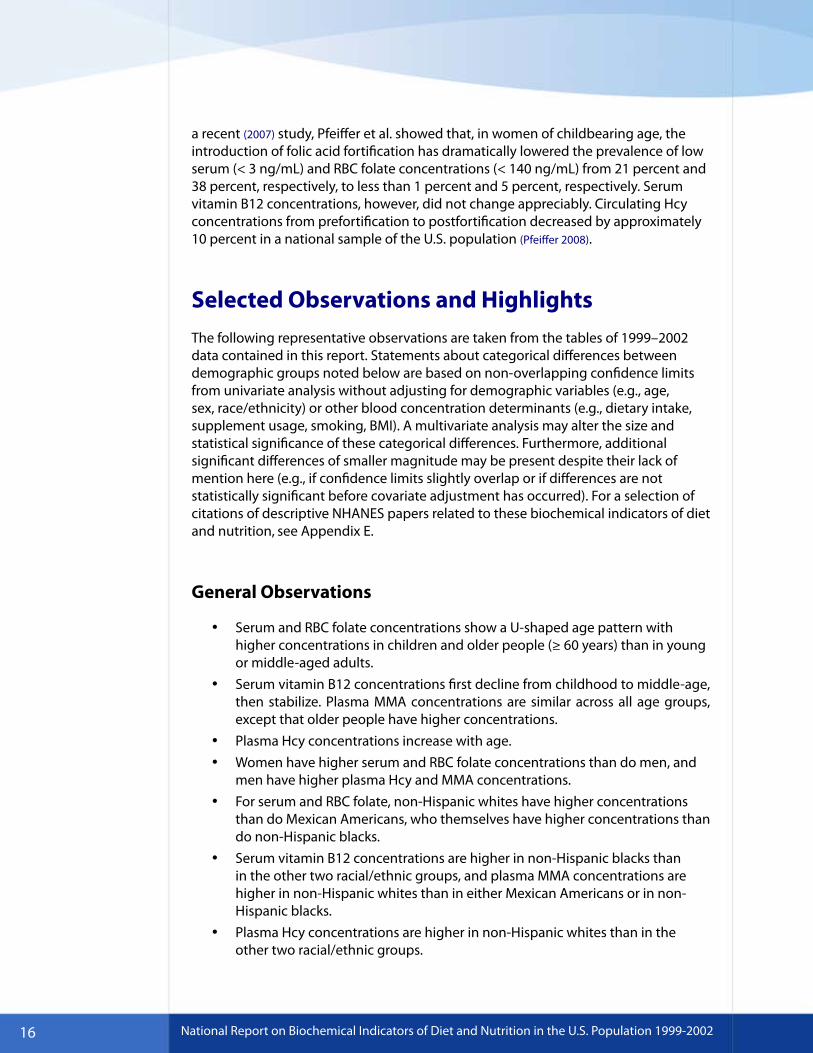
Since 1998, when fortification of enriched grains and cereal products with folic acid became mandatory, serum folate concentrations have more than doubled, and RBC folate concentrations have increased by about 50 percent in all population subgroups (Fig. 1.a). This greater than expected increase in blood concentrations was shown previously (Pfeiffer 2007). Underreporting of foods consumed, increased consumer selection of folate-rich foods as a result of health claims, and increasing availability of the number and types of nonstandardized folate-fortified foods (e.g., breakfast cereals) could be some of the reasons for the greater than expected increase in blood concentrations (U.S. Food and Drug Administration 1996b).
Figure 1.a.
Geometric mean concentrations (95 percent confidence intervals) of serum folate in the U.S. population, aged 3 years and older, and in population subgroups, National Health and Nutrition Examination Survey, 1988–2002. Data shown for NHANES 1988–1994 are not part of the tables displayed in this report but were analyzed separately to generate this figure.
1 Water-Soluble Vitamins & Related Biochemical Compounds 17
18 National Report on Biochemical Indicators of Diet and Nutrition in the U.S. Population 1999-2002
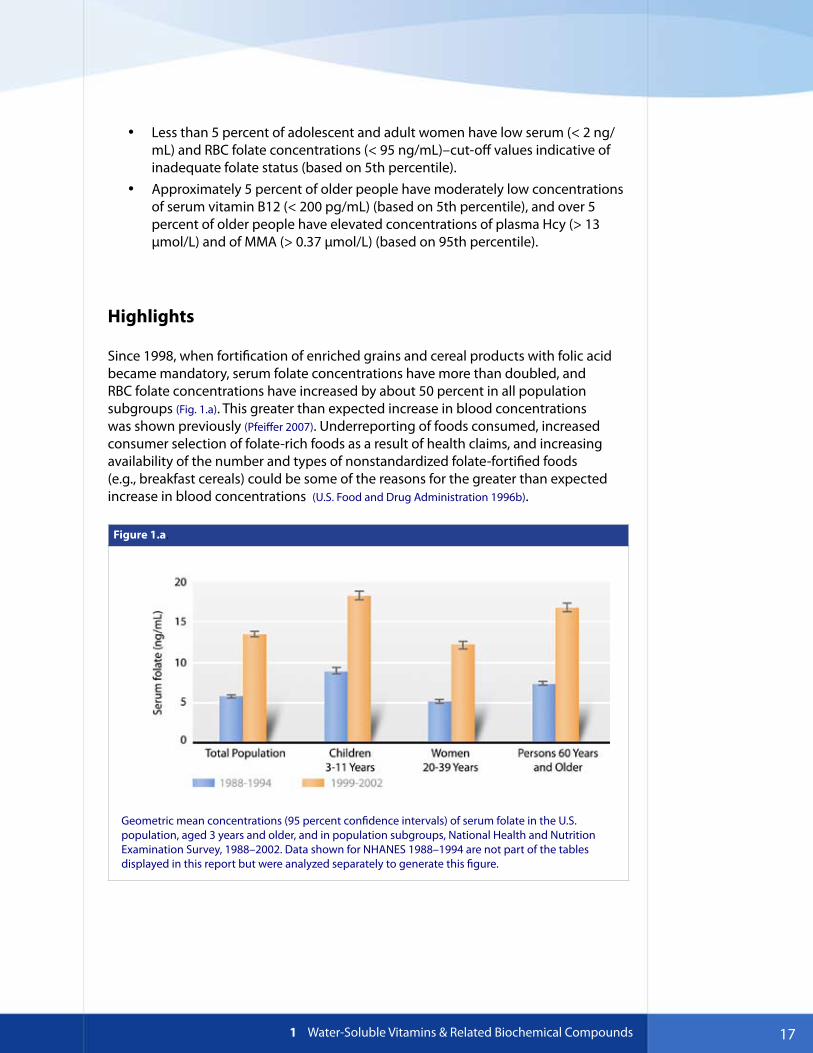
The Healthy People 2010 objective to increase the median RBC folate concentration in women to 220 ng/mL was achieved for Mexican-American and non-Hispanic white women aged 20–39 years: their median RBC folate concentrations were 250 ng/ mL and 278 ng/mL, respectively (Fig. 1.b). This objective was, however, not achieved for non-Hispanic black women (210 ng/mL) (Fig. 1.b). Interestingly, offspring of non-Hispanic black women have the lowest incidence of NTDs, whereas offspring of Mexican-American women have the highest NTD incidence (Williams 2005). These findings show that RBC folate concentrations alone do not account for differences in NTD rates among race/ethnic groups in the U.S. population.
Figure 1.b
Median concentrations (95 percent confidence intervals) of red blood cell (RBC) folate among 20–39 year-old women by race/ethnicity, National Health and Nutrition Examination Survey, 1999–2002.
191 Water-Soluble Vitamins & Related Biochemical Compounds
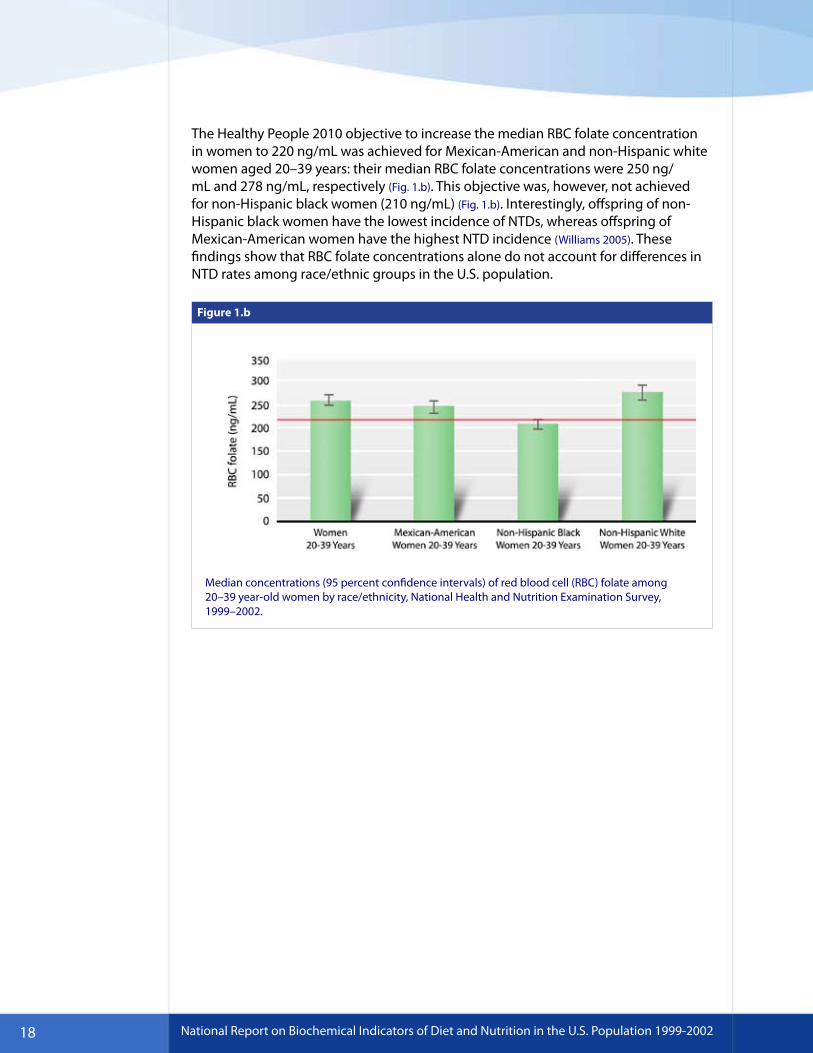
Although the majority (> 95 percent) of females have an adequate folate status, it is interesting to note that adolescents (aged 12–19 years) and adult women (aged 20–59 years), age groups for which good folate status is most critical, have lower serum folate concentrations than do females in other age groups (Fig. 1.c). Adolescent females aged 12–19 years also have lower RBC folate concentrations than do females in other age groups (Fig. 1.c).
Figure 1.c
Cross-sectional age pattern showing geometric mean concentrations (95 percent confidence intervals) of serum and red blood cell (RBC) folate in females, National Health and Nutrition Examination Survey, 1999–2002.
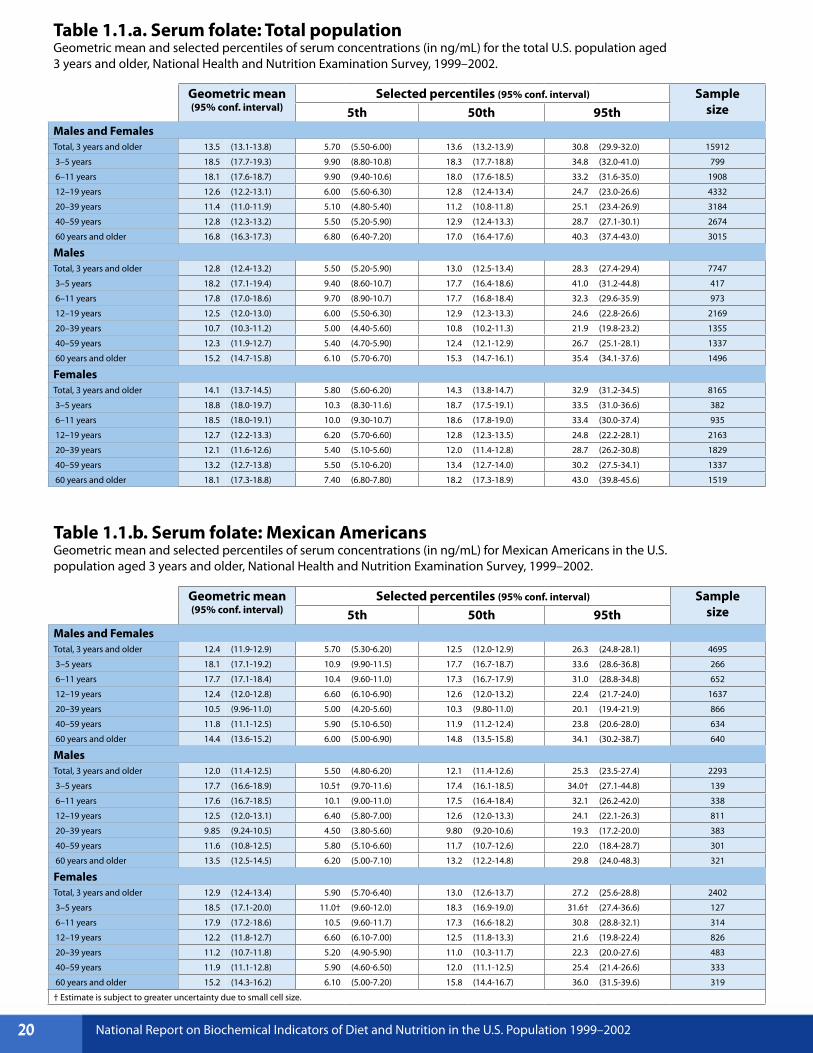
Table 1.1.a. Serum folate: Total population Geometric mean and selected percentiles of serum concentrations (in ng/mL) for the total U.S. population aged 3 years and older, National Health and Nutrition Examination Survey, 1999–2002.
Geometric mean (95% conf. interval)
Selected percentiles (95% conf. interval) Sample size5th 50th 95th
Males and Females Total, 3 years and older 13.5 (13.1-13.8) 5.70 (5.50-6.00) 13.6 (13.2-13.9) 30.8 (29.9-32.0) 15912
3–5 years 18.5 (17.7-19.3) 9.90 (8.80-10.8) 18.3 (17.7-18.8) 34.8 (32.0-41.0) 799
6–11 years 18.1 (17.6-18.7) 9.90 (9.40-10.6) 18.0 (17.6-18.5) 33.2 (31.6-35.0) 1908
12–19 years 12.6 (12.2-13.1) 6.00 (5.60-6.30) 12.8 (12.4-13.4) 24.7 (23.0-26.6) 4332
20–39 years 11.4 (11.0-11.9) 5.10 (4.80-5.40) 11.2 (10.8-11.8) 25.1 (23.4-26.9) 3184
40–59 years 12.8 (12.3-13.2) 5.50 (5.20-5.90) 12.9 (12.4-13.3) 28.7 (27.1-30.1) 2674
60 years and older 16.8 (16.3-17.3) 6.80 (6.40-7.20) 17.0 (16.4-17.6) 40.3 (37.4-43.0) 3015
Males Total, 3 years and older 12.8 (12.4-13.2) 5.50 (5.20-5.90) 13.0 (12.5-13.4) 28.3 (27.4-29.4) 7747
3–5 years 18.2 (17.1-19.4) 9.40 (8.60-10.7) 17.7 (16.4-18.6) 41.0 (31.2-44.8) 417
6–11 years 17.8 (17.0-18.6) 9.70 (8.90-10.7) 17.7 (16.8-18.4) 32.3 (29.6-35.9) 973
12–19 years 12.5 (12.0-13.0) 6.00 (5.50-6.30) 12.9 (12.3-13.3) 24.6 (22.8-26.6) 2169
20–39 years 10.7 (10.3-11.2) 5.00 (4.40-5.60) 10.8 (10.2-11.3) 21.9 (19.8-23.2) 1355
40–59 years 12.3 (11.9-12.7) 5.40 (4.70-5.90) 12.4 (12.1-12.9) 26.7 (25.1-28.1) 1337
60 years and older 15.2 (14.7-15.8) 6.10 (5.70-6.70) 15.3 (14.7-16.1) 35.4 (34.1-37.6) 1496
Females Total, 3 years and older 14.1 (13.7-14.5) 5.80 (5.60-6.20) 14.3 (13.8-14.7) 32.9 (31.2-34.5) 8165
3–5 years 18.8 (18.0-19.7) 10.3 (8.30-11.6) 18.7 (17.5-19.1) 33.5 (31.0-36.6) 382
6–11 years 18.5 (18.0-19.1) 10.0 (9.30-10.7) 18.6 (17.8-19.0) 33.4 (30.0-37.4) 935
12–19 years 12.7 (12.2-13.3) 6.20 (5.70-6.60) 12.8 (12.3-13.5) 24.8 (22.2-28.1) 2163
20–39 years 12.1 (11.6-12.6) 5.40 (5.10-5.60) 12.0 (11.4-12.8) 28.7 (26.2-30.8) 1829
40–59 years 13.2 (12.7-13.8) 5.50 (5.10-6.20) 13.4 (12.7-14.0) 30.2 (27.5-34.1) 1337
60 years and older 18.1 (17.3-18.8) 7.40 (6.80-7.80) 18.2 (17.3-18.9) 43.0 (39.8-45.6) 1519
Table 1.1.b. Serum folate: Mexican Americans Geometric mean and selected percentiles of serum concentrations (in ng/mL) for Mexican Americans in the U.S. population aged 3 years and older, National Health and Nutrition Examination Survey, 1999–2002.
Geometric mean (95% conf. interval)
Selected percentiles (95% conf. interval) Sample size5th 50th 95th
Males and Females Total, 3 years and older 12.4 (11.9-12.9) 5.70 (5.30-6.20) 12.5 (12.0-12.9) 26.3 (24.8-28.1) 4695
3–5 years 18.1 (17.1-19.2) 10.9 (9.90-11.5) 17.7 (16.7-18.7) 33.6 (28.6-36.8) 266
6–11 years 17.7 (17.1-18.4) 10.4 (9.60-11.0) 17.3 (16.7-17.9) 31.0 (28.8-34.8) 652
12–19 years 12.4 (12.0-12.8) 6.60 (6.10-6.90) 12.6 (12.0-13.2) 22.4 (21.7-24.0) 1637
20–39 years 10.5 (9.96-11.0) 5.00 (4.20-5.60) 10.3 (9.80-11.0) 20.1 (19.4-21.9) 866
40–59 years 11.8 (11.1-12.5) 5.90 (5.10-6.50) 11.9 (11.2-12.4) 23.8 (20.6-28.0) 634
60 years and older 14.4 (13.6-15.2) 6.00 (5.00-6.90) 14.8 (13.5-15.8) 34.1 (30.2-38.7) 640
Males Total, 3 years and older 12.0 (11.4-12.5) 5.50 (4.80-6.20) 12.1 (11.4-12.6) 25.3 (23.5-27.4) 2293
3–5 years 17.7 (16.6-18.9) 10.5† (9.70-11.6) 17.4 (16.1-18.5) 34.0† (27.1-44.8) 139
6–11 years 17.6 (16.7-18.5) 10.1 (9.00-11.0) 17.5 (16.4-18.4) 32.1 (26.2-42.0) 338
12–19 years 12.5 (12.0-13.1) 6.40 (5.80-7.00) 12.6 (12.0-13.3) 24.1 (22.1-26.3) 811
20–39 years 9.85 (9.24-10.5) 4.50 (3.80-5.60) 9.80 (9.20-10.6) 19.3 (17.2-20.0) 383
40–59 years 11.6 (10.8-12.5) 5.80 (5.10-6.60) 11.7 (10.7-12.6) 22.0 (18.4-28.7) 301
60 years and older 13.5 (12.5-14.5) 6.20 (5.00-7.10) 13.2 (12.2-14.8) 29.8 (24.0-48.3) 321
Females Total, 3 years and older 12.9 (12.4-13.4) 5.90 (5.70-6.40) 13.0 (12.6-13.7) 27.2 (25.6-28.8) 2402
3–5 years 18.5 (17.1-20.0) 11.0† (9.60-12.0) 18.3 (16.9-19.0) 31.6† (27.4-36.6) 127
6–11 years 17.9 (17.2-18.6) 10.5 (9.60-11.7) 17.3 (16.6-18.2) 30.8 (28.8-32.1) 314
12–19 years 12.2 (11.8-12.7) 6.60 (6.10-7.00) 12.5 (11.8-13.3) 21.6 (19.8-22.4) 826
20–39 years 11.2 (10.7-11.8) 5.20 (4.90-5.90) 11.0 (10.3-11.7) 22.3 (20.0-27.6) 483
40–59 years 11.9 (11.1-12.8) 5.90 (4.60-6.50) 12.0 (11.1-12.5) 25.4 (21.4-26.6) 333
60 years and older 15.2 (14.3-16.2) 6.10 (5.00-7.20) 15.8 (14.4-16.7) 36.0 (31.5-39.6) 319
† Estimate is subject to greater uncertainty due to small cell size.
National Report on Biochemical Indicators of Diet and Nutrition in the U.S. Population 1999–2002 20 20
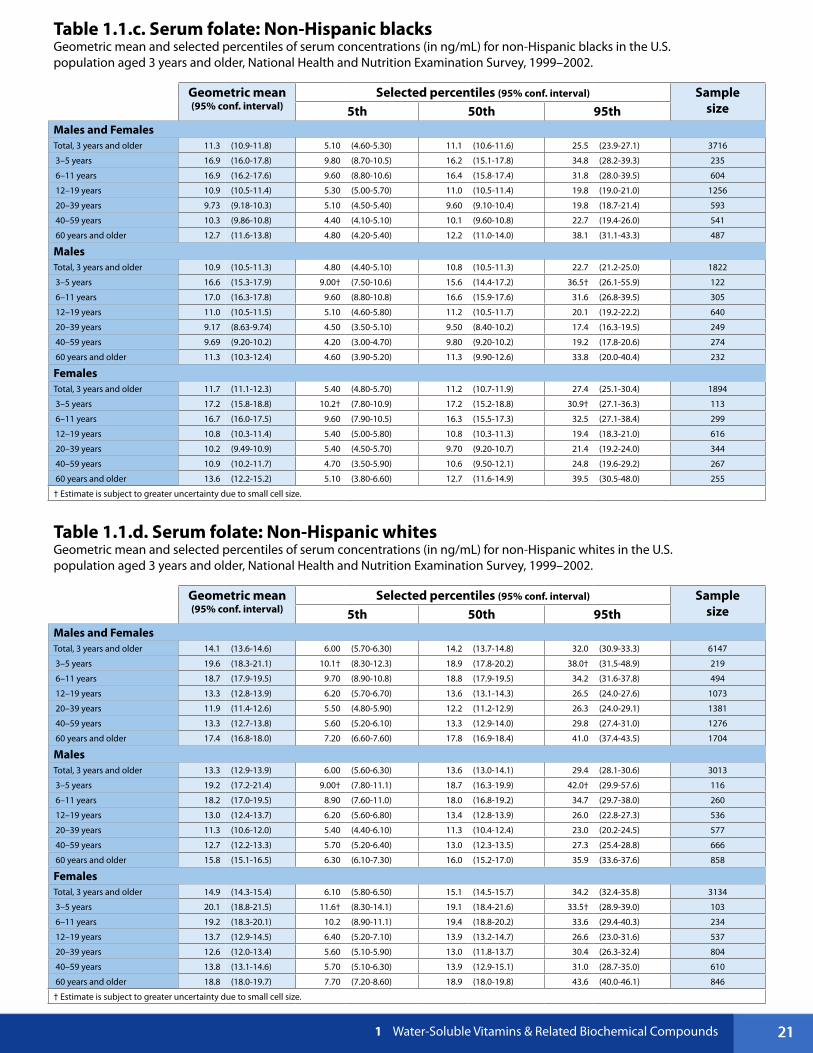
Table 1.1.c. Serum folate: Non-Hispanic blacks Geometric mean and selected percentiles of serum concentrations (in ng/mL) for non-Hispanic blacks in the U.S. population aged 3 years and older, National Health and Nutrition Examination Survey, 1999–2002.
Geometric mean (95% conf. interval)
Selected percentiles (95% conf. interval) Sample size5th 50th 95th
Males and Females Total, 3 years and older 11.3 (10.9-11.8) 5.10 (4.60-5.30) 11.1 (10.6-11.6) 25.5 (23.9-27.1) 3716
3–5 years 16.9 (16.0-17.8) 9.80 (8.70-10.5) 16.2 (15.1-17.8) 34.8 (28.2-39.3) 235
6–11 years 16.9 (16.2-17.6) 9.60 (8.80-10.6) 16.4 (15.8-17.4) 31.8 (28.0-39.5) 604
12–19 years 10.9 (10.5-11.4) 5.30 (5.00-5.70) 11.0 (10.5-11.4) 19.8 (19.0-21.0) 1256
20–39 years 9.73 (9.18-10.3) 5.10 (4.50-5.40) 9.60 (9.10-10.4) 19.8 (18.7-21.4) 593
40–59 years 10.3 (9.86-10.8) 4.40 (4.10-5.10) 10.1 (9.60-10.8) 22.7 (19.4-26.0) 541
60 years and older 12.7 (11.6-13.8) 4.80 (4.20-5.40) 12.2 (11.0-14.0) 38.1 (31.1-43.3) 487
Males Total, 3 years and older 10.9 (10.5-11.3) 4.80 (4.40-5.10) 10.8 (10.5-11.3) 22.7 (21.2-25.0) 1822
3–5 years 16.6 (15.3-17.9) 9.00† (7.50-10.6) 15.6 (14.4-17.2) 36.5† (26.1-55.9) 122
6–11 years 17.0 (16.3-17.8) 9.60 (8.80-10.8) 16.6 (15.9-17.6) 31.6 (26.8-39.5) 305
12–19 years 11.0 (10.5-11.5) 5.10 (4.60-5.80) 11.2 (10.5-11.7) 20.1 (19.2-22.2) 640
20–39 years 9.17 (8.63-9.74) 4.50 (3.50-5.10) 9.50 (8.40-10.2) 17.4 (16.3-19.5) 249
40–59 years 9.69 (9.20-10.2) 4.20 (3.00-4.70) 9.80 (9.20-10.2) 19.2 (17.8-20.6) 274
60 years and older 11.3 (10.3-12.4) 4.60 (3.90-5.20) 11.3 (9.90-12.6) 33.8 (20.0-40.4) 232
Females Total, 3 years and older 11.7 (11.1-12.3) 5.40 (4.80-5.70) 11.2 (10.7-11.9) 27.4 (25.1-30.4) 1894
3–5 years 17.2 (15.8-18.8) 10.2† (7.80-10.9) 17.2 (15.2-18.8) 30.9† (27.1-36.3) 113
6–11 years 16.7 (16.0-17.5) 9.60 (7.90-10.5) 16.3 (15.5-17.3) 32.5 (27.1-38.4) 299
12–19 years 10.8 (10.3-11.4) 5.40 (5.00-5.80) 10.8 (10.3-11.3) 19.4 (18.3-21.0) 616
20–39 years 10.2 (9.49-10.9) 5.40 (4.50-5.70) 9.70 (9.20-10.7) 21.4 (19.2-24.0) 344
40–59 years 10.9 (10.2-11.7) 4.70 (3.50-5.90) 10.6 (9.50-12.1) 24.8 (19.6-29.2) 267
60 years and older 13.6 (12.2-15.2) 5.10 (3.80-6.60) 12.7 (11.6-14.9) 39.5 (30.5-48.0) 255
† Estimate is subject to greater uncertainty due to small cell size.
Table 1.1.d. Serum folate: Non-Hispanic whites Geometric mean and selected percentiles of serum concentrations (in ng/mL) for non-Hispanic whites in the U.S. population aged 3 years and older, National Health and Nutrition Examination Survey, 1999–2002.
Geometric mean (95% conf. interval)
Selected percentiles (95% conf. interval) Sample size5th 50th 95th
Males and Females Total, 3 years and older 14.1 (13.6-14.6) 6.00 (5.70-6.30) 14.2 (13.7-14.8) 32.0 (30.9-33.3) 6147
3–5 years 19.6 (18.3-21.1) 10.1† (8.30-12.3) 18.9 (17.8-20.2) 38.0† (31.5-48.9) 219
6–11 years 18.7 (17.9-19.5) 9.70 (8.90-10.8) 18.8 (17.9-19.5) 34.2 (31.6-37.8) 494
12–19 years 13.3 (12.8-13.9) 6.20 (5.70-6.70) 13.6 (13.1-14.3) 26.5 (24.0-27.6) 1073
20–39 years 11.9 (11.4-12.6) 5.50 (4.80-5.90) 12.2 (11.2-12.9) 26.3 (24.0-29.1) 1381
40–59 years 13.3 (12.7-13.8) 5.60 (5.20-6.10) 13.3 (12.9-14.0) 29.8 (27.4-31.0) 1276
60 years and older 17.4 (16.8-18.0) 7.20 (6.60-7.60) 17.8 (16.9-18.4) 41.0 (37.4-43.5) 1704
Males Total, 3 years and older 13.3 (12.9-13.9) 6.00 (5.60-6.30) 13.6 (13.0-14.1) 29.4 (28.1-30.6) 3013
3–5 years 19.2 (17.2-21.4) 9.00† (7.80-11.1) 18.7 (16.3-19.9) 42.0† (29.9-57.6) 116
6–11 years 18.2 (17.0-19.5) 8.90 (7.60-11.0) 18.0 (16.8-19.2) 34.7 (29.7-38.0) 260
12–19 years 13.0 (12.4-13.7) 6.20 (5.60-6.80) 13.4 (12.8-13.9) 26.0 (22.8-27.3) 536
20–39 years 11.3 (10.6-12.0) 5.40 (4.40-6.10) 11.3 (10.4-12.4) 23.0 (20.2-24.5) 577
40–59 years 12.7 (12.2-13.3) 5.70 (5.20-6.40) 13.0 (12.3-13.5) 27.3 (25.4-28.8) 666
60 years and older 15.8 (15.1-16.5) 6.30 (6.10-7.30) 16.0 (15.2-17.0) 35.9 (33.6-37.6) 858
Females Total, 3 years and older 14.9 (14.3-15.4) 6.10 (5.80-6.50) 15.1 (14.5-15.7) 34.2 (32.4-35.8) 3134
3–5 years 20.1 (18.8-21.5) 11.6† (8.30-14.1) 19.1 (18.4-21.6) 33.5† (28.9-39.0) 103
6–11 years 19.2 (18.3-20.1) 10.2 (8.90-11.1) 19.4 (18.8-20.2) 33.6 (29.4-40.3) 234
12–19 years 13.7 (12.9-14.5) 6.40 (5.20-7.10) 13.9 (13.2-14.7) 26.6 (23.0-31.6) 537
20–39 years 12.6 (12.0-13.4) 5.60 (5.10-5.90) 13.0 (11.8-13.7) 30.4 (26.3-32.4) 804
40–59 years 13.8 (13.1-14.6) 5.70 (5.10-6.30) 13.9 (12.9-15.1) 31.0 (28.7-35.0) 610
60 years and older 18.8 (18.0-19.7) 7.70 (7.20-8.60) 18.9 (18.0-19.8) 43.6 (40.0-46.1) 846
† Estimate is subject to greater uncertainty due to small cell size.
1 Water-Soluble Vitamins & Related Biochemical Compounds 21 21
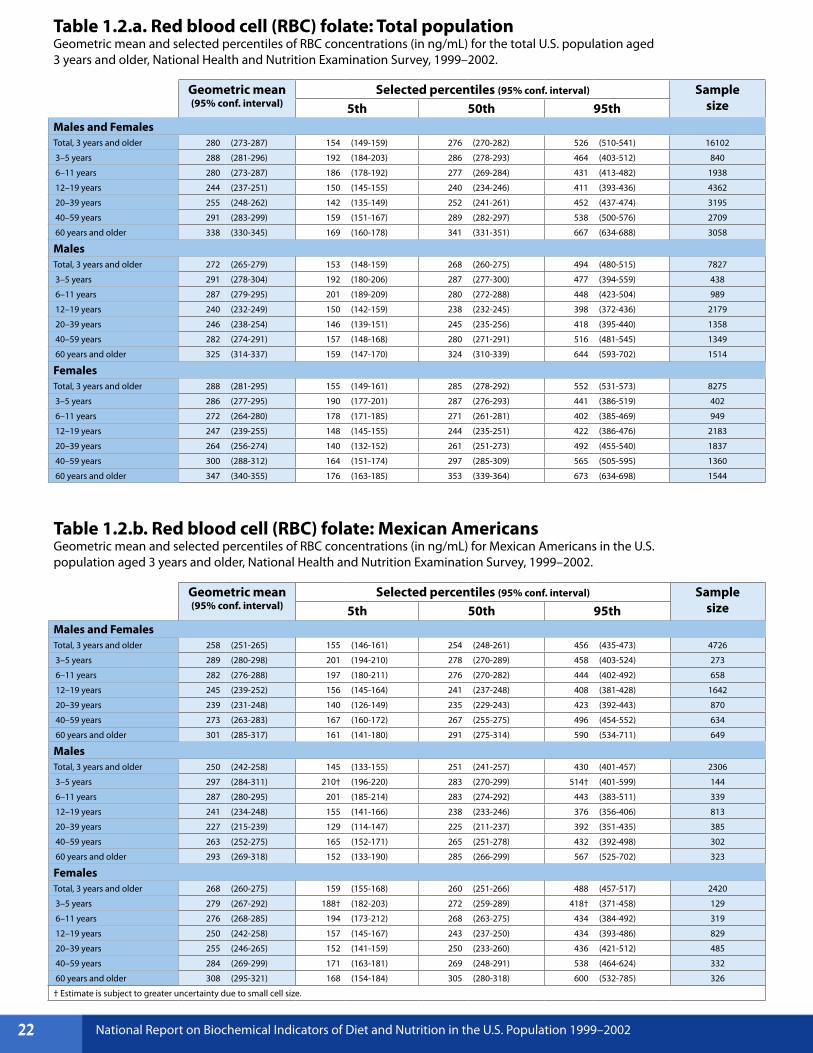
Table 1.2.a. Red blood cell (RBC) folate: Total population Geometric mean and selected percentiles of RBC concentrations (in ng/mL) for the total U.S. population aged 3 years and older, National Health and Nutrition Examination Survey, 1999–2002.
Geometric mean (95% conf. interval)
Selected percentiles (95% conf. interval) Sample size5th 50th 95th
Males and Females Total, 3 years and older 280 (273-287) 154 (149-159) 276 (270-282) 526 (510-541) 16102
3–5 years 288 (281-296) 192 (184-203) 286 (278-293) 464 (403-512) 840
6–11 years 280 (273-287) 186 (178-192) 277 (269-284) 431 (413-482) 1938
12–19 years 244 (237-251) 150 (145-155) 240 (234-246) 411 (393-436) 4362
20–39 years 255 (248-262) 142 (135-149) 252 (241-261) 452 (437-474) 3195
40–59 years 291 (283-299) 159 (151-167) 289 (282-297) 538 (500-576) 2709
60 years and older 338 (330-345) 169 (160-178) 341 (331-351) 667 (634-688) 3058
Males Total, 3 years and older 272 (265-279) 153 (148-159) 268 (260-275) 494 (480-515) 7827
3–5 years 291 (278-304) 192 (180-206) 287 (277-300) 477 (394-559) 438
6–11 years 287 (279-295) 201 (189-209) 280 (272-288) 448 (423-504) 989
12–19 years 240 (232-249) 150 (142-159) 238 (232-245) 398 (372-436) 2179
20–39 years 246 (238-254) 146 (139-151) 245 (235-256) 418 (395-440) 1358
40–59 years 282 (274-291) 157 (148-168) 280 (271-291) 516 (481-545) 1349
60 years and older 325 (314-337) 159 (147-170) 324 (310-339) 644 (593-702) 1514
Females Total, 3 years and older 288 (281-295) 155 (149-161) 285 (278-292) 552 (531-573) 8275
3–5 years 286 (277-295) 190 (177-201) 287 (276-293) 441 (386-519) 402
6–11 years 272 (264-280) 178 (171-185) 271 (261-281) 402 (385-469) 949
12–19 years 247 (239-255) 148 (145-155) 244 (235-251) 422 (386-476) 2183
20–39 years 264 (256-274) 140 (132-152) 261 (251-273) 492 (455-540) 1837
40–59 years 300 (288-312) 164 (151-174) 297 (285-309) 565 (505-595) 1360
60 years and older 347 (340-355) 176 (163-185) 353 (339-364) 673 (634-698) 1544
Table 1.2.b. Red blood cell (RBC) folate: Mexican Americans Geometric mean and selected percentiles of RBC concentrations (in ng/mL) for Mexican Americans in the U.S. population aged 3 years and older, National Health and Nutrition Examination Survey, 1999–2002.
Geometric mean (95% conf. interval)
Selected percentiles (95% conf. interval) Sample size5th 50th 95th
Males and Females Total, 3 years and older 258 (251-265) 155 (146-161) 254 (248-261) 456 (435-473) 4726
3–5 years 289 (280-298) 201 (194-210) 278 (270-289) 458 (403-524) 273
6–11 years 282 (276-288) 197 (180-211) 276 (270-282) 444 (402-492) 658
12–19 years 245 (239-252) 156 (145-164) 241 (237-248) 408 (381-428) 1642
20–39 years 239 (231-248) 140 (126-149) 235 (229-243) 423 (392-443) 870
40–59 years 273 (263-283) 167 (160-172) 267 (255-275) 496 (454-552) 634
60 years and older 301 (285-317) 161 (141-180) 291 (275-314) 590 (534-711) 649
Males Total, 3 years and older 250 (242-258) 145 (133-155) 251 (241-257) 430 (401-457) 2306
3–5 years 297 (284-311) 210† (196-220) 283 (270-299) 514† (401-599) 144
6–11 years 287 (280-295) 201 (185-214) 283 (274-292) 443 (383-511) 339
12–19 years 241 (234-248) 155 (141-166) 238 (233-246) 376 (356-406) 813
20–39 years 227 (215-239) 129 (114-147) 225 (211-237) 392 (351-435) 385
40–59 years 263 (252-275) 165 (152-171) 265 (251-278) 432 (392-498) 302
60 years and older 293 (269-318) 152 (133-190) 285 (266-299) 567 (525-702) 323
Females Total, 3 years and older 268 (260-275) 159 (155-168) 260 (251-266) 488 (457-517) 2420
3–5 years 279 (267-292) 188† (182-203) 272 (259-289) 418† (371-458) 129
6–11 years 276 (268-285) 194 (173-212) 268 (263-275) 434 (384-492) 319
12–19 years 250 (242-258) 157 (145-167) 243 (237-250) 434 (393-486) 829
20–39 years 255 (246-265) 152 (141-159) 250 (233-260) 436 (421-512) 485
40–59 years 284 (269-299) 171 (163-181) 269 (248-291) 538 (464-624) 332
60 years and older 308 (295-321) 168 (154-184) 305 (280-318) 600 (532-785) 326
† Estimate is subject to greater uncertainty due to small cell size.
National Report on Biochemical Indicators of Diet and Nutrition in the U.S. Population 1999–2002 22 22

Table 1.2.c. Red blood cell (RBC) folate: Non-Hispanic blacks Geometric mean and selected percentiles of RBC concentrations (in ng/mL) for non-Hispanic blacks in the U.S. population aged 3 years and older, National Health and Nutrition Examination Survey, 1999–2002.
Geometric mean (95% conf. interval)
Selected percentiles (95% conf. interval) Sample size5th 50th 95th
Males and Females Total, 3 years and older 221 (216-226) 123 (120-129) 220 (214-224) 383 (370-399) 3783
3–5 years 247 (240-254) 166 (159-180) 244 (235-251) 364 (326-411) 248
6–11 years 238 (232-243) 161 (151-172) 240 (233-247) 336 (322-350) 623
12–19 years 200 (196-205) 123 (117-129) 203 (197-209) 310 (295-320) 1265
20–39 years 209 (202-216) 117 (113-124) 209 (201-215) 361 (340-385) 598
40–59 years 222 (215-230) 120 (111-130) 222 (213-231) 396 (367-427) 553
60 years and older 254 (243-267) 125 (110-136) 255 (240-267) 535 (476-590) 496
Males Total, 3 years and older 216 (210-222) 122 (116-132) 219 (212-226) 360 (341-372) 1856
3–5 years 246 (235-257) 168† (145-188) 244 (234-254) 364† (314-508) 130
6–11 years 243 (237-250) 161 (153-178) 248 (238-255) 334 (313-361) 316
12–19 years 203 (198-209) 124 (116-131) 208 (202-214) 310 (292-327) 645
20–39 years 203 (194-211) 118 (101-135) 207 (197-214) 322 (302-350) 249
40–59 years 211 (202-221) 121 (104-132) 211 (194-226) 364 (348-396) 277
60 years and older 244 (229-260) 117 (103-134) 248 (227-266) 460 (403-592) 239
Females Total, 3 years and older 225 (219-231) 124 (117-130) 221 (216-226) 411 (378-453) 1927
3–5 years 248 (238-258) 165† (159-181) 244 (233-258) 379† (319-453) 118
6–11 years 232 (224-240) 158 (132-177) 230 (221-242) 336 (319-369) 307
12–19 years 197 (192-202) 124 (111-131) 197 (189-201) 303 (291-320) 620
20–39 years 214 (205-223) 119 (113-127) 210 (200-220) 379 (352-445) 349
40–59 years 233 (222-244) 122 (109-141) 233 (220-247) 409 (370-512) 276
60 years and older 262 (246-279) 127 (104-151) 262 (241-277) 553 (496-599) 257
† Estimate is subject to greater uncertainty due to small cell size.
Table 1.2.d. Red blood cell (RBC) folate: Non-Hispanic whites Geometric mean and selected percentiles of RBC concentrations (in ng/mL) for non-Hispanic whites in the U.S. population aged 3 years and older, National Health and Nutrition Examination Survey, 1999–2002.
Geometric mean (95% conf. interval)
Selected percentiles (95% conf. interval) Sample size5th 50th 95th
Males and Females Total, 3 years and older 297 (289-304) 166 (160-172) 292 (284-299) 551 (536-570) 6210
3–5 years 303 (289-318) 204 (180-231) 300 (290-309) 474 (390-546) 231
6–11 years 292 (283-301) 189 (183-207) 290 (282-296) 464 (422-519) 498
12–19 years 257 (249-265) 160 (152-164) 253 (246-261) 436 (400-458) 1083
20–39 years 268 (257-279) 150 (135-165) 265 (252-278) 475 (449-524) 1383
40–59 years 305 (296-313) 173 (166-180) 302 (293-309) 545 (506-597) 1291
60 years and older 352 (342-361) 182 (170-193) 355 (344-365) 674 (639-702) 1724
Males Total, 3 years and older 287 (279-296) 165 (158-173) 281 (272-291) 523 (501-544) 3037
3–5 years 308 (286-332) 204† (165-231) 310 (290-324) 512† (403-634) 120
6–11 years 300 (289-311) 211 (189-225) 290 (276-299) 473 (422-533) 263
12–19 years 251 (241-261) 158 (145-164) 246 (238-256) 410 (372-454) 538
20–39 years 258 (247-269) 157 (147-165) 256 (241-270) 432 (402-463) 578
40–59 years 295 (286-304) 171 (157-180) 292 (280-303) 527 (491-601) 672
60 years and older 339 (325-355) 170 (158-190) 342 (322-359) 660 (601-717) 866
Females Total, 3 years and older 306 (297-315) 167 (159-174) 302 (293-310) 580 (551-604) 3173
3–5 years 298 (285-311) 201† (189-236) 294 (279-307) 436† (382-546) 111
6–11 years 283 (273-294) 182 (173-192) 290 (277-298) 453 (381-508) 235
12–19 years 264 (253-275) 160 (149-167) 262 (250-270) 451 (395-539) 545
20–39 years 278 (265-293) 143 (130-167) 278 (261-293) 548 (490-591) 805
40–59 years 315 (300-330) 176 (165-190) 308 (295-327) 570 (503-611) 619
60 years and older 361 (354-369) 191 (182-201) 364 (351-372) 680 (639-711) 858
† Estimate is subject to greater uncertainty due to small cell size.
1 Water-Soluble Vitamins & Related Biochemical Compounds 23 23

Table 1.3.a. Serum vitamin B12: Total population Geometric mean and selected percentiles of serum concentrations (in pg/mL) for the total U.S. population aged 3 years and older, National Health and Nutrition Examination Survey, 1999–2002.
Geometric mean (95% conf. interval)
Selected percentiles (95% conf. interval) Sample size5th 50th 95th
Males and Females Total, 3 years and older 488 (483-494) 237 (234-242) 485 (477-492) 1000 (977-1030) 15914
3–5 years 783 (745-822) 446 (425-475) 788 (741-823) 1380 (1300-1520) 800
6–11 years 692 (672-712) 369 (344-410) 700 (682-718) 1260 (1190-1310) 1907
12–19 years 505 (496-515) 267 (254-279) 510 (499-523) 941 (912-979) 4331
20–39 years 446 (439-453) 233 (222-238) 446 (438-455) 812 (787-843) 3185
40–59 years 461 (453-469) 233 (224-241) 452 (442-460) 919 (883-973) 2676
60 years and older 478 (466-489) 225 (212-233) 474 (467-485) 1010 (976-1060) 3015
Males Total, 3 years and older 488 (480-497) 248 (240-258) 485 (477-494) 961 (922-993) 7741
3–5 years 763 (715-814) 432 (373-468) 756 (699-824) 1450 (1250-1650) 417
6–11 years 690 (667-715) 368 (344-393) 697 (673-718) 1270 (1200-1330) 972
12–19 years 507 (493-522) 278 (254-297) 512 (494-528) 920 (892-952) 2165
20–39 years 458 (446-470) 243 (231-263) 460 (445-475) 795 (766-826) 1355
40–59 years 458 (447-469) 241 (226-256) 452 (438-460) 847 (792-898) 1337
60 years and older 451 (439-464) 224 (204-236) 456 (439-469) 907 (859-1000) 1495
Females Total, 3 years and older 488 (482-494) 232 (226-237) 483 (475-492) 1040 (1010-1080) 8173
3–5 years 806 (762-852) 475 (446-514) 804 (755-859) 1340 (1270-1440) 383
6–11 years 694 (668-720) 382 (338-425) 700 (676-731) 1250 (1110-1310) 935
12–19 years 504 (494-514) 256 (241-267) 509 (495-525) 966 (936-1000) 2166
20–39 years 435 (427-443) 222 (210-232) 433 (418-447) 839 (784-913) 1830
40–59 years 463 (448-479) 223 (201-238) 453 (435-473) 1000 (920-1120) 1339
60 years and older 499 (482-515) 227 (209-237) 494 (479-510) 1060 (994-1140) 1520
Table 1.3.b. Serum vitamin B12: Mexican Americans Geometric mean and selected percentiles of serum concentrations (in pg/mL) for Mexican Americans in the U.S. population aged 3 years and older, National Health and Nutrition Examination Survey, 1999–2002.
Geometric mean (95% conf. interval)
Selected percentiles (95% conf. interval) Sample size5th 50th 95th
Males and Females Total, 3 years and older 532 (513-553) 260 (249-273) 514 (493-531) 1120 (1060-1200) 4695
3–5 years 821 (784-860) 447 (402-526) 809 (764-870) 1470 (1330-1530) 266
6–11 years 701 (672-731) 415 (390-447) 705 (676-731) 1190 (1090-1270) 652
12–19 years 507 (491-523) 268 (249-288) 504 (494-519) 883 (847-920) 1637
20–39 years 477 (452-504) 242 (213-260) 453 (437-469) 1010 (875-1180) 866
40–59 years 518 (491-546) 264 (258-295) 475 (452-514) 1100 (947-1500) 634
60 years and older 497 (464-532) 215 (203-237) 482 (454-514) 1090 (969-1460) 640
Males Total, 3 years and older 507 (486-529) 263 (245-278) 494 (473-516) 999 (936-1100) 2293
3–5 years 798 (744-855) 428† (351-553) 779 (704-833) 1490† (1250-2310) 139
6–11 years 690 (646-738) 411 (379-455) 694 (659-729) 1190 (1040-1370) 338
12–19 years 489 (472-507) 264 (242-292) 488 (479-501) 849 (808-896) 811
20–39 years 454 (423-489) 249 (200-279) 452 (423-468) 771 (731-858) 383
40–59 years 486 (465-507) 292 (264-308) 469 (429-514) 891 (792-1390) 301
60 years and older 451 (414-491) 206 (162-238) 444 (410-473) 1070 (911-1250) 321
Females Total, 3 years and older 562 (536-589) 257 (241-269) 533 (514-552) 1200 (1120-1360) 2402
3–5 years 848 (799-901) 451† (408-548) 853 (775-933) 1390† (1200-1520) 127
6–11 years 713 (681-747) 424 (382-475) 711 (689-746) 1160 (1080-1280) 314
12–19 years 527 (505-549) 277 (254-296) 525 (504-534) 915 (870-939) 826
20–39 years 506 (463-553) 232 (202-257) 461 (444-482) 1190 (1040-1720) 483
40–59 years 553 (507-603) 258 (214-277) 491 (461-528) 1310 (1000-4570) 333
60 years and older 540 (494-592) 235 (196-271) 525 (484-581) 1180 (965-2170) 319
† Estimate is subject to greater uncertainty due to small cell size.
National Report on Biochemical Indicators of Diet and Nutrition in the U.S. Population 1999–2002 24 24
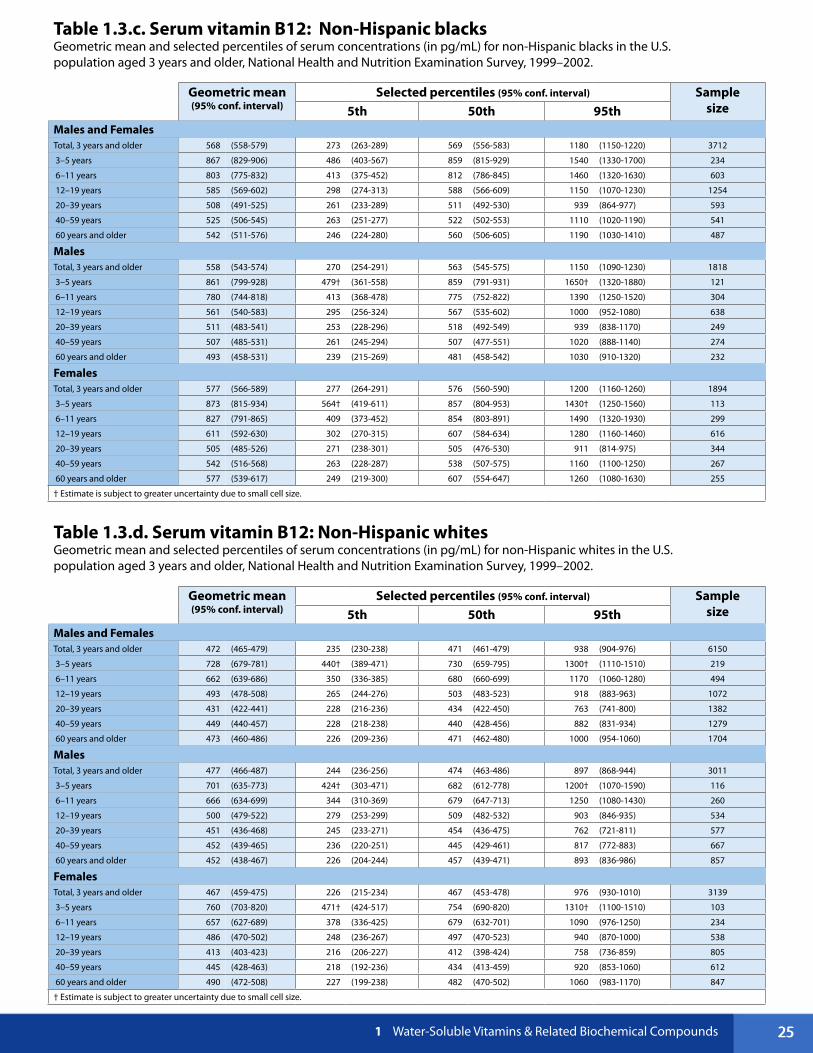
Table 1.3.c. Serum vitamin B12: Non-Hispanic blacks Geometric mean and selected percentiles of serum concentrations (in pg/mL) for non-Hispanic blacks in the U.S. population aged 3 years and older, National Health and Nutrition Examination Survey, 1999–2002.
Geometric mean (95% conf. interval)
Selected percentiles (95% conf. interval) Sample size5th 50th 95th
Males and Females Total, 3 years and older 568 (558-579) 273 (263-289) 569 (556-583) 1180 (1150-1220) 3712
3–5 years 867 (829-906) 486 (403-567) 859 (815-929) 1540 (1330-1700) 234
6–11 years 803 (775-832) 413 (375-452) 812 (786-845) 1460 (1320-1630) 603
12–19 years 585 (569-602) 298 (274-313) 588 (566-609) 1150 (1070-1230) 1254
20–39 years 508 (491-525) 261 (233-289) 511 (492-530) 939 (864-977) 593
40–59 years 525 (506-545) 263 (251-277) 522 (502-553) 1110 (1020-1190) 541
60 years and older 542 (511-576) 246 (224-280) 560 (506-605) 1190 (1030-1410) 487
Males Total, 3 years and older 558 (543-574) 270 (254-291) 563 (545-575) 1150 (1090-1230) 1818
3–5 years 861 (799-928) 479† (361-558) 859 (791-931) 1650† (1320-1880) 121
6–11 years 780 (744-818) 413 (368-478) 775 (752-822) 1390 (1250-1520) 304
12–19 years 561 (540-583) 295 (256-324) 567 (535-602) 1000 (952-1080) 638
20–39 years 511 (483-541) 253 (228-296) 518 (492-549) 939 (838-1170) 249
40–59 years 507 (485-531) 261 (245-294) 507 (477-551) 1020 (888-1140) 274
60 years and older 493 (458-531) 239 (215-269) 481 (458-542) 1030 (910-1320) 232
Females Total, 3 years and older 577 (566-589) 277 (264-291) 576 (560-590) 1200 (1160-1260) 1894
3–5 years 873 (815-934) 564† (419-611) 857 (804-953) 1430† (1250-1560) 113
6–11 years 827 (791-865) 409 (373-452) 854 (803-891) 1490 (1320-1930) 299
12–19 years 611 (592-630) 302 (270-315) 607 (584-634) 1280 (1160-1460) 616
20–39 years 505 (485-526) 271 (238-301) 505 (476-530) 911 (814-975) 344
40–59 years 542 (516-568) 263 (228-287) 538 (507-575) 1160 (1100-1250) 267
60 years and older 577 (539-617) 249 (219-300) 607 (554-647) 1260 (1080-1630) 255
† Estimate is subject to greater uncertainty due to small cell size.
Table 1.3.d. Serum vitamin B12: Non-Hispanic whites Geometric mean and selected percentiles of serum concentrations (in pg/mL) for non-Hispanic whites in the U.S. population aged 3 years and older, National Health and Nutrition Examination Survey, 1999–2002.
Geometric mean (95% conf. interval)
Selected percentiles (95% conf. interval) Sample size5th 50th 95th
Males and Females Total, 3 years and older 472 (465-479) 235 (230-238) 471 (461-479) 938 (904-976) 6150
3–5 years 728 (679-781) 440† (389-471) 730 (659-795) 1300† (1110-1510) 219
6–11 years 662 (639-686) 350 (336-385) 680 (660-699) 1170 (1060-1280) 494
12–19 years 493 (478-508) 265 (244-276) 503 (483-523) 918 (883-963) 1072
20–39 years 431 (422-441) 228 (216-236) 434 (422-450) 763 (741-800) 1382
40–59 years 449 (440-457) 228 (218-238) 440 (428-456) 882 (831-934) 1279
60 years and older 473 (460-486) 226 (209-236) 471 (462-480) 1000 (954-1060) 1704
Males Total, 3 years and older 477 (466-487) 244 (236-256) 474 (463-486) 897 (868-944) 3011
3–5 years 701 (635-773) 424† (303-471) 682 (612-778) 1200† (1070-1590) 116
6–11 years 666 (634-699) 344 (310-369) 679 (647-713) 1250 (1080-1430) 260
12–19 years 500 (479-522) 279 (253-299) 509 (482-532) 903 (846-935) 534
20–39 years 451 (436-468) 245 (233-271) 454 (436-475) 762 (721-811) 577
40–59 years 452 (439-465) 236 (220-251) 445 (429-461) 817 (772-883) 667
60 years and older 452 (438-467) 226 (204-244) 457 (439-471) 893 (836-986) 857
Females Total, 3 years and older 467 (459-475) 226 (215-234) 467 (453-478) 976 (930-1010) 3139
3–5 years 760 (703-820) 471† (424-517) 754 (690-820) 1310† (1100-1510) 103
6–11 years 657 (627-689) 378 (336-425) 679 (632-701) 1090 (976-1250) 234
12–19 years 486 (470-502) 248 (236-267) 497 (470-523) 940 (870-1000) 538
20–39 years 413 (403-423) 216 (206-227) 412 (398-424) 758 (736-859) 805
40–59 years 445 (428-463) 218 (192-236) 434 (413-459) 920 (853-1060) 612
60 years and older 490 (472-508) 227 (199-238) 482 (470-502) 1060 (983-1170) 847
† Estimate is subject to greater uncertainty due to small cell size.
1 Water-Soluble Vitamins & Related Biochemical Compounds 25 25
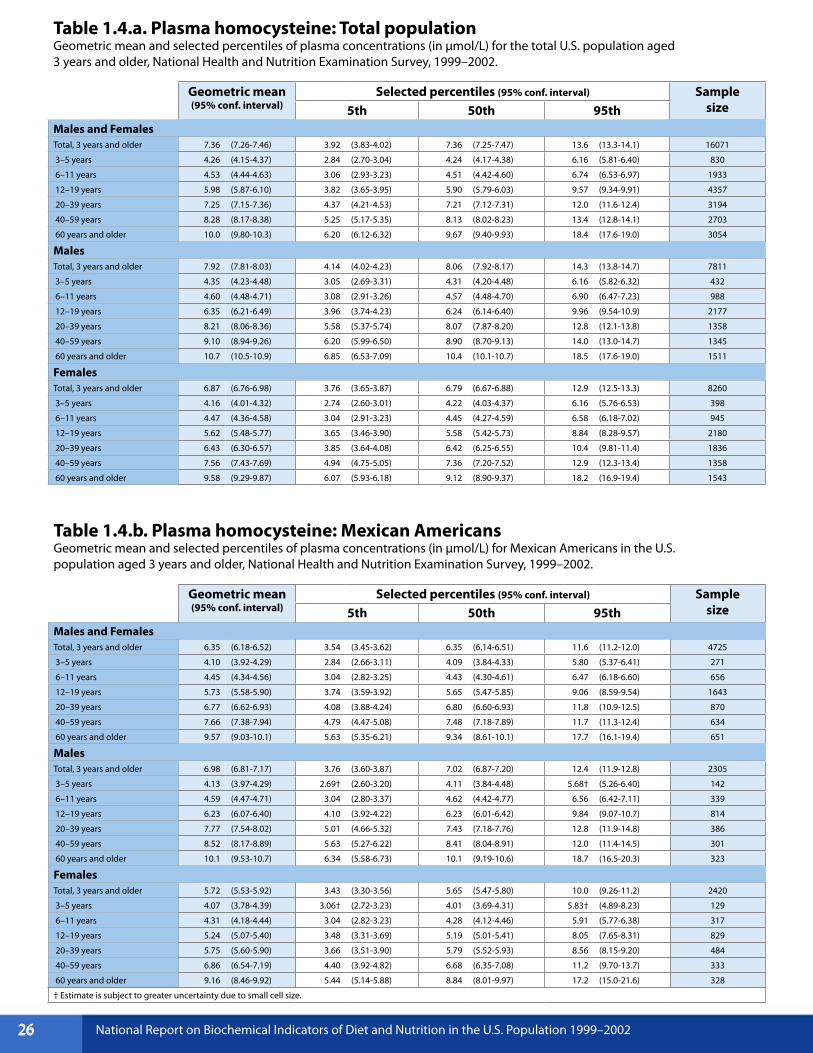
Table 1.4.a. Plasma homocysteine: Total population Geometric mean and selected percentiles of plasma concentrations (in µmol/L) for the total U.S. population aged 3 years and older, National Health and Nutrition Examination Survey, 1999–2002.
Geometric mean (95% conf. interval)
Selected percentiles (95% conf. interval) Sample size5th 50th 95th
Males and Females Total, 3 years and older 7.36 (7.26-7.46) 3.92 (3.83-4.02) 7.36 (7.25-7.47) 13.6 (13.3-14.1) 16071
3–5 years 4.26 (4.15-4.37) 2.84 (2.70-3.04) 4.24 (4.17-4.38) 6.16 (5.81-6.40) 830
6–11 years 4.53 (4.44-4.63) 3.06 (2.93-3.23) 4.51 (4.42-4.60) 6.74 (6.53-6.97) 1933
12–19 years 5.98 (5.87-6.10) 3.82 (3.65-3.95) 5.90 (5.79-6.03) 9.57 (9.34-9.91) 4357
20–39 years 7.25 (7.15-7.36) 4.37 (4.21-4.53) 7.21 (7.12-7.31) 12.0 (11.6-12.4) 3194
40–59 years 8.28 (8.17-8.38) 5.25 (5.17-5.35) 8.13 (8.02-8.23) 13.4 (12.8-14.1) 2703
60 years and older 10.0 (9.80-10.3) 6.20 (6.12-6.32) 9.67 (9.40-9.93) 18.4 (17.6-19.0) 3054
Males Total, 3 years and older 7.92 (7.81-8.03) 4.14 (4.02-4.23) 8.06 (7.92-8.17) 14.3 (13.8-14.7) 7811
3–5 years 4.35 (4.23-4.48) 3.05 (2.69-3.31) 4.31 (4.20-4.48) 6.16 (5.82-6.32) 432
6–11 years 4.60 (4.48-4.71) 3.08 (2.91-3.26) 4.57 (4.48-4.70) 6.90 (6.47-7.23) 988
12–19 years 6.35 (6.21-6.49) 3.96 (3.74-4.23) 6.24 (6.14-6.40) 9.96 (9.54-10.9) 2177
20–39 years 8.21 (8.06-8.36) 5.58 (5.37-5.74) 8.07 (7.87-8.20) 12.8 (12.1-13.8) 1358
40–59 years 9.10 (8.94-9.26) 6.20 (5.99-6.50) 8.90 (8.70-9.13) 14.0 (13.0-14.7) 1345
60 years and older 10.7 (10.5-10.9) 6.85 (6.53-7.09) 10.4 (10.1-10.7) 18.5 (17.6-19.0) 1511
Females Total, 3 years and older 6.87 (6.76-6.98) 3.76 (3.65-3.87) 6.79 (6.67-6.88) 12.9 (12.5-13.3) 8260
3–5 years 4.16 (4.01-4.32) 2.74 (2.60-3.01) 4.22 (4.03-4.37) 6.16 (5.76-6.53) 398
6–11 years 4.47 (4.36-4.58) 3.04 (2.91-3.23) 4.45 (4.27-4.59) 6.58 (6.18-7.02) 945
12–19 years 5.62 (5.48-5.77) 3.65 (3.46-3.90) 5.58 (5.42-5.73) 8.84 (8.28-9.57) 2180
20–39 years 6.43 (6.30-6.57) 3.85 (3.64-4.08) 6.42 (6.25-6.55) 10.4 (9.81-11.4) 1836
40–59 years 7.56 (7.43-7.69) 4.94 (4.75-5.05) 7.36 (7.20-7.52) 12.9 (12.3-13.4) 1358
60 years and older 9.58 (9.29-9.87) 6.07 (5.93-6.18) 9.12 (8.90-9.37) 18.2 (16.9-19.4) 1543
Table 1.4.b. Plasma homocysteine: Mexican Americans Geometric mean and selected percentiles of plasma concentrations (in µmol/L) for Mexican Americans in the U.S. population aged 3 years and older, National Health and Nutrition Examination Survey, 1999–2002.
Geometric mean (95% conf. interval)
Selected percentiles (95% conf. interval) Sample size5th 50th 95th
Males and Females Total, 3 years and older 6.35 (6.18-6.52) 3.54 (3.45-3.62) 6.35 (6.14-6.51) 11.6 (11.2-12.0) 4725
3–5 years 4.10 (3.92-4.29) 2.84 (2.66-3.11) 4.09 (3.84-4.33) 5.80 (5.37-6.41) 271
6–11 years 4.45 (4.34-4.56) 3.04 (2.82-3.25) 4.43 (4.30-4.61) 6.47 (6.18-6.60) 656
12–19 years 5.73 (5.58-5.90) 3.74 (3.59-3.92) 5.65 (5.47-5.85) 9.06 (8.59-9.54) 1643
20–39 years 6.77 (6.62-6.93) 4.08 (3.88-4.24) 6.80 (6.60-6.93) 11.8 (10.9-12.5) 870
40–59 years 7.66 (7.38-7.94) 4.79 (4.47-5.08) 7.48 (7.18-7.89) 11.7 (11.3-12.4) 634
60 years and older 9.57 (9.03-10.1) 5.63 (5.35-6.21) 9.34 (8.61-10.1) 17.7 (16.1-19.4) 651
Males Total, 3 years and older 6.98 (6.81-7.17) 3.76 (3.60-3.87) 7.02 (6.87-7.20) 12.4 (11.9-12.8) 2305
3–5 years 4.13 (3.97-4.29) 2.69† (2.60-3.20) 4.11 (3.84-4.48) 5.68† (5.26-6.40) 142
6–11 years 4.59 (4.47-4.71) 3.04 (2.80-3.37) 4.62 (4.42-4.77) 6.56 (6.42-7.11) 339
12–19 years 6.23 (6.07-6.40) 4.10 (3.92-4.22) 6.23 (6.01-6.42) 9.84 (9.07-10.7) 814
20–39 years 7.77 (7.54-8.02) 5.01 (4.66-5.32) 7.43 (7.18-7.76) 12.8 (11.9-14.8) 386
40–59 years 8.52 (8.17-8.89) 5.63 (5.27-6.22) 8.41 (8.04-8.91) 12.0 (11.4-14.5) 301
60 years and older 10.1 (9.53-10.7) 6.34 (5.58-6.73) 10.1 (9.19-10.6) 18.7 (16.5-20.3) 323
Females Total, 3 years and older 5.72 (5.53-5.92) 3.43 (3.30-3.56) 5.65 (5.47-5.80) 10.0 (9.26-11.2) 2420
3–5 years 4.07 (3.78-4.39) 3.06† (2.72-3.23) 4.01 (3.69-4.31) 5.83† (4.89-8.23) 129
6–11 years 4.31 (4.18-4.44) 3.04 (2.82-3.23) 4.28 (4.12-4.46) 5.91 (5.77-6.38) 317
12–19 years 5.24 (5.07-5.40) 3.48 (3.31-3.69) 5.19 (5.01-5.41) 8.05 (7.65-8.31) 829
20–39 years 5.75 (5.60-5.90) 3.66 (3.51-3.90) 5.79 (5.52-5.93) 8.56 (8.15-9.20) 484
40–59 years 6.86 (6.54-7.19) 4.40 (3.92-4.82) 6.68 (6.35-7.08) 11.2 (9.70-13.7) 333
60 years and older 9.16 (8.46-9.92) 5.44 (5.14-5.88) 8.84 (8.01-9.97) 17.2 (15.0-21.6) 328
† Estimate is subject to greater uncertainty due to small cell size.
National Report on Biochemical Indicators of Diet and Nutrition in the U.S. Population 1999–2002 26 26

Table 1.4.c. Plasma homocysteine: Non-Hispanic blacks Geometric mean and selected percentiles of plasma concentrations (in µmol/L) for non-Hispanic blacks in the U.S. population aged 3 years and older, National Health and Nutrition Examination Survey, 1999–2002.
Geometric mean (95% conf. interval)
Selected percentiles (95% conf. interval) Sample size5th 50th 95th
Males and Females Total, 3 years and older 7.14 (6.95-7.33) 3.72 (3.58-3.84) 7.07 (6.84-7.29) 14.3 (13.3-14.9) 3777
3–5 years 4.16 (4.01-4.32) 2.82 (2.67-3.08) 4.08 (3.91-4.34) 6.18 (5.81-6.43) 246
6–11 years 4.43 (4.29-4.57) 2.99 (2.84-3.21) 4.42 (4.29-4.57) 6.43 (6.23-6.75) 621
12–19 years 5.96 (5.83-6.10) 3.73 (3.57-3.92) 5.92 (5.78-6.05) 9.66 (9.34-10.1) 1265
20–39 years 7.22 (7.03-7.42) 4.33 (4.12-4.43) 7.22 (7.00-7.46) 11.9 (11.3-12.8) 597
40–59 years 8.71 (8.33-9.09) 5.27 (4.87-5.66) 8.43 (8.08-8.83) 15.3 (13.7-18.8) 552
60 years and older 10.9 (10.5-11.3) 6.39 (6.12-6.67) 10.2 (9.86-10.8) 21.3 (18.9-25.9) 496
Males Total, 3 years and older 7.68 (7.43-7.92) 3.83 (3.72-4.00) 7.77 (7.52-8.04) 15.2 (14.6-15.9) 1853
3–5 years 4.38 (4.17-4.60) 3.05† (2.68-3.34) 4.27 (4.06-4.61) 6.38† (5.79-6.57) 127
6–11 years 4.53 (4.38-4.69) 2.99 (2.81-3.39) 4.53 (4.38-4.64) 6.51 (6.23-6.80) 314
12–19 years 6.37 (6.22-6.52) 3.87 (3.69-4.08) 6.32 (6.16-6.44) 10.4 (9.70-11.0) 646
20–39 years 8.46 (8.18-8.74) 5.54 (5.34-5.91) 8.22 (7.96-8.59) 14.3 (11.9-15.5) 249
40–59 years 9.49 (9.03-9.97) 6.04 (5.32-6.45) 9.20 (8.62-9.54) 18.1 (14.7-20.2) 278
60 years and older 11.5 (11.0-12.0) 6.83 (6.13-7.33) 11.0 (10.2-11.9) 21.3 (18.4-25.9) 239
Females Total, 3 years and older 6.71 (6.50-6.94) 3.60 (3.50-3.76) 6.59 (6.38-6.78) 12.8 (12.2-13.7) 1924
3–5 years 3.93 (3.72-4.16) 2.72† (2.54-2.97) 3.85 (3.58-4.29) 5.85† (5.13-6.39) 119
6–11 years 4.33 (4.18-4.47) 2.94 (2.71-3.21) 4.33 (4.18-4.47) 6.39 (5.90-6.81) 307
12–19 years 5.58 (5.41-5.75) 3.65 (3.46-3.82) 5.62 (5.45-5.77) 8.51 (7.92-9.32) 619
20–39 years 6.41 (6.18-6.64) 4.07 (3.70-4.33) 6.42 (6.18-6.75) 9.75 (9.08-10.0) 348
40–59 years 8.07 (7.67-8.50) 4.91 (4.63-5.33) 7.72 (7.38-8.48) 13.3 (11.7-19.2) 274
60 years and older 10.6 (10.1-11.1) 6.20 (5.89-6.62) 9.92 (9.55-10.5) 22.5 (17.5-27.7) 257
† Estimate is subject to greater uncertainty due to small cell size.
Table 1.4.d. Plasma homocysteine: Non-Hispanic whites Geometric mean and selected percentiles of plasma concentrations (in µmol/L) for non-Hispanic whites in the U.S. population aged 3 years and older, National Health and Nutrition Examination Survey, 1999–2002.
Geometric mean (95% conf. interval)
Selected percentiles (95% conf. interval) Sample size5th 50th 95th
Males and Females Total, 3 years and older 7.59 (7.47-7.71) 4.07 (3.97-4.19) 7.60 (7.48-7.74) 14.0 (13.4-14.4) 6192
3–5 years 4.30 (4.14-4.45) 2.74 (2.64-3.19) 4.28 (4.19-4.49) 6.19 (5.74-6.90) 229
6–11 years 4.56 (4.44-4.69) 3.14 (2.94-3.26) 4.51 (4.40-4.68) 6.94 (6.60-7.13) 497
12–19 years 5.99 (5.86-6.12) 3.83 (3.59-4.03) 5.89 (5.76-6.07) 9.54 (9.23-10.2) 1078
20–39 years 7.36 (7.24-7.49) 4.66 (4.37-4.83) 7.33 (7.16-7.49) 12.0 (11.5-12.4) 1383
40–59 years 8.31 (8.19-8.42) 5.30 (5.18-5.44) 8.17 (8.03-8.28) 13.4 (12.5-14.1) 1286
60 years and older 10.0 (9.74-10.3) 6.22 (6.12-6.44) 9.63 (9.33-9.92) 18.2 (17.4-19.0) 1719
Males Total, 3 years and older 8.12 (7.99-8.25) 4.25 (4.15-4.38) 8.23 (8.11-8.38) 14.3 (13.9-14.8) 3026
3–5 years 4.39 (4.18-4.61) 3.10† (2.44-3.48) 4.28 (4.20-4.56) 6.14† (5.65-7.22) 120
6–11 years 4.62 (4.49-4.75) 3.15 (2.94-3.31) 4.55 (4.41-4.76) 6.91 (6.47-7.23) 264
12–19 years 6.28 (6.11-6.46) 3.95 (3.64-4.25) 6.19 (6.00-6.36) 9.72 (9.38-11.4) 534
20–39 years 8.21 (8.03-8.41) 5.62 (5.37-5.81) 8.10 (7.84-8.28) 12.4 (11.7-12.9) 577
40–59 years 9.10 (8.92-9.28) 6.31 (5.99-6.56) 8.91 (8.68-9.18) 13.8 (12.7-14.4) 668
60 years and older 10.7 (10.4-11.0) 6.88 (6.53-7.25) 10.3 (10.0-10.7) 18.2 (17.3-19.0) 863
Females Total, 3 years and older 7.11 (6.97-7.25) 3.89 (3.69-4.07) 7.01 (6.89-7.14) 13.4 (12.8-14.2) 3166
3–5 years 4.20 (3.97-4.44) 2.71† (2.06-3.19) 4.25 (4.04-4.59) 6.17† (5.58-6.90) 109
6–11 years 4.50 (4.33-4.68) 3.11 (2.91-3.30) 4.47 (4.19-4.73) 6.94 (6.16-7.35) 233
12–19 years 5.70 (5.52-5.88) 3.68 (3.43-3.97) 5.63 (5.40-5.84) 9.09 (8.36-10.2) 544
20–39 years 6.61 (6.45-6.78) 3.90 (3.63-4.32) 6.52 (6.37-6.72) 11.2 (9.87-12.0) 806
40–59 years 7.57 (7.40-7.75) 4.97 (4.67-5.13) 7.36 (7.18-7.57) 12.9 (11.7-14.0) 618
60 years and older 9.53 (9.19-9.89) 6.04 (5.82-6.19) 9.09 (8.78-9.31) 18.2 (16.6-19.8) 856
† Estimate is subject to greater uncertainty due to small cell size.
1 Water-Soluble Vitamins & Related Biochemical Compounds 27 27
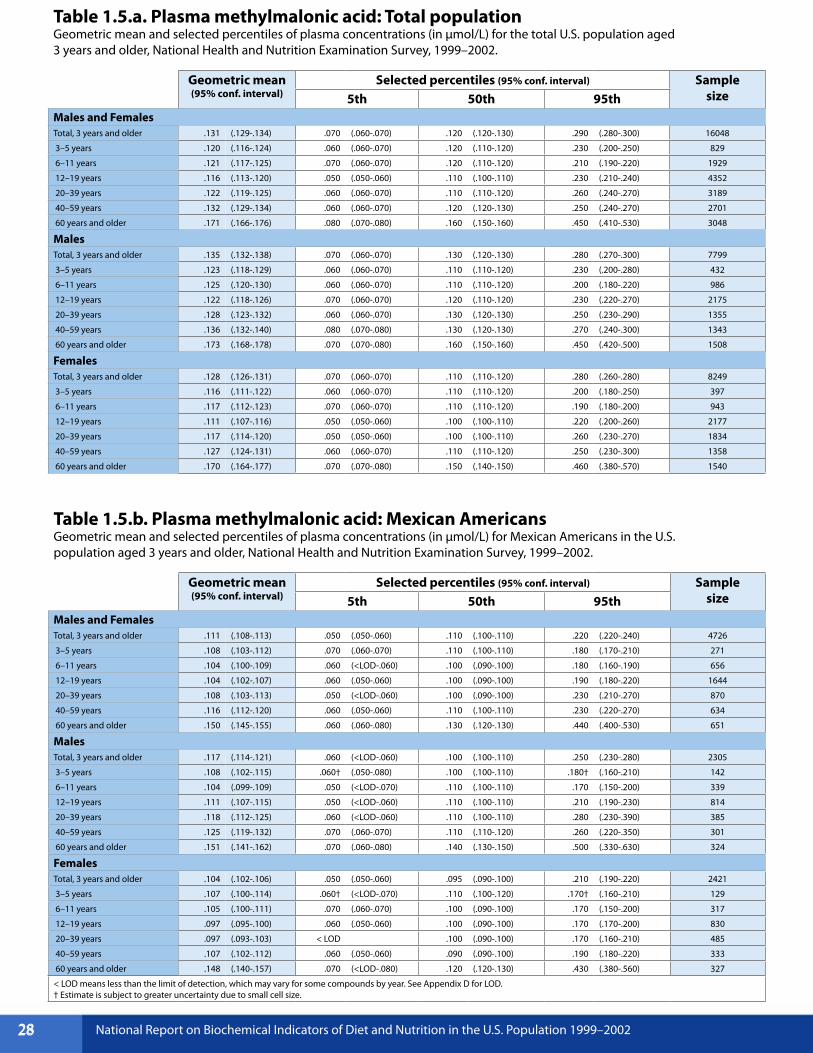
Table 1.5.a. Plasma methylmalonic acid: Total population Geometric mean and selected percentiles of plasma concentrations (in µmol/L) for the total U.S. population aged 3 years and older, National Health and Nutrition Examination Survey, 1999–2002.
Geometric mean (95% conf. interval)
Selected percentiles (95% conf. interval) Sample size5th 50th 95th
Males and Females Total, 3 years and older .131 (.129-.134) .070 (.060-.070) .120 (.120-.130) .290 (.280-.300) 16048
3–5 years .120 (.116-.124) .060 (.060-.070) .120 (.110-.120) .230 (.200-.250) 829
6–11 years .121 (.117-.125) .070 (.060-.070) .120 (.110-.120) .210 (.190-.220) 1929
12–19 years .116 (.113-.120) .050 (.050-.060) .110 (.100-.110) .230 (.210-.240) 4352
20–39 years .122 (.119-.125) .060 (.060-.070) .110 (.110-.120) .260 (.240-.270) 3189
40–59 years .132 (.129-.134) .060 (.060-.070) .120 (.120-.130) .250 (.240-.270) 2701
60 years and older .171 (.166-.176) .080 (.070-.080) .160 (.150-.160) .450 (.410-.530) 3048
Males Total, 3 years and older .135 (.132-.138) .070 (.060-.070) .130 (.120-.130) .280 (.270-.300) 7799
3–5 years .123 (.118-.129) .060 (.060-.070) .110 (.110-.120) .230 (.200-.280) 432
6–11 years .125 (.120-.130) .060 (.060-.070) .110 (.110-.120) .200 (.180-.220) 986
12–19 years .122 (.118-.126) .070 (.060-.070) .120 (.110-.120) .230 (.220-.270) 2175
20–39 years .128 (.123-.132) .060 (.060-.070) .130 (.120-.130) .250 (.230-.290) 1355
40–59 years .136 (.132-.140) .080 (.070-.080) .130 (.120-.130) .270 (.240-.300) 1343
60 years and older .173 (.168-.178) .070 (.070-.080) .160 (.150-.160) .450 (.420-.500) 1508
Females Total, 3 years and older .128 (.126-.131) .070 (.060-.070) .110 (.110-.120) .280 (.260-.280) 8249
3–5 years .116 (.111-.122) .060 (.060-.070) .110 (.110-.120) .200 (.180-.250) 397
6–11 years .117 (.112-.123) .070 (.060-.070) .110 (.110-.120) .190 (.180-.200) 943
12–19 years .111 (.107-.116) .050 (.050-.060) .100 (.100-.110) .220 (.200-.260) 2177
20–39 years .117 (.114-.120) .050 (.050-.060) .100 (.100-.110) .260 (.230-.270) 1834
40–59 years .127 (.124-.131) .060 (.060-.070) .110 (.110-.120) .250 (.230-.300) 1358
60 years and older .170 (.164-.177) .070 (.070-.080) .150 (.140-.150) .460 (.380-.570) 1540
Table 1.5.b. Plasma methylmalonic acid: Mexican Americans Geometric mean and selected percentiles of plasma concentrations (in µmol/L) for Mexican Americans in the U.S. population aged 3 years and older, National Health and Nutrition Examination Survey, 1999–2002.
Geometric mean (95% conf. interval)
Selected percentiles (95% conf. interval) Sample size5th 50th 95th
Males and Females Total, 3 years and older .111 (.108-.113) .050 (.050-.060) .110 (.100-.110) .220 (.220-.240) 4726
3–5 years .108 (.103-.112) .070 (.060-.070) .110 (.100-.110) .180 (.170-.210) 271
6–11 years .104 (.100-.109) .060 (<LOD-.060) .100 (.090-.100) .180 (.160-.190) 656
12–19 years .104 (.102-.107) .060 (.050-.060) .100 (.090-.100) .190 (.180-.220) 1644
20–39 years .108 (.103-.113) .050 (<LOD-.060) .100 (.090-.100) .230 (.210-.270) 870
40–59 years .116 (.112-.120) .060 (.050-.060) .110 (.100-.110) .230 (.220-.270) 634
60 years and older .150 (.145-.155) .060 (.060-.080) .130 (.120-.130) .440 (.400-.530) 651
Males Total, 3 years and older .117 (.114-.121) .060 (<LOD-.060) .100 (.100-.110) .250 (.230-.280) 2305
3–5 years .108 (.102-.115) .060† (.050-.080) .100 (.100-.110) .180† (.160-.210) 142
6–11 years .104 (.099-.109) .050 (<LOD-.070) .110 (.100-.110) .170 (.150-.200) 339
12–19 years .111 (.107-.115) .050 (<LOD-.060) .110 (.100-.110) .210 (.190-.230) 814
20–39 years .118 (.112-.125) .060 (<LOD-.060) .110 (.100-.110) .280 (.230-.390) 385
40–59 years .125 (.119-.132) .070 (.060-.070) .110 (.110-.120) .260 (.220-.350) 301
60 years and older .151 (.141-.162) .070 (.060-.080) .140 (.130-.150) .500 (.330-.630) 324
Females Total, 3 years and older .104 (.102-.106) .050 (.050-.060) .095 (.090-.100) .210 (.190-.220) 2421
3–5 years .107 (.100-.114) .060† (<LOD-.070) .110 (.100-.120) .170† (.160-.210) 129
6–11 years .105 (.100-.111) .070 (.060-.070) .100 (.090-.100) .170 (.150-.200) 317
12–19 years .097 (.095-.100) .060 (.050-.060) .100 (.090-.100) .170 (.170-.200) 830
20–39 years .097 (.093-.103) < LOD .100 (.090-.100) .170 (.160-.210) 485
40–59 years .107 (.102-.112) .060 (.050-.060) .090 (.090-.100) .190 (.180-.220) 333
60 years and older .148 (.140-.157) .070 (<LOD-.080) .120 (.120-.130) .430 (.380-.560) 327
< LOD means less than the limit of detection, which may vary for some compounds by year. See Appendix D for LOD. † Estimate is subject to greater uncertainty due to small cell size.
National Report on Biochemical Indicators of Diet and Nutrition in the U.S. Population 1999–2002 28 28
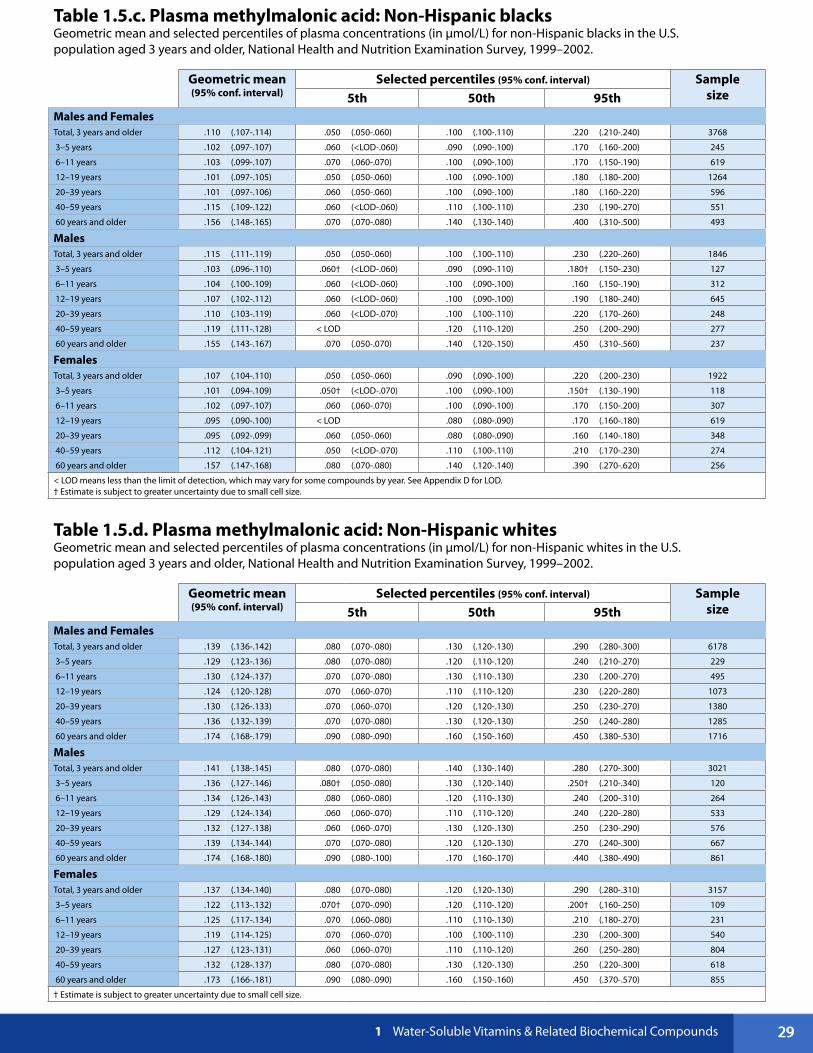
Table 1.5.c. Plasma methylmalonic acid: Non-Hispanic blacks Geometric mean and selected percentiles of plasma concentrations (in µmol/L) for non-Hispanic blacks in the U.S. population aged 3 years and older, National Health and Nutrition Examination Survey, 1999–2002.
Geometric mean (95% conf. interval)
Selected percentiles (95% conf. interval) Sample size5th 50th 95th
Males and Females Total, 3 years and older .110 (.107-.114) .050 (.050-.060) .100 (.100-.110) .220 (.210-.240) 3768
3–5 years .102 (.097-.107) .060 (<LOD-.060) .090 (.090-.100) .170 (.160-.200) 245
6–11 years .103 (.099-.107) .070 (.060-.070) .100 (.090-.100) .170 (.150-.190) 619
12–19 years .101 (.097-.105) .050 (.050-.060) .100 (.090-.100) .180 (.180-.200) 1264
20–39 years .101 (.097-.106) .060 (.050-.060) .100 (.090-.100) .180 (.160-.220) 596
40–59 years .115 (.109-.122) .060 (<LOD-.060) .110 (.100-.110) .230 (.190-.270) 551
60 years and older .156 (.148-.165) .070 (.070-.080) .140 (.130-.140) .400 (.310-.500) 493
Males Total, 3 years and older .115 (.111-.119) .050 (.050-.060) .100 (.100-.110) .230 (.220-.260) 1846
3–5 years .103 (.096-.110) .060† (<LOD-.060) .090 (.090-.110) .180† (.150-.230) 127
6–11 years .104 (.100-.109) .060 (<LOD-.060) .100 (.090-.100) .160 (.150-.190) 312
12–19 years .107 (.102-.112) .060 (<LOD-.060) .100 (.090-.100) .190 (.180-.240) 645
20–39 years .110 (.103-.119) .060 (<LOD-.070) .100 (.100-.110) .220 (.170-.260) 248
40–59 years .119 (.111-.128) < LOD .120 (.110-.120) .250 (.200-.290) 277
60 years and older .155 (.143-.167) .070 (.050-.070) .140 (.120-.150) .450 (.310-.560) 237
Females Total, 3 years and older .107 (.104-.110) .050 (.050-.060) .090 (.090-.100) .220 (.200-.230) 1922
3–5 years .101 (.094-.109) .050† (<LOD-.070) .100 (.090-.100) .150† (.130-.190) 118
6–11 years .102 (.097-.107) .060 (.060-.070) .100 (.090-.100) .170 (.150-.200) 307
12–19 years .095 (.090-.100) < LOD .080 (.080-.090) .170 (.160-.180) 619
20–39 years .095 (.092-.099) .060 (.050-.060) .080 (.080-.090) .160 (.140-.180) 348
40–59 years .112 (.104-.121) .050 (<LOD-.070) .110 (.100-.110) .210 (.170-.230) 274
60 years and older .157 (.147-.168) .080 (.070-.080) .140 (.120-.140) .390 (.270-.620) 256
< LOD means less than the limit of detection, which may vary for some compounds by year. See Appendix D for LOD. † Estimate is subject to greater uncertainty due to small cell size.
Table 1.5.d. Plasma methylmalonic acid: Non-Hispanic whites Geometric mean and selected percentiles of plasma concentrations (in µmol/L) for non-Hispanic whites in the U.S. population aged 3 years and older, National Health and Nutrition Examination Survey, 1999–2002.
Geometric mean (95% conf. interval)
Selected percentiles (95% conf. interval) Sample size5th 50th 95th
Males and Females Total, 3 years and older .139 (.136-.142) .080 (.070-.080) .130 (.120-.130) .290 (.280-.300) 6178
3–5 years .129 (.123-.136) .080 (.070-.080) .120 (.110-.120) .240 (.210-.270) 229
6–11 years .130 (.124-.137) .070 (.070-.080) .130 (.110-.130) .230 (.200-.270) 495
12–19 years .124 (.120-.128) .070 (.060-.070) .110 (.110-.120) .230 (.220-.280) 1073
20–39 years .130 (.126-.133) .070 (.060-.070) .120 (.120-.130) .250 (.230-.270) 1380
40–59 years .136 (.132-.139) .070 (.070-.080) .130 (.120-.130) .250 (.240-.280) 1285
60 years and older .174 (.168-.179) .090 (.080-.090) .160 (.150-.160) .450 (.380-.530) 1716
Males Total, 3 years and older .141 (.138-.145) .080 (.070-.080) .140 (.130-.140) .280 (.270-.300) 3021
3–5 years .136 (.127-.146) .080† (.050-.080) .130 (.120-.140) .250† (.210-.340) 120
6–11 years .134 (.126-.143) .080 (.060-.080) .120 (.110-.130) .240 (.200-.310) 264
12–19 years .129 (.124-.134) .060 (.060-.070) .110 (.110-.120) .240 (.220-.280) 533
20–39 years .132 (.127-.138) .060 (.060-.070) .130 (.120-.130) .250 (.230-.290) 576
40–59 years .139 (.134-.144) .070 (.070-.080) .120 (.120-.130) .270 (.240-.300) 667
60 years and older .174 (.168-.180) .090 (.080-.100) .170 (.160-.170) .440 (.380-.490) 861
Females Total, 3 years and older .137 (.134-.140) .080 (.070-.080) .120 (.120-.130) .290 (.280-.310) 3157
3–5 years .122 (.113-.132) .070† (.070-.090) .120 (.110-.120) .200† (.160-.250) 109
6–11 years .125 (.117-.134) .070 (.060-.080) .110 (.110-.130) .210 (.180-.270) 231
12–19 years .119 (.114-.125) .070 (.060-.070) .100 (.100-.110) .230 (.200-.300) 540
20–39 years .127 (.123-.131) .060 (.060-.070) .110 (.110-.120) .260 (.250-.280) 804
40–59 years .132 (.128-.137) .080 (.070-.080) .130 (.120-.130) .250 (.220-.300) 618
60 years and older .173 (.166-.181) .090 (.080-.090) .160 (.150-.160) .450 (.370-.570) 855
† Estimate is subject to greater uncertainty due to small cell size.
1 Water-Soluble Vitamins & Related Biochemical Compounds 29 29
References
Baik HW, Russel RM. Vitamin B12 deficiency in the elderly. Annu Rev Nutr. 1999;19:357-77.
Czeizel AE, Dudas I. Prevention of the first occurrence of neural-tube defects by periconceptional vitamin supplementation. N Engl J Med. 1992;327:1832-5.
French AE, Grant R, Weitzman S, Ray JG, Vermeulen MJ, Sung L, et al. Folic acid food fortification is associated with a decline in neuroblastoma. Clin Pharmacol Ther. 2003;74:288-94.
Gibson RS. Principles of nutritional assessment. New York: Oxford University Press; 1990.
Halsted CH. Intestinal absorption of dietary folates. In: Picciano MF, Stokstad ELR, Gregory JF, editors. Folic acid metabolism in health and disease. New York: Wiley-Liss, Inc.; 1990. p. 23-45.
Hølleland G, Schneede J, Ueland PM, Lund PK, Refsum H, Sandberg S. Cobalamin deficiency in general practice. Assessment of the diagnostic utility and cost-benefit analysis of methylmalonic acid determination in relation to current diagnostic strategies. Clin Chem. 1999;45:189-98.
Institute of Medicine, Food and Nutrition Board. Dietary reference intakes: thiamin, riboflavin, niacin, vitamin B6, folate, vitamin B12, pantothenic acid, biotin, and choline. Washington, D.C.: National Academy Press; 1998.
Jacques PF, Selhub J, Bostom AG, Wilson PF, Rosenberg IH. The effect of folic acid fortification on plasma folate and total homocysteine concentrations. N Engl J Med. 1999;340:1449-54.
Life Sciences Research Office, Center for Food Safety and Applied Nutrition. Assessment of the folate nutritional status of the U.S. population based on data collected in the Second National Health and Nutrition Survey, 1976–1980. Washington, D.C.: U.S. Food and Drug Administration, Department of Health and Human Services; 1984.
Life Sciences Research Office, Center for Food Safety and Applied Nutrition. Assessment of folate methodology used in the Third National Health and Nutrition Survey (NHANES 1988–1994). Washington, D.C.: U.S. Food and Drug Administration, Department of Health and Human Services; 1994.
MRC Vitamin Study Research Group. Prevention of neural tube defects: results of the Medical Research Council Vitamin Study. Lancet. 1991;338:131-7.
Pfeiffer CM, Caudill SP, Gunter EW, Osterloh J, Sampson EJ. Biochemical indicators of B vitamin status in the U.S. population after folic acid fortification: results from the National Health and Nutrition Examination Survey, 1999–2000. Am J Clin Nutr. 2005;82:442-50.
Pfeiffer CM, Johnson CL, Jain RB, Yetley EA, Picciano MF, Rader JI, Fisher KD, Mulinare J, Osterloh J. Trends in blood folate and vitamin B12 concentrations in the United States, 1988–2004. Am J Clin Nutr. 2007;86:718-27.
Pfeiffer CM, Osterloh JD, Kennedy-Stephenson J, Picciano MF, Yetley EA, Rader JI, Johnson CL. Trends in circulating concentrations of total homocysteine among US adolescents and adults: findings from the 1991–1994 and 1999–2004 National Health and Nutrition Examination Surveys. Clin Chem. 2008;54:801-13.
Selhub J, Jacques PF, Wilson PWF, Rush D, Rosenberg IH. Vitamin status and intake as primary determinants of homocysteinemia in an elderly population. JAMA. 1993;270:2693-8.
National Report on Biochemical Indicators of Diet and Nutrition in the U.S. Population 1999-2002 30

Senti FR, Pilch SM. Analysis of folate data from the Second National Health and Nutrition Examination Survey (NHANES II). J Nutr. 1985;115:1398–402.
U.S. Centers for Disease Control and Prevention. Recommendations for the use of folic acid to reduce the number of cases of spina bifida and other neural tube defects. Morb Mort Wkly Rep. 1992;41(No. RR-14):001.
U.S. Department of Health and Human Services. Healthy people 2010: understanding and improving health. 2nd ed. Washington, D.C.: U.S. Government Printing Office; November 2000.
U.S. Food and Drug Administration. Food standards: amendment of standards of identity for enriched grain products to require addition of folic acid. Final rule. Fed Regist. 1996a;61(44):8781–97.
U.S. Food and Drug Administration. Food labeling: health claims and label statements; folate and neural tube defects. Final rule. Fed Regist. 1996b;61(44):8752–81.
Williams LJ, Rasmussen SA, Flores A, Kirby RS, Edmonds LD. Decline in the prevalence of spina bifida and anencephaly by race/ethnicity: 1995-2002. Pediatrics. 2005;116:580–6.
Wollensen F, Brattstrom L, Refsum H, Ueland PM, Berglund L, Berne C. Plasma total homocysteine and cysteine in relation to glomerular filtration rate in diabetes mellitus. Kidney Int. 1999;55:1028–35.
Wright JD, Bialostosky K, Gunter EW, Carroll MD, Najjar MF, Bowman BA, et al. Blood folate and vitamin B12: United States, 1988-1994. National Center for Health Statistics. Vital Health Stat Series No. 11(243), 1998.
Yang Q, Botto LD, Erickson JD, Berry RJ, Sambell C, Johansen H, et al. Improvement in stroke mortality in Canada and the United States, 1990–2002. Circulation. 2006;113:1335–43.
1 Water-Soluble Vitamins & Related Biochemical Compounds 31