Embed Size (px)
Citation preview

Session 1668
Virtual Instruments Revitalize an UndergraduateMeasurements and Instrumentation Course
Roy R. Craig, Jr. and Edward L. McConnell
Department of Aerospace Engineering and Engineering Mechanics,The University of Texas at Austin, Austin, TX 78712 /
National Instruments, 6504 Bridge Point Parkway, Austin, TX 78730
Abstract
Measurements and Instrumentation (M&I) is a 3-hour, required, junior-level course inthe Aerospace Engineering curriculum at The University of Texas at Austin. In Fall 1994 amajor restructuring of the course occurred that was centered around the shift to digital dataacquisition through the use of virtual instruments (VI’s) based on the LabVIEW™ software.1
This paper discusses the development of the VI’s used in the course, the laboratory exercisesthat comprise the course, and the improvements in student morale and report-writing skills thathave resulted from the restructuring of the course.
1. Introduction
Measurements and Instrumentation (M&I) is a 3-hour, required, junior-level course inthe Aerospace Engineering curriculum at The University of Texas at Austin. A confluence ofcircumstances occurred in the early 1990’s that led to a major restructuring of the course: theearly medical retirement of the principal course instructor; the need to incorporate use of the thecomputer in the measurements course both for data acquisiton and for report preparation; theneed to incorporate digital signal processing concepts in the course; and the desire to form aclose working relationship with National Instruments, a local Austin company that was (and is)in the forefront of virtual instrumentation technology. The revised course was first offered inFall 1994, but revision is still in process.
Five major objectives were set for the reorganized M&I course: (1) to introduce thestudents to the fundamentals of digital signal processing, (2) to provide the students withseveral VI’s with which to acquire and save data for later inclusion in their formal reports, (3)to introduce the students to modern methods of modal testing of structures, (4) to have studentsdesign a measurement system, incorporating product information acquired via the internet, and,
1 LabVIEW is a trademark of National Instruments, Austin, TX.
Page 4.591.1

finally, (5) to require a substantial upgrading of the quality of the technical reports produced bythe students. The revised course admirably meets all of these objectives.
Reference 1 provides a survey of modern computer-based experiments, several of whichare similar to the lab exercises described in this paper. The reader will find numerousproceedings papers and web resources for computer-based labs, such as Refs. 2 and 3,respectively.
The catalog description of the course is:
Design of measurement systems; standards; calibration; digital signal processing,time-domain and frequency-domain representation of data; transducers andsignal conditioning; measurement of acceleration, displacement, force, length,strain, and temperature; safety. Written reports. Two lecture hours and threelaboratory hours a week for one semester.
The prerequisites for the course are:
EM 319 (Mechanics of Solids), EE 331K (Electric Circuits and Electronics), andcredit or registration for an approved communication elective.
2. Course Syllabi
As noted in the catalog description given above, there are two 50-minute lectures perweek and one 3-hour, hands-on laboratory session per week. There are five lab stations withidentical equipment, and the students work in two- or three-person teams. Although a fewtopics, such as lab safety, are touched upon in the lectures, the course is primarily defined bythe topics of the laboratory exercises. Prior to the F94 revision, the topics covered by labexercises were:
Figure 1. Laboratory Exercises Prior to Revision of the Course
The principal data-recording instruments were pencil and paper, and a digital oscilloscope fittedwith a Polaroid camera. Four “formal” lab reports were written by each student to satisfy theuniversity’s Substantial Writing Component requirement, which is discussed later; the
1) Introduction to Electronic Instrumentation 2) First-Order System Behavior 3) Second-Order System Behavior 4) Measurement of Length and Displacement 5) Force and Inertia Measurement 6) Strain Measurement 7) Dynamic Strain Measurement 8) Acceleration Measurement 9) Fluid-Flow Measurement10) Temperature Measurement (Thermocouples)
Page 4.591.2
remaining lab reports were “informal,” consisting of the answering of several homeworkexercises employing data taken in the lab.
The lab topics covered in the revised course are:
Figure 2. Laboratory Exercises After Revision of the Course
Because the students have other required fluid-flow labs, in order to make room for thenew digital signal processing topic the fluid-flow measurement topic was dropped completely.The total number of labs was reduced by one to make it possible to “stiffen” the formal-reportrequirement and to introduce a design exercise.
3. Virtual Instruments
A virtual instrument (VI) is essentially software that allows a personal computer to actas a laboratory instrument (e.g., an oscilloscope, a data-logger, a function generator, etc.).Analog input/output operations may be handled various ways, for example, by the computer’sPCI bus or serial port, through a GPIB interface, or through a plug-in board. The LabVIEWsoftware was used to modify two sample VI’s to produce a virtual oscilloscope, V’scope, and avirtual two-channel spectrum analyzer, Spectrum Analyzer, for the Apple Macintosh IIcicomputers that were purchased for the Measurements Lab. The I/O operations for these twoVI’s are handled by a National Instruments NB-A2150F dynamic signal acquisition (DSA)board. Each VI consists of three main parts: the front panel, the block diagram, and theicon/connector. The front panel contains buttons, knobs, and switches that are similar to thoseon a conventional piece of hardware. These controls are operated by using the computer’smouse or by entering numerical values directly at the keyboard. The block diagram representsthe source code of the VI. Mathematical functions, I/O operations, etc. are represented asicons, and data is transferred through connecting “wires.” The icon/connector acts as therepresentation of the VI and as the calling interface when multiple VI’s are linked together.Figure 3 shows the front panel of the new Strain Analyzer (See Section 7), and Fig. 4 shows itsblock diagram.[4]
1) Introduction to Electronic Instrumentation 2) First-Order System Behavior*3) Second-Order System Behavior; Virtual Oscilloscope 4) Measurement of Length and Displacement*5) Digital Signal Processing; Virtual Two-Channel Spectrum Analyzer*6) Measurement of Force and Acceleration; Ratio Calibration*7) Beam Vibration†8) Measurement of Strain†9) Measurement of Temperature (Thermocouples)
* New, or substantially revised, in F94. † Currently under revision.
Page 4.591.3

Figure 3. The Front Panel of the LabVIEW Strain Analyzer Virtual Instrument.
Figure 4. Block Diagram of the LabVIEW Strain Analyzer Virtual Instrument.
Page 4.591.4
During the semester prior to the F94 first offering of the revised course, a graduateresearch assistant was employed 20 hrs/wk to work with the first author in defining thefunctions to be incorporated in the two custom VI’s and to carry out the programming of theVI’s. Development of the two VI’s and development of the new and revised lab exercisesproceeded simultaneously, with the first author developing the lab exercises and specificationsfor the VI’s, and the RA developing the VI’s. The graphical programming environment ismuch more intuitive than text-based programming, and the ability to collapse code into sub-VI’s, which can be called by other VI’s, makes applications modular and easy to modify. Infact, both V’scope and Spectrum Analyzer were constructed by modifying existing VI’s thatwere supplied along with the LabVIEW software. Once completed, the two VI’s were“compiled,” and the two executable files were saved on each of the lab computers. Students areexpected to use the VI’s much as they would a conventional instrument, and are not required todo any LabVIEW programming.
4. Formal Reports; Substantial Writing Component Course Requirements
One of the objectives of the revision of the M&I course was to institute a substantialupgrading of the quality of the formal technical reports produced by the students. TheUniversity of Texas at Austin has a university-wide writing requirement that each student mustsatisfy. Beyond freshman English, the student is required to pass so-called Substantial WritingComponent courses, in, or closely related to, the student’s major. The three courses thatAerospace Engineering students take to meet the Substantial Writing Component requirementare:
• CE 333T -- Technical Writing (or equivalent)• ASE 369K -- Measurements and Instrumentation• ASE 363Q -- Design and Testing of Aerospace Structures
Yes, all of these are engineering courses! But the Civil Engineering faculty person in charge ofCE 333T has a Ph.D. in English, as do the faculty of the other similar engineering courses.Two of the above courses, CE 333T and ASE 363Q, also have public speaking requirements inaddition to the writing requirement. The ASE-EM Visiting Committee members now raveabout the quality of the student presentations, undergraduate as well as graduate, at eachmeeting of the committee.
The ASE courses have strict requirements on the amount of writing required; thestudents’ reports must be graded by an “English” TA as well as graded for technical content;and a report must be submitted to the Dean of Engineering at the end of every semester. Atpresent, the writing requirement in ASE 369K is met by having each student write three formaltechnical reports (i.e., computer-generated reports), do a re-write of the first report, and producea brief formal writeup of the design of a measurement system. Strong emphasis is placed on the“engineering” format of the report -- equations, tables, figures, references, etc. Sample pagesfrom a formal lab report and a final design project report are included in the Appendix.
Page 4.591.5

5. The New/Revised Labs
The new, or substantially revised, laboratory exercises are listed below, along with themajor new features that were incorporated:
Figure 5. Features of New or Revised Laboratory Exercises, F94.
++ Lab 3: Second-Order System Behavior; Virtual Oscilloscope -- Lab 1, Introduction toElectronic Instrumentation, and Lab 2, First-Order System Behavior, were not changed in F94.The digital oscilloscope was retained in Lab 2 so that students would have some experiencewith a conventional instrument-type oscilloscope. Measurement of the response of an RCcircuit to a step voltage input and response to a sinusoidal voltage input enable students to learnconcepts such as rise time, frequency response, phase lag, etc. The topics covered in Lab 3 are:
• Virtual Oscilloscope -- a familiarization exercise in the use of the V’scope VI• Frequency Response of a Second-Order System -- use of scope cursors to
measure response amplitude and phase lag of an RLC circuit subjected tosinusoidal input
• Response of a 2nd-Order System to a Square-Wave Input -- an exercise todemonstrate the effect of the RLC circuit on a square-wave input
Except for during the summer term, Lab 3 forms the basis for the first formal technical report.In conjunction with the assignment of this report there is one lecture on English grammar, etc.,by the English TA, and one lecture by the instructor on elements of a formal engineeringtechnical report. Plots that have been saved to disk by the VI are included as figures in thisreport. After copies of this report have been graded separately by the instructor and by the
Lab Status New Feature(s)
3) Second-Order System Behavior; Rev. V’scopeVirtual Oscilloscope
6) Digital Signal Processing New DSP topics; Spectrum Analyzer
7) Measurement of Force and Acceleration; New Piezo. F&A; FRF’s; RatioRatio Calibration Calib.; Spectrum Analyzer
8) Beam Vibration New FRF’s; Modes and frequencies
Page 4.591.6
English TA, the students are permitted (encouraged) to re-write this report, hopefully for abetter grade.
++ Lab 5: Digital Signal Processing: Virtual Two-Channel Spectrum Analyzer -- This newsubject was added because of its critical importance in many aspects of aerospace engineering,from structural dynamics, to controls, to satellite communications. Among the topics treated inlecture are: time domain, frequency domain, Fourier transforms, sampling, leakage, aliasing,and frequency response functions. The topics covered in the laboratory exercise for Lab 5 are:
• Virtual Spectrum Analyzer -- a familiarization exercise in the use of theSpectrum Analyzer VI
• Periodic Signals -- an exercise to compare theoretical and measured Fouriercoefficients of a square-wave signal, and also of a saw-tooth signal
• Leakage -- an exercise to demonstrate the effect of the length of the data-acquisition time window in relationship to the period of a sinusoidal signal
• Nyquist Sampling Theorem; Aliasing -- an exercise to illustrate the effect ofsampling frequency on the spectrum of a signal, and to illustrate the need forthe anti-aliasing filter on the data-acquisiton board (NB-A2150F)
This lab is usually written up as the second formal lab report. Again, plots that have beensaved to disk by the VI are included as figures in this report. For illustration of thephenomenon of leakage, Fig. 6 shows the front panel of the Spectrum Analyzer VI with thetime-domain and frequency-domain representations of a sinusoidal signal that is periodic in thetime window. Figure 7 shows how the corresponding plots for a sinusoidal signal that is notperiodic in the time window might appear in a student’s report.
Page 4.591.7

Figure 6. Front Panel of the Spectrum Analyzer VI; Illustration of Leakage Phenomenon
++ Lab 6: Measurement of Force and Acceleration; Ratio Calibration -- This new subject wasadded because of the importance of piezoelectric transducers of various types, including forcecells and accelerometers; the importance of frequency response functions in systemidentification; and the use of a modern frequency-domain calibration technique, ratiocalibration. Among the topics treated in lecture are: principles of seismic accelerometers, andcharacteristics of piezoelectric transducers for measuring frequency response. The topicscovered in the laboratory exercise for Lab 6 are:
• Time-Domain Windows -- introduction to the “force window” and the“exponential window”
• Impulse-Force Hammer; Spectrum of an Impulse -- an exercise todemonstrate how a force impulse can be created by use of a hammer with anattached piezoelectric force cell, and to demonstrate the effect of tip hardnesson the spectrum of the impulse force
• Ratio Calibration -- a calibration exercise based on F(f)=mA(f) that employsan impulse hammer, an accelerometer, and a calibration mass, and uses theSpectrum Analyzer VI to form the frequency response function of A/F
This lab is usually written up as the third formal lab report. Again, plots that have been savedto disk by the VI are included as figures in this report. P
age 4.591.8
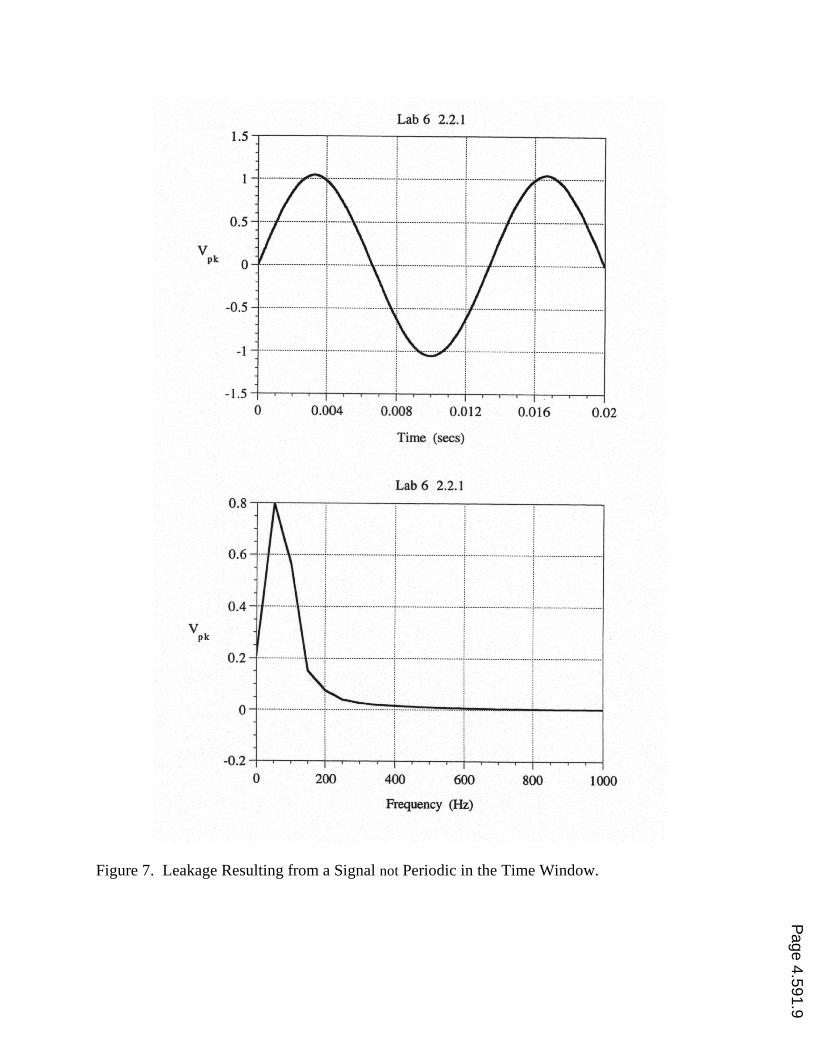
Figure 7. Leakage Resulting from a Signal not Periodic in the Time Window.
Page 4.591.9
++ Lab 7: Beam Vibration-- This new subject, a follow-on to Lab 6, was added as anintroduction to experimental modal analysis, that is, to the experimental determination of thenatural frequencies and mode shapes of a simple structure. In the ASE 363Q senior designcourse, Design and Testing of Aerospace Structures, a number of design teams have projectsthat make use of this introduction to modal testing. The lab exercise involves the use of theimpulse hammer and accelerometer to acquire acceleration/force frequency response functionsfor a simple cantilever beam. Natural frequencies and mode shapes are estimated from theseFRF’s and are compared to modal parameters based on theory. This lab is sometimes writtenup as the third formal lab report.
6. End-of-Semester Design Project
At the end of the semester the students are assigned a design project that is to beresearched and written up on the computer. Students are expected to use the Internet to obtainproduct information to include in their reports. Topics that have been assigned include a strain-gauged support for a spacecraft vibration test setup, use of piezoelectric strain gauges andconventional foil gauges to measure dynamic strain in a snowboard, and measurement of strainin the shaft of a golf club. The last page of this paper is a sample page from a golf-club report.
7. Subsequent Revisions and Revisions in Progress
In the fall of 1997 a decision was made to replace the MAC IIci’s with Dell PC’s and touse the oscilloscope and spectrum analyzer in the National Instruments VirtualBench2 suite ofVI’s. The reasons that motivated these changes were the dominance of PC’s over MAC’s in theentire field of engineering computations and measurements, and the desire to be VI-compatiblewith off-the-shelf National Instruments VI’s. At the same time, National Instruments agreed toreplace the MAC DSA boards with newly designed DSA boards for the PC’s. In the spring of1998 PC’s were acquired for the Measurements Lab, and Lab 3 was converted from V’scope tothe VirtualBench-Scope. Hardware delays and software incompatibility have delayedreplacement of the MAC-based Spectrum Analyzer, but PCI-4451 boards have been acquired,and the transition is expected to occur by the summer of 1999.
As noted in Fig. 2, Lab 8 -- Measurement of Strain and Lab 9 -- Measurement ofTemperature (Thermocouples) are currently undergoing revision. Although the content of theselabs will not be changed substantially, virtual instruments will be employed for dataacquisition. In fact, a three-person team in the senior design course, ASE 363Q -- Design andTesting of Aerospace Structures, worked on revision of the strain-gauge lab and developed theLabVIEW VI illustrated in Figs. 3 and 4 above. This team worked with National Instruments todevelop recommendations for the new signal-conditioning hardware to be acquired.
2 VirtualBench is a registered trademark of National Instruments, Austin, TX.
Page 4.591.10
8. Benefits and Drawbacks
As indicated by the title of this paper, significant benefits have accrued from therevisions incorporated in the Measurements and Instrumentation course. Among them are:
• Students use the computer extensively throughout the entire ASE curriculum,and it is natural for them to use the computer in this course.
• Students benefit from this exposure to virtual instruments.• The LabVIEW VI’s provide a very useful instrument for teaching the
concepts of digital signal processing, frequency response, etc.• The LabVIEW VI’s make it possible for students to save data to computer
files for later use in their formal reports.• The quality of the formal reports, which are graded for both technical content
and for English, has improved “1000%,” since all text, equations, tables, andplots are computer generated. (See the first page of the Appendix.)
Several drawbacks should be mentioned:• Because so much is now possible in terms of experiments to run and report
features to expect, it is very tempting to overload the course.• Plagiarism can be a problem! It becomes an easy matter for students to
“borrow” computer files containing “A” reports. Some students, even topstudents, don’t seem to be able to resist the temptation.
• Computers are not fool-proof! The lab computers stand idle a good bit of theweek because there is too much likelihood that the files necessary to run theVI’s and other applications during the M&I labs would be messed up ifgeneral use of the computers were to be permitted.
• Maintenance of the computers and software can, particularly if left to theTA’s, be difficult. Taking advantage of new hardware or software can posecompatibility problems.
9. Conclusions
The benefits of using LabVIEW-based data acquisition in the Aerospace EngineeringMeasurements and Instrumentation course have far outweighed the drawbacks. Students ingeneral have reacted very favorably to the course in its present form; their main complaint hasbeen the amount of effort they must expend to produce the formal reports.
10. References
1. Neebel, D. J., Blandino, J. R., and Lawrence, D. J., A Survey of Modern Computer-Based Experiments, Part No. 321884B-01, National Instruments, Austin, TX, March1998.
Page 4.591.11
2. Eibeck, P. A., “Multimedia Courseware Support for the Instruction of EngineeringExperimentation,” Proceedings of Frontiers in Education 23rd Annual Conference,sponsored by ASEE and IEEE, Washington, D.C., Nov. 6-9, 1993, pp. 135-139.
3. Hewlett-Packard website: www.tmo.hp.com/tmo/iia/edcorner/English/ 4. Sierra, A., Linehan, D., and Thornton, D., ASE 369K Strain Gage Lab Employing a
LabVIEW VI Design Project - Final Report, ASE-EM Department, The University ofTexas at Austin, Austin, TX, Dec. 1998.
Biographical Information
ROY R. CRAIG, JR.
Roy R. Craig, Jr. is a Professor of Aerospace Engineering and Engineering Mechanics at TheUniversity of Texas at Austin. He joined the UT-Austin faculty in 1961, and currently holdsthe John J. McKetta Energy Professorship in Engineering. Dr. Craig has received numerousteaching awards, including the J. Leland Atwood Award, bestowed jointly by the ASEE and theAmerican Institute of Aeronautics and Astronautics in 1997. He is the author of two textbooks,Structural Dynamics - An Introduction to Computer Methods and Mechanics of Materials, andof papers on modeling, identification, and control of flexible structures, and the use ofcomputers in engineering education. Dr. Craig received a B.S. degree in Civil Engineeringfrom the University of Oklahoma, and M.S. and Ph.D. degrees from the University of Illinois atUrbana-Champaign. He is a Fellow of AIAA and holds membership in ASEE, ASME, andSES.
EDWARD L. MCCONNELL
Edward McConnell is the Computer-Based Instruments Marketing Manager for NationalInstruments. His job responsibilities include the strategic marketing and product managementof the company's computer-based instruments. He joined National Instruments in 1990 afterworking as a design engineer for BTS, Inc. in Germany. He holds a B.S. in electricalengineering and a B.A. in philosophy, both from Rice University. McConnell is a member ofthe IEEE, Eta Kappa Nu, and Tau Beta Pi.
Appendix
Sample pages that illustrate the quality of the formal lab reports and the design projectreport are reproduced here.
Page 4.591.12

Page 4.591.13

Page 4.591.14