Embed Size (px)
Citation preview

November 2013
Vipshop Holdings Limited Investor Presentation
1
Disclaimer
This presentation contains forward-looking statements. These statements are made under the “safe
harbor” provisions of the U.S. Private Securities Litigation Reform Act of 1995. These forward-looking
statements can be identified by terminology such as “will,” “expects,” “anticipates,” “future,” “intends,”
“plans,” “believes,” “estimates” and similar statements. Among other things, the business outlook and
quotations from management in this announcement, as well as Vipshop’s strategic and operational plans,
contain forward-looking statements. Vipshop may also make written or oral forward-looking statements in
its periodic reports to the U.S. Securities and Exchange Commission (“SEC”), in its annual report to
shareholders, in press releases and other written materials and in oral statements made by its officers,
directors or employees to third parties. Statements that are not historical facts, including statements about
Vipshop’s beliefs and expectations, are forward-looking statements. Forward-looking statements involve
inherent risks and uncertainties. A number of factors could cause actual results to differ materially from
those contained in any forward-looking statement, including but not limited to the following: Vipshop’s goals
and strategies; Vipshop’s future business development, results of operations and financial condition; the
expected growth of the online discount retail market in China; Vipshop’s ability to attract customers and
brand partners and further enhance its brand recognition; Vipshop’s expectations regarding demand for
and market acceptance of flash sales products and services; competition in the discount retail industry;
fluctuations in general economic and business conditions in China and assumptions underlying or related
to any of the foregoing. Further information regarding these and other risks is included in Vipshop’s
registration statement on Form F-1, as amended, filed with the SEC. All information provided in this
presentation is as of the date of this presentation, and Vipshop does not undertake any obligation to
update any forward-looking statement, except as required under applicable law.

2
China's Leading Online Discount
Retailer for Brands
Vipshop
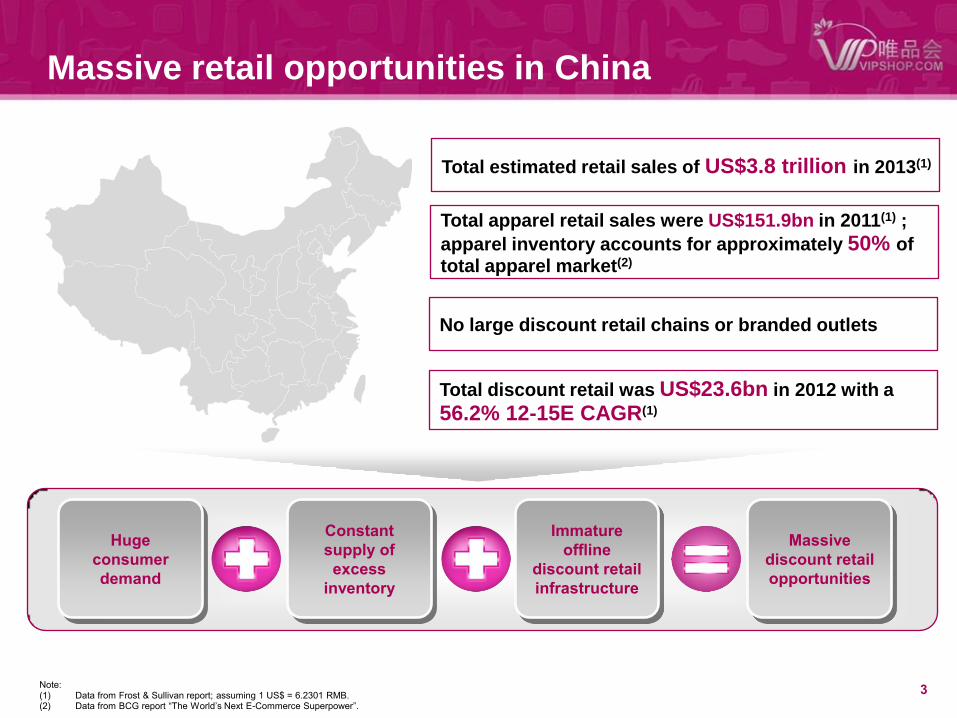
No large discount retail chains or branded outlets
Massive retail opportunities in China
3
Massive
discount retail
opportunities
Immature
offline
discount retail
infrastructure
Constant
supply of
excess
inventory
Total estimated retail sales of US$3.8 trillion in 2013(1)
Total apparel retail sales were US$151.9bn in 2011(1) ;
apparel inventory accounts for approximately 50% of total apparel market(2)
Total discount retail was US$23.6bn in 2012 with a
56.2% 12-15E CAGR(1)
Note: (1) Data from Frost & Sullivan report; assuming 1 US$ = 6.2301 RMB. (2) Data from BCG report “The World’s Next E-Commerce Superpower”.
Huge
consumer
demand
4
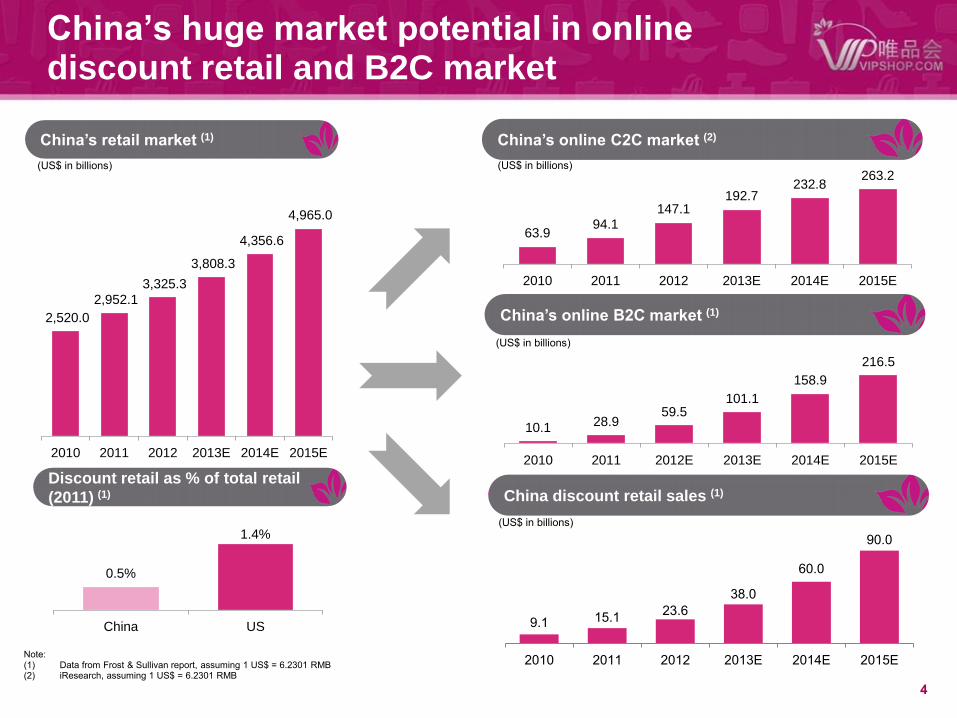
China’s huge market potential in online discount retail and B2C market
Note: (1) Data from Frost & Sullivan report, assuming 1 US$ = 6.2301 RMB (2) iResearch, assuming 1 US$ = 6.2301 RMB
2,520.0
2,952.1
3,325.3
3,808.3
4,356.6
4,965.0
2010 2011 2012 2013E 2014E 2015E
China’s retail market (1)
Discount retail as % of total retail
(2011) (1)
0.5%
1.4%
China US
63.9 94.1
147.1 192.7
232.8 263.2
2010 2011 2012 2013E 2014E 2015E
(US$ in billions)
China’s online C2C market (2)
China’s online B2C market (1)
China discount retail sales (1)
(US$ in billions)
(US$ in billions)
(US$ in billions)
10.1 28.9 59.5
101.1
158.9
216.5
2010 2011 2012E 2013E 2014E 2015E
9.1 15.1 23.6
38.0
60.0
90.0
2010 2011 2012 2013E 2014E 2015E

Online: the future of discount retailing in China
Top 20 retailers account
for 24% market share(1)
Consumers in China have to go online for branded discount products
5
Note: (1) According to Frost and Sullivan report (2) As of 2012 year end, including 1,867 Marmaxx stores and 374 HomeGoods stores in the US, from 2012 T.J.Maxx’s company presentation
(3) As of February 2013, including 1,091 dress-for-less stores and 108 dd’s DISCOUNTS stores in the US, from February 2013 Ross’ company investor overview
(4) As of February 2013, from Premium Outlet’s company website
(5) As of February 2013, from Tanger Outlet’s company factsheet
(6) From Balian Outlets Plaza company website
(7) From Beijing Scitech company website
2,241 stores(2) 1,199 stores(3)
67 outlets(4) 38 outlets(5)
China's offline discount retail is extremely underdeveloped
China U.S.
None
Top 20 retailers account
for 7% market share(1)
24 square feet per capita(1) 2 square feet per capita(1)
3 outlets(6) 3 outlets(7)
Poor offline retail infrastructure in China
Fragmented retail market in China
Lack of large off-price retailer in China
Underdeveloped offline outlet stores in China

6
China: A more attractive market opportunity
Market positioning
Brands have well established
online presence and capabilities
Need to pay for inventory upfront;
Products can not be returned to
suppliers
Mostly focused on high-end and
luxury markets
U.S.
Discount / outlet retail channels
saturated for mass market
merchandise; full price retailers are
establishing own outlets
Broad universe of popular brands
for mass market
Limited upfront deposit;
Most products can be returned to
suppliers
Brands have largely rely on third
party platforms to build online
presence
China
Lack of well-developed discount /
outlet retail channel Offline channels
Online channels
Working capital
requirement
Broader and underpenetrated addressable market
Better business model Conclusion
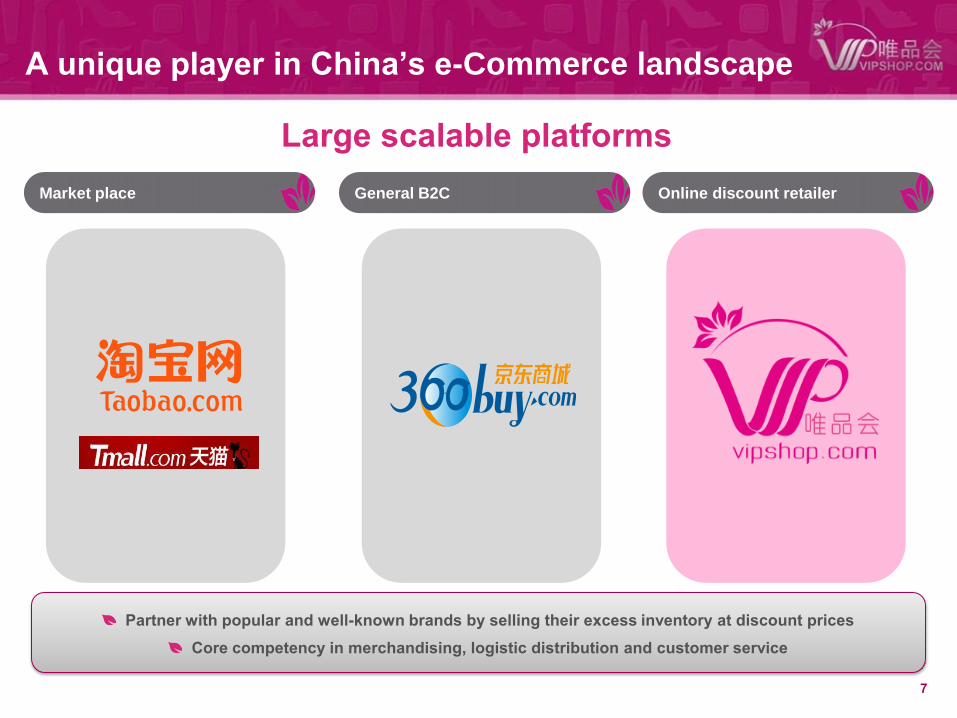
A unique player in China’s e-Commerce landscape
7
Online discount retailer Market place General B2C
Partner with popular and well-known brands by selling their excess inventory at discount prices
Core competency in merchandising, logistic distribution and customer service
Large scalable platforms

8
Rapid increase of new active customers
Rapid increase of repeat customers
High and stable rate of orders from repeat customers
( in thousands) ( in thousands) ( in thousands)
Highly engaged and loyal customer base
255
1,330
3,312
787
1,708
2010 2011 2012 3Q12 3Q13
New active customers
804
6,681
20,457
4,966
10,659
927
7,269
21,919
5,433
11,712
86.7% 91.9% 93.3%
91.4%
91.0%
2010 2011 2012 3Q12 3Q13
Orders placed by repeat customers
Total orders
Orders placed by repeat customers
155
903
2,625
1,265
2,961
276
1,491
4,110
1,732
4,013
56.2% 60.6%
63.9%
73.0% 73.8%
2010 2011 2012 3Q12 3Q13
Repeat customers
Total active customers
Repeat customer as % of total customer

Preferred discount channel for popular brands
9
One-stop solution for brands
Professional team with deep brand knowledge
Fast inventory monetization
Minimal brand dilution
Clear industry leader(2)
Brand partners growth over time(1)
411
1,075
2,760
3,834
2010 2011 2012 9Mo. 13
2010 –9Mo.13 growth by 9.3x
Product categories
Children
Cosmetics
Home goods
Footwear Sportswear
Accessories Handbags
Apparel
9
Note: (1) Number of our brand partners is a cumulative number since 2009, which includes primarily brand owners, and to a lesser extent, brand distributors and resellers.
(2) As measured by total revenues in 2011, the number of registered members as of December 31, 2012 and the number of monthly unique visitors in December 2012, according to the Frost & Sullivan
Report.
Shoppers are loyal and so are our brand partners
Substantially all of our brand partners have returned to pursue additional sales opportunities with us
10
Operational expertise

Relationship with brands
Understanding of consumers
Business intelligence
system
Over 300 Specialized
Merchandising Staff
Excellent merchandising
11
Brand
selection
Sales
management
capability
Consumer
insights
Customized
marketing
Sales events
optimization
Over 6,500
brands
Deepening
brand
partnership
1
2
3

Flash sale requires differentiated logistics system
12
Additional capabilities on top of traditional B2C e-Commerce (1)
Sales cycle Short Long
Traditional B2C e-Commerce
Volume of throughput Large Small
Note:
(1) Comparison on per same-size warehouse basis.
Vipshop has successfully established customized and sophisticated logistics and warehouse
systems to cater to flash sale needs
Sales process
No. of SKUs handled
Fast
Large
Slow
Moderate
Reverse logistics Large Small
Snapshot of our warehouses
Flash sale

Highly customized and seamlessly integrated IT system for flash sales
13
Support huge traffic spikes during peak hours
CRM system
Expanding and cross-regional warehouse
management system
Data platform and BI
Time
Tra
ffic
12am 10am 12pm 12am
Merchant platform

High entry barriers
14
First Mover Advantage
Business model
Operational expertise
Economies of scale 1
2
3
4
Vipshop is well positioned in
China’s online discount retail
market
15
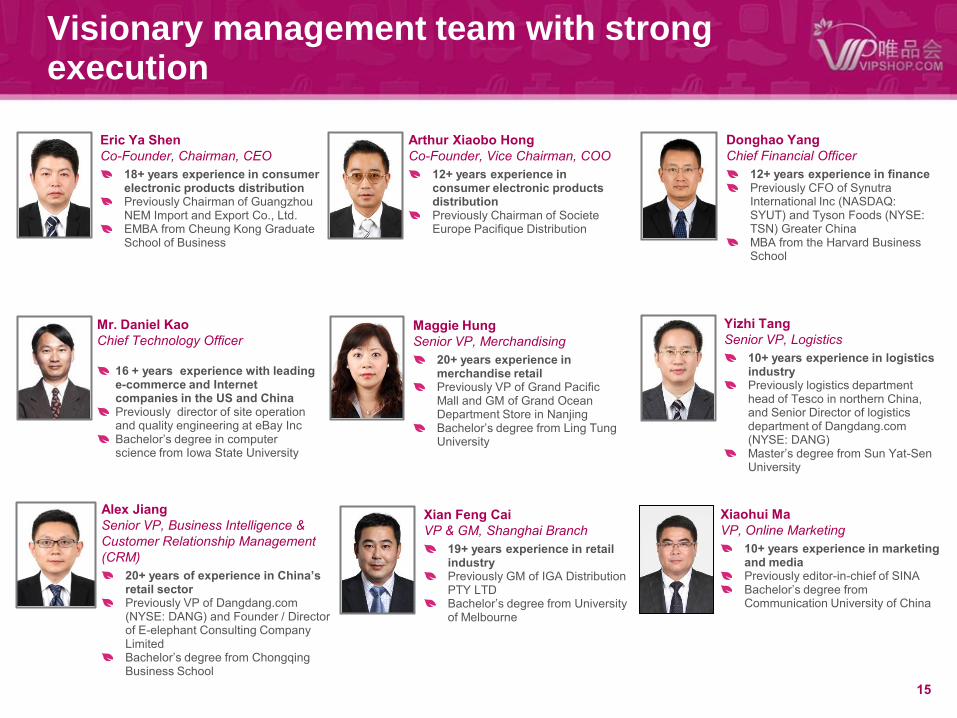
Visionary management team with strong execution
Donghao Yang
Chief Financial Officer
12+ years experience in finance Previously CFO of Synutra International Inc (NASDAQ: SYUT) and Tyson Foods (NYSE: TSN) Greater China MBA from the Harvard Business School
Maggie Hung
Senior VP, Merchandising
20+ years experience in merchandise retail Previously VP of Grand Pacific Mall and GM of Grand Ocean Department Store in Nanjing Bachelor’s degree from Ling Tung University
Yizhi Tang
Senior VP, Logistics
10+ years experience in logistics industry Previously logistics department head of Tesco in northern China, and Senior Director of logistics department of Dangdang.com (NYSE: DANG) Master’s degree from Sun Yat-Sen University
Eric Ya Shen
Co-Founder, Chairman, CEO
18+ years experience in consumer electronic products distribution Previously Chairman of Guangzhou NEM Import and Export Co., Ltd. EMBA from Cheung Kong Graduate School of Business
Xian Feng Cai
VP & GM, Shanghai Branch
19+ years experience in retail industry Previously GM of IGA Distribution PTY LTD Bachelor’s degree from University of Melbourne
Mr. Daniel Kao
Chief Technology Officer
16 + years experience with leading e-commerce and Internet companies in the US and China Previously director of site operation and quality engineering at eBay Inc Bachelor’s degree in computer science from Iowa State University
Arthur Xiaobo Hong
Co-Founder, Vice Chairman, COO
12+ years experience in consumer electronic products distribution Previously Chairman of Societe Europe Pacifique Distribution
Alex Jiang
Senior VP, Business Intelligence &
Customer Relationship Management
(CRM)
20+ years of experience in China’s retail sector Previously VP of Dangdang.com (NYSE: DANG) and Founder / Director of E-elephant Consulting Company Limited Bachelor’s degree from Chongqing Business School
Xiaohui Ma
VP, Online Marketing
10+ years experience in marketing and media Previously editor-in-chief of SINA Bachelor’s degree from Communication University of China
16
Financial highlights
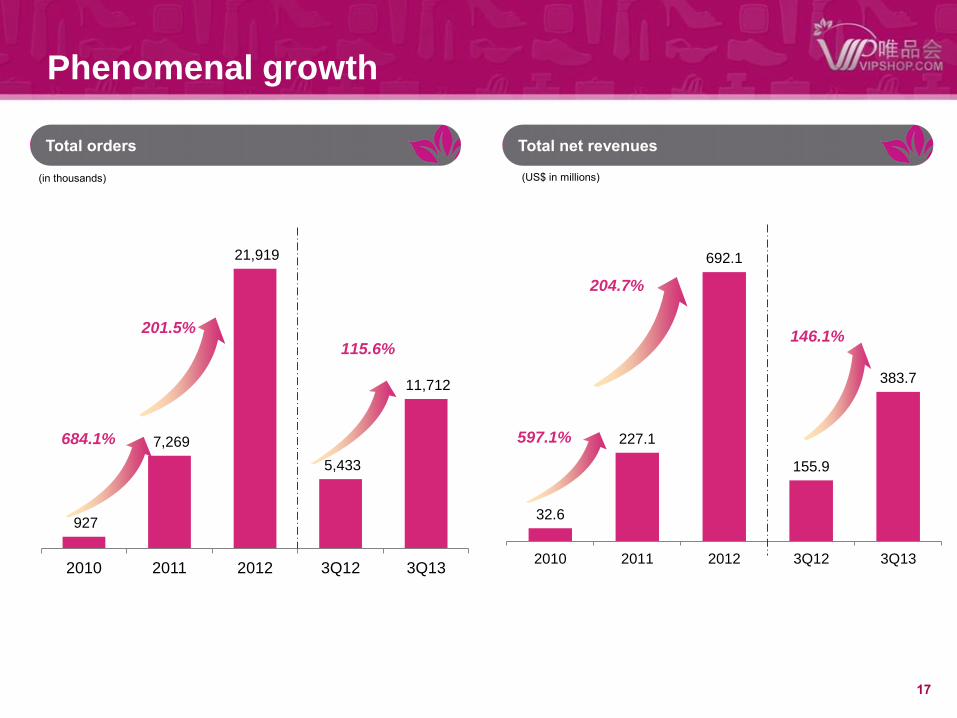
Phenomenal growth
17
Total net revenues
(US$ in millions)
Total orders
(in thousands)
927
7,269
21,919
5,433
11,712
2010 2011 2012 3Q12 3Q13
684.1%
201.5%
115.6%
32.6
227.1
692.1
155.9
383.7
2010 2011 2012 3Q12 3Q13
597.1%
204.7%
146.1%

18
Steady margin expansion
Quarterly gross profit and gross margin
(US$ in millions )
Strong and defensible margins: • Brands often sign exclusive deals to minimize brand dilution (>900 exclusive brands)
• Brands only liquidating excess inventory (limited quantity = inability to price shop)
• Brands want to efficiently monetize excess inventory and have little price sensitivity
4.9 7.4 10.0
21.0 21.4 29.6
34.8
68.7 72.8
82.6
93.0
17.0% 18.3%
19.0% 20.0%
21.2% 21.8% 22.3% 22.9% 23.4% 23.5% 24.2%
1Q11 2Q11 3Q11 4Q11 1Q12 2Q12 3Q12 4Q12 1Q13 2Q13 3Q13
Gross profit Gross margin

Continuous investment in logistics infrastructure to drive long term growth
19
(US$ in millions)
Fulfilment expenses (Non-GAAP) 1
Note: (1) All numbers are shown on a non-GAAP basis and excludes the impact from share-based compensation expenses
6.0 8.4
11.4
19.4 16.8
20.5 21.6
37.3 37.7 42.6
43.9
20.9% 20.7% 21.7%
18.4% 16.6%
15.1% 13.9% 12.4%
12.1% 12.1% 11.4%
1Q11 2Q11 3Q11 4Q11 1Q12 2Q12 3Q12 4Q12 1Q13 2Q13 3Q13
Fulfilment expenses (non-GAAP) Fulfilment as % of total net revenues

Tremendous operating leverage and historically low marketing expenses
20
Note: (1) All numbers are shown on a non-GAAP basis and excludes the impact from share-based compensation expenses
(US$ in millions)
General and administrative expenses (Non-GAAP) (1)
(US$ in millions)
Marketing expenses (Non-GAAP) (1)
1.7 2.3
4.6
6.6 5.8
6.6 7.3
12.4 13.0
15.0
17.3
5.7% 5.7%
8.7%
6.2% 5.8% 4.9% 4.7% 4.1% 4.2% 4.3% 4.5%
1Q11 2Q11 3Q11 4Q11 1Q12 2Q12 3Q12 4Q12 1Q13 2Q13 3Q13
Marketing expenses (non-GAAP)
Marketing as % of total net revenues
1.0
2.9 3.7 4.2 3.9 4.3 4.6
6.5 7.0
8.9
10.1
3.6%
7.2% 7.1%
4.0% 3.9% 3.2% 2.9%
2.2% 2.3% 2.5% 2.6%
1Q11 2Q11 3Q11 4Q11 1Q12 2Q12 3Q12 4Q12 1Q13 2Q13 3Q13
G&A expenses (non-GAAP)
G&A as % total net revenues

21
Note: (1) All numbers are shown on a non-GAAP basis and excludes the impact from share-based compensation expenses
(4.2)
(7.1)
(10.8) (11.2)
(6.5)
(4.2)
0.6
8.1 9.0 11.8 15.1
-14.6%
-17.6%
-20.6%
-10.6%
-6.4% -3.1%
0.4%
2.7% 2.9%
3.4%
3.9%
1Q11 2Q11 3Q11 4Q11 1Q12 2Q12 3Q12 4Q12 1Q13 2Q13 3Q13
Net income/loss (non-GAAP) Net margin (non-GAAP)
Net margin (Non-GAAP) (1)
(US$ in millions)
Net margin improvement

22
(in $ thousands) December 31, 2012 September 30, 2013
(Unaudited)
Cash and Cash Equivalents and Held-to-Maturity
Securities 210,570 481,699
Current Assets 381,952 749,328
Total Assets 398,917 772,262
Current Liabilities 316,334 560,031
Total Liabilities 316,334 560,031
Total Stockholder’s Equity 82,583 212,232
Current Ratio 1.2 1.3
Balance Sheet Highlights

23
Growth strategies
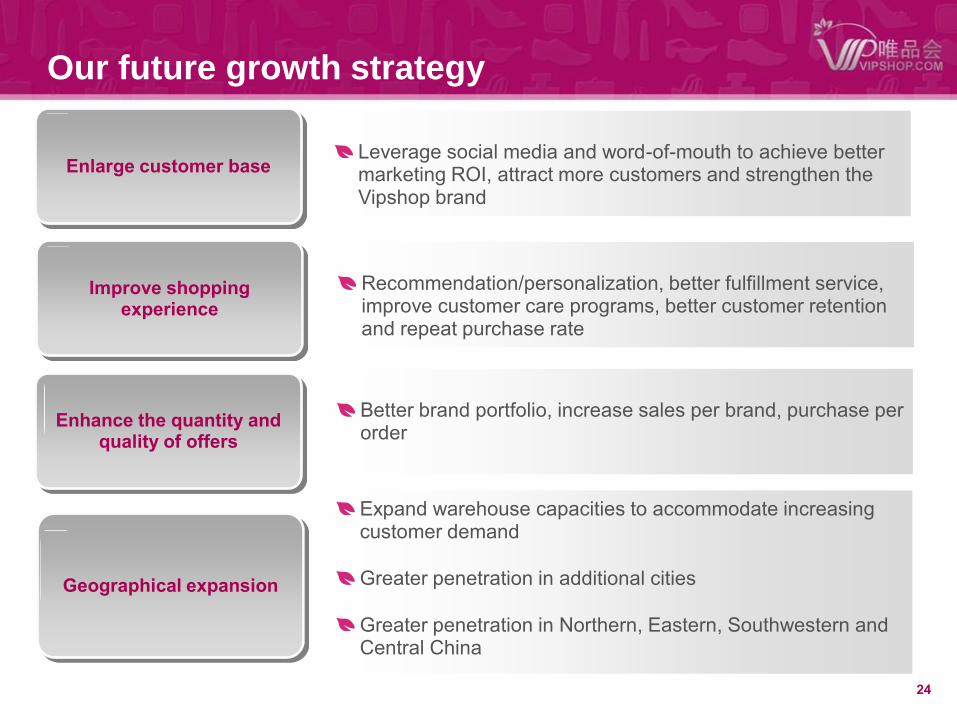
Our future growth strategy
24
Expand warehouse capacities to accommodate increasing customer demand
Greater penetration in additional cities
Greater penetration in Northern, Eastern, Southwestern and Central China
Geographical expansion
Leverage social media and word-of-mouth to achieve better marketing ROI, attract more customers and strengthen the Vipshop brand
Recommendation/personalization, better fulfillment service, improve customer care programs, better customer retention and repeat purchase rate
Better brand portfolio, increase sales per brand, purchase per order
Enlarge customer base
Improve shopping experience
Enhance the quantity and quality of offers

Major profitability drivers
25
Word-of-mouth ROI maximization
Cost control
Increased
Operating leverage
Stronger negotiation
power
Better pricing
Gross margin
Fulfillment
expense
Marketing
expense
G&A
expense
Distribution centers
build out Capacity utilization ramp up
Profitability
1
2
3
4

26
Key investment highlights
Market leadership position
Strong industry growth fundamentals 1
Highly engaged and loyal customer base
Superior operational expertise
2
3
4
Strong management team 5

27
Thank you!