Embed Size (px)
Citation preview

Vietnam’s Rice Policy: Recent Reforms and Future Opportunities
Chantal Pohl Nielsen* Danish Research Institute of Food Economics
Abstract
From being a chronic importer of rice in the 1980s Vietnam has transformed itself to the world’s second largest rice exporter after Thailand in the late 1990s. This success of breaking into world markets has created a new trade-off for Vietnam’s policymak-ers between ensuring sufficient supplies of rice at affordable prices to domestic con-sumers on the one hand and generating foreign exchange from rice exports on the other. Until very recently the Government has therefore regulated rice exports through a national export quota. This paper examines the economic consequences of the recent removal of the rice export quota. This reform is seen in light of domestic policy barriers such as restrictions on cross-sectoral land mobility as well as interna-tional policy barriers such as distortions introduced by preferential trade agreements.
By expanding and amending a global computable general equilibrium model to rep-resent these features, this study finds that the rice export quota has been a very re-strictive policy instrument that has kept Vietnamese rice production and exports well below potential. Moreover, the study clearly shows that the Government’s attempt to control the diversification of agriculture by managing the allocation of land among different sectors runs the risk of leading to an agricultural production structure that
does not reflect the country’s comparative advantages at the going world market
prices. Finally, in terms of international barriers to its export potential, the analysis shows that if Vietnam were to receive the same preferential market access treatment
as e.g. India, its exports to the European Union would increase substantially.
* The author would like to thank Hans G. Jensen and Søren E. Frandsen, both with the Danish Re-
search Institute of Food Economics, for fruitful discussions and helpful suggestions.

2 Vietnam’s Rice Policy, FØI
1. Introduction
As part of the doi moi (renovation) policy reform program initiated in 1986 the Gov-ernment of Vietnam began to allow markets to play a greater role in the allocation of economic resources. Within agriculture this entailed a decentralization of production responsibilities from collectives to individual farm households. These reforms have helped transform Vietnam from a chronic rice importer in the 1980s to the world’s second largest rice exporter after Thailand in 1997 – a position it has since retained with the exception of 1998. This success of breaking into world markets has created a new trade-off for Vietnam’s policymakers between ensuring sufficient supplies of rice at affordable prices to domestic consumers on the one hand and generating foreign exchange from rice exports on the other. Until very recently the Government has therefore regulated rice exports through a national export quota, access to which has been enjoyed exclusively by a handful of state-owned trading enterprises. Vietnam is a member of the Association of South East Asian Nations (ASEAN) and has therefore committed itself to lowering tariffs and dismantling non-tariff barriers over a specified period of time. The country has also applied for membership of the World Trade Organization (WTO). A step in the direction of liberalizing its own trade policy regime has recently been taken in the case of rice: the export quota has been removed as of May 1, 2001. This was accompanied by the removal of a quota on im-ported fertilizers – an important input in Vietnamese rice production. Although these changes are clearly steps in the right direction, there are a number of remaining con-straints – structural and political – that will restrict farmers from realizing the full po-tential of these reforms. In terms of politically motivated constraints, a key limitation of the reform of the rice export regime is that the Government will continue to nominate state-owned food companies to deal with Vietnam’s key rice export markets. Hence there is still a far way to go in terms of increasing private sector participation in rice exports. In terms of structural constraints – although there have been a series of land reforms over the past two decades – there are still restrictions on the conversion of rice land to other activities. In other words, it is not farmers but government planning committees that make decisions about land use and crop choice. Finally, there are external factors upon which Vietnam only has limited influence. Key rice-importing nations have typically concluded preferential access agreements with selected countries. Given that Vietnam has only recently re-entered the international rice market, it has not yet con-cluded such agreements. A first-best solution is to level the playing field multilater-

Vietnam’s Rice Policy, FØI 3
ally. A second-best solution is for Vietnam to negotiate such preferential trade agree-ments with key rice-importing nations. This paper examines the economic consequences of the recent reforms of Vietnam’s rice trade regime, i.e. the simultaneous removal of the rice export quota and the fertil-izer import restrictions. These reforms are seen in the light of the current inflexibility of choice concerning land allocation and in the light of recent land re-allocation plans. Finally, to illustrate the distorting effects of preferential access agreements, the paper investigates the rice trade agreements of the European Union, which do not include Vietnam. First we consider the implications of abolishing this preferential treatment. Then we consider the implications of Vietnam obtaining similar treatment. Others have also studied the implications of rice market liberalization in Vietnam, but as far as the author is aware this is the first attempt at investigating the issue using a global general equilibrium model.1 This allows us to trace the effects of reform through the factor markets, to investigate the impact on other sectors of the Vietnam-ese economy, and to study the importance of domestic reform relative to international trade liberalization. The following section provides a brief overview of the characteristics of the interna-tional rice market, including Vietnam’s position as a major exporter. Section 3 dis-cusses the main components of the Vietnamese rice policy regime, recent land re-forms and the current land allocation situation. The section also provides an overview of the preferential trade agreements of the European Union. Section 4 then describes how the above-mentioned policy instruments and institutional features are represented in the empirical model. The scenarios to be analyzed using this model are motivated
1 Minot and Goletti (2000), for example, use a partial equilibrium model of the national economy to
investigate the effects of Vietnamese rice policy liberalization. Proponents of partial equilibrium models stress that a higher degree of detail allows for more focused analyses in which more efforts can be devoted to correct policy representation, and parameters and functional forms can be esti-mated for the specific purpose at hand. General equilibrium modelers, on the other hand, stress the importance of a theoretically consistent microeconomic foundation, in which intersectoral link-ages, resource constraints, distortions and welfare analysis are in focus. In terms of sectoral detail, increased computer capacity makes large databases for use in general equilibrium models manage-able. Moreover, general equilibrium models are continuously being tailored to specific needs in terms of policy representation as well as incorporating more realistic aspects such as imperfect competition, dynamic effects and macroeconomic variables. See Nielsen (1999) for further discus-sion of the theoretical differences between partial and general equilibrium models, as well as an il-lustrative empirical analysis of these differences.

4 Vietnam’s Rice Policy, FØI
in Section 5, and the results are presented and discussed in Section 6. The final sec-tion concludes and discusses future opportunities.
2. Vietnam’s position in the international rice market
Rice exports are concentrated in the hands of just a few large exporting nations. The six largest rice exporters in 1999 were Thailand, Vietnam, China, the USA, India and Pakistan (in volume terms and in that order). Exporting 7 million tons in 1999, Thai-land is by far the leading rice exporter, accounting for almost 30% of total world ex-ports (26 million metric tons, according to FAOSTAT 2001). Vietnam ranked second that year, exporting more than 4 million tons, and thereby accounting for 18% of total exports. The United States, China and India each accounted for 10-11% of world ex-ports, and Pakistan settled on 7%. These six exporters have delivered between 73% and 85% of total export volumes over the past 20 years, averaging around 80% in the 1990s. As mentioned above, Vietnam was a net importer of rice in the 1980s and has only seriously regained its position as a net exporter of rice since 1989, three years after the commencement of the doi moi economic reform program. In 1986 Vietnam’s rice exports accounted for just 1% of total world exports against 17-18% ten years later. The rapid intake of Vietnam on world markets over the past few years measured in terms of quantities is somewhat deceiving, however. Although Vietnam secured itself an impressive second place in world exports in the years 1996, 1997 and 1999 and a close fourth in 1998, the value shares show a completely different picture. Vietnam’s exports made up 17% of total exports measured in volumes, but only 5% in value terms. This is a clear indication that Vietnam is primarily serving lower value export markets. This observation holds when observing export value and volume shares over the past decade (see Nielsen 2002 for details). The explanation behind the observation that the United States, Pakistan and Thailand seem able to capture large shares of the value of world rice trade is a reflection of several issues. These countries have a much longer experience in international rice trade than e.g. Vietnam, and have therefore established a reputation of stable and good quality supplies. Recurring issues in the description of the challenges facing Vietnamese rice exports are precisely unreliable supplies and (a reputation of) low

Vietnam’s Rice Policy, FØI 5
quality.2 Clearly these are issues of which Vietnamese officials are well aware and efforts are being made to improve the quality of rice destined for exports. Given that around 20% of Vietnamese rice production is now sold in foreign markets (Nielsen 2002) and that rice exports in recent years have been the second or third largest gen-erator of foreign exchange to the country, increasing the value of rice exports must definitely be a clear priority. Vietnam’s major export markets within the region are Indonesia, Malaysia and the Philippines (Table 1). Sales to Iraq, Iran and Cuba are also important to Vietnamese rice exports. Iraq is a demander of high-quality long grain rice and Vietnam is the main supplier to this country. Cuba is a demander of low-quality long grain rice, and here Vietnam and China are the main suppliers. Former political ties to Eastern Euro-pe are also evident in the structure of Vietnamese exports. Sales to the EU account for only a very small share of total Vietnamese rice exports. Vietnam exports primarily indica rice, mainly of intermediate and low quality. As do-cumented in Nielsen (2002) Vietnam typically sells its intermediate and low-quality indica rice at a significant price discount relative to Thai counterparts. Part of the ex-planation behind this observation is that Vietnam entered the international rice market at a time of low world prices. Hence part of its emergence has been contingent on keeping prices competitively low, particularly in low-income markets. Even when be-ginning to export to higher-income markets, Vietnam has had to temper price pre-miums. Finally, there is the issue of low quality, which despite improved milling faci-lities, has been compounded by the lack of standardization systems, limited rice seed control, and insufficient drying and storage facilities. The quality of Vietnamese rice exports has, nevertheless, increased markedly over the past years. As shown in Table 2, 88% of Vietnam’s rice exports in 1989 consisted of 35% or more brokens. This share has been brought down to 12% in 1997.
2 A cointegration analysis by Nielsen and Yu (forthcoming) does indeed find evidence that Viet-
namese rice in certain segments of the market is being evaluated as being of a lower quality than comparable grades of rice from other countries.

6 Vietnam’s Rice Policy, FØI
Table 1. Vietnam’s top ten export markets, 1995-1999 1995 1996 1997 1998 1999
Rank
Country
% share
Country
% share
Country
% share
Country
% share
Country
% share
1 Indonesia 39.4 Iran 18.9 Philippines 16.3 Indonesia 55.3 Iraq 30.1 2 Cuba 15.4 Philippines 18.5 Iraq 15.5 Philippines 18.3 Cuba 12.9 3 Malaysia 11.4 Cuba 12.8 Indonesia 11.8 Iraq 11.1 Malaysia 9.5 4 Philipp. 8.1 Iraq 9.8 Cuba 7.5 Malaysia 4.2 Tanzania 8.6 5 Iraq 7.0 Peru 6.5 Malaysia 6.8 Iran 2.5 Iran 7.4 6 Peru 3.1 Indonesia 5.9 Kenya 6.2 Poland 1.6 Singapore 5.6 7 Algeria 2.0 Senegal 5.9 Togo 5.9 Kenya 1.5 Yemen 4.1 8 Togo 1.9 C. d’Ivoire 5.2 Iran 5.7 Sth Korea 1.1 Poland 3.6 9 Tanzania 1.9 Malaysia 4.8 Sth Korea 3.0 Algeria 0.8 Latvia 2.6 10 Gabon 1.5 Guinea 2.3 Tanzania 2.7 Cuba 0.8 Algeria 2.3 Others 8.2 Others 9.5 Others 18.6 Others 3.0 Others 13.3 100.0 100.0 100.0 100.0 100.0 Thou. tons 1,587 2,898 3,267 3,421 4,521 Note: Exports are measured on a quantity basis. Not all bilateral export flows in the FAOSTAT database are identified to specific destinations. The total amounts of rice exports (measure in metric tons) reported here include unspecified exports, whereas the percentage shares are calculated out of total specified trade. Note that China is one of the unidentified partners in this data set. Source: FAOSTAT (2001)
Table 2. Vietnamese rice export quality, 1989, 1992 and 1996, percent of total
Quality grade % broken
1989
1990
1991
1992
1993
1994
1995
1996
1997
< 5 0.3 3.3 7.5 19.0 25.6 44.8 30.5 28.9 10 1.5 13.0 27.6 21.3 26.0 24.4 24.6 16.7
43.6
15 3.0 5.9 4.9 11.0 13.2 4.1 12.0 6.4 20 2.3 2.0 5.6 4.3 8.2 9.2 10.7 6.1 25 4.9 20.2 25.9 13.3 11.1 7.4 18.1 33.4
44.4
35 82.8 46.5 21.5 25.4 12.3 6.8 3.6 5.2 > 45 5.2 9.0 7.0 5.4 3.4 1.9 0.5 3.3
12.0
Total 100 100 100 100 100 100 100 100 100 Source: Goletti and Rich (1998) for 1989-96 data. MARD (2000) for 1997 data.
3. The rice policy regimes of Vietnam and its potential trading partners
This section is divided into three parts reflecting the issues that are to be addressed in the subsequent model analysis. Section 3.1 deals with the two policy instruments that have been removed in connection with the most recent liberalization of the rice policy regime in Vietnam, namely the rice export quota and the fertilizer import quota. Sec-tion 3.2 describes the land reforms that have been implemented over the past years and a recent land re-allocation plan of the Government of Vietnam. The final Section

Vietnam’s Rice Policy, FØI 7
3.3 shifts attention to the European Union – as yet an insignificant trading partner of Vietnam, but potentially an important partner in the future.
3.1. Recent liberalization of the Vietnamese rice policy regime:
Removal of the rice export quota and the fertilizer import quota
Like many other developing countries, Vietnam faces the policy dilemma of seeking to achieve food security for its population whilst also raising foreign exchange earn-ings by encouraging the export of food and agricultural products. Rice is at the crux of this dilemma for Vietnam since it is both the dominant staple food (accounting for ¾ of the caloric intake of the average Vietnamese household) and the second or third largest foreign exchange earning sector of the country (accounting for more than 10% of the total value of exports and almost 40% of the value of agricultural exports in 1997, Que and Que 2000). The food security argument has weighed heavily in the balance of policy objectives mentioned above and therefore the Government of Vietnam has kept a tight control on the volume of rice exports ever since it re-entered the international rice market as an exporter in 1989. Yet the success of Vietnamese rice exports has given impetus to the foreign exchange earning objective and so as of May 1, 2001 the export quota, which has been the most direct instrument used to regulate rice exports, has been re-moved by the signing of Decree No. 46/2001/QD-TTg on Vietnam’s Export-Import Management Mechanism for 2001-2005. This decision declares the abolishment of both the rice export quota and the fertilizer import quota. Also the practice of directly nominating exporters and importers of these products has been removed. Hence all economic agents (state owned and non-state owned) holding a license to trade food or agricultural commodities can participate in rice exports.3 3 According to Oryza (2001) some SOEs are already beginning to express concerns that “too many rice exports will cause market disturbances”. To this end the Deputy Trade minister has been quoted for saying that the SOEs will not face any serious challenges since many private trading companies will not be capable of exporting rice anyway. Moreover, the Government will still assign the Minis-try of Trade to coordinate with Vietnam’s Food Association in nominating state owned food com-panies to deal with the country’s main rice markets such as Indonesia, the Philippines, Malaysia and Iraq. So although the quantity limitations have been lifted, this decision will not have a significant impact on increasing the participation of private trading companies in rice exports.
8 Vietnam’s Rice Policy, FØI
The rice export quota Turning back time to the policy regime before May 1, 2001, the Government of Viet-nam has controlled the volume of rice exports by setting an annual export quota. The quota has been set each year by the Ministry of Agriculture and Rural Development, the State Planning Committee, and the Ministry of Trade based on estimates of do-mestic supply and utilization. The rights to export rice under the national quota have been allocated to two regional state-owned trading enterprises – VINAFOOD I (also known as the Northern Food Company) in Hanoi and VINAFOOD II (Southern Food Company) in Ho Chi Minh City – and to a number of provincial state-owned trading enterprises.4 By using a two-step allocation procedure for the annual rice export quota, the Gov-ernment of Vietnam has secured itself a significant degree of “flexibility” to respond to the prevailing domestic crop situation. In 1997, for example, the initial quota was 2.0 million tons out of a total estimated quota for the whole year of 2.5 million tons. Above-average harvests enabled the quota to be raised with a final volume of 3.6 mil-lion tons being exported that year. The flexible quota has not always been used to in-crease exports, but also to restrict them. In 1998 the annual quota was set at 4.0 mil-lion tons, of which 3.6 was the initial allocation. Facing a drought situation, the Min-istry of Trade and the provincial rice export steering committees were instructed to restrict exports thereby failing on contracts of delivery. The Government simply cho-se not to authorize the prices negotiated by exporters and buyers (CIE 1998). And a final example to muddy the picture: The allocation of an export quota of 4 million metric tons in the year 2000 assigned directly to rice exporters could not be fulfilled. Only 3.4 million tons ended up being exported (Oryza 2001). A natural question is then whether this flexible setting of the export quota in reality has meant that the “quota” has been more a target than a binding quota? There are se-
4 The initial steps to liberalize the rice export regime in the sense of allowing private trading compa-
nies to participate in rice exports were taken in the years 1997 and 1998. Export quotas were of-fered to private traders on the basis of four criteria: previous experience in rice trade, ownership of milling facilities, capacity to export at least 5,000 tons per shipment, and proof of financial se-curity (Goletti 1998). Although several private companies have since obtained access to export quotas, they accounted for just 4% of total rice exports in 1999 (Minot and Goletti 2000). Hence there still seem to be barriers to entry for private firms. Increasing the participation of the private trading firms in rice exports is important because their costs are considerably lower than those of SOEs. According to Minot and Goletti (2000) the unit costs of SOEs in the two main rice-producing areas – the Mekong River Delta in the south and the Red River Delta in the north – are four to sixteen times the corresponding costs of private firms.

Vietnam’s Rice Policy, FØI 9
several indications, however, that the rice export quota has been binding. First of all, according to Minot and Goletti (2000) there has been intense political lobbying activ-ity among SOEs to receive export quota allocations. Second, there are strong indica-tions that 0.5 million tons of rice were exported illegally to China in 1995 (official exports were registered at 2.0 million tons that year). Third, an investigation of the foreign-domestic price differential shows that the domestic price has been substan-tially below the border price during the period 1990-1999. As shown in Table 3, this amounts to an export tax equivalent of between 20% and 25% as a percentage of the border price in the period 1990-1998, dipping to 15% in 1999. Table 3. Export tax equivalent of Vietnam’s export quota, 1990-95
Year
Exports
Domestic price (wholesale price)
Border price (f.o.b. export price)a
Export tax equivalent in % of border price
Million metric tons USD/metric ton Percent 1990 1.6 135 170 20.8 1991 1.0 164 226 27.6 1992 1.9 155 207 24.9 1993 1.7 159 203 21.9 1994 2.0 162 218 25.5 1995 2.0b 202 269 24.9 1996 3.0c 204d 267d 23.6 1997 3.6 183 235 22.1 1998 3.7 204 265 23.0 1999 4.6 183 215 14.9 a Although not explicitly stated in Minot and Goletti (2000), a previous study Goletti and Minot (1997) indicates that
the border price given here, for the years 1990-95, is the export unit value. b It is widely believed that 0.5 million tons were exported illegally to China this year. c FAOSTAT reports 3.5 million tons for 1996. d Due to lack of wholesale prices for the more recent years, the table contains calculations of implicit wholesale
prices and implicit unit export values for the years 1996-1999 based on an assumption that the relationship be-tween the wholesale and retail prices and the relationship between the price of 25% brokens and the average unit value of exports are constant in the period 1995-99.
Source: Price data for 1990-1995: Minot and Goletti (2000). Export data: GSO (1999). See Nielsen (2002) for details on calculations
Until 1998 the Vietnamese rice regime has also consisted of an export tax (IMF 1999). Just like the quota, the rice export tax has also been managed flexibly in the sense that it has not always been levied, particularly in times of low world market prices (FAO 1995). In 1997 export duties were 0% on rice with more than 25% bro-kens, and 1% on other rice qualities (CIE 1998). An export tax in addition to an ex-port quota has the effect of shifting some of the rents from the quota holders to the

10 Vietnam’s Rice Policy, FØI
government in the form of tax revenue.5 Along with the removal of the export quota, the Government of Vietnam simultaneously introduced an export subsidy. Rice ex-porters will receive a subsidy of VND 180 (about USD 0.012) per export dollar (Oryza 2001).6 Restrictions on fertilizer imports The use of chemical fertilizer in rice production has increased markedly since 1980. The introduction of individual user rights to land (see Section 3.2) caused the use of fertilizer in agricultural production in general to increase from 57 kg/ha in 1983 to 85 kg/ha in 1990 and 200 kg/ha in 1996 (Minot and Goletti 2000). The reasons for this increase include falling urea/paddy price ratios and increased cropping intensity of rice production. According to Minot and Goletti (2000) at least 9 out of 10 rice farm-ers use chemical fertilizers and the level used in paddy production is in the range of 170-182 kg/ha. Organic fertilizers are also used by more than 2/3 of the rice farmers, but the use is declining due to the rising opportunity cost of labor and the declining urea/paddy price ratio.7 Compared with other Southeast Asian countries, Vietnamese rice production is intense in its use of inorganic fertilizers and domestic production supplies only 13% of total use, thereby making imported fertilizer critical (Goletti 1998).8 In addition to the explicit and implicit taxation of rice trade, the rice sector has also been taxed implicitly through restrictions on fertilizer imports. The MARD and the 5 The export quota and tax instruments have been accompanied by the setting of “guidance” export
prices. According to recent Oryza (2001) reports, the Vietnam Food Association still sets floor prices for exports despite efforts to liberalize the rice policy regime. The actual export price de-pends of course on a wide range of factors including world market conditions, quality, reputation of the exporter, efficiency of port facilities, bargaining skills, etc. In response to this reality the minimum export price has indeed had to be lowered in response to weak international prices, thereby rendering it less restrictive on export contracting.
6 Export subsidies are generally prohibited in the WTO context and those that were in place under the Uruguay Round Agreement on Agriculture negotiations were required to be reduced in both quantity and value terms. Developing countries were, nevertheless, given permission under cer-tain conditions to use export subsidies to reduce the costs of marketing and transporting their ex-ports. It is unclear whether these conditions are met by the new rice export subsidies in Vietnam, but a closer scrutiny in connection with the country’s negotiations with the WTO on accession terms will determine whether or not they are compatible with WTO rules.
7 Insecticides are used by virtually all rice farmers, whereas weeds are more often controlled physi-cally rather than through the use of herbicides.
8 According to the IMF (1999) joint-venture fertilizer plants are being opened to start domestic pro-duction of more advanced fertilizer types, but the import substitution idea is still lurking as import bans have been imposed for precisely these products.

Vietnam’s Rice Policy, FØI 11
Ministry of Trade have controlled fertilizer imports by determining the quantity and types of fertilizer to be imported each year. In 1997 the quota was 2.527 million tons (GSO 1999). Quotas are allocated to the provinces based on expected provincial pro-duction. The provincial authorities then allocate the quotas to the enterprises under their management. Non-state enterprises have also been allowed to receive quota allo-cations subject to fulfillment of certain criteria. Just like the rice export quota, the fer-tilizer import quota has been adjusted following mid-year reviews of the local supply and demand conditions. The Government operates a Price Stabilization Fund to monitor prices on fertilizer. When international prices rise, funds are disbursed to stabilize domestic prices. Fertil-izer price volatility in Vietnam has indeed been lower than in world markets – clearly the reason why this system has been established – but this stability has been achieved at the cost of domestic fertilizer prices being well above world market prices thereby representing a real tax on farmers (Table 4). Since quota holders earn rents, an active illegal market for fertilizer quotas has been established, and informal interviews re-veal that the value of these quotas has been around USD 3-4 per ton (Goletti 1998). Table 4. Comparison of fertilizer prices 1998* Fertilizer type
Domestic price USD/kg
Import price USD/kg
Premium over import price, percent
Urea 2,100 1,566 34 DAP** 3,850 2,990 29 Kalium 2,150 1,723 25 *Although not entirely clear in the source it seems that the price data are for 1998. **Diabasic Ammonium Phosphate Source: CIE (1999)
3.2. Status of the land reforms and land re-allocation plans in Vietnam
There is only limited information available about the functioning of the land regula-tions in Vietnam. Pingali and Xuan (1992) provide an overview of the land reforms that took place in 1981 and 1988. As a step away from the previous system of collec-tive farming, a contract system was introduced in 1981 (Directive 100 CT, April 1981). This meant that farmers were obliged to enter into contract with a designated cooperative to produce a specific level of output on their land, which then had to be sold to the state at a fixed price. The cooperative would in turn deliver the required inputs to the farmer. Although marking a substantial improvement relative to the pre-vious system, Pingali and Xuan (1992) argue that the contract system introduced in

12 Vietnam’s Rice Policy, FØI
1981 proved inadequate for a number of reasons. In particular, two problems are worth mentioning. First, land use and crop choice decisions continued to be made by the State Planning Commission in a top-down fashion without consideration of farmer preferences and local market conditions. Second, the lack of security of land tenure led to suboptimal farm-level investments in land productivity. Subsequent reforms in 1988, 1993 and 1997 have attempted to address the shortcom-ings of the initial land reform. With Resolution 10 of 1988 began the recognition of the farm household as the basic unit of agricultural production as part of the reform of the agricultural management mechanism. Cooperative land was allocated to farming households with user rights for 10 to 15 years. The Land Law made recommenda-tions as to how the land was to be allocated across households. Allocations were to take account of the availability of land resources, the labor force of the households, and the land that households had previously been cultivating. There were limits on how much land could be allocated to each household. The overriding concern with aggregate equity (as regards farm size and land quality) in the allocation process has led to a land system characterized by extremely small farms and a large extent of fragmentation in land plots with adverse consequences for productivity as a result (Tanaka 2001). Moreover, as a result of the 1998 Land Law, farmers were permitted to buy, own, and sell input factors such as machines, tools and draft animals. Fur-thermore, farmers were no longer required to sell a contracted amount of rice to the state. In 1993 land use rights were expanded through Resolution 5 to supplement longer term land rights with the rights to exchange, transfer, lease, inherit and mortgage land. Clearly, the introduction of these rights has encouraged farmers to invest in land rec-lamation and land improvement. The year 1997 saw a generalization of the laws of 1993 to include a parallel treatment of rural and urban land. According to Goletti (1998), however, the land markets still do not function smoothly. ”Land titles are not easily obtained unless special relations with local au-thorities are established.” (Goletti 1998 p. 5) A further restriction hindering the devel-opment of land markets is that the duration of land use rights is no more than 25 years and that there is a landholding ceiling of 3 hectares. Breaches of these restrictions do take place, but require special connections with the local authority. Hence this lack of transparency works against the incentives to invest in land improvement.

Vietnam’s Rice Policy, FØI 13
There is unfortunately only very little information available that can supplement the above description by providing quantitative indications of how restrictive the land laws are – and, in particular, what this implies for different sectors.9 The information that is available shows that in 1997/98 the average selling and buying prices of annual crop land was around 25% below the average of all types of land whilst perennial crop land prices are about 91% above the average (Table 5).10 Table 5. Average buying and selling price of land in Vietnam by type, 1997/98,
Thous. VND/ha Selling Buying Thous. VND/ha Relative to average Thous. VND/ha Relative to average Average 23,297 1.00 38,962 1.00 Annual crop 16,772 0.72 30,546 0.78 Perennial 43,395 1.86 75,374 1.96 Water surface 42,074 1.81 - - Forestry 7,282 0.31 10,893 0.28 Source: Vietnam Living Standards Survey 1997/98 and own calculations.
With reference to the 1988 land reforms, Ravallion and van de Walle (2001) explain that use rights for crop land were extended for 10-15 years whereas longer periods were granted to tree crops. To the extent that the markets were functioning reasonably well, hereunder reflecting the difference in the duration of use rights, this fits well with the observation above that perennial land (generally tree crops) is valued higher than annual crop land. Furthermore, as discussed above, there are restrictions on the sectoral mobility of land that also without doubt contribute to these differences. Van de Walle (2002) confirms this by noting that forest land may not be used for growing crops, and land that is delineated for the cultivation of a specific crop cannot be con-verted to another crop. The degree to which local authorities enforce these rules varies widely, however. Hence the 1988 and 1993 land reforms did attempt to address the problem of lacking incentives to invest in land productivity. Yet there are no indications that these re-forms have addressed the problem of crop choice decisions being made by provincial and cooperative officials rather than farmers. On the contrary, Goletti (1998 p.6) ex- 9 In principle, one might be looking for differing returns to land in different sectors associated with
the way the land law operates. 10 In the Vietnamese context annual crops include paddy rice, soybean, peanut, tobacco, sugar cane,
mulberry, jute and rush. Perennial crops are tea, coffee, cashew nuts, rubber, coconut, oranges, pineapple, banana and mango.

14 Vietnam’s Rice Policy, FØI
plains that there are ”strict regulations that prohibit the conversion of rice land to other activities.” This constrains both the possibilities of developing a more diversi-fied agriculture and the establishment of rural industries. Moreover, the benefits of large-scale production are not realized either. The Government of Vietnam is concerned about diversifying the country’s agricul-tural production – not least in response to the current world market situation charac-terized by declining rice prices. As part of this strategy, the Government is converting paddy fields into alternative uses (FAO 2001). The area of land under irrigated paddy has been targeted at 4.2 million hectares in 1999, a level which was cut further to 4.0 million hectares in 2000.11 Hence, rather than allowing market forces to determine the appropriate allocation of land across sectors, this strategy represents an attempt to control the direction of agricultural diversification out of paddy and into other agricul-tural production. From an economic point of view this is clearly a sub-optimal strat-egy in that it is far from certain that Vietnam’s international comparative advantage lies in ‘other agricultural production’ and not in rice. Another issue that the Vietnamese government is keenly aware of is the need to im-prove the quality of its export rice. Moreover there seems to be an interest in investi-gating the prospects of obtaining price premiums on specialty rice varieties. Special zones have been assigned to production for exports in an effort to enhance the quality of Vietnam’s rice exports and to minimize transportation costs. Farmers are moreover being encouraged to use pure high-quality seed from selected specialty rice varieties such as Jasmine rice. There are a number of issues related to this discussion that make empirical analysis hereof complex. The first question is: what is the technical poten-tial? What are the investment requirements to improve rice quality to a certain inter-national standard? Which specialty rice varieties can be grown in Vietnam and what does this entail for productivity? The second question is: what is the market potential? How great is the willingness to pay for higher quality Vietnamese rice in the different importing countries? Will this require specific quality certification and identity pres-ervation, and if so, how much will this cost? Model simulations have been conducted to illustrate these issues, but as expected, the results highly sensitive to the choice of shocks, i.e. the assumed implementation cost in terms of reduced productivity and the assumed shift in import demand. The results are not reported in this paper.
11 It has not been possible to verify this in official Vietnamese legal texts and the author has no
knowledge of other sources of this information other than FAO (2001).

Vietnam’s Rice Policy, FØI 15
3.3. Preferential trade agreements of the European Union:
A potentially important trading partner for Vietnam
The importance of the European Union as a rice importer has declined rather substan-tially over the period 1980-99. From averaging 12.8% of total rice imports in 1980-85, the EU has only purchased 3.9% of world rice supplies during the period 1995-99. This increased self-sufficiency is to a large extent explained by the current EU rice policy regime, which provides substantial protection of and support to its rice farmers (see Nielsen 2002). As made evident in Section 2, Vietnam currently exports only very little rice to the EU. The EU mainly imports indica rice from Thailand and the US, and premium basmati rice from India and Pakistan. All four countries enjoy preferential access to the EU market. In 1996 the EU struck deals with the United States and Thailand on annual tariff rate quotas for 63,000 tons of milled rice, 20,000 tons of brown rice, and 1,000 tons of broken rice. The quotas are split by country of origin and applications for import licenses take place in quarterly tranches (Table 6). The EU notifications to the WTO show that the quotas are completely filled (or at least very close to being filled) each year except for broken rice (not shown in the table). Table 6. Allocation of EU rice import quotas by country of origin (tons)
Semi/wholly milled rice Husked rice Broken rice Quota 63,000 20,000 80,000* - USA 38,721 7,642 7,281 - Thailand 21,455 1,812 41,600 - Australia 1,019 10,429 12,913 - Guyana 0 0 8,503 - Others 1,805 117 9,703
Tariff rates (Euro/ton) In-quota tariff 0 88 28 Over-quota (normal) tariff rate**
1996/97 572 363 176 1997/98 533 339 164
* Note that subsequent notifications to the WTO report quotas of 1,000 tons of broken rice. ** The bound import tariff
rates agreed upon under the Uruguay Round Agreement on Agriculture. See Nielsen (2002) for a further descrip-tion of the EU rice policy regime.
Source: European Commission (1998) and Nielsen (2002).
Moreover, the European Union provides preferential conditions and preferential ac-cess quotas to agricultural and food products from several developing countries, par-

16 Vietnam’s Rice Policy, FØI
ticularly the ACP (African, Caribbean and Pacific) countries. Table 7 shows the pref-erential conditions provided to imports from these and other developing countries. Note in particular that basmati rice imports from India and Pakistan enjoy a rebate of Euro 250/ton to the normal import duty and that quotas do not restrict this preferential treatment (FAS 2000). Table 7. EU’s preferential access conditions for other (developing) countries
Quota (tons) Preferential treatment ACP* 125,000 (husked) 35% of normal duty OCT** 35,000 (husked) 0% India No quota Euro 250/ton rebate to normal duty (basmati rice) Pakistan No quota Euro 250/ton rebate to normal duty (basmati rice) Bangladesh 4,000 50% of normal duty Egypt 32,000 75% of normal duty * ACP: African, Caribbean and Pacific countries. ** OCT: Overseas Countries and Territories Source: European Commission (1997 and 1991), EUR-Lex (2001), FAS (2000), and Nielsen (2002).
In February 2001 the ‘Everything But Arms’ initiative was endorsed. Through this initiative the EU will unilaterally remove all tariffs and quotas on all commodities, except weapons, from 49 Least Developed Countries (LDCs). In addition to the fact that Vietnam is not classified as an LDC and can therefore not benefit from this agreement, it is worth emphasizing that rice is one of three exceptions to this initiative (along with sugar and bananas). Implementation of free market access for these prod-ucts will take place in progressive stages from 2002 to 2006 (European Commission 2001). Hence part of the reason why Vietnam currently exports so little rice to the EU may well be related to the fact that the conditions for fair competition between rice export-ers are heavily distorted by the preferential access agreements that the EU has con-cluded with a number of Vietnam’s competitors, e.g. Thailand, United States, India and Pakistan. And so in addition to investigating the impact of the recent liberaliza-tion of Vietnam’s own rice policy regime and the remaining structural barriers related to the land allocation system, this paper seeks to quantify the implications for Viet-nam of the EU’s current preferential access agreements. Section 4 therefore describes how the policy instruments and institutional features discussed in this section are rep-resented in the empirical model, before embarking on a more precise description of the scenarios to be analyzed.

Vietnam’s Rice Policy, FØI 17
4. Representation in a global CGE model: methodology and data
This section describes the technical representation of the policy instruments and struc-tural features discussed in Section 3 above in a global economy-wide model and data-base known as GTAP (Global Trade Policy Analysis Project, c.f. Hertel 1997). Being a general equilibrium model, GTAP describes both the vertical and horizontal link-ages between all product markets both within the model’s individual countries and regions as well as between countries and regions via their bilateral trade flows. It also has a consistent treatment of factor markets within each country and region. As men-tioned earlier, choosing to work with a global general equilibrium model allows us to trace the effects of reform through the factor markets, to investigate the impact on other sectors of the Vietnamese economy, and to study the importance of domestic reform relative to international trade liberalization. The most recent database available for the model is for 1997, and it comprises 66 re-gions and 57 sectors (Version 5, see Dimaranan and McDougall 2001). The data for Vietnam contained in the GTAP database is a 1997 input-output table that has been contributed by the author (see Nielsen 2001). For the purpose of the present analysis the database is aggregated to 12 sectors and 19 regions, shown in Table 8. The re-gional detail focuses on Vietnam’s major competitors on the international rice market as well as its main purchasers. It also reflects the interest in the regions benefiting from the EU’s preferential trade agreements. In addition to the paddy rice sector and the rice processing industry, the sectoral detail focuses primarily on the agricultural sectors. Table 8. Regions and sectors in the empirical model analysis
Sectors Regions
1. Paddy rice 2. Wheat 3. Cereal grains nec 4. Vegetables, fruits & nuts 5. Other crops 6. Livestock and fisheries 7. Other primary production 8. Processed rice 9. Other processed food 10. Chemicals, rubber & plastics 11. Other manufactured goods 12. Services
1. Vietnam 2. Thailand 3. United States 4. China 5. India 6. Pakistan 7. Other Low Income Asia 8. Indonesia 9. Japan 10. Other High Income Asia 11. European Union 12. Australia
13. OCT countries 14. ACP countries 15. Non-ACP Africa 16. CEECs and FSU 17. Mexico, C. & S. America 18. Middle East 19. Rest of World

18 Vietnam’s Rice Policy, FØI
The standard GTAP model has been extended and modified to represent the following important policy instruments and structural features, which will have an impact on the Vietnamese rice sector as well as the economy at large:
(1) the rice export quota and the import quota on fertilizers (2) the restrictions on the cross-sectoral mobility of land and the land re-allocation
plans (3) the preferential access agreements of the EU
Ad. (1) The rice export quota and the fertilizer import quota
The rice export quota
One way of handling export quotas would be to exogenize the export quantity vari-able and endogenize the export tax rate. Although appealing in its simplicity such a modeling strategy will prove inadequate if the export quota switches from being bind-ing to non-binding, and if it is of interest to distinguish between ordinary export taxes and the tax equivalent of the export quota. In the GTAP model and database two prices are associated with the export flows of a good i from one region r to another region s, namely the market price Pm(i,r) and the f.o.b. export price Pfob(i,r,s). The difference between these two prices can be due to possible export taxes or subsidies that are either destination-generic, TXN(i,r), or des-tination-specific, TXS(i,r,s). The presence of an export quota introduces an additional wedge between the market price of rice and the f.o.b. price. There are two possible situations – depicted in Figure 1 – depending on whether or not the quota is binding. In the first case, net export demand is large enough so that the quota becomes binding at Q . A quota rent arises as shown by the area Q *(Pfob - Px). Depending on the strength of demand and the extent to which changes in a coun-try’s export supply can affect the world market price, the quota rent will be larger the higher the world market price Pfob is relative to the tax-inclusive domestic price Px. In the second case, net demand for Vietnamese rice exports is below the quota Q . The ordinary export tax ot is charged, and no quota rent arises.

Vietnam’s Rice Policy, FØI 19
Figure 1. The functioning of the export quota
S
Q
DIn quota
Px = Pm(1+to)
Pm
Price
Exports
Quota rent
Pfob = Px(1+tq)
DAt quota
Tax revenue
Representing the rice export tax requires an extension of the standard GTAP model and adjustment of the associated database. The method of implementing the export quota in the model builds on Bach and Pearson (1996) who model bilateral export and import quotas, and on Elbehri and Pearson (2000) who model bilateral tariff rate quo-tas. In the modeling presented here, however, the trigger mechanism is not the bilat-eral trade flow but the aggregate export flow, i.e. it is a global export quota. The de-tails of the variables and equations added to the model in order to handle the export quota are shown in the Appendix. The first task is to introduce the price Px and to redefine Pfob. As depicted in Figure 1, Px is the export price including ordinary export taxes or subsidies, while Pfob must re-flect the total difference between the f.o.b. price and the market price, i.e. including the tax equivalent of the export quota. Noting that the model equations are written in linearized form with lower case variables denoting percentage changes in the vari-
20 Vietnam’s Rice Policy, FØI
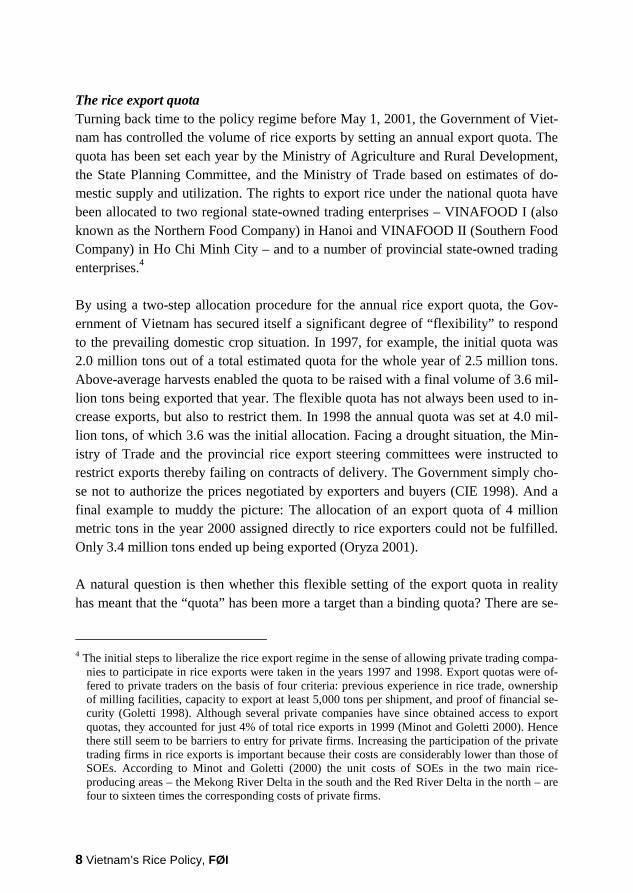
ables12, the following price equations apply for Vietnamese rice exports in the modi-fied model: (1) px(i,r) = pm(i,r) - txn(i,r) – txsagg(i,r),
where txsagg (i,r) denotes a weighted average of the destination-specific ex-port taxes and txn(i,r) denots the ordinary export tax.
and (2) pfob(i,r,s) = px(i,r) - TX_QUOTA(i,r),
where TX_QUOTA(i,r) denotes the power of the tax equivalent of the export quota.
Equation (1) takes account of the ordinary export taxes whilst Equation (2) adds the tax equivalent of the export quota to this wedge. As mentioned above, modeling the export quota mechanism directly allows us to trace possible changes in the status of the quota, i.e. whether it is binding or not. This is achieved through the following complementarity statement: TX_QUOTA = 1 and QX_RATIO - 1 ≤ 0 [In-quota], or TX_QUOTA ≤ 1 and QX_RATIO - 1 = 0 [At-quota] Introducing complementarity expressions in GEMPACK (the software used to solve the GTAP model, c.f. Harrison and Pearson 2000) is docu-mented in Pearson (2001).
12 The model equations are written in linearized form (i.e. differentiated), usually expressed in terms
of percentage changes in the variables. E.g. the levels equation V = P Q relates the dollar value V of a commodity to its price P (USD per ton) and its quantity Q (tons). The linearized version is p_V = p_P + p_Q. In other words, to the first order, the percentage change in the dollar value p_V is equal to the percentage changes p_P in the price and p_Q in the quantity (Harrison and Pearson 2000) In the current exposition, variables written in lower case denote percentage changes. This means that the linear equation pfob(i,r,s) = px(i,r) - TX_QUOTA(i,r), for example, can be written as follows in the levels form: Pfob(i,r,s) = Px(i,r) / TX_QUOTA(i,r) � TX_QUOTA(i,r) = Px(i,r) / Pfob(i,r,s), which is the power of the tax equivalent of the export quota. The convention is that this is defined as the ratio VXMD/VXWD, where VXMD is the value of exports at market prices and VXWD is the value of exports at world prices.

Vietnam’s Rice Policy, FØI 21
The standard GTAP version 5 database does not take account of the neither the ordi-nary export tax nor the tax equivalent of the export quota for Vietnamese rice exports and has therefore been altered using the ALTERTAX procedure described in Mal-colm (1998) to reflect this wedge. As mentioned above the tariff rates applicable in 1997 were 0% on rice qualities with more than 25% broken grains and 1% on other rice. Using information about the quality composition of Vietnamese rice exports in 1996 (Nielsen 2002) a weighted average tax rate of 0.58% is introduced as a destina-tion-generic ordinary tax. Adding the ad valorem tax equivalent of the export quota of 22.1% (Table 3) in 1997 (the year the GTAP database represents) yields a total wedge of 22.68%. Furthermore, when running the model, two additional data items must be supplied: (1) the power of the tax equivalent of the export quota TX_QUOTA(i,r) and (2) the ratio of exports to the quota volume, i.e. QX_RATIO(i,r) = QX(i,r)/QX_QUOTA(i,r), where QX denotes the volume of exports and QX_QUOTA(i,r) denotes the quota volume. The power of the tax equivalent of the export quota is calculated as the ratio Px/Pfob, using the wholesale and export prices shown in Table 3, i.e. USD 183/ USD 235 = 0.779. The export quota is binding, and hence the ratio QX_RATIO = 1. The data used for these model changes are summa-rized in Table 9. It should be noted that both the paddy and processed rice sectors are treated in this manner. Table 9. Data used to reflect Vietnam’s rice export quota regime
Changes made to the base data Data used in the export quota module Ordinary export tax 0.58% Power of the tax equivalent of the export quota 0.779 Ad valorem tax equivalent of export quota 22.10% Ratio of exports to the quota volume 1.000 Total wedge 22.68%
The fertilizer import quota
The fertilizer import quota could be represented in an analogous manner to that for the rice export quota, i.e. modeled as a global import quota. Since we will be using the tariff rate quota (TRQ) module developed by Elbehri and Pearson (2000) for use in the GTAP model when implementing the EU rice trade regime, however, we have used this modeling framework to rep-resent the restrictions on fertilizer imports in Vietnam.13 13 It may be mentioned that according to the GTAP database total fertilizer costs (domestic and im-
ported) make up 25.4% of total costs in the paddy rice sector. Of this total use of fertilizers in the paddy rice sector, imports account for 76.2%.

22 Vietnam’s Rice Policy, FØI
Under a TRQ regime imports up to a given fixed quantity are subject to a low, in-quota, tariff. Above this quantity imports are charged a higher, out-of-quota, tariff. The import fertilizer quota in Vietnam is modeled as a TRQ for which the outset is that the imports are exactly on quota, as depicted in Figure 2. I.e. the import demand schedule intersects the import supply step function on its vertical position at the quan-tity equal to the quota. The domestic price is thus equal to the world price augmented by both the in-quota tariff and the tariff-equivalent of the import quota. The out-of-quota tariff is fictively set to be prohibitively high to ensure that a situation with out-of-quota imports does not arise irrespective of which changes occur to the world economy. The details of the TRQ module are well documented in Elbehri and Pearson (2000) and will not be repeated here, but the data used to implement it will be dis-cussed. Figure 2. The functioning of the fertilizer import quota
S
Q
Pw(1+Tin)
Pw
Price
Imports
Quota rent
Pw(1+Tout)
DAt quota
Tariff revenue
Pd

Vietnam’s Rice Policy, FØI 23
In the database fertilizers are included in the aggregate “chemicals, rubber and plas-tics“ sector. Hence, although the average price premium of fertilizer prices over im-port prices is 29.3% (calculated from Table 4) this does not apply to the entire “chemicals, rubber and plastics” sector since the import quota only concerns the fer-tilizer component. As with any other data aggregation effort there are trade-offs to be made. First of all, it is assumed that because the fertilizer import quota is binding, the quota for the aggregate “chemicals, rubber and plastics” sector as a whole is also binding. In order to reflect the relative power of the tariffs (equivalents) in this aggre-gate sector, shares of each product in the sector-wide import value are used to estab-lish a weighted average import tariff equivalent for the sector as a whole. According to the Vietnamese input-output table for 1996 (GSO 1999) fertilizers make up 32.36% of imports of this aggregate. The resulting wedge between imports valued at c.i.f. and imports valued at market prices to be introduced in the GTAP database is 13.3% of which 9.5% is due to the fertilizer import quota and the remainder is due to ordinary tariffs (Table 10). Table 10. Calculation of wedge to be introduced in GTAP database
Share of crp importsa
Average im-
port tariffb
Import tariff equivalent of import quota
Weighted import tariff equivalent to be used
for crp aggregate Chemicals, rubber and plastics
(crp)
100.0
13.3
Basic organic chemicals 14.0 1.0 0.1 Basic inorganic chemicals 8.4 0.5 0.0 Fertilizer 32.4 0.1 29.3c 9.5 Pesticides & veterinary medicine 6.1 0.0 0.0 Health medicine 10.9 0.7 0.1 Processed rubber and by-products 5.5 10.5 0.6 Soap, detergent, perf.. toiletries 3.4 40.2 1.3 Other plastic products 9.5 0.6 0.1 Paint, ink, varnish, painting mater. 5.9 21.6 1.3 Other chemical products 2.2 3.8 0.1 a Based on Vietnamese input-output table for 1996. b Average import tariff in 1996 for each category. c Average price premium over import prices for the three types of fertilizer as indicated in Table 4.
The changes made to the standard database and the additional data required in con-nection with the TRQ module are summarized in Table 11.

24 Vietnam’s Rice Policy, FØI
Tabel 11. Data used to reflect Vietnam’s fertilizer import quota regime Changes made to the base data Data used in the tariff rate quota module Ordinary import tariff 3.8% Power of the in-quota tariff 1.064* Ad valorem tariff equiv. of import quota 9.5% Power of the out-of-quota tariff 8.000 Total wedge 13.3% Ratio of imports to the quota volume 1.000
* The power of the in-quota tariff TMSINQ = 1.064 = TMS = 133.1 because of the following identity: TMS = TMSINQ*TMSTRQ, where TMS is the actual tariff, TMSINQ is the in-quota and TMSTRQ denotes any ac-
tual extra power of the tariff over and above the in-quota tariff TMSINQ. See Elbehri and Pearson (2000).
Ad. (2) The restrictions on cross-sectoral mobility of land and the land re-allocation
plans As discussed in Section 3 above there are no indications that the restrictions on land mobility across sectors have been relaxed. Moreover, it has not been possible to find adequate information so as to quantify the effect of these restrictions explicitly. And so this structural feature is represented in the model such that land allocation across sectors is more sluggish in Vietnam than in other countries and regions. Hence a re-gion-specific elasticity of transformation for land is introduced (the default in GTAP is a region-generic parameter) for use in the Constant Elasticity of Transformation (CET) revenue function, which is the way the mobility of land (and other sluggish primary factors) is described in the model. By definition, the elasticity of transforma-tion σT < 0. The closer to zero σT is, the higher the degree of sluggishness and rental rates of land across sectors will differ. For the present purpose the value of σT is set (arbitrarily and purely for illustrative purposes) at –0.01 for Vietnam, whilst all other countries retain the default value of –1.00. The other issue mentioned in Section 3 related to land is the re-allocation plans of the Government due to its concern about diversifying the country’s agricultural produc-tion. As part of this strategy, the Government is forcing a conversion of paddy fields into alternative uses. The area of land under irrigated paddy has been targeted at 4.2 million hectares in 1999, a level which was cut further to 4.0 million hectares in 2000. To illustrate this conversion, the treatment of land allocation across sectors in the standard model has been amended. More specifically, the nesting structure, which de-termines the way by which land is distributed among sectors, has been changed for Vietnam as shown in Figure 3.

Vietnam’s Rice Policy, FØI 25
Figure 3. New nesting structure to enable land re-allocation simulation
Paddyrice
Othercrops
Cerealgrains
Vegetables,fruits, nuts
σT
Paddyrice
Othercrops
Cerealgrains
Vegetables,fruits, nuts
σT
Default nesting structure Alternative nesting structure
Land Land
The quantity of land under paddy rice is held fixed, whilst the allocation of the re-maining land takes place as in the standard model except that the possibilities for sub-stitution are restricted to the non-paddy land-using sectors. With this specification land can be shifted out of the paddy rice sector exogenously and re-distributed in the other agricultural sectors endogenously. The details of this land module are described in the Appendix. Ad (3) The preferential access agreements of the EU As mentioned earlier, the TRQ module for use in the GTAP model is well docu-mented in Elbehri and Pearson (2000) and therefore the description here focuses pri-marily on the extra data used in order to apply the module. The standard GTAP data base does not contain information about which trade flows are regulated by quotas,
26 Vietnam’s Rice Policy, FØI
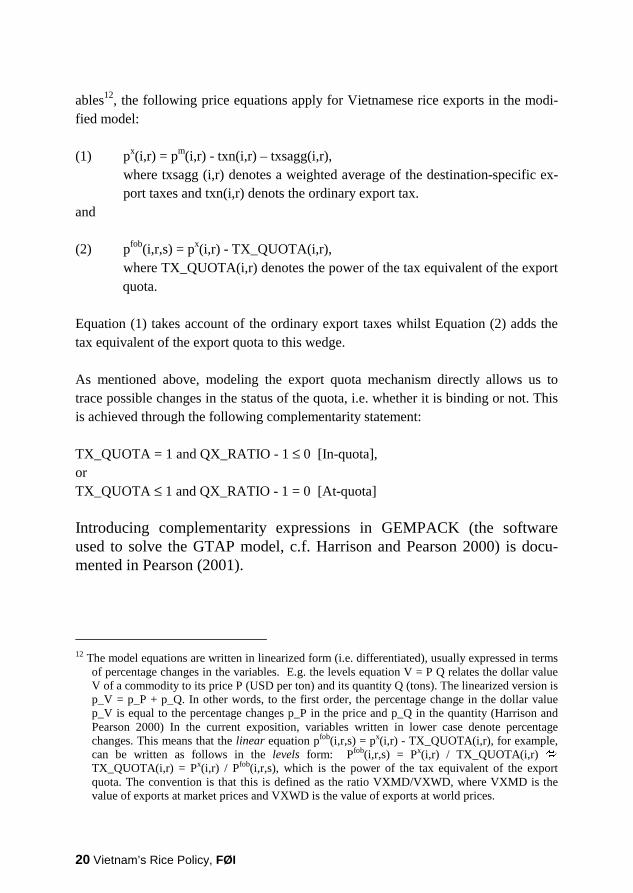
including whether they are in-quota, on-quota, or over-quota. Moreover it does not contain information about the quota volumes, the in-quota tariff rate and the out-of-quota tariff rate. Hence, extra data must be supplied to the model. More specifically, three data items are required: (1) the ratio of imports over the TRQ volume, (2) the in-quota tariff, and (3) the full extra power of the tariff levied on over-quota imports. The first data requirement is satisfied by obtaining actual trade volumes from the World Trade Atlas database and comparing these with the TRQ quotas documented in Table 6. The data available in the World Trade Atlas are at the HS-6-digit level and are therefore aggregated to the GTAP commodity level (paddy rice and processed rice). The quantities and quotas are shown in Table 12. Note that Guyana is an ACP country and hence the preferences provided to this county are combined with the preferences provided to the ACP region as a whole. As can be seen by the data, al-most all the import flows reported are above the applicable quota – the situation de-picted in Figure 4. Table 12. Quantity data for the TRQ module
Commodity TRQ volumes Actual volumes Metric tons
Ratio of imports over TRQ volume
USA Paddy 7,642 266,085 34.82 Processed 46,002 65,145 1.42 Thailand Paddy 1,812 60,297 33.28 Processed 63,055 110,544 1.75 Australia Paddy 10,429 11,818 1.13 Processed 13,932 20,246 1.45 ACP Paddy 125,000 85,992 0.69 Processed 8,503 14,917 1.75 OTC Paddy 35,000 673 0.02 Processed 0 87,480 0.125* * For non-TRQ trade flows the ratio is set to 0.125 to make it highly unlikely that imports will ever exceed the TRQ volume irrespective of the changes to the world economy. Any estimates of QXSTRQ_RATIO lower than this will be overridden by this default value. See Elbehri and Pearson (2000). Source: Actual trade volumes: World Trade Atlas, Quotas: See Table 6. Own calculations.

Vietnam’s Rice Policy, FØI 27
Figure 4. Tariff rate quota system: Over quota case
S
Q
Pw(1+Tin)
Pw
Price
Imports
Quota rent
Pd = Pw(1+Tout)
DOver quota
Tariff revenue
QXS<
As shown in Table 6 the in-quota tariff levels are specific tariffs. These are converted into ad valorem tariff equivalents using the bilateral unit import values (proxies for the import prices). The average for the period 1996-2000 is used and shown in Table 13. The table also shows the resulting two data elements, i.e. the power of the in-quota tariff and the full extra power of the tariff levied on over-quota imports. The out-of-quota (“normal”) tariff rates applied are the ad valorem equivalents of the bound URAA (Uruguay Round Agreement on Agriculture) rates as given in the GTAP database. These rates are 64.9% for paddy rice and 87.3% for processed rice. As mentioned above in Section 3 India and Pakistan receive a rebate of 250 euro/ton. The in-quota tariffs are therefore lowered accordingly using bilateral import unit val-ues provided in the World Trade Atlas database and shown in Table 14. Otherwise these flows are treated as the other non-TRQ flows in the TRQ module, i.e. with a de-fault ratio of imports to TRQ quota equal to 0.125 and the full extra power of the tar-iff levied on out-of-quota tariffs set to 8, c.f. Elbehri and Pearson (2000).

28 Vietnam’s Rice Policy, FØI
Table 13. Tariff data for the TRQ module Commodity Specific tariff Unit import price
Euro/ton
Power of in-quota tariff
Full extra power of tariff on out-of-
quota imports USA Paddy 88 (HS 100620) 362 1.243a 1.327b Processed 0 (HS 100630)
28 (HS 100640) n.a.
459 (HS 100640) 1.018c 1.841
Thailand Paddy 88 (HS 100620) 446 1.197 1.378 Processed 0 (HS 100630)
28 (HS 100640) n.a.
355 (HS 100640) 1.045c 1.793
Australia Paddy 88 (HS 100620) 323 1.272 1.297 Processed 0 (HS 100630)
28 (HS 100640) n.a.
249 (HS 100640) 1.101c 1.702
ACP Paddy 35% of normal tariff - 1.227 1.344 Processed 0 (HS 100630)
28 (HS 100640) 495 (HS 100630) 224 (HS 100640)
1.121c 1.672
OTC Paddy 0% - 1.000 1.649 Processed - - 1.873d 8.000e a. Calculated as 1 + 88/362; b. Calculated as 1.649/1.243, where 1.649 is the power of the out-of-quota tariff, which
reflects the MFN bound rate on EU imports of paddy rice in the standard GTAP database; The (power of the) MFN bound rate for processed rice is 1.873 and is also used as the out-of-quota tariff rate; c. Quantity-weighted (powers of) tariff equivalents based on World Trade Atlas data; d. the standard MFN bound rate is used as the TMSINQ for non-TRQ flows; e. The out-of-quota tariff is set to 8 for non-TRW flows to ensure that it is highly unlikely that the flow will ever have imports over the quota, whatever the changes to the global economy.
Source: Actual trade volumes: World Trade Atlas, Quotas: See Table 6. Own calculations.
Tabel 14. Tariff data for India and Pakistan
Commodity Unit import
price Regular tariff paid Regular tariff paid mi-
nus 250 euro/ton rebate Euro/ton % Euro/ton Euro/ton
Power of in-quota tariff
India Paddy 858 64.925* 557 307 1.3579 Processed 700 87.376* 612 362 1.5166 Pakistan Paddy n.a. 64.925* n.a. n.a. 1.3579** Processed 659 87.376* 576 326 1.4942 * Ad valorem tariff equivalents of the MFN bound rates as given in the GTAP database. ** Due to inadequate data for Pakistan the same tariff as applies to India is assumed levied on imports of paddy rice from Pakistan. Source: Unit import prices: World Trade Atlas. Own calculations.

Vietnam’s Rice Policy, FØI 29
A final issue relating to TRQs concerns the distribution of quota rents between im-porters and exporters. Unless otherwise specified the GTAP model will allocate all rents associated with the TRQs to the importing region. This assumption is assumed to be relevant in the case of the fertilizer import quota described above because the Government of Vietnam has implemented this system unilaterally. But in the case of the EU’s preferential trade agreements for rice – where negotiations are assumed to have taken place – licenses for access to the TRQs are issued upon demand (WTO 2002). Furthermore, these agreements are made with specific countries for several years at a time and so it is assumed that the exporting regions have a lot to be gained from these agreements, not only in terms of the lower in-quota tariffs, but also in terms of a certain level of security in market access. Hence for the purpose of this study it is assumed that 80% of the quota rents accrue to the exporting nations.
Other database adjustments
In addition to the database adjustments required to account for the rice export quota and the fertilizer import quota, the GTAP version 5 database has been adjusted to take account of external information about certain export subsidy rates, import tariffs, etc. A price comparison method was used to introduce a rice export subsidy of 5.4% in Thailand, for example, whilst rice import tariffs for Vietnam and China were adjusted to external information as well (Nielsen 2002). In 1996 the Vietnamese import tariff levied on rice imports was 6.125% with the exception of rice in the husk meant for sowing (HS 10061010) for which it was 0%. Moreover, the Armington elasticities have been doubled.14
5. Scenario design
Against the background described in Section 3 three sets of scenarios are analyzed. The first two scenarios, 1a and 1b, examine the removal of the rice export quota in two different cases. The first case assumes that the quantitative restrictions on im-ported fertilizer – a key input in Vietnamese paddy production – remain intact. The second case reflects the actual situation, namely that the two quotas have been re-moved simultaneously. This set of scenarios is intended to reveal the important link-
14 For several users of GTAP this has become common practice following Gehlhar’s (1997) obser-
vation that increasing the trade elasticities improved the fit of the model to East Asian trade shares in the 1980’s.

30 Vietnam’s Rice Policy, FØI
ages between policy instruments regulating the output – rice – and policy instruments regulating an important input in the production of that output – fertilizer. The second set of scenarios analyzes the implications of the recent attempt at encour-aging agricultural diversification through forced land allocation and the gains to be made from removing the restrictions imposed on the agricultural sector by the current land regulatory system. To reflect the attempt of the Vietnamese government to diver-sify agriculture away from paddy and towards other (high-value) crops, scenario 2a analyzes a situation in which the area under paddy is reduced by 5% and this land is then free to be used in the other agricultural sectors. Recall that in the first set of sce-narios (1a and 1b) cross-sectoral land allocation has been assumed to be much more sluggish in Vietnam than in other countries as described in Section 4. The second scenario in the second set, 2b, then analyzes the removal of the rice export and fertil-izer import quotas in a situation in which land is made less sluggish, i.e. reflecting a land reform in which farmers have a larger say as to which crops to grow on their land and hence land allocation across sectors takes place in a market-based fashion. The final set of scenarios, 3a and 3b, analyze the implications of the EU’s current sys-tem of preferential access agreements, which as mentioned earlier, do not include Vietnam. The first scenario 3a evaluates the effect of the Vietnamese rice policy lib-eralization (1b) in a situation where the preferential treatment embodied in the Euro-pean Union’s TRQs and tariff rebates provided to the USA, Thailand, Australia, In-dia, Pakistan, and the ACP and OTC countries is eroded. The second scenario 3b then investigates the impact of the liberalization effort if Vietnam instead received the same preferences as India. The scenarios are summarized in Box 1.

Vietnam’s Rice Policy, FØI 31
Box 1. Scenario design
Scenarios 1a and 1b: The rice export quota and the fertilizer import quota. Scenario 1a:
- Removal of the rice export quota. - Fertilizer import quota remains in place. - Land allocation across sectors is more sluggish in Vietnam than in other countries.
Scenario 1b: - Same as 1a except that the fertilizer import quota is also removed.
Scenarios 2a and 2b: Land reforms and re-allocation plans. Scenario 2a:
- Same as scenario 1b except that land is withdrawn from the paddy rice sector (5%) and this land can then freely be distributed across the other agricultural sectors.
Scenario 2b: - Same as scenario 1b except that land allocation across sectors is made as sluggish in Vietnam as
in other countries. -
Scenarios 3a and 3b: The preferential access agreements of the EU. Scenario 3a:
- Same as scenario 1b except that the preferences embodied in the TRQ and tariff rebate systems are eroded. All exporters of rice to the EU face the same MFN bound tariff rate as is default in the standard GTAP database.
Scenario 3b: - Same as scenario 1b except that Vietnam receives the same preferences as India does, i.e. the
preferential treatment embodied in the tariff rebate system. Macroeconomic closure: The macroeconomic closure applied is a neo-classical closure in which investments at the global level are endogenous and adjust to accommodate any changes in global savings. Investments are allocated across regions to equalize the marginal rate of return across all regions. The numéraire used is the global primary factor price index.
6. Results
Scenarios 1a and 1b: The rice export quota and the fertilizer import quota Removing the rice export quota immediately removes the supply restriction that was depicted in Figure 1 thereby allowing Vietnamese rice exporters to export as much as possible at the going world market price. The results of scenario 1a shown in Table 15 show that exports of processed rice increase by 60.3% whilst exports of paddy rice increase by 24.6%. This amounts to an increase from 3.2 million tons in 1997 (the base year) to a total of about 5 million tons.15 The f.o.b. export prices of Vietnamese rice decline by 4.4% for paddy rice and by 6.5% (not shown in Table 15). 15 The value shares of paddy rice and processed rice in total Vietnamese rice exports as given in the
GTAP database are used as a proxy due to lack of detailed quantity data.

32 Vietnam’s Rice Policy, FØI
To deliver this increase in rice exports, paddy production increases by 6.7% and proc-essed rice production increases by 7.9%. Resources are drawn into the rice sector: the demand for labor and capital increases by about 16% in the paddy sector and by about 8% in the processing industry. This explains the moderate declines in production in the other agricultural sectors. In the other processed food industries, the production decline is larger, namely 6.7%. One part of the explanation is to be found in the inten-sity in the use of unskilled labor in this sector. 12% of total production costs in this industry are spent on unskilled labor – the price of which has increased by 0.3%. More significantly, however, is that the food processing industry in Vietnam is an in-tense user of rice as an intermediate input – the price of which has increased by more than 20% (processed rice). Since this input accounts for more than 6% of total costs this price increase will be felt strongly in this industry. Market prices for paddy rice and processed rice increase by 22.7% and 20.0%, respec-tively, whilst the average land price increases by 28.4%. This average conceals a sharp increase in the price of paddy land (81.7%) and smaller declines in the prices of land used in other sectors (between 0.5% and 6%). The sharp increase in the price of paddy land is due to the increase in paddy production and the sluggishness of sectoral land allocation that has been assumed. This combination means that yields must in-crease and the results indeed show an increase in paddy yields of 6.3%. This yield in-crease is moderate compared with the yield growth that has been experienced in the paddy rice sector over the past decade or so.16 Scenario 1a has the binding fertilizer import quota in place. This means that when removing the rice export quota on its own, this requires an increase in the domestic production of fertilizers. Given that this is just one component of the large GTAP sec-tor “chemicals, rubber & plastics” the resulting increase in production in that sector is just 0.8%. The overall price of “chemicals, rubber & plastics” increases by 0.4% but the price increase facing paddy rice producers is 0.7%.
16 According to Minot and Goletti (2000) the entire increase in rice production during the period
1985 to 1995 can be attributed to higher yields and increased cropping intensity. Yields per crop (tons/hectare/crop) have grown by 32.7% over the period, corresponding to an annual average growth rate of 2.9%. Total yields (tons/hectare) have increased by 61% over the period amount-ing to an average annual increase of 4.9%. Yield growth in Vietnam has by far out-paced the Asian average – perhaps a reflection of a lagged response to liberalization – and is therefore ex-pected to be less rapid in the coming years. According to the results of scenario 1a, yields would increase to more than 6 tons/hectare over the longer term due to the removal of the rice export quota.

Vietnam’s Rice Policy, FØI 33
Tabel 15. Selected production, trade and price results for Vietnam, % change Scenario 1a 1b 2a 2b 3a 3b Production Paddy rice 6.7 6.8 1.9 13.9 6.8 6.9 Wheat -1.0 -0.2 3.4 -2.4 -0.2 -0.2 Cereal grains nec -0.6 -0.4 3.6 -4.1 -0.4 -0.4 Vegetables, fruits & nuts -0.5 -0.5 3.5 -4.6 -0.5 -0.5 Other crops -0.3 -0.5 4.2 -10.1 -0.5 -0.5 Livestock and fisheries -1.1 -1.5 0.2 -2.6 -1.5 -1.5 Other primary production 0.0 -0.3 -0.3 -0.4 -0.3 -0.3 Processed rice 7.9 8.0 2.5 14.7 8.0 7.6 Other processed food -6.7 -8.1 -7.7 -5.9 -8.1 -8.2 Chemicals, rubber & plastics 0.8 -5.3 -5.4 -5.2 -5.3 -5.3 Other manufactures -0.8 1.3 1.3 1.1 1.3 1.3 Services -0.1 -0.2 -0.2 -0.1 -0.2 -0.2 Exports Paddy rice 24.6 25.7 3.9 100.0 27.3 44.1 Wheat -1.4 0.0 7.6 -4.5 0.0 -0.1 Cereal grains nec 3.7 7.9 28.2 -13.4 7.9 8.0 Vegetables, fruits & nuts 3.6 3.9 25.6 -19.2 3.9 3.9 Other crops 0.1 0.0 5.1 -10.6 0.0 0.0 Livestock and fisheries 0.5 -3.3 14.9 -20.2 -3.2 -3.2 Other primary production 0.2 -0.7 -0.8 -0.8 -0.7 -0.7 Processed rice 60.3 61.1 26.3 100.0 60.9 59.0 Other processed food -11.6 -14.3 -13.8 -10.6 -14.3 -14.5 Chemicals, rubber & plastics -2.5 30.3 30.6 29.8 30.3 30.3 Other manufactures -1.0 1.7 1.7 1.4 1.7 1.7 Services 0.0 -8.0 -8.1 -8.3 -8.0 -8.0 Market prices Paddy rice 22.7 22.4 27.3 6.5 22.5 22.9 Wheat 0.1 0.0 -0.8 0.5 0.0 0.0 Cereal grains nec -0.5 -1.0 -3.1 1.8 -1.0 -1.0 Vegetables, fruits & nuts -0.4 -0.5 -2.8 2.6 -0.5 -0.5 Other crops 0.0 0.0 -0.6 1.3 0.0 0.0 Livestock and fisheries -0.1 0.3 -1.4 2.3 0.3 0.3 Other primary production 0.0 0.1 0.1 0.1 0.1 0.1 Processed rice 20.0 19.9 24.2 6.0 20.0 20.3 Other processed food 1.4 1.7 1.7 1.3 1.7 1.8 Chemicals, rubber & plastics 0.4 -3.6 -3.6 -3.6 -3.6 -3.6 Other manufactures 0.1 -0.1 -0.1 -0.1 -0.1 -0.1 Services 0.0 1.3 1.3 1.3 1.3 1.3 Land prices Paddy rice 81.7 87.3 105.7 28.8 87.5 89.1 Wheat -5.7 2.9 -6.8 12.1 2.9 2.8 Cereal grains nec -2.3 1.3 -5.6 10.3 1.3 1.3 Vegetables, fruits & nuts -2.0 0.5 -6.4 9.8 0.5 0.4 Other crops -0.5 0.6 -1.0 4.1 0.6 0.6 Livestock and fisheries -6.0 -6.9 -20.9 11.0 -7.0 -7.1

34 Vietnam’s Rice Policy, FØI
Moreover, if the export quota were removed without simultaneously removing the fertilizer import quota, the power of the actual tariff equivalent paid on imported fer-tilizer increases from 1.13 to 1.15, i.e. an increase in the bindingness of the quota by more than 15%. Yet as discussed above, the Vietnamese government did indeed remove the fertilizer import quota when removing the rice export quota. As Table 15 shows, the differ-ences in the results of the two scenarios 1a and 1b are not very different at a first glance. The increases in paddy and processed rice production and exports in scenario 1b are slightly larger as is the paddy land price. The market price increases are slightly smaller. As expected, domestic production of fertilizers declines in scenario 1b. For the “chemicals, rubber & plastics” sector as a whole production is reduced by 5.3% and the market price declines by 3.6%. The price paid specifically by the paddy rice sector for the imported version of this input declines by 10.1% and the domestic price falls by 3.6% (not shown in Table 15). Despite the apparent similarity of results, the welfare results of the two scenarios show some interesting differences (Table 16). First of all, the increase in regional in-come compared with the outset is 1.31% in scenario 1a against 2.18% in scenario 1b. Likewise, economic welfare, as measured by the Equivalent Variation (EV) increases more than eight times as much in the second scenario as compared with the first sce-nario. A decomposition of the welfare results shows that the allocative efficiency gains dominate in both cases due to the elimination of first the rice export quota in scenario 1a and then also the fertilizer import quota in scenario 1b. In scenario 1a these effects are to a large extent offset by the negative commodity-related terms of trade effects experienced due to lower export prices. In scenario 1b the allocative effi-ciency gains far outweigh the commodity terms of trade losses because the lower Table 16. Welfare results in Vietnam
cScenario
Income Equivalent Variation
(EV) Decomposition of welfare results,
contribution of (USD million):
% change
% change in welfare
USD million
Allocation efficiency effects
Commodity terms of trade effects
Capital terms of trade effects
1a 1.31 0.04 6.98 16.94 -10.14 0.17 1b 2.18 0.29 58.15 45.02 -14.38 27.50 2a 2.30 0.26 51.96 32.91 -8.60 27.65 2b 1.56 0.38 76.13 71.09 -23.50 28.55 3a 2.18 0.29 58.42 44.97 -14.06 27.50 3c 2.22 0.30 60.18 45.18 -12.72 27.56

Vietnam’s Rice Policy, FØI 35
import price on fertilizers kicks in. Moreover, in scenario 1b there is a rather signifi-cant contribution to the welfare gain due to capital terms of trade gains.17 The increase in Vietnamese rice exports due to the removal of the quota does displace the rice exports of the other major rice exporters, as the results show in Table 17. In terms of paddy rice, exports from Thailand are the most affected by the trade regime Table 17. Selected results for competing exporters and EU production results,
% change 1a 1b 2a 2b 3a 3b Exports Paddy rice Thailand -3.8 -4.0 -0.2 -14.8 10.4 -4.3 USA -0.2 -0.2 -0.1 -0.5 5.1 -0.4 China 1.2 1.1 2.2 -2.0 9.4 0.9 India -0.4 -0.4 -0.1 -1.3 -46.5 -1.1 Pakistan -2.4 -2.5 -0.4 -7.6 -25.0 -2.7 Processed rice Thailand -1.4 -1.4 -0.7 -1.9 -1.8 -1.3 USA -0.7 -0.7 -0.3 -1.2 -0.3 -0.7 China -2.7 -2.8 -1.2 -4.4 -2.2 -2.7 India -2.0 -2.0 -0.9 -3.2 -2.5 -1.9 Pakistan -1.8 -1.8 -0.8 -2.9 -3.2 -1.7
Production Paddy rice Thailand -0.5 -0.5 -0.2 -1.0 -0.2 -0.5 USA -0.1 -0.1 0.0 -0.2 1.2 -0.1 China 0.0 0.0 0.0 0.0 0.0 0.0 India -0.1 -0.1 0.0 -0.1 -0.6 -0.1 Pakistan -0.1 -0.1 0.0 -0.2 -0.3 -0.1 Processed rice Thailand -0.5 -0.5 -0.2 -0.6 -0.6 -0.4 USA -0.7 -0.7 -0.3 -1.1 -0.5 -0.7 China 0.0 0.0 0.0 -0.1 0.0 0.0 India -2.0 -2.0 -0.9 -3.2 -2.5 -1.9 Pakistan -0.3 -0.3 -0.1 -0.5 -0.6 -0.3 Production in the EU Paddy rice -0.3 -0.3 -0.1 -0.7 6.6 -0.7 Processed rice -0.3 -0.3 -0.1 -0.5 -0.5 -0.4
17 Capital is traded internationally in this model and liberalization of rice/fertilizer policy regime
means that investment in Vietnam becomes substantially more attractive. Hence the value of capital goods increases here relative to other regions. It can be discussed whether the size of the capital terms of trade effect, relative to the overall welfare gain, is realistic. The simulations have been conducted using alternative closures and parameter values but the results are not markedly different.

36 Vietnam’s Rice Policy, FØI
reform in Vietnam. Thai paddy rice exports are reduced by almost 4%. Investigating the initial base data shows that both countries compete on particularly the Indonesian market for paddy rice. In terms processed rice, it is primarily China, India and Paki- stan that loose market shares to Vietnam. These countries compete with Vietnam par-ticularly in the Other Low Income Asia market, which includes the Philippines, Ma-laysia, Bangladesh and Sri Lanka. Rice exports and production in the USA are hardly affected, on the other hand, because this country caters for other markets (particularly Central and Latin America, Japan, the Middle East and Western Europe) than Viet-nam does (particularly Asian markets).
Scenarios 2a and 2b: Land reforms and re-allocation plans
Both land reform scenarios 2a and 2b are to be compared with scenario 1b in which both the rice export quota and the fertilizer import quota are removed. As mentioned in Section 3 the Vietnamese government is concerned about diversifying agriculture and in an effort to avoid relying too heavily on rice production and exports, land is being shifted – by the Government – out of the paddy rice sector. Scenario 2a ana-lyzes the effects of a situation in which the land area dedicated to paddy rice is re-duced by 5%. This freed-up land is then endogenously distributed among the other agricultural sectors. As can be seen in Table 15 this substantially restricts the expan-sion potential of the rice sector in spite of the removal of the export quota and the fer-tilizer import quota. The production response in both sectors is substantially lower: 1.9% and 2.5%, respectively. As a consequence, paddy exports increase by just 3.9% (compared with 25.7% in scenario 1b) and processed rice exports increase by 26.3% (compared with 61.1% in scenario 1b). This lower production and export response is of course also reflected in markedly smaller effects of the exports and production of rice of Vietnam’s competitors (Table 17). Freeing up of 5% of the paddy rice land area and re-allocating this to the other agri-cultural sectors has a substantial effect on production of these commodities. The other crop sectors increase production by between 3.4% and 4.2%. This leads to large in-creases in the exports of these commodities – particularly for cereal grains and vege-tables, fruits and nuts. The paddy land price shoots up dramatically (more than 100%) and therefore – as a consequence of increased costs of production – the market price of paddy increases substantially with spillover effects on processed rice prices. This forced diversification of agriculture comes at a price: The welfare gain is lower in scenario 2a compared with scenario 1b: USD 52 million against USD 58 million (Ta-

Vietnam’s Rice Policy, FØI 37
ble 16). Particularly the allocative efficiency gains are smaller in relative terms due to the direct (forced) re-allocation of land taking place among the agricultural sectors. The second scenario in this set, 2b, examines the consequences of removing the over-all restrictions on land mobility that currently characterize the situation for Vietnam-ese agriculture (again this scenario is to be compared with 1b). As shown in Table 15 the export and production response in Vietnam is substantially larger when cross-sectoral land allocation is less sluggish (scenario 2b). Exports double, and production increases by 13.9% and 14.7% in the paddy and processed rice sectors, respectively. Moreover, the negative effects on the production and exports of other agricultural commodities are larger in this case. Production of “other crops”, for example, de-clines by 10% and exports fall by 11%. Clearly, this is a response to the general real-location of resources (labor and capital) out of these sectors and into the rice sectors, but this time land is substantially more mobile across sectors and the market forces determine the resulting land allocation. The land price differences across sectors narrows and the huge hike in paddy land prices experienced in scenario 1b has now moderated to an increase of 28.8%. But now the land prices in the other agricultural sectors have increased by 4.1% to 12.1%, thereby leading to higher costs of production and therefore slightly higher market prices. The market price of paddy rice rises much less in this scenario (6.5%) than in scenario 1b (22.6%) due in part to the lower cost of land. Hence the resulting market price of processed rice increases by just 6.0% in scenario 2b compared with 19.9% in scenario 1b. The welfare results of this scenario (Table 16) show that liberalizing the land allocation system enhances welfare from USD 58 million in scenario 1b to USD 76 million in scenario 2a. Furthermore, comparing with scenario 1b, the importance of the allocative efficiency effects in the overall welfare gain is greater when cross-sectoral land mobility is enhanced. The negative contribution of the commodity terms of trade effect is slightly greater in relative terms because the f.o.b. export prices for rice decline more in scenario 2b than in scenario 1b. It may be concluded that liberalization of the Vietnamese rice policy regime generates the greatest welfare gains when accompanied by a market-based re-allocation of land. Removing the restrictions on sectoral land mobility clearly increases the expansion potential of rice production and exports. This is achieved in part by drawing resources out of the other agricultural sectors. Nevertheless, the results also show that a forced diversification of agriculture through government-controlled land re-allocation is not

38 Vietnam’s Rice Policy, FØI
a sensible strategy. Rice production and exports falls far below potential and welfare gains are more than 10% lower than without this initiative.
Scenarios 3a and 3b: The preferential access agreements of the EU
The last two scenarios are also to be compared with scenario 1b. The first scenario 3a simulates a situation in which the EU levels the playing field in the sense that its TRQ and tariff rebate agreements with the USA, Thailand, Australia, India, Pakistan, the ACP and OTC countries are abolished. The second scenario 3b then investigates the consequences of Vietnam receiving the same treatment as India – whilst all other countries retain their preferential agreements with the EU. The production, export and price results of scenario 3a for Vietnam are virtually iden-tical to the results of scenario 1b. This is due to two reasons. The first reason is that the initial rice trade between Vietnam and the EU is of such a small magnitude (Table 18 shows the EU’s rice import structure by source) that eroding the preferences of other exporters only has a marginal effect on the “final outcome” in Vietnam. Table 18. EU’s rice import structure by source (% share of value of imports at
market prices ) Exporter Paddy rice Processed rice Vietnam 0.003 0.001 Thailand 0.100 0.133 USA 0.170 0.084 China 0.059 0.041 India 0.285 0.024 Pakistan 0.019 0.010 EU (internal trade) 0.235 0.444 Australia 0.010 0.010 OCT 0.024 0.092 ACP 0.076 0.029 Rest of world 0.018 0.130 TOTAL 1.000 1.000
As is evident in Table 19 Vietnam’s paddy and processed rice exports to the EU in-crease by 91.8% and 81.6%, respectively, in scenario 3a. This is to be compared with increases of 49.2% and 72.8%, respectively, in scenario 1b. Hence removing the pref-erences granted to Vietnam’s competitors does increase the country’s exports to the EU, but not by enough to have any substantial effect on the production and trade re-sults (compared with scenario 1b). There is not much of a trade diverting effect either

Vietnam’s Rice Policy, FØI 39
in terms of Vietnam’s rice export pattern. Vietnam’s exports to the other regions in-crease by approximately the same amounts in both scenarios. The second reason has to do with the restrictive nature of the Armington specification. When initial trade shares are small, this specification of import demand in the model will never be able to generate very much ‘action’ and so we will clearly be underestimating the potential for expanding Vietnamese rice exports to the EU as a consequence of e.g. trade policy reforms and/or the provision of preferential access. Table 19. Vietnam’s exports to selected regions, percentage change
1b 3a 3b Exports Paddy rice Low Income Asia 48.8 48.2 44.0 Indonesia 20.2 20.6 18.5 Japan 50.1 50.2 45.3 European Union 49.2 91.8 689.1 ACP countries 51.3 51.8 46.4 Non-ACP Africa 36.3 36.0 33.1 CEECs and FSU 41.7 41.1 37.9 Middle East 51.2 49.2 46.3 Processed rice Low Income Asia 56.3 56.0 52.9 Indonesia 63.4 63.3 59.5 Japan 72.9 72.7 68.2 European Union 72.8 81.6 700.0 ACP countries 72.4 71.4 67.8 Non-ACP Africa 59.9 60.4 56.2 CEECs and FSU 66.6 66.4 62.5 Middle East 81.5 80.2 76.2
In scenario 3b the preferences vis à vis the other exporters remain intact, but Vietnam receives the same treatment by the EU as India does. Vietnam’s exports to the EU in-crease seven-fold, and this time some trade diversion occurs since exports to other re-gions do not increase as sharply in scenario 3b as compared with scenario 1b. Both paddy and processed rice exports to other low-income Asian countries increase by 3 percentage points less than in scenario 1b. Trade diversion on the part of Vietnam’s competitors is a different story, however, as is evident from the results shown in Table 17. Particularly India and Pakistan enjoy substantial preferential access to the EU: substantially lower tariffs than the normal rate (35.79% for both India and Pakistan against the normal rate of 64.93% for paddy rice; 51.7% and 49.4% for India and Pakistan, respectively, against the normal rate so f87.38% for processed rice) and no quantitative restrictions in the form of TRQs.

40 Vietnam’s Rice Policy, FØI
Hence when eroding these preferences, these countries exports to the EU decline sub-stantially. In terms of the effect on their total rice exports (i.e. to all destinations) this results in decreases of 46.5% and 25.0% for Indian and Pakistan’s paddy rice imports, respectively. For processed rice the decreases are 2.5% and 3.2%, respectively. For India this decline in exports is large enough to result in a reduction in the production of processed rice of 2.5%. As the initial data in Table 12 shows the US and Thailand exports of paddy rice to the EU far exceed the set quota (facing the lower in-quota tar-iff rate). As the very beneficial preferences provided to India and Pakistan are eroded, paddy exports from the US and Thailand actually increase even though their prefer-ences are also eroded. This is because only a very small share of these exports ini-tially benefits from the lower in-quota tariff rate and so eroding these preferences does not matter much. Retaining the EU’s current preferential access systems but extending them to Vietnam (i.e. by e.g. providing Vietnam with the same treatment as India) in scenario 3b does not change the production and price results much compared with scenarios 1b and 3a. But this time Vietnam’s rice exports increase markedly – by 44.1% for paddy rice and 59.0% for processed rice. As shown in Table 19 this is explained by a significant – and direct – boost of Vietnam’s export opportunities to the EU through the preferen-tial treatment. Moreover, compared with scenario 1b the trade and production effects on Vietnam’s exporters are hardly affected (Table 17). This is because Vietnam – in value terms at least – is not a very large exporter and so there is no basis for substan-tial trade diversion effects just because Vietnam suddenly receives preferential access to the EU rice market.
7. Qualifications and concluding remarks
This paper has addressed a number of important policy changes and structural fea-tures of the Vietnamese economy as they relate to the rice sector. Furthermore, it has touched upon the issue of distortionary effects of preferential trade agreements in a global context. Taking a fairly standard global general equilibrium model as the point of departure, this study has illustrated a number of ways in which the link between economic theory and (politically and structurally determined) economic reality can be made through an empirical analysis. The model has been expanded and amended to represent important policy instruments (e.g. the Vietnamese rice export quota and the EU’s TRQs) and institutional features (i.e. restrictions on land mobility), and data have been collected and processed to reflect the magnitude of distortions caused hereby. Clearly, representation of some policy instruments is more straightforward

Vietnam’s Rice Policy, FØI 41
than others, and information is more readily available for some institutional features than others. In particular, it has been difficult to obtain accurate information about the Vietnamese land regulatory system and its impact. Furthermore, the paper is fairly narrow in scope and hence there are most certainly other structural features and policy instruments that have not been taken account of in this analysis, but which may be important to the Vietnamese rice sector as well. Notwithstanding the above caveats, this study shows that the rice export quota has been a strong regulatory tool in terms of achieving the goals of national self-sufficiency and stable rice prices in Vietnam. Yet the analysis also shows that the ex-port quota has been a very restrictive policy tool that has kept Vietnamese rice pro-duction and exports well below potential. In particular, rice prices have been kept arti-ficially low, thereby reducing the incentive to increase production and hence exports. Nevertheless, the present study has confirmed the correctness in removing the rice export quota and the fertilizer import quota simultaneously. Imported fertilizer is a crucial input to Vietnamese rice production and hence the liberalization of that policy regime significantly improves the allocative efficiency of the economy. The Vietnamese land reforms over the two past decades have come a long way in terms of acknowledging the individual farm household as the basic unit of agricultural production. Nevertheless, there are still certain restrictions on the cross-sectoral mo-bility of agricultural land. The present analysis shows that such restrictions pose a se-rious constraint on the production - and hence also the export - response of the rice sector in connection with liberalization of the rice policy regime. Moreover, the study clearly shows that the Government’s attempt to control the diversification of the country’s agricultural production by managing the allocation of land among the dif-ferent sectors runs the risk of leading to an agricultural production structure that does not reflect the country’s comparative advantages at the going world market prices. There is no doubt that a market-based land allocation is the preferred response to this challenge. Vietnam has only recently re-entered the international rice market and has not yet ne-gotiated preferential trade agreements with e.g. the European Union. Many other de-veloping (and developed) countries have preferential access agreements with the EU regarding rice. Particularly India and Pakistan benefit from such special agreements because they face lower tariffs but no quantitative restrictions. This analysis shows that because Vietnam’s initial rice trade with the EU is so limited, leveling the play-ing field by eroding the other countries’ preferences does not have much of an effect

42 Vietnam’s Rice Policy, FØI
on Vietnam’s production and aggregate exports of rice. Part of the reason for this re-sult, however, relates to the Armington specification of import demand in the model implying that the Vietnam-EU trade potential is most certainly underestimated. If Vietnam instead were to receive the same preferential treatment as e.g. India, exports to the EU would increase substantially. Vietnam would shift some of its exports away from its current partners and towards the EU. Such an agreement would have a sig-nificant effect on Vietnam’s aggregate rice exports, but other rice exporters would not be affected much because Vietnam would still be a relatively small player on the European market compared with e.g. Thailand, the US, and India.
8. References
Bach, Christian F. and Ken R. Pearson (1996) Implementing Quotas in GTAP using GEMPACK or How to Linearize and Inequality. GTAP Technical Paper 4. Global Trade Analysis Project, Purdue University.
CIE (1998) Vietnam’s Trade Policies 1998, Centre for International Economics, Can-
berra and Sydney. Dimaranan, B. V. and R. A. McDougall (2001). Global Trade, Assistance, and Pro-
duction: The GTAP 5 Data Base, Center for Global Trade Analysis, Purdue University.
Elbehri, Aziz and Ken R. Pearson (2000) Implementing Bilateral Tariff Rate Quotas
in GTAP using GEMPACK. GTAP Technical Paper 18. Global Trade Analysis Project, Purdue University.
European Commission (1998) Commission Regulation (EC) No. 327/98 of 10 Febru-
ary. European Commission (1997) Commission Regulation (EC) No. 196/97 of 31 Janu-
ary. European Commission (1991) Commission Regulation (EEC) No. 862/91 of 8 April. FAO (2001) Review of Basic Food Policies, Food and Agriculture Organization,
Rome.

Vietnam’s Rice Policy, FØI 43
FAO (1995) Cereal Policies Review 1994-95, Food and Agriculture Organization, Rome.
FAOSTAT (2001) FAOSTAT Agriculture Data, www.fao.org, Accessed September
2001 FAS (2000) The EU Rice Regime - Revised. Foreign Agricultural Service (FAS)
Global Agriculture Information Network (GAIN) Report # E20020. United States Department of Agriculture.
Gehlhar, M.(1997) ‘Historical analysis of growth and trade patterns in the Pacific
Rim; An evaluation fo the GTAP framekwork’, Chapter 14 in Hertel, T.W. (ed.) Global Trade Analysis: Modeling and applications. Cambridge University Press.
GSO (1999) Statistical Yearbook 1998. General Statistics Office, Hanoi. Harrison, W.J. and Ken R. Pearson (2000). GEMPACK User Documentation Release
7.0. Centre of Policy Studies and Impact Project, Monash University. Hertel, Thomas W. (1997). (ed.) Global Trade Analysis: Modeling and applications.
Cambridge University Press. Goletti, Francesco (1998) Trade Distortions and Incentives in Agricultural Trade:
The Case of Rice, Sugar, Fertilizer, and Livestock-Meat-Feed Sub-Sectors in Viet Nam. Background paper for the World Bank Viet Nam Rural Development Strategy, FAO Loan Agreement No. TCI 44/98, International Food Policy Re-search Institute, Washington, D.C.
Goletti, Francesco and Karl Rich (1998) Policy Simulation for Agricultural Diversifi-
cation. Final Report. Strengthening Capacity for the Renewal of Rural Devel-opment in Vietnam (Phase 1). UNDP VIE/96/008/A/01/99. International Food Policy Research Institute, Washington, D.C.
Malcolm, Gerard (1997). Adjusting Tax Rates in the GTAP Data Base. GTAP Tech-
nical Paper 11. Global Trade Analysis Project, Purdue University.

44 Vietnam’s Rice Policy, FØI
Minot, Nicholas and Francesco Goletti (2000) Rice Market Liberalization and Pov-erty in Vietnam, Research Report, International Food Policy Research Institute, Washington, D.C.
Nielsen, Chantal Pohl (2002) Vietnam in the International Rice Market: A Review and
Evaluation of Domestic and Foreign Rice Policies. Report No. 132, Danish Re-search Institute of Food Economics, Copenhagen.
Nielsen, Chantal Pohl (2001) “Chapter 11.G.: Vietnam” in Dimaranan, B. V. and R.
A. McDougall (eds.). Global Trade Assistance and Production: The GTAP 5 Data Base, Center for Global Trade Analysis, Purdue University.
Nielsen, Chantal Pohl (1999) EU Enlargement and the Common Agricultural Policy:
Modeling Issues. Working Paper no. 7/99. Danish Institute of Agricultural and Fisheries Economics, Copenhagen.
Nielsen, Chantal Pohl and Wusheng Yu (forthcoming) The International Rice Mar-
ket: Market Intgeration and Import Demand Analysis. Working Paper, Danish Research Institute of Food Economics, Copenhagen.
Oryza (2001 and 2000) Country Market Reports Online at http://oryza.com/ Pearson, Ken R. (2001) Complementarity. Draft documentation for GEMPACK Re-
lease 8.0. Mimeo. Que, Nguyen Trung and Nguyen Ngoc Que (2000) Effects of Trade Liberalization on
Agriculture in Viet Nam: Commodity Aspects. Working Paper no. 52, The CGPRT Centre, Bogor, Indonesia.
Ravallion, Martin and Dominique can de Walle (2001) Breaking up the Collective
Farm: Welfare Outcomes of Vietnam’s Massive Land Privitization. World Bank, Washington, D.C.
Tanaka, Tomomi (2001) Evaluating the Land Distribution unde rth erenovation (Doi
Moi) policy in the Red River Delta, Vietnam. Mimeo, Department of Economics, University of Hawaii, Manoa, East West Center.

Vietnam’s Rice Policy, FØI 45
Van de Walle (2002) Personal correspondence. Development Economics Research Research Group (DECRG), World Bank, Washington, D.C.
WTO (2002) Tariff Quota Administration Methods and Tariff Quota Fill. Document
TN/AG/S/6. Geneva.

46 Vietnam’s Rice Policy, FØI
Appendix: Modeling the rice export quota and the land allocation regime in the GTAP model programmed in GEMPACK
Note that unless otherwise specified, the model equations are written in linearized form (i.e. differentiated), usually expressed in terms of percentage changes in the va-riables. E.g. the levels equation V = P Q relates the dollar value V of a commodity to its price P (USD per ton) and its quantity Q (tons). The linearized version is p_V = p_P + p_Q. In other words, to the first order, the percentage change in the dollar value p_V is equal to the percentage changes p_P in the price and p_Q in the quantity. Global export quota module in the GTAP model (programmed in GEMPACK) !---SUBSETS FOR EXPORT QUOTA -------------------------------------------------! !GEXQ_COMM includes just rice.! set GEXQ_COMM (pdr, pcr) ; subset GEXQ_COMM is subset of TRAD_COMM ; set NONGEXQ_COMM = TRAD_COMM - GEXQ_COMM ; !-----------------------------------------------------------------------------! VARIABLE (Levels) (all,i,GEXQ_COMM)(all,r,GEXQ_REG) TX_QUOTA(i,r) # Extra export tax due to global export quota # ; ! for quota commodity i in r exported to all regions ! Variable (Levels) (all,i,GEXQ_COMM)(all,r,GEXQ_REG) QX_RATIO(i,r) # Ratio between volume of exports and quota export volume # ; !+++ VARIABLES +++++++++++++++++++++++++++++++! ! Variables added to make connection between linear GTAP.TAB and levels-style quota equations ! Variable (linear) (all,i,GEXQ_COMM)(all,r,GEXQ_REG) qx_quota(i,r) #Volume export quota on exports of i from r to all destinations#; Variable (linear) (all,i,GEXQ_COMM)(all,r,GEXQ_REG) px(i,r) #Price of i supplied from r to all regions incl. ordinary export taxes#; !But excluding export quota tariff equivalents!

Vietnam’s Rice Policy, FØI 47
!+++ DATA +++++++++++++++++++++++++++++++! FILE (TEXT) EXP_QUOTA # File containing export quota data # ; READ QX_RATIO from FILE EXP_QUOTA ; READ TX_QUOTA from FILE EXP_QUOTA ; !+++ EQUATIONS +++++++++++++++++++++++++++++++! !+++ Defining qx(i,r) for use in Equ. E_QX_RATIO below +++++++++++++++++++++++! COEFFICIENT (all,i,TRAD_COMM)(all,r,REG) VXM(i,r) #aggregate exports of i from r at market prices#; Formula (all,i,TRAD_COMM)(all,r,REG) VXM(i,r) = sum(s,REG,VXMD(i,r,s)); Variable (linear) (all,i,TRAD_COMM)(all,r,REG) qx(i,r) # change in quantity of aggregate exports of i from r#; Equation (linear) AGGEXPORTS # computes change in aggregate exports of i from r # (all,i,TRAD_COMM)(all,r,REG) VXM(i,r)*qx(i,r) = sum(s,REG,VXMD(i,r,s)*qxs(i,r,s)); !-----------------------------------------------------------------------------! EQUATION (linear) E_QX_RATIO # Links export volume, quota and ratio # (all,i,GEXQ_COMM)(all,r,GEXQ_REG) !Levels equation is QX_RATIO(i,r) = QX_L/QX_QUOTA! qx(i,r) = p_QX_RATIO(i,r) + qx_quota(i,r); !+++++++++++++++++++++++++++++++++++++++++++++++++!

48 Vietnam’s Rice Policy, FØI
EQUATION (linear) E_PFB # Links domestic price of exports with ordinary and quota-related export taxes # (all,i,GEXQ_COMM)(all,r,GEXQ_REG)(all,s,NONGEXQ_REG) pfob(i,r,s) = px(i,r) - p_TX_QUOTA(i,r); !++++++++++++++++++++++++++++++++++++++++++++++++++! !+++ Defining txsagg(i,r) for use in Equ. EXPRICES below ++++++++++++++! Variable (linear) (all,i,TRAD_COMM)(all,r,REG) txsagg(i,r) # combination of destination specific export taxes of i from r#; Equation (linear) E_TXSAGG # computes weighted sum of destination-specific taxes on exports of i from r # (all,i,TRAD_COMM)(all,r,REG) VXM(i,r)*txsagg(i,r) = sum(s,REG,VXMD(i,r,s)*txs(i,r,s)); !-----------------------------------------------------------------------------! ! Next equations are modified from the usual GTAP94.TAB version If this quota addition is used the original equation (EXPRICES) should be deleted or excluded with strong comment marks. This equation links agent's and world prices. In addition to tx we have ts which embodies both production taxes (all s) and export taxes (r not equal to s) (HT#27)! Equation (linear) TXN3 (all,i,GEXQ_COMM)(all,r,GEXQ_REG) tx(i,r) = txn(i,r) + txsagg(i,r) + p_tx_quota(i,r); EQUATION (linear) EXPRICES4 (all,i,GEXQ_COMM)(all,r,GEXQ_REG) px(i,r) = pm(i,r) - txn(i,r) - txsagg(i,r); !+++++++++++++++++++++++++++++++++++++++++++++++++! COMPLEMENTARITY (Variable = TX_QUOTA, Upper_Bound = 1) EXPQUOTA

Vietnam’s Rice Policy, FØI 49
(all,i,GEXQ_COMM)(all,r,GEXQ_REG) QX_RATIO(i,r) - 1; ! The complementarity expression ! ! Complementarity means: Either TX_QUOTA=1 and QX_RATIO - 1 <= 0 [in-quota], or TX_QUOTA<=1 and QX_RATIO - 1 = 0 [on-quota] ! VARIABLE (Levels, Change) (all,i,GEXQ_COMM)(all,r,GEXQ_REG) QX_RENT_RAT(i,r) # Ratio of quota rent to pre-quota value of exports for each commodity #; ! Here pre-quota value is taken as the value including normal export tariffs - that is, QXS_L*PXS_L. Thus, in the levels, QXS_RENT_RATIO_L= [QXS_L*(PFOB_L-PXS_L)]/[QXS_L*PXS_L] = [PFOB_L/PXS_L] - 1 = [1/TXS_QUOTA] - 1 ! Equation (Levels) E_QEX_RENT_RAT (all,i,GEXQ_COMM)(all,r,GEXQ_REG) QX_RENT_RAT(i,r) = [1/TX_QUOTA(i,r)] - 1 ; !------------------------------------------------------------------------------! Land allocation module in the GTAP model (programmed in GEMPACK) !---SUBSETS FOR LAND MODULE -------------------------------------------------! Set VIET # Vietnam # (vnm); Subset VIET is subset of REG; Set NONVIET # Other regions than Vietnam # (tha,usa,chn,ind,pak,lia,idn,jpn, hia,eu,aus,oct,acp,nafr,cef,cam,mea,row); Subset NONVIET is subset of REG; Set LAND # Land # (land); Subset LAND is subset of ENDWS_COMM;

50 Vietnam’s Rice Policy, FØI
Set NONLAND # Natres, ie. ENDWS that is not land # (natres); Subset NONLAND is subset of ENDWS_COMM; Set PDR # Paddy rice # (pdr); Subset PDR is subset of PROD_COMM; Set NONPDR # Non paddy sectors that use land # (wht,gro,v_f,otc,lvf); Subset NONPDR is subset of PROD_COMM; Set NONPDRAGR # Non pdr and non ag # (opr,pcr,prf,crp,mnfcs,svces,cgds); Subset NONPDRAGR is subset of PROD_COMM; Set AGR # pdr and other land using sectors # (pdr,wht,gro,v_f,otc,lvf); Subset AGR is subset of PROD_COMM; !-----------------------------------------------------------------------------! ! Introduce region-specific ETRAE(i,r)! Coefficient (all,i,ENDW_COMM)(all,r,REG) ETRAE(i,r) # elst.of transformation for sluggish primary factor endowments #; Read ETRAE from file GTAPPARM header "ETRR"; !Equation ENDW_SUPPLY # eq'n distributes the sluggish endowments across sectors (HT 51) # (all,i,ENDWS_COMM)(all,j,PROD_COMM)(all,r,REG) qoes(i,j,r) = qo(i,r) - endwslack(i,r) + ETRAE(i,r)*[pm(i,r) - pmes(i,j,r)];! Variable qo1; Equation ENDW_SUPPLY1 # eq'n distributes the sluggish endowments across sectors (HT 51) # (all,i,LAND)(all,j,PDR)(all,r,VIET) qoes(i,j,r) = qo1; Coefficient (all,i,LAND)(all,j,NONPDR)(all,r,VIET) REVSHR2(i,j,r); Formula (all,i,LAND)(all,j,NONPDR)(all,r,VIET) REVSHR2(i,j,r) = VFM(i,j,r) / sum(k,NONPDR, VFM(i,k,r));

Vietnam’s Rice Policy, FØI 51
Variable pm2; Equation DEF_PM2 # eq'n calculates composite price in nonpdr land-using sectors in VNM # (all,i,LAND)(all,r,VIET) pm2 = sum(k,NONPDR, REVSHR2(i,k,r) * pmes(i,k,r));
Variable qo2; Equation ENDW_SUPPLY2 # eq'n distributes the sluggish endowments across sectors (HT 51) # (all,i,LAND)(all,j,NONPDR)(all,r,VIET) qoes(i,j,r) = qo2 - endwslack(i,r) + ETRAE(i,r) * [pm2 - pmes(i,j,r)]; Equation ENDW_SUPPLY3 # eq'n distributes the sluggish endowments across sectors (HT 51) # (all,i,LAND)(all,j,NONPDRAGR)(all,r,VIET) qoes(i,j,r) = qo(i,r) - endwslack(i,r)+ ETRAE(i,r) * [pm(i,r) - pmes(i,j,r)]; Equation ENDW_SUPPLY4 # eq'n distributes the sluggish endowments across sectors (HT 51) # (all,i,NONLAND)(all,j,PROD_COMM)(all,r,VIET) qoes(i,j,r) = qo(i,r) - endwslack(i,r)+ ETRAE(i,r) * [pm(i,r) - pmes(i,j,r)]; Equation ENDW_SUPPLY5 # eq'n distributes the sluggish endowments across sectors (HT 51) # (all,i,ENDWS_COMM)(all,j,PROD_COMM)(all,r,NONVIET) qoes(i,j,r) = qo(i,r) - endwslack(i,r) + ETRAE(i,r)* [pm(i,r) - pmes(i,j,r)]; Equation TOTLAND # eq'n ensures that total land used in VNM still adds up # (all,i,LAND)(all,r,VIET) sum(j,agr, VFM(i,j,r))*qo(i,r) = sum(j,PDR,VFM(i,j,r))*qo1 + sum(j,NONPDR,VFM(i,j,r))*qo2;

52 Vietnam’s Rice Policy, FØI
Working Papers Fødevareøkonomisk Institut
8/02 Maj 2002 Chantal Pohl Nielsen Vietnam’s Rice Policy: Recent
Reforms and Future Opportunities 7/02 Maj 2002 Jesper Graversen og
Morten Gylling Energiafgrøder til fastbrændsels-
formål – produktionsøkonomi, håndteringsomkostninger og leve-ringsplaner
6/02 April 2002 Red. Søren Marcus
Pedersen, Jørgen Lindgaard Pedersen og Morten Gylling
Perspektiverne for præcisions-jordbrug
5/02 Februar 2002 Wusheng Yu Projecting World Food Demand
using Alternative Demand Sys-tems
4/02 Februar 2002 Jørgen D. Jensen Fødevarekvalitet og –sikkerhed
Centrale begreber og deres opera-tionalisering
3/02 Januar 2002 Jesper Andersen, Hans
Frost og Jørgen Løkke-gaard
Prognose for fiskeriets indtjening 2002
2/02 Januar 2002 Christian Bjørnskov
and Kim Martin Lind
Where Do Developing Countries Go After Doha? An analysis of WTO positions and potential alliances
1/02 Januar 2002 Michael Friis Jensen Reviewing the SPS Agreement: A
Developing Country Perspective 20/01 December 2001 Søren Svendsen Empirisk analyse af generations-
skifter i landbruget
Vietnam’s Rice Policy, FØI 53
19/01 December 2001 Jens Abildtrup and Morten Gylling
Climate change and regulation of agricultural land use: A literature survey on adaptation options and policy measures
18/01 November 2001 Philip D. Adams, Lill Andersen and Lars-Bo Jacobsen
Does timing and announcement matter? Restricting the production of pigs within a dynamic CGE model
17/01 November 2001 Henrik Bolding Peder-
sen og Steffen Møllen-berg
Gartneriets økonomi 1995-99 med særligt henblik på omkost-ninger til pesticider og biologisk bekæmpelse
16/01 October 2001 Jayatilleke S. Bandara
and Wusheng Yu How Desirable is the South Asian
Free Trade Area? - A Quantitative Economic As-sessment
15/01 Oktober 2001 Kim Martin Lind Food reserve stocks and critical
food shortages – a proposal based on Sub-Saharan Africa needs
14/01 Oktober 2001 Christian Bjørnskov and
Ekaterina Krivonos From Lomé to Cotonou
The new EU-ACP Agreement 13/01 August 2001 Søren E. Frandsen, Hans
G. Jensen, Wusheng Yu and Aage Walter-Jørgensen
Modelling the EU Sugar Policy A study of policy reform scenar-ios
12/01 August 2001 Poul P. Melgaard En afviklingsstrategi for den di-
rekte støtte i EU’s fælles land-brugspolitik - muligheder og begrænsninger
11/01 Juli 2001 Steffen Møllenberg EU´s regnskabsstatistik for jord-
brug 10/01 Maj 2001 Jørgen Dejgård Jensen,
Connie Nielsen og Martin Andersen
ESMERALDA som formodel til makromodellen ADAM Dokumentation og anvendelser

54 Vietnam’s Rice Policy, FØI
9/01 Maj 2001 Jens Hansen Overskuds- og indkomstbegreber i regnskabsstatistikken for land-brug
8/01 May 2001 Chantal Pohl Nielsen Social Accounting Matrices for
Vietnam: 1996 and 1997 7/01 May 2001 Aage Walter-Jørgensen
and Trine Vig Jensen EU Trade Developing Countries
6/01 April 2001 Søren Marcus Pedersen
og Morten Gylling Lupinproduktion til fermente-
ringsindustrien – vurdering af tek-nologi og økonomi
5/01 April 2001 Mona Kristoffersen, Ole
Olsen og Søren S. Thomsen
Driftsgrensøkonomi for økologisk jordbrug 1999
4/01 February 2001 Søren Marcus Pedersen
and Morten Gylling The Economics of producing
quality oils, proteins and bioac-tive products for food and non-food purposes based on biorefin-ing
3/01 Januar 2001 Lars Otto Metoder til atakonstruktion i
Bayesianske netværk – udvikling af beslutningsstøttesystem til sundhedsstyring i svinebesætnin-ger
2/01 January 2001 Søren Marcus Pedersen,
Richard B. Ferguson and R. Murray Lark
A Comparison of Producer Adoption of Precision Agricultural Practices in Denmark, the United Kingdom and the United State
1/01 January 2001 Chantal Pohl Nielsen,
Karen Thierfelder and Sherman Robinson
Consumer Attitudes Towards Genetically Modified Foods The modelling of preference changes