Embed Size (px)
Citation preview
Vietnam Draft Lottery Status and Political Attitudes
Robert S. Erikson Columbia University
Laura Stoker University of California, Berkeley
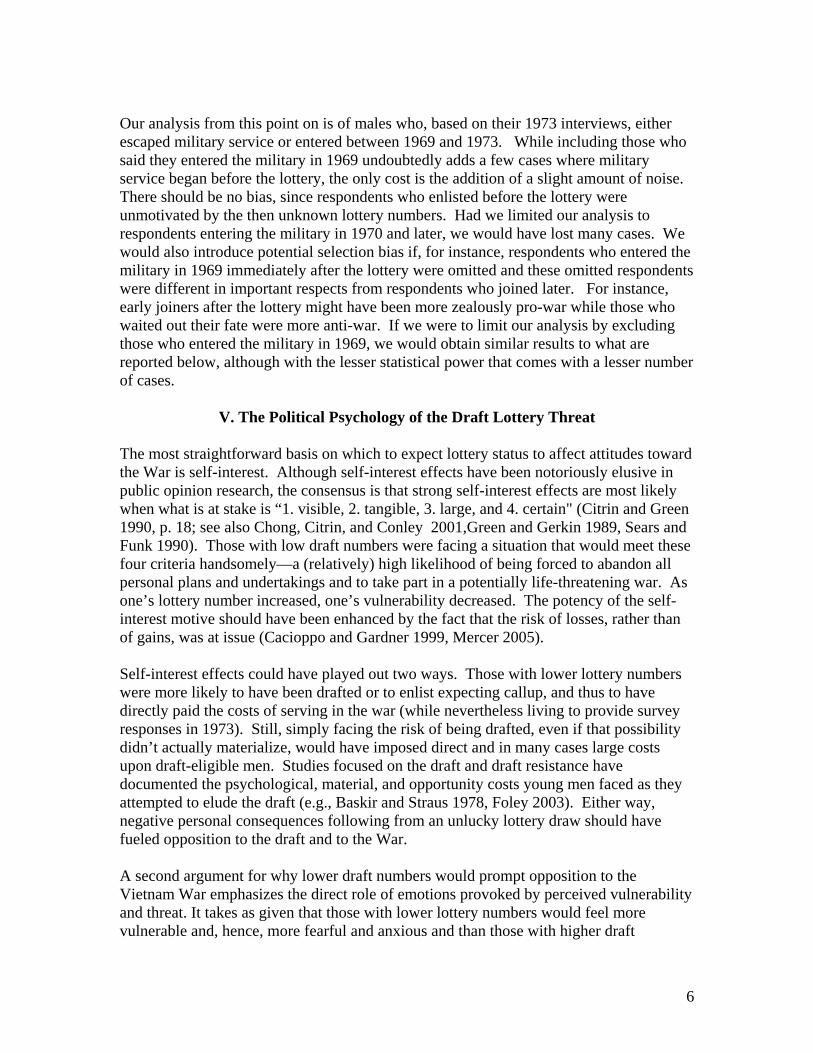
Paper prepared for the New York Area Political Psychology Meeting, April 24, 2008 In 1969, draft numbers randomly assigned to birth dates became important in determining which young men would be called up to fight in Vietnam. We exploit this natural experiment to examine how vulnerability to the draft influenced opinions about the Vietnam War, party identification, political ideology, and attitudes toward salient political figures and issues of the day. Data analyzed come from the Jennings-Niemi Panel Study of Political Socialization, which surveyed high school seniors from the Class of 1965 both before and after the national draft lottery was instituted. We demonstrate that males holding low lottery numbers expressed more negative views of the war in Vietnam, more liberal policy views and ideological identifications, more negative evaluations of Republican and conservative elites, and voted much more strongly for McGovern than did those whose high draft numbers protected them from the draft. Drafter number effects typically exceed those found for pre-adult party identification and are not mediated by military service or the acquisition of higher education.
April 12, 2009.
I. Introduction
Experimentation is often employed in the study of political attitude change. Typically, the experiment is conducted in a survey or laboratory setting. Researchers randomly assign respondents/subjects to either the experimental group receiving the stimulus or to the control group that does not. Post-treatment attitudes of the two groups are then compared to estimate the short-term effect of the treatment. Rarely do we find field experiments or natural experiments outside the lab for the study of attitude change (Dunning 2008). The present study offers an exception. The natural experiment is the imposition of the draft lottery of 1969 during the Vietnam War. In December 1969, men of eligible age were randomly assigned draft numbers based on their birthday. Numbers were assigned from 1 to 366, with those with low numbers called first for induction. Thus, young men could find themselves facing the likelihood of being sent to Vietnam, escape altogether, or some ambiguous status in-between. Vietnam draft lottery status has been used as an instrument before, most famously as an instrument for military service as it affects lifetime earnings and other socio-economic outcomes (Angrist 1990, 1991; Hearst and Newman 1988). Here, as explained further below, we treat lottery status more as an instrument for anxiety or concern about being drafted into the military rather than military service itself. A random draw that determines the possibility of change that is life-altering or even life-threatening is the type of stimulus that could compel major changes in one’s political orientation. Consider the random draw from the draft lottery as an event that altered one’s self-interest. Those who found themselves suddenly free from the draft had less reason to oppose an unpopular war. Those who found themselves vulnerable to serving in an unpopular war had more reason to oppose it. Thus, we have the obvious hypothesis that the lottery number influenced attitudes toward the Vietnam War among young draft-age men who had not yet served in the military. We test this hypothesis in this paper. Potentially of even greater interest, Vietnam lottery status can serve as an instrument for estimating change in one attitude affecting other attitudes and behavior. The opportunity is present to test whether change in war attitudes imposed exogenously by Vietnam lottery outcomes led to further attitudinal and behavioral adjustments. For instance, if a low draft number resulted in opposition to the war, did this opposition lead to voting for McGovern, the anti-war presidential candidate in 1972? Did the newly induced war opponents change other attitudes in other ways to conform to their “dovish” war stance, for instance by becoming more politically liberal? If so, were these changes short-lived, or were they long-lasting, so that the draw of a lottery number influenced their political views down the long road of a political lifetime? The preceding might sound like an ideal research design. But to implement it one needs detailed data regarding attitudes and behavior subsequent to the draft lottery. Fortunately that data is at hand. The data for this study is the Jennings-Niemi Political Socialization Study. For this study, a national sample of high school seniors was interviewed in 1965.
1

They were then subsequently interviewed in 1973. Then they were interviewed two more times, in 1982 and 1997, providing more than half of a political lifetime’s worth of attitudinal data and reports of voting behavior.
II. The Political Socialization Data Set The Political Socialization Panel Study was initiated by M. Kent Jennings and carried out by the University of Michigan's Survey Research Center and Center for Political Studies. The original core of the project consisted of interviews with a national sample of 1669 high school seniors from the graduating class of 1965, distributed across 97 public and non-public schools chosen with probability proportionate to size (Jennings and Niemi, 1974, Appendix). In January through April 1973, 1119 of the initial respondents were again interviewed in person, while an additional 229 who were too remotely located completed a self-administered questionnaire. The resulting N of 1348 represents an unadjusted retention rate of 80.8%. Surveys were completed with a total of 935 individuals across all four waves of the study, for a 4-wave unadjusted retention rate of 56%.1 Almost all of our analysis works with data from the 1965-1973 panel file (ICPSR study #7779). We make use of the 4-wave panel in a preliminary examination of long-term draft lottery effects (study #4037). Of course for the data from the Political Socialization study to be usable for studying these effects, we need respondent dates of birth. Fortunately these are available in the study’s data base. Lottery numbers were ascertained by linking birth data to the corresponding number signifying priority for being called into the army. The study is also rich in outcome measures. As described in more detail below, we make use of questions ascertaining opinions on the Vietnam War and other political issues, attitudes toward the military and student protesters, evaluations of presidential candidates and other prominent political figures, vote choice in the 1972 election, and additional measures of political involvement and attentiveness. In some respects, the timing of the fieldwork for the Political Socialization Panel Study is also ideal for our purposes. This is because many in the class of 1965 were just then losing their educational (college) deferments around the time of the 1969 draft. Those that were still in school at the time knew that their draft lottery number would prevail when their four allotted years of deferment for their schooling had ended. Thus the 1969 draft lottery occurred at an acute moment for this particular age cohort. A seeming handicap for our study is that the response measurement, in early 1973, occurred over three years after the draft. It is possible that draft lottery outcomes affected war attitudes in the short run but that these attitudinal shifts did not persist as long as three-plus years to allow the attitude change to register in the 1973 survey. Another handicap of sorts is that only about one-fourth of the subjects of the study are useful for
1 In 1973 a mailback questionnaire was again used to obtain responses from remotely located individuals. In 1997, which introduced computer-assisted interviewing, about half of the respondents were interviewed in person and half by phone.
2

our study. About one half are women, who were not subject to the draft. Of the men, about half again had already enlisted in the armed services by the time of the 1969 draft lottery. The yield for our study is a set of 390 usable respondents—men who had not served in the military as of 1969 and had been interviewed in both 1965 and 1973. We ask, did their draft numbers for these 390 men alter their political attitudes in 1973 (and beyond)?
III. Background on the Draft Lottery2
Until the end of 1965, the armed forces were almost entirely manned by volunteers. That changed with the escalation of the Vietnam War in 1966, just as the Class of 1965 was reaching the age of draft eligibility (19). Over the next three years, callup, exemption, and deferral decisions were made by local boards operating loosely under federal guidelines. As Baskir and Strauss (1978) put it, “the four thousand draft boards developed four thousand very different policies” (p. 24). Deferments of many forms were in principle available, the most common of which involved the existence of dependents, especially children, and the college student deferment, which required satisfactory academic performance and progress toward the degree. Older men within the 19-26 year old age range were called up before younger, reducing the vulnerability to the draft faced by the class of 1965 in the War’s early years. With the expansion of the draft during 1966-1968 came the draft resistance movement and the growth of dissatisfaction with draft procedures among those not opposed to the draft itself. Blue-ribbon commissions were set up to study Selective Service reform (e.g., Marshall 1967). Draft policies were tweaked through Executive Orders and new legislation. For example, in 1967 the deferment for graduate study was eliminated. The idea of a national draft lottery gained salience. The abolition of college student deferments was debated, in part as a response to the low SES, non-white bias of the draft. At the same time public opinion remained largely against the draft resisters and (at least until mid-1968) ambivalent about or in favor of the War. Soon after taking office, in March of 1969, President Nixon sent to Congress his plan for reform of the draft, which called for a national lottery, a continuation of the college deferment, the creation of a one-year window of maximum vulnerability to the draft, and a shift to prioritizing younger over older men within the 19-26 year old range—with the important proviso that those with deferments would have their year of maximum vulnerability begin whenever their deferment ended, if ever it did.3 By the end of the year the new system was in place. On December 1, 1969, on national television, lottery numbers were assigned to birth dates by picking birth date-stamped capsules from an urn and numbering them, sequentially, from 1 and 366. The resulting numbers were to apply to potential draftees born between 1944 and 1950, which of course included the Class of
2 This section draws upon the histories of the draft provided by Angrist 1991, Baskir and Straus 1978, Card and Lemieux 2001, Foley 2003, Marshall 1967, Morse 2006, and Rostker 2006. 3 Nixon’s statement is available at www.rand.org/pubs/monographs/MG265/images/webG0671.pdf
3

1965.4 Starting with the number 1, assigned to September 14, draft-eligible men would be called up to the extent required to fulfill military need. During the 1969-1972 period there was a good deal of uncertainty about just how high in the 1-366 sequence the draft call would go. Lottery numbers 1 through 195 ended up being called. Thus, as 1969 came to a close, non-exempted members of the Class of 1965 faced what they could have seen coming some six months earlier—a new draft regime, where their vulnerability to the draft was largely dictated by their draft number unless they could obtain or maintain a deferment. For those who had already taken advantage of the student deferment, the time in that refuge was running out. Those newly seeking out the college refuge would find it short-lived, as student deferments were ended in 1971. Even sooner to disappear were the “fatherhood” deferments, which President Nixon abolished by Executive order in early 1970 (Sempel 1970). Lowering the stakes somewhat was the fact that forces were being gradually withdrawn from Vietnam and draft rates were on the decline. On the other hand, new draftees were increasingly sent to combat duty and casualty rates were high.
IV. Military Service, the 1969 Draft Lottery, and the Class of 1965
Of the 672 male respondents interviewed in the 1973 wave of the Political Socialization Panel Study, 56 percent (373 cases) had joined the military by the time of the interview. The majority of these 373 military veterans had joined before 1969, the year of their relevant draft lottery. Thus, the bulk of enlistments occurred before the lottery. But, as we will see the nature of the enlistees changes as of 1969. A key difference between the pre-lottery and post-lottery enlistments was educational status. One useful measure of educational status is the identification of college-bound students from the respondents’ 1965 interviews. For the 1965 interviews, one question asked respondents whether their high school curriculum was college preparatory. Those who said yes (54 percent of the male students) were classified as college-bound. The advantage of this indicator is that it is exogenous to events post-1965. Of course we also have a measure of educational attainment as of the 1973 survey. But this measure is endogenous to military service, as military service retards higher education attainment. The college-bound measure is an excellent sorting variable in the analysis that follows. Table 1 shows the educational aspirations (1965) and attainment (1973) of the 1965 graduation cohort. Prior to 1969, enlistments were drawn almost exclusively from those who were not college bound. Later enlistments—following the lottery—were almost entirely from the college bound. Similarly, few eventual college graduates (as of 1973)
4 Statisticians later demonstrated that the lottery produced departures from what one would have expected from randomness, tied to the fact that the birth date capsules were put into the urn in calendar sequence and mixing them up did not sufficiently destroy the pattern (Rostker 2006). The procedure was changed in subsequent lotteries, which applied to those born after 1950. These minor departures from non-random assignment of lottery number to birth date would only produce a threat to causal inference for our study if there were systematic differences in political attributes depending upon whether one was born earlier or later in the calendar year.
4

enlisted before 1969. Remarkably, virtually no non-college men entered military service in 1969 or later. While the non-college bound were more likely to have military experience as of 1973, the stock of non-college bound military recruits had become exhausted by 1969. By 1969, most of the non-college members of the class of 1965 who joined the military had already enlisted or been drafted. Those among the less educated who had not been swept into the military must have been largely ineligible for military service and thus largely unthreatened by the 1969 draft lottery. The implication is that the effect of the 1969 draft lottery on the cohort of 1965 high school graduates was far greater among those who had entered college than on those without a college background. Prior to 1969, as long as members of the cohort were enrolled in college, they enjoyed the benefit of a military deferment. But these deferments required continued enrollment in good standing and ended with the earning of the four-year degree. Thus their deferments ended about the same time as the 1969 draft lottery. Their 1969 lottery number shaped their fate. This was true even for those still able to postpone their enlistment until the end of their student deferment. Those with a high number could go on with their lives without fear of a military call-up. Others were likely to be called; they had to decide whether to preemptively enlist, wait for their draft notice, or resist. Still others saw themselves somewhere on the fence. Tables 2 and 3 shows the effect of the lottery number on military service, controlling for educational aspiration and attainment. Those who entered post-lottery were mainly college educated (or, in 1965, college-bound) men with unlucky lottery numbers who were drafted or enlisted before they anticipated being drafted. The effect of lottery number on military service clearly increased with education level. At the same time, we note that (according to respondent recall in 1973) most who entered claimed to have enlisted voluntarily rather than via getting drafted. Many of these soldiers evidently enlisted to select from the menu of military fates rather than accept a likely draft into the army. It should also be noted that among our most vulnerable group—college educated with adverse draft numbers who had previously escaped the military—net enlistment 1969-1973 was “only” 45 percent. Readers will note from Tables 2 and 3 that a few 1973 “post-lottery” respondents reported having been drafted even though their lottery numbers were not called. Apart from the inevitable coding error or faulty recall, some of this seeming error represents respondents who actually joined the military just prior to the lottery. This is likely because of our decision to include those who entered the military in the lottery year, 1969, as post-lottery rather than pre-lottery. Probably most military entrants in our sample who claimed to enter in 1969 actually entered post-lottery, perhaps in 1970 but recalled their entry date as 1969 in response to the salience of the 1969 lottery date. As evidence, one sees an increase among 1969 recruits compared to 1968 recruits in the percent who were college-bound and college-educated. Also, the reported 1969 recruits were almost twice as likely to be college educated if they held a lottery number that was called in 1969 (34 percent vs. 66 percent). There would be no difference if enlistment occurred prior to the lottery.
5
Our analysis from this point on is of males who, based on their 1973 interviews, either escaped military service or entered between 1969 and 1973. While including those who said they entered the military in 1969 undoubtedly adds a few cases where military service began before the lottery, the only cost is the addition of a slight amount of noise. There should be no bias, since respondents who enlisted before the lottery were unmotivated by the then unknown lottery numbers. Had we limited our analysis to respondents entering the military in 1970 and later, we would have lost many cases. We would also introduce potential selection bias if, for instance, respondents who entered the military in 1969 immediately after the lottery were omitted and these omitted respondents were different in important respects from respondents who joined later. For instance, early joiners after the lottery might have been more zealously pro-war while those who waited out their fate were more anti-war. If we were to limit our analysis by excluding those who entered the military in 1969, we would obtain similar results to what are reported below, although with the lesser statistical power that comes with a lesser number of cases.
V. The Political Psychology of the Draft Lottery Threat
The most straightforward basis on which to expect lottery status to affect attitudes toward the War is self-interest. Although self-interest effects have been notoriously elusive in public opinion research, the consensus is that strong self-interest effects are most likely when what is at stake is “1. visible, 2. tangible, 3. large, and 4. certain" (Citrin and Green 1990, p. 18; see also Chong, Citrin, and Conley 2001,Green and Gerkin 1989, Sears and Funk 1990). Those with low draft numbers were facing a situation that would meet these four criteria handsomely—a (relatively) high likelihood of being forced to abandon all personal plans and undertakings and to take part in a potentially life-threatening war. As one’s lottery number increased, one’s vulnerability decreased. The potency of the self-interest motive should have been enhanced by the fact that the risk of losses, rather than of gains, was at issue (Cacioppo and Gardner 1999, Mercer 2005). Self-interest effects could have played out two ways. Those with lower lottery numbers were more likely to have been drafted or to enlist expecting callup, and thus to have directly paid the costs of serving in the war (while nevertheless living to provide survey responses in 1973). Still, simply facing the risk of being drafted, even if that possibility didn’t actually materialize, would have imposed direct and in many cases large costs upon draft-eligible men. Studies focused on the draft and draft resistance have documented the psychological, material, and opportunity costs young men faced as they attempted to elude the draft (e.g., Baskir and Straus 1978, Foley 2003). Either way, negative personal consequences following from an unlucky lottery draw should have fueled opposition to the draft and to the War. A second argument for why lower draft numbers would prompt opposition to the Vietnam War emphasizes the direct role of emotions provoked by perceived vulnerability and threat. It takes as given that those with lower lottery numbers would feel more vulnerable and, hence, more fearful and anxious and than those with higher draft
6

numbers. Those feelings, themselves, and any associated cognitions, could prompt aversive reactions to the draft and to the War.5 On the other hand, studies based on interviews with draft-eligible men report that many felt very troubled and torn—anxious about and fearful of being drawn into dangerous circumstances but feeling duty bound to serve their country too, and often conflicted in how they felt about the War (Baskir and Strauss 1978). A third, complementary argument emphasizes an indirect path by which emotions and self-interest may come to shape political views. Work by psychologists and political scientists has established that feelings of fear and anxiety direct attention to the threatening stimulus and prompt learning (e.g., Cacioppo and Gardner 1999, Markus, Neuman, and MacKuen 2000). Similarly, having a direct personal stake in an issue heightens the attention it receives (Krosnick Lau, Brown, and Sears 1978). Thus, the lottery should have prompted those who were most vulnerable to being drafted to pay greater attention to the War and the politics surrounding it. And what anyone would learn when paying attention to the War in the post-lottery period was that casualties were mounting, the War was going badly, and that the majority of the public and many political elites had turned against it (Hallin 1984). Thus, greater opposition to the War among low lottery number holders could have emerged as an indirect consequence of information-seeking sparked by anxiety about the draft. Evidence that draft lottery status affected attitudes toward the Vietnam War would in one sense speak to a void in the literature and in another sense would challenge the received wisdom. Studies of opinions toward the Vietnam War have rarely considered draft status and none to our knowledge have considered draft lottery status. 6 Yet, civilian attitudes toward (or related to) the war in Vietnam have been shown to be at best weakly related to self-interest indicators whether one has a family member or friend serving in Vietnam (Lau, Brown, and Sears 1978, Mueller 1973). Indeed, Lau, Brown, and Sears (1978) find “no evidence that the self-interested had distinctly self-serving attitudes toward the war” (p.479). As we will see, that will decidedly not be the case here.
VI. The Treatment Variable
For the analysis that follows, we measure our treatment variable as lottery number, 1-366. This differs from Angrist (1990, 1991), who utilizes the dichotomous measure of whether
5 Some approaches to emotion view aversive reactions to threatening stimuli as largely non-cognitive, conditioned responses to negative feelings provoked by the stimuli. More common are approaches that view the behavioral response as involving feelings and beliefs packaged together. For recent discussions of this issue see Dolan 2002, Izard 1191, and Huddy, Feldman and Cassese 2007. 6 One study that did so included a dummy variable for draft-age males in multivariate equations predicting presidential approval (Garrtner, Wilkening, and Segura 1997), reasoning that “the individuals most likely to be placed at risk in the military operations would be least supportive, other factors being held constant” (pp. 680-681). All other variables held constant, draft age males expressed more negative presidential approval ratings in the last three years of the War but not in the War’s earlier years. Aggregate studies of presidential approval have considered draft rates (e.g., Mueller 1973, Morris 2006), and draftees have sometimes been singled out in individual-level studies of the effects of military service (e.g., Jennings and Markus 1977).
7

the draft number was called or not. The distinction is that whereas Angrist was interested in creating an instrument for the presence or absence of military service, here we are primarily interested in the draft as an instrument for anxiety about being called to military service. We could also use some measure based on the net frequency of enlistment by lottery number (draftees plus enlistees, including preemptive enlistees). These alternatives to 1-366 lottery number show similar but less pronounced relationships compared to the effects we report below.
VII. Lottery Number and Vietnam Attitudes
The pivotal question this paper addresses is whether 1969 lottery numbers affected Vietnam attitudes in the 1973 survey. We use three measures of attitudes toward the war on the general dove versus hawk dimension. The first measure is the standard question of whether the war was a mistake. The measure has three possible scores: yes (dove), in-between, and no (hawk). The second is also a three-point measure, derived from open-ended responses (in 1973) regarding what should have been done. Respondents were first asked: "DO YOU THINK THE GOVERNMENT HANDLED THE VIETNAM WAR AS WELL AS IT COULD HAVE?" 1=yes, 5=no, others missing These who denied that the government handled the war well were then asked for up to two answers to the following question. "WHAT DO YOU THINK THE GOVERNMENT SHOULD HAVE DONE? First mentions were coded dovish (codes 20-39) or hawkish (1-19). If the first mention was neither a dove or a hawk response, we scored their second mention. Those who failed to offer either a dove or hawk response were coded as in-between. The minority who responded to the first question by agreeing that the government handed the war "as well as it could have" were coded as hawks. Third, we combined the two measures—taking the average of the closed-ended "mistake" responses and the manufactured "what should we have done?" responses. The composite index had 5 possible responses. For all three indices we scaled the variable so that the range was from 0 (dove) to 1 (hawk). Table 3 shows the results of nine bivariate regressions. For each of the three measures, we regress the indicator on lottery number (rescaled to range from 0=lowest through 1=highest) for all draft-vulnerable respondents (males not in the military as of 1969), only the college-bound (based on the 1965 survey), and the non-college bound. For all the draft-vulnerable respondents, each coefficient is in the expected positive direction and either statistically significant or close to it. Dividing by the college-bound variable shows that the effect is limited to the college-bound. In each instance, the coefficient is positive and quite significant for the college bound. Using the combined index, the p-value is .002, suggesting that the positive result could not have occurred by chance more
8
than two times in 1,000 if the null hypothesis were true. For the non-college bound, the coefficients are actually negative and nonsignificant.7 Of special interest is the size of the positive coefficients for the college-bound, which range from .20 to .28. The implication is that the difference between holding the lowest and highest lottery number is about 25 percent along the dove-hawk continuum. Thus, we see a major attitudinal shift lasting as long as 3+ years (from late 1969 to 1973) in attitudes toward the war, with individual fates determined by the luck of the draw. From this point on we treat the effect on lottery number on Vietnam attitudes as a given. The next task is to see whether the lottery also affected corollary attitudes or whether attitude change was limited to views about the war by itself. VIII. Lottery Number and Vote Choice, Policy Attitudes, Ideology, and Partisanship When the lottery number affected men's Vietnam attitudes, did the alteration of views extend to related attitudes involving partisan choice, policy direction, political personalities, and vote choice? That is, did those with high numbers who became hawks also become (for instance) more Republican and conservative? Did those with low numbers, while becoming more dovish also turn more Democratic and liberal? We estimate these effects next. For dependent variables, we use the vote for president in 1972 (as reported in 1973), relative thermometer scores for Nixon minus McGovern, a three-item ideology index, an 8-item policy issue index (left-right), our familiar Vietnam composite index, plus1973 party identification.8 Tables 4 and 5 show the results. As with Table 3, we show effects three ways: for all draft-vulnerable cases, for college-bound only, and for the non-college bound. The first column shows the probit equation predicting presidential vote choice in 1972 (as recalled in 1973). With one prominent exception, they show positive and significant or near significant effects for all cases and especially for the college-bound. In no case do we find significant effects for the non-college bound who, as we saw, were largely
7 Table 3 provides OLS coefficient estimates. Substantive results are comparable if an Ordered Probit model is fit instead, with p-values that are the same or smaller for the full sample and the college-bound. 8 Vote is a dummy variable indicating a choice for Nixon (1) vs. McGovern (0). The difference between the thermometer ratings of Nixon and McGovern was rescaled to range from 0 (100 for McGovern, 0 for Nixon) to 1 (100 for Nixon, 0 for McGovern). The ideology variable captures reactions to liberals and conservatives as groups, based on an index combining liberal-conservative (seven-point) identification, feeling thermometer toward conservatives, and responses to a question about whether liberals have “too much influence,” “too little influence,” or “just about the right amount” of influence in American society. Cases with more than two missing values were dropped from the index. The policy issue index averages the responses to questions on the legalization of marijuana, school prayer, government assistance to blacks, tightening criminal enforcement, level of influence questions regarding,”people on welfare” and “women,” government job assistance, and women’s role (equal with men at one pole of a 7-point scale vs. belong in the home at the other). Cases with 4 or more missing values were dropped from the index. Party Identification is measured with the standard seven-point scale. These latter three variables were also rescaled to range from 0 (liberal/Democratic) to 1 (conservative/Republican).
9

unaffected by the lottery and whose attitudes toward the war did not shift as a function of lottery numbers. The exception is party identification. In no specification does party identification respond to lottery number. The lottery may have affected men’s' attitudes toward the war and also their votes, ideological perspective, and attitudes on issues—but not their partisanship. Table 5 follows up with a closer look the lottery effect on these attitudes among the college bound, adding two exogenous control variables from the 1965 interviews when the respondents were high school seniors. One is a four item issue index from the high-school days. The other is the respondent's party identification while in high school. All variables are coded 0-1 where 0=liberal/Democrat/dove and 1=conservative/Republican/hawk. In general, the control variables boost the R-squared up to the .10-.20 range. The added controls generate slight declines in the standard errors for lottery number, which are in some instances offset by the lower Ns due to missing cases. Perhaps the most interesting thing about Table 5 is the importance of issue attitudes from the high school years. An index based on attitudes toward school prayer, racial segregation, the UN, plus tolerance of communists and atheists dominates party identification as a predictor of the attitudes eight years later. In fact, except for 1973 party identification, the respondent's 1965 party identification is statistically dominated by lottery score.9 It is worth mulling this remarkable fact about these 25 and 26 year old men in 1973 who had a college-preparatory high school education. With their exposure to the 1969 draft and with an early adulthood spent during the turmoil of the Vietnam War years, their lottery number was a stronger influence on their political outlook than their late-childhood party identification. For no dependent variable, was the effect clearer than for reported vote in 1972. The proper methodology for estimating the effects of course is probit. The probit equation predicting the vote reveals an average effect in terms of the probable vote of 40 percentage points varying as the differential from the lowest to highest lottery number.10 The effect can clearly be seen from Figure 1, which simulates the vote as a function (among college-bound) of their predicted vote from 1965 issue positions and partisanship combined with lottery number. The x-axis represents the prediction from probit's linear equation from issue attitudes and partisanship, assuming a lottery number of 1. The y-axis is the probability of a vote for Nixon. The lower of the two curves represents the 9 The basis for this claim is that the coefficients are greater for lottery number than for partisanship when each is measured in 0-1 units based on range. Coefficients are also greater for lottery number when the variables are measured in standard deviation units (standardized regression coefficients). 10 That is, the probable vote is estimated for each respondent two ways: with lottery number 1 and lottery number 366. The average difference is 40 percentage points. The average percentage point difference if every case is at the mean on 1965 party identification and issue attitudes is .44 points, which is the coefficient shown in the table.
10

probability of a Nixon vote contingent on an unlucky lottery number of "1." The higher of the two curves represents the probability of a Nixon vote given a "366" lottery number. Within these two boundary conditions, the actual data are shown. The exact vote differential from lottery number depends on the x-axis; for any point on the x-axis, the distances of the actual observations from the two lines reflects the relative lottery number of the respondent.
IX. Lottery Number and other Political Responses Does lottery status affect attitudes toward partisan political elites other than the two 1972 presidential contenders? In a bivariate analysis, again replicated for the full sample, the college bound, and the non college-bound groups, we show that it does (Table 6). Thermometer ratings of Spiro Agnew and George Wallace grow with lottery number while those of Ted Kennedy decline. Men with low draft numbers express also more negative feelings toward the military and more positive feelings toward "radical students." The findings reinforce how important draft vulnerability was to the political outlook of this cohort even as the War was winding down and the draft itself had ended. As is now familiar, effects evident in the full sample mask important subgroup differences; coefficients are pronounced in size and statistical significance in the college bound group and disappear in the non college-bound group. We also examined the consequences of lottery status for political involvement, attentiveness and knowledge. Either because of anxiety or out of self-interest, one would expect those holding low lottery numbers to have become more attentive to and involved in politics during the post-1969 period than those holding high numbers, all else being equal. We constructed a political participation index based on the number of distinct political acts that the respondent performed between 1965 and 1973.11 A measure of political knowledge counted the number of correct responses to six factual questions. A third indicator of attentiveness focused on the extent to which in 1973 the respondent reported paying attention to politics and public affairs on TV, through newspapers, on the radio, and through magazines. A fourth variable examined whether the respondent reported having more interest in international affairs than in national, state, and local affairs. Table 7 contains these results. Those most vulnerable to the draft were significantly more active during the 1965-1973 period, more knowledgeable about politics, and more likely to cite international politics as of greater interest to them than national or sub-national politics. But they were no more likely, by 1973, to report following politics through the mass media. The political participation finding is especially striking, as we know there is a suppressor problem in this bivariate estimation: low lottery number holders were more likely to have served in the military overseas, and those serving in the military were less like to participate in U.S. politics. Given the positive findings for political knowledge and interest in international 11 These included: voting in 1972, taking part in a protest or demonstration, writing a letter to the editor, contacting a public official, trying to influence others’ votes, giving money to a party or candidate, going to a dinner or rally, doing other campaign work, displaying a button or a bumper sticker, and working with others to try and solve a community problem.
11

affairs, we suspect that the null finding for media attentiveness reflects the timing of the survey, spring of 1973, when the draft was over and the urgency of the threat was gone.12
X. Attitudinal Dynamics
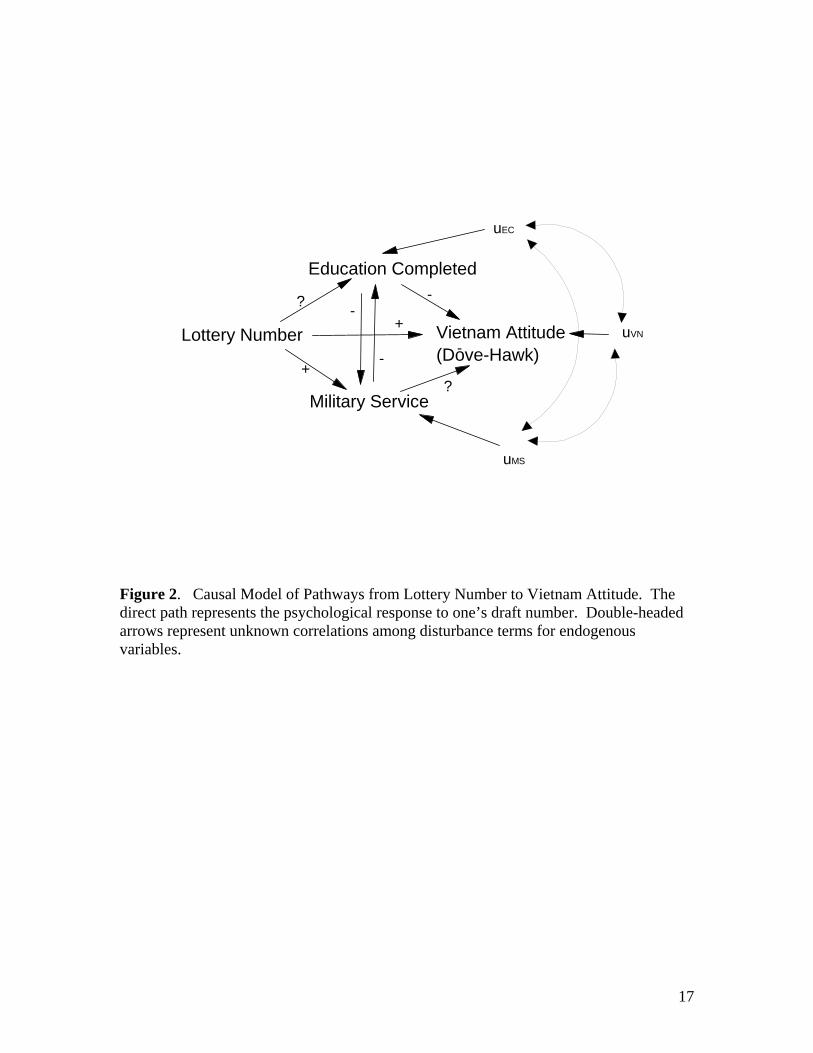
Our lottery analysis provides an extraordinary window into the structure of attitudinal dynamics. By theory, the sequence is that lottery number affects Vietnam attitudes which in turn affect other attitudes like presidential candidate affect, issue attitudes, and ideology, although not other attitudes such as party identification. With the assumption that the effect of lottery numbers on secondary attitudes is indirect via Vietnam attitudes, we can conduct a proper instrumental variable analysis with lottery status as the perfect instrument for Vietnam attitudes. The idea is to estimate the effect of Vietnam attitude on secondary attitudes by using lottery number as the instrument for Vietnam attitude. We present in Table 8 one example of leveraging lottery number as an instrumental variable analysis to infer attitudinal dynamics. The goal is to estimate the effect of Vietnam attitude (the composite dove/hawk scale) on relative thermometer scores for Nixon and McGovern, the two 1972 presidential candidates. First we estimate effects via a naïve OLS analysis, with a bivariate regression predicting relative thermometer scores (Nixon minus McGovern) from the composite Vietnam attitude, both measured in 1973. The analysis is limited to our college-bound sample subject to the 1969 lottery, who voted in 1972. Note the coefficient of .30 which suggests that a shift of a full range across the Vietnam scale (0 to 1) caused a movement equal to 30 percent of the range of the thermometer scale. Of course this estimate is without controls, without considering the possibility of reverse causation, and the potential for measurement error in the independent variable. Next we use Vietnam lottery number as the instrument for Vietnam attitudes. We know this specification is plausible because lottery number predicts Vietnam attitudes and because it is plausible that the reason why lottery number could affect thermometer scores is via Vietnam attitudes. Moreover, lottery number has no direct effect on any other variable. In effect the TSLS analysis replaces Vietnam attitudes in the equation with Vietnam attitudes predicted by the respondent’s lottery number. This new independent variable corrects for spurious correlation, reverse correlation, and measurement error. The key assumption is that the causal pathway from lottery number to candidate attitude is all via Vietnam. Note that the TSLS coefficient is over twice the original OLS coefficient. If the assumptions are valid, the difference of a full range on the Vietnam scale (e.g., total dove to total hawk) causes a movement of more than half the range on the candidate thermometer scale. This of course is an effect much larger than one would expect given the impact of issues, including Vietnam, in cross-sectional voting studies. 12 The political knowledge and international affairs variables were available in the 1965 survey as well. If the lagged dependent variable is added as a predictor, lottery status coefficients hardly change but they do lose statistical significance (p=.102 and .143), leaving us with suggestive but still ambiguous evidence about whether draft status influenced information acquisition and the focus of attention.
12
This exercise is further verification that the effect of the lottery number on the vote is surprisingly strong. If the effect is directly via Vietnam attitudes, an inference is that the OLS estimate is muffled by imperfect measurement of attitudes on the Vietnam dove-hawk continuum. Also, there may have been unobserved confounding variables that worked to lower the correlation between Vietnam attitudes and the vote. (Their effect is nullified when using the random draw from the lottery as the instrument.) Finally, another possibility must be that the specification is flawed—that in fact there is a direct path from lottery number to candidate support that does not travel via Vietnam attitudes.
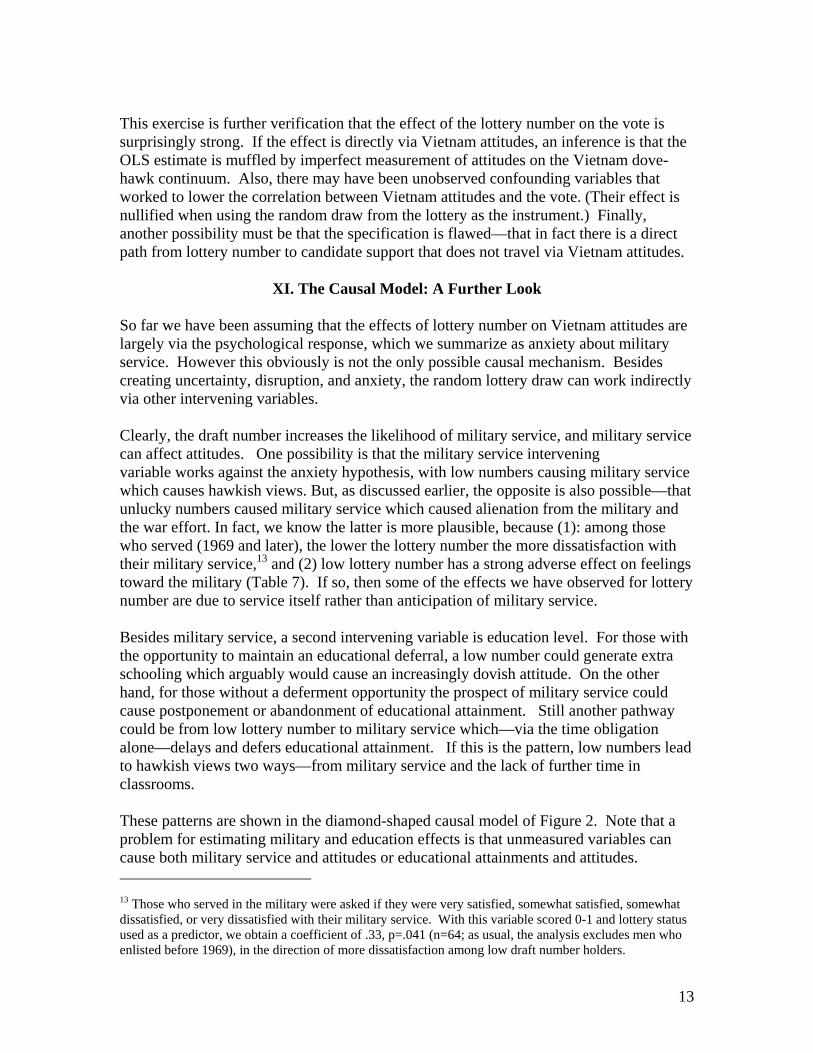
XI. The Causal Model: A Further Look So far we have been assuming that the effects of lottery number on Vietnam attitudes are largely via the psychological response, which we summarize as anxiety about military service. However this obviously is not the only possible causal mechanism. Besides creating uncertainty, disruption, and anxiety, the random lottery draw can work indirectly via other intervening variables. Clearly, the draft number increases the likelihood of military service, and military service can affect attitudes. One possibility is that the military service intervening variable works against the anxiety hypothesis, with low numbers causing military service which causes hawkish views. But, as discussed earlier, the opposite is also possible—that unlucky numbers caused military service which caused alienation from the military and the war effort. In fact, we know the latter is more plausible, because (1): among those who served (1969 and later), the lower the lottery number the more dissatisfaction with their military service,13 and (2) low lottery number has a strong adverse effect on feelings toward the military (Table 7). If so, then some of the effects we have observed for lottery number are due to service itself rather than anticipation of military service. Besides military service, a second intervening variable is education level. For those with the opportunity to maintain an educational deferral, a low number could generate extra schooling which arguably would cause an increasingly dovish attitude. On the other hand, for those without a deferment opportunity the prospect of military service could cause postponement or abandonment of educational attainment. Still another pathway could be from low lottery number to military service which—via the time obligation alone—delays and defers educational attainment. If this is the pattern, low numbers lead to hawkish views two ways—from military service and the lack of further time in classrooms. These patterns are shown in the diamond-shaped causal model of Figure 2. Note that a problem for estimating military and education effects is that unmeasured variables can cause both military service and attitudes or educational attainments and attitudes. 13 Those who served in the military were asked if they were very satisfied, somewhat satisfied, somewhat dissatisfied, or very dissatisfied with their military service. With this variable scored 0-1 and lottery status used as a predictor, we obtain a coefficient of .33, p=.041 (n=64; as usual, the analysis excludes men who enlisted before 1969), in the direction of more dissatisfaction among low draft number holders.
13

However this should not be a problem for estimating the direct effect of lottery number on attitude independent of military service and education. Thus, we can estimate the direct effect of lottery number without bias by controlling for education level and military service. The only remaining problem—quite secondary for our purposes—is that the direct effects of military service and education on attitudes are subject to bias for the usual reasons present in nonexperimental research.14 Table 9 shows the relevant regressions predicting composite Vietnam attitudes among the (1965) college bound. Note that neither intervening variable appears to have much impact (although we can be less sure of these paths that are outside the boundaries of our natural experiment). The coefficient predicting Vietnam attitude directly from lottery number (and its standard errors) is essentially unchanged from our initial analysis from Table 4 without the intervening variables.15 (Although introducing the intervening variables does not alter the direct effect of the lottery, military service of course is significantly lower among those with high lottery numbers.) But we are still not entirely out of the woods. Still another potential contaminating factor is the possibility that the effect of military service on Vietnam attitude depends on the lottery number. The idea is that most of those with low draft numbers who serve are dragged into the service and hate it (and the war) while those who serve with high numbers are volunteers who are pro-military and pro-war. In short, this would be a military X draft number interaction effect. Conceivably it could be the source of the lottery-number effect, not anxiety. We can test for this possibility by seeing whether the direct effect of the lottery number remain when those who actually serve the military are omitted. The answer is a decided yes. In fact when military recruits are omitted, the coefficient for lottery number predicting composite Vietnam attitude among the college bound rises from .25 to .28. And it is statistically significant at the .001. level.16 Thus, we reach an important result. The impact of lottery number is not via military service. It is not via a delay or acceleration of education. The effect is driven by what is left over as a direct effect. We interpret this to be the psychological response to the threat of getting drafted at a time of life and under circumstances that make the threat of military service particularly disruptive and unpleasant, possibly boosted by attentiveness to the predominantly anti-war tone of the news about Vietnam. 14 For one analysis of direct and indirect effects in experimental research, see Imai, Keele, andYamamoto 2009. 15 Limiting the analysis to the “college bound” sample suppresses the net effect of lottery number on 1973 educational attainment which is not significant. And within this sample, educational attainment is not related to military service. For all draft vulnerable respondents pooled together, educational attainment is negatively related to military service. Lottery number and educational attainment are unrelated statistically for either the college bound or the full sample. When the multivariate equation predicting Vietnam attitudes is estimated for the non-college bound, there are no significant “effects” and the R-squared is .017 (negative .010 as an adjusted R-squared.). 16 For college bound who serve in the military, lottery number predicts Vietnam attitude with a positive but lesser coefficient of .10, which is not significant.
14

XI. Long-Term Effects For our cohort of 1965 high school senior men, the timing of the crucial lottery numbers was December 1969. The observed political responses are from early 1973. Since we believe the intervening causal variable was the immediate trauma (or relief) from the lottery number, we observed causal impacts approximately three years after the initial stimulus. As political attitude studies go, this is a long duration. Rarely do we study attitudinal change over a span of years. We also have the means to study the possibility of the persistence of the effect over the course of a political lifetime. We refer of course to the opportunity to examine responses from the third (1982) and fourth (1997) waves of this survey. Here we offer a preliminary report regarding long-term effects. Table 10 is our guide, based on 1965’s college bound respondents only. For each of the selected item shown in Table 10, the analysis is based on the constant set of respondents with responses in all three post-lottery waves. In general, effects appear to fade. For instance, the impact of lottery number on the 1972 vote dissipates by 1980. Votes for Reagan or Carter were not influenced much, if at all, by lottery numbers a decade earlier. An exception however is with the central variable itself—Vietnam attitude. The mistake question was asked in each post-lottery wave. The lottery effect on responses to the question about Vietnam being a mistake maintains most of its initial magnitude into the 1990s. Even in 1997, 28 years after the precipitating event, the difference between the lowest and highest lottery number was about a quarter of the range of the dove-hawk scale. Our long-term analysis is very preliminary. It seems some “immediate” effects (e.g., at least three years in duration) faded. But the central attitude of our study—attitude toward the Vietnam War remained shaped by the luck of the draw in 1969.
XII. Conclusions
The present report is a first cut at the analysis of the remarkably strong effects of the Vietnam lottery on political attitudes. When we began this project, we thought our task might be like sifting through data, looking for the proverbial needle in a haystack. Instead we have found that the draft lottery was a powerful instrument for political attitude change. The full leverage from this finding awaits further analysis.
15

0.2
.4.6
.81
-2 -1 0 1 2index from 1965 Party ID, Issue Attitudes
Lottery Number=1 Lottery Number=366Individual Cases
Per
cent
Vot
ing
for N
ixon
Figure 1. Vote for President, 1972 among the “college bound” as a function of lottery number and index based on 1965 party identification and 1965 issue attitudes. The index is based on the probit equation in Table 4. The index score on the x axis is for lottery number 1. At any point on the x axis, the gap between the two lines represents the potential effect of the difference between lottery numbers 1 and 366. Simulating the vote for a 1 and 366 number for each case yields net proportions for Nixon at .34 if the lottery number =1 and .74 if the lottery number = 366. The actual vote within the college bound sample was .54 for Nixon. “College bound” are male respondents whose 1965 high school curriculum was college preparatory. Respondents who entered the military before 1969 are excluded from this sample.
16
Lottery Number
Military Service
Vietnam Attitude(Dove-Hawk)
uMS
Education Completed-
uVN
+-
-
?
17
Figure 2. Causal Model of Pathways from Lottery Number to Vietnam Attitude. The direct path represents the psychological response to one’s draft number. Double-headed arrows represent unknown correlations among disturbance terms for endogenous variables.
-
uEC
+?

Table 1 Education Levels of those Serving in the Military, by Date of Enlistment
Date of Enlistment: % College Bound (1965) % College Educated (1973) N 1965-1966 30 5 1911967
42 12 501968 55 20 401969 73 67 521970 81 89 271971-1973 85 92 13
18

Table 2a Self-Reported Military Status Post-Lottery, by Lottery Status and College-Bound or Not
Status: No Military Service Drafted Enlisted,
Expecting Callup Enlisted, Not Expecting Callup N
College Bound Lottery Number Called 66 12 17 5 136 Lottery Number Not Called
81 4 7 8 124
Not College Bound
Lottery Number Called 80 9 6 5 64 Lottery Number Not Called 88 8 2 3 66
Table 2b
Self-Reported Military Status Post-Lottery, by Lottery Status and College Degree (1973)
Status: No Military Service Drafted Enlisted,
Expecting Callup Enlisted, Not Expecting Callup N
College Degree Lottery Number Called 55 13 22 9 112 Lottery Number Not Called
80 3 8 8 103
No College Degree Lottery Number Called 90 8 2 0 88 Lottery Number Not Called 86 7 2 5 87
Note: Cell entries are row percentages. Only male respondents without prior military service as of 1969 are included. Lottery numbers called are 1-195.
19

Table 3 Effect of 1969 Lottery on Attitudes toward the Vietnam War, 1973
Was Vietnam War a Mistake? What Should We
Have Done? Composite Index
(n=381) (n=390) (n=375)
All Cases .17
(.07) p=.022
.11
(.07) p=.095
.14
(.06) p=.019
R
R
R
2=.012 R2=.006 R2=.014
(n=257) (n=260) (n=256)
College Bound .28
(.09) p=.002
.20
(.08) p=.022
.24
(.07) p=.002
2=.033 R2=.020 R2=.040
(n=124) (n=130) (n=118)
Not College Bound -.05 (.14)
p=.736
-.07 (.13)
p=.585
-.07 (.11)
p=.550 2=.001 R2=.002 R2=.004
Note: The dependent variables are scaled to run from 0 (Dove) to 1 (Hawk). Lottery number is rescaled from 1-366 to 0-1. Entries are OLS unstandardized coefficients. Robust SEs, which take into account the clustering (by school) in the data, are shown in parenthesis. Cases are male respondents who had not served in the military as of 1969. “College-Bound” are those taking college preparatory courses in 1965. Placebo Test Results: Coefficients on lottery number for women across the three dependent variables are -.06 (p=.33), .01 (p=.86), and -.03 (p=.59).
20

Table 4 Effect of 1969 Lottery on 1972 Vote Choice and Other Political Attitudes, 1973
Vote Choice
Nixon vs. McGovern
Thermometer
Rating of Nixon vs. McGovern
Political Ideology Index
Composite Issue Attitude Index Party
Identification
(n=294) (n=288) (n=286) (n=379) (n=387)
All Cases .24 p=.032
.08 (.04)
p=.049
.08 (.04)
P=.057
.09(.04)
p=.028
.04 (.04)
p=.377 Pseudo R2=.019
R2=.015 R2=.014 R2=.015 R2=.002
(n=211) (n=187) (n=185) (n=252) (n=259)
College Bound .38 p=.004
.16 (.05)
p=.004
.12 (.06)
P=.036
.13(.05)
p=.023
.05 (.06)
p=.348 Pseudo R2=.035
R2=.058 R2=.030 R2=.031 R2=.003
(n=83) (n=101) (n=101) (n=127) (n=128)
Not College Bound -.11 p=.573
-.08 (.06)
p=.178
-.01 (.05)
p=.905
.00(.06)
p=.945
.01 (.08)
p=.863 Pseudo R2=-.003 R2=.014 R2=.000 R2=.000 R2=.000
Note: Lottery number is rescaled from 1-366 to 0-1. Dependent variables are also scaled to range from 0-1. Vote Choice is a dummy variable scored 0=vote for McGovern and 1=vote for Nixon. Shown for that dependent variable is the estimated change in the probability of a Nixon vote as lottery number ranges from 1 to 366, along with the p-value of the test on the probit coefficient. Probit coefficients and robust-clustered standard errors for the three regressions, in turn, are -.62 (.29), -.99 (.35), and .28 (.50). ; Ideology, Issue Attitudes, and Party ID range from liberal/Democratic (0) to conservative/Republican (1). ). Entries for these dependent variables are OLS unstandardized coefficients with robust SEs in parenthesis. Cases are male respondents who had not served in the military as of 1969. “College-Bound” are those taking college preparatory courses in 1965. Placebo Test Results: Coefficients on lottery number for women across the dependent variables are .11 (p=.22), -.04 (p=.13) -.04 (p=.14), -.04 (p=.21), and -.05 (p=.06).
21

Table 5
A Multivariate Analysis of 1972 Vote Choice, Presidential Candidate Evaluations, and Issue Attitudes
College Bound Only
Vietnam Attitude Index
Vote ChoiceNixon vs. McGovern
Rating of Nixon vs. McGovern Composite Issue
Attitude Index
Political Ideology Index
Party Identification
(n=197) (n=163) (n=163) (n=198) (n=146) (n=200)
Lottery Number .18
(.08) p=.027
.44 p=.005
.15 (05)
p=.003
.13 (.06)
p=.042
R
.15(.06)
p=.020
.03(.06)
p=.624
Party ID as of 1965
-.02 (.07)
p=.750
.36 p=.001
.05 (.03)
p=.074
.02 (.04)
p=.696
.03(.04)
p=.518
.31(.08)
p=.000
Issue Attitudes as of 1965
.57 (.12)
p=.000
.63 p=.000
.33 (.07)
p=.000
.36 (.07)
p=.000
.33(.07)
p=.000
.37(.04)
p=.000 2=.133 Pseudo R2=.151 R2=.254 R2=.156 R2=.137 R2=.269
Note: Lottery number is rescaled from 1-366 to 0-1. The dependent variables are scaled to run from 0 (liberal/Democratic) to 1 (conservative/Republican). The Vote Choice equation was estimated with Probit. Shown for that dependent variable is the estimated change in the probability of a Nixon vote if the X in question changed from 0-1, holding the other two Xs at their means. The p-value is from the test on the probit coefficient. Probit coefficients and robust-clustered standard errors for the three predictors, in turn, are -1.18 (.42), -1.99 (.55), and -.96 (.27). Entries shown for the other dependent variables are unstandardized coefficients from OLS, with robust clustered SEs in parenthesis. Cases are college-bound (as of 1965) male respondents who had not served in the military as of 1969.
22

Table 6
Effect of 1969 Lottery on Attitudes toward Salient Groups and Political Figures, 1973
Rating of the Military
Rating of Radical Students Rating of Agnew Rating of Wallace Rating of Kennedy
(n=290) (n=288) (n=289) (n=290) (n=290)
All Cases .10
(.05) P=.048
R
R
R
-.07(.05)
p=.170
.13 (.05)
p=.015
.14 (.05)
p=.003
-.06(.04)
p=.180 2=.014 R2=.010 R2=.022 R2=.127 R2=.006
(n=180) (n=187) (n=188) (n=188) (n=188)
College Bound .19
(.05) P=.001
-.07(.07)
p=.321
.17 (.07)
p=.017
.16 (.05)
p=.004
-.11(.05)
p=.043 2=.059 R2=.010 R2=.036 R2=.041 R2=.022
(n=102) (n=101) (n=101) (n=102) (n=102)
Not College Bound -.09 (.08)
P=.267
-.06(.06)
p=.322
.06 (.08)
p=.481
.09 (.09)
p=.338
-.03(.07)
p=.728 2=.001 R2=.008 R2=.004 R2=.008 R2=.001
Note: Lottery number is rescaled from 1-366 to 0-1. The thermometers range from negative (0) to positive (1). Entries shown are unstandardized coefficients from OLS with robust SEs in parenthesis. Cases are male respondents who had not served in the military as of 1969. “College-Bound” are those taking college preparatory courses in 1965. Placebo Test Results: Coefficients on lottery number for women across the dependent variables are -.06 (p=.33), .01 (p=.86). -.04 (p=.33), .06 (p=.04), .and .03 (p=.34).
23

Table 7
Effect of 1969 Lottery on Political Attention and Involvement, 1973
Political Participation Index Political Knowledge Follow Politics in
the Mass Media Focus on International Affairs
(n=390) (n=289) (n=389) (n=372)
All Cases -.11 (.05)
p=.018
-.11 (.05)
P=.046
-.01 (.04)
p=.850
-.13 p=.026
R
R
R
2=.016 R2=.012 R2=.000 Pseudo R2=.008
(n=260) (n=184) (n=260) (n=250)
College Bound -.11 (.06)
p=.064
-.06 (.05)
P=.220
.04 (.09)
p=.472
-.14 p=.050
2=.016 R2=.006 R2=.005 Pseudo R2=.008
(n=130) (n=97) (n=129) (n=122)
Not College Bound -.07 (.06)
p=.218
-.13 (.11)
P=.225
-.06 (.05)
p=.491
-.11 p=.361
2=.009 R2=.017 R2=.002 Pseudo R2=.006
Note: Lottery number is rescaled from 1-366 to 0-1. The first three dependent variables are scaled to run from low involvement or knowledge (0) to high involvement/knowledge (1). Entries shown are unstandardized coefficients from OLS, with robust clustered SEs in parenthesis. Probit was used for the fourth dependent variable, a dummy variable scored 1=focus primarily on international affairs vs. 0 focus primarily on national, state, or local affairs. Entry shown is the estimated change in the probability of an “International” response as lottery number ranges from 1 to 366, along with the p-value of the test on the probit coefficient. Probit coefficients and robust-clustered standard errors for the three regressions, in turn, are -.44 (.20), -.45 (.23), and -.39 (.42). Cases are male respondents who had not served in the military as of 1969. “College-Bound” are those taking college preparatory courses in 1965. Placebo Test Results: Coefficients on lottery number for women across the dependent variables are .02 (p=.54), -.01 (.91), .02 (p=.53), and .06 (p=.23).
24
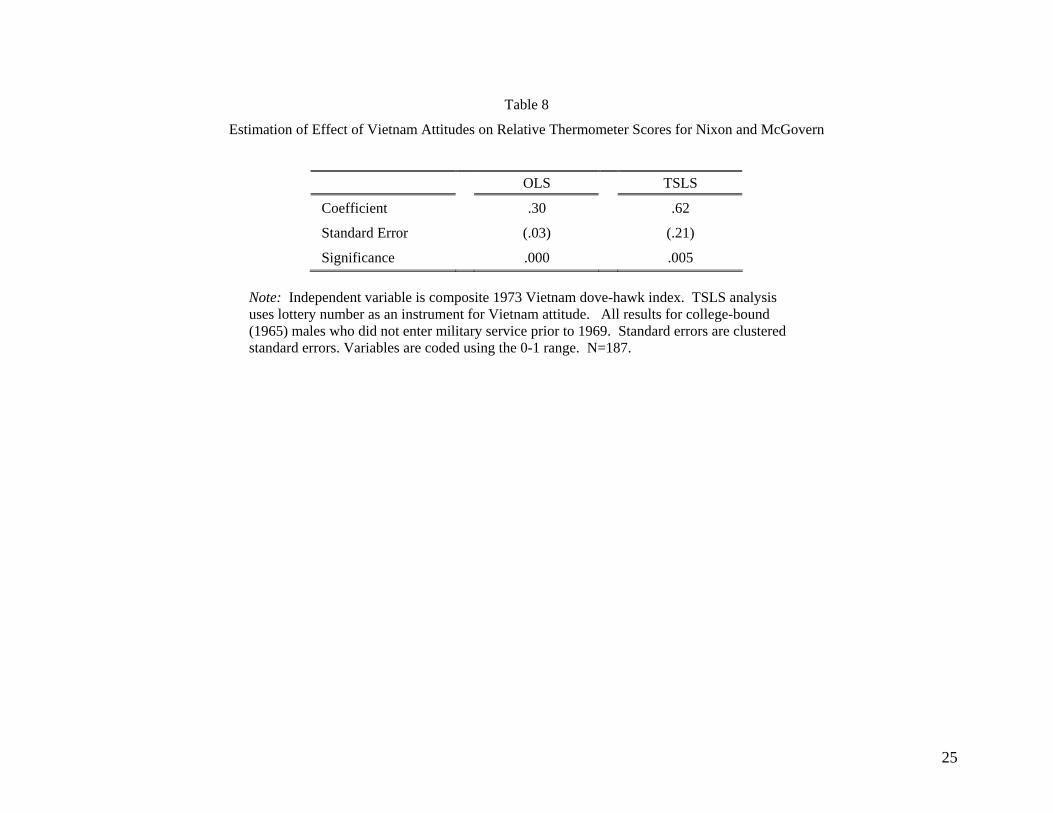
Table 8
Estimation of Effect of Vietnam Attitudes on Relative Thermometer Scores for Nixon and McGovern
OLS TSLS
Coefficient .30 .62
Standard Error (.03) (.21)
Significance .000 .005
Note: Independent variable is composite 1973 Vietnam dove-hawk index. TSLS analysis uses lottery number as an instrument for Vietnam attitude. All results for college-bound (1965) males who did not enter military service prior to 1969. Standard errors are clustered standard errors. Variables are coded using the 0-1 range. N=187.
25
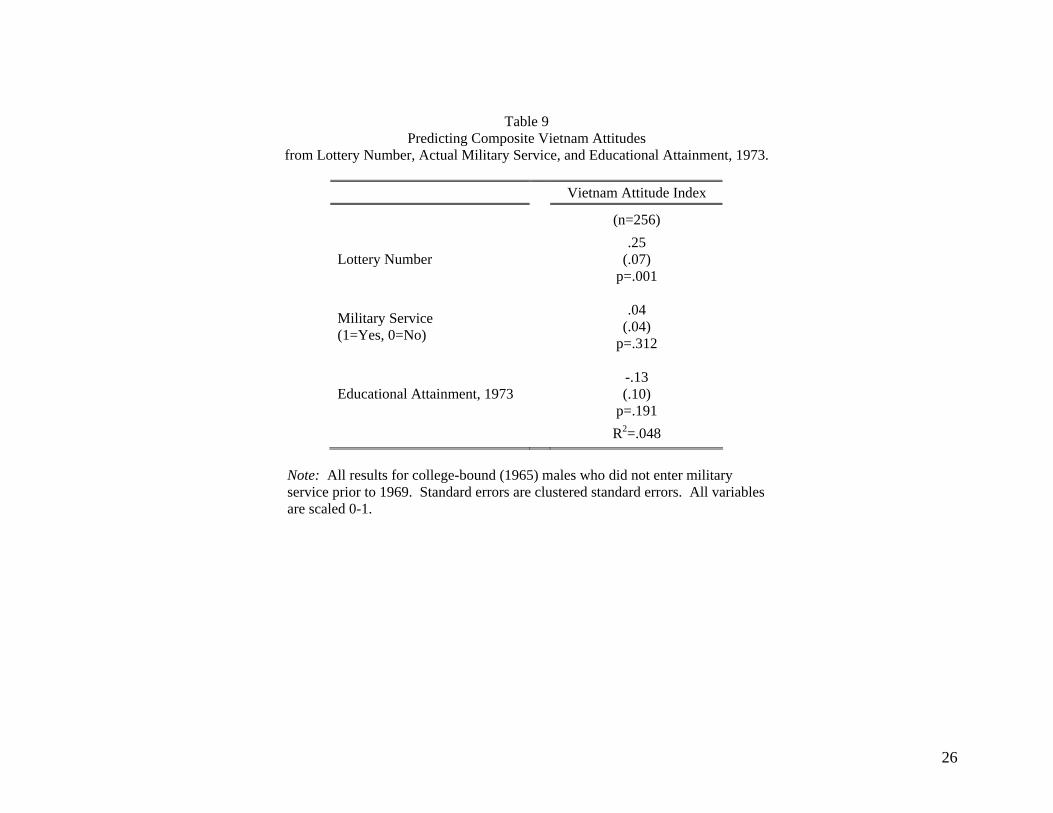
Table 9
Predicting Composite Vietnam Attitudes from Lottery Number, Actual Military Service, and Educational Attainment, 1973.
Vietnam Attitude Index
(n=256)
Lottery Number .25
(.07) p=.001
R
Military Service (1=Yes, 0=No)
.04 (.04)
p=.312
Educational Attainment, 1973 -.13 (.10)
p=.191 2=.048
Note: All results for college-bound (1965) males who did not enter military service prior to 1969. Standard errors are clustered standard errors. All variables are scaled 0-1.
26

27
Note: Data are from the 4-wave youth panel file. The dependent variables are scaled to run from 0 to 1, as described in the notes to the previous tables. Cases are male respondents who had not served in the military as of 1969. “College-Bound” are those taking college preparatory courses in 1965. Entries shown are unstandardized coefficients from OLS. Robust SEs, which take into account the clustering (by school) in the data, are shown in parenthesis.
Table 10. Long-Term Effects of 1969 Lottery on Political Attitudes?
College-Bound (in 1965) Only
1973 1982 1997
Was Vietnam War a Mistake? (n=180)
.27 (.10)
p=.010
.19 (.10)
p=.052
.25 (.09)
p=.005
R
R
R
R
2=.034 R2=.018 R2=.032
Feelings Toward the Military (n=137)
.19 (.06)
p=.002
.07 (.06)
p=.235
.01 (.06)
p=.852
2=.066 R2=.009 R2=.000
Rating of Republican vs. Democratic Presidential Candidates (n=186)
.14
(.05) p=.004
.01
(.06) p=.861
.03
(.05) p=.551
2=.062 R2=.000 R2=.002
Composite Issue Attitude Index (n=180)
.12 (.06)
p=.044
.05 (.06)
p=.397
.04 (.05)
p=.414
2=.028 R2=.005 R2=.004
References
Angrist, J. 1991. “The Draft Lottery and Voluntary Enlistment in the Vietnam Era.” Journal of the American Statistical Association, 86 (415), 584-595.
Angrist, J. 1990. “Lifetime Earnings and the Vietnam Era Draft Lottery: Evidence from Social
Security Administrative Records.” The American Economic Review, 80 (3), 313-336. Baskir, L. & Strauss, W.. 1978. Chance and Circumstance: the Draft, the War, and Vietnam
Generation. New York: Alfred A. Knopf. Cacioppo, J. T. & Gardner, W. L. 1999. “Emotion.” Annual Review of Psychology, 50: 191-214. Card, D. & Lemieux, T. 2001. “Going to College to Avoid the Draft: The Unintended Legacy of
the Vietnam War.” The American Economic Review, 91 (2), 97-102 Citrin, J. & Green, D. P. 1990. "The Self-Interest Motive in American Public Opinion." Research
in Micropolitics, 3: 1 - 28. Chong, D., Citrin J., & Conley P. 2001. “When Self-Interest Matters.” Political Psychology, 22
(3): 541-570. Dolan, R. J. 2002. “Emotion, Cognition, and Behavior.” Science, 298: 1191-1194. Dunning, T. 2008. “Improving Causal Inference: Strengths and Limitations of Natural
Experiments.” Political Research Quarterly, 61 (2), 282-293. Foley, Michael S. 2003. Confronting the War Machine: Draft Resistance During the Vietnam
War. Chapel Hill, NC: University of North Carolina Press. Gartner, S., Segura, G., & Wilkening, M. 1997. “All politics are local: Local losses and
individual attitudes toward the Vietnam War.” Journal of Conflict Resolution, 41(5), 669-694. Green, D. P. & Gerkin, A. E. 1989. "Self-Interest and Public Opinion toward Smoking
Restrictions and Cigarette Taxes." Public Opinion Quarterly, 53: 1-16. Hallin, D. C. 1984. “The Media, the War in Vietnam, and Political Support: A Critique of the
Thesis of an Oppositional Media.” Journal of Politics, 46 (1), 2-24. Hearst, N. & Newman, T. B. 1988. “Proving Cause and Effect in Traumatic Stress: The Draft
Lottery as a Natural Experiment.” Journal of Traumatic Stress, 1 (2), 173-180. Huddy, L, Feldman, S. & Cassese, E. 2007. “On the Distinct Political Effects of Anxiety and
Anger.” In The Affect Effect, eds. W. Russell Neuman, George E. Marcus, Ann N. Crigler, and Michael MacKuen. Chicago: University of Chicago Press, pp. 124-151.
28
Imai, K., Keele, L., & Yamamoto, T. 2009. “Identification, Inference, and Sensitivity Analysis for Causal Mediation Effects.'' Unpublished paper.
Izard, C.E. 2009. “Emotion Theory and Research: Highlights, Unanswered Questions, and
Emerging Issues.” Annual Review of Psychology, 60: 1-25. Jennings, M. K. & Niemi, R. G. 1974. The Political Character of Adolescence: The Influence of
Families and Schools. Princeton: Princeton University Press. Jennings, M. K. & Markus, G. B. 1977. “The Effect of Military Service on Political Attitudes: A
Panel Study.” American Political Science Review, 71 (1): 131-147. Krosnick, J. A. 1990. “Government policy and citizen passion: A study of issue publics in
contemporary America.” Political Behavior, 12 (1): 59-92. Lau, R. R., Brown T.A., & Sears, D. O. 1978. “Self-Interest and Civilians’ Attitudes Toward the
Vietnam War.” The Public Opinion Quarterly, (42) (4): 464-483. Marcus, G. E., Neuman, W. R., & MacKuen, M. 2000. Affective Intelligence and Political
Judgment. Chicago: University of Chicago Press. Mann, L. & Dashiell, T. C. 1975. “Reactions to the Draft Lottery: A Test of Conflict Theory.”
Human Relations, 28 (2): 155-173. Marshall, B. 1967. “In Pursuit of Equity: Who Serves When Not All Serve?” Report of the
National Advisory Commission on Selective Service. Washington, DC: U. S. GPO. Mercer, J. 2005. “Prospect Theory and Political Science.” Annual Review of Political Science, 8:
1-21. Morris, B. E. 2006. The Effects of the Draft on U.S. Presidential Approval Ratings During the
Vietnam War, 1954-1975. Ph.D. Dissertation. University of Alabama. Mueller, J. 1973. War, Presidents and Public Opinion. New York: John Wiley and Sons. Nichols, A. & Shaffer, M. E. 2007. “Clustered Standard Errors in Stata.” United Kingdom Stata
Users’ Group Meeting 2007. #07. Stata Users Group. Rostker, B. 2006. I Want You! The Evolution of the All-Volunteer Force. Santa Monica, CA:
The Rand Corporation. Sears, David O. and Carolyn L. Funk. 1990. "Self-Interest in Americans' Political Opinions." In
Beyond Self-Interest, ed. Jane J. Mansbridge. Chicago: University of Chicago Press. Sempel, R. B. Jr. 1970. “Nixon Abolishes Draft Deferment for Fatherhood.” New York Times,
April 23.
29