Embed Size (px)
Citation preview

Q3 2013www.businessmonitor.com
VIETNAMSHIPPING REPORTINCLUDES 5-YEAR FORECASTS TO 2017
ISSN 2040-9834Published by:Business Monitor International

Vietnam Shipping Report Q3 2013INCLUDES 5-YEAR FORECASTS TO 2017
Part of BMI’s Industry Report & Forecasts Series
Published by: Business Monitor International
Copy deadline: April 2013
Business Monitor InternationalSenator House85 Queen Victoria StreetLondonEC4V 4ABUnited KingdomTel: +44 (0) 20 7248 0468Fax: +44 (0) 20 7248 0467Email: [email protected]: http://www.businessmonitor.com
© 2013 Business Monitor InternationalAll rights reserved.
All information contained in this publication iscopyrighted in the name of Business MonitorInternational, and as such no part of thispublication may be reproduced, repackaged,redistributed, resold in whole or in any part, or usedin any form or by any means graphic, electronic ormechanical, including photocopying, recording,taping, or by information storage or retrieval, or byany other means, without the express written consentof the publisher.
DISCLAIMERAll information contained in this publication has been researched and compiled from sources believed to be accurate and reliable at the time ofpublishing. However, in view of the natural scope for human and/or mechanical error, either at source or during production, Business MonitorInternational accepts no liability whatsoever for any loss or damage resulting from errors, inaccuracies or omissions affecting any part of thepublication. All information is provided without warranty, and Business Monitor International makes no representation of warranty of any kind asto the accuracy or completeness of any information hereto contained.

CONTENTS
BMI Industry View ............................................................................................................... 7
SWOT .................................................................................................................................. 10Shipping ................................................................................................................................................ 10
Political ................................................................................................................................................. 12
Economic ............................................................................................................................................... 13
Business Environment .............................................................................................................................. 14
Industry Forecast .............................................................................................................. 15Port Of Ho Chi Minh City Throughput Outlook ............................................................................................. 15
Table: Major Port Data, 2010-2017 . . . . . . . . . . . . . . . . . . . . . . . . . . . . . . . . . . . . . . . . . . . . . . . . . . . . . . . . . . . . . . . . . . . . . . . . . . . . . . . . . . . . . . . . . . . . . . . . . . . . . . . . . . . . . . . . . . . 19
Table: Trade Overview, 2010-2017 . . . . . . . . . . . . . . . . . . . . . . . . . . . . . . . . . . . . . . . . . . . . . . . . . . . . . . . . . . . . . . . . . . . . . . . . . . . . . . . . . . . . . . . . . . . . . . . . . . . . . . . . . . . . . . . . . . . . 20
Table: Key Trade Indicators, 2010-2017 . . . . . . . . . . . . . . . . . . . . . . . . . . . . . . . . . . . . . . . . . . . . . . . . . . . . . . . . . . . . . . . . . . . . . . . . . . . . . . . . . . . . . . . . . . . . . . . . . . . . . . . . . . . . . . 20
Table: Main Import Partners (US$mn) . . . . . . . . . . . . . . . . . . . . . . . . . . . . . . . . . . . . . . . . . . . . . . . . . . . . . . . . . . . . . . . . . . . . . . . . . . . . . . . . . . . . . . . . . . . . . . . . . . . . . . . . . . . . . . . . 21
Table: Main Export Partners (US$mn) . . . . . . . . . . . . . . . . . . . . . . . . . . . . . . . . . . . . . . . . . . . . . . . . . . . . . . . . . . . . . . . . . . . . . . . . . . . . . . . . . . . . . . . . . . . . . . . . . . . . . . . . . . . . . . . . 22
Market Overview ............................................................................................................... 23Vietnam Container Shipping Market Overview .............................................................................................. 23
Industry Trends And Developments ................................................................................ 30
Company Profile ................................................................................................................ 35Vietnam Petroleum Transport Company (VIPCO) .......................................................................................... 35
Vietnam National Shipping Lines (Vinalines) ................................................................................................ 37
Global Industry Overview - Container Shipping ............................................................. 40Demand: Slow Start To 2013 ..................................................................................................................... 40
Supply: Capacity To Outweigh Demand Uptick ............................................................................................. 48Table: Top 20 Container Line Newbuild Plans . . . . . . . . . . . . . . . . . . . . . . . . . . . . . . . . . . . . . . . . . . . . . . . . . . . . . . . . . . . . . . . . . . . . . . . . . . . . . . . . . . . . . . . . . . . . . . . . . . . . . . . . . 50
Rates: Alarm Bells Sounding ...................................................................................................................... 52Table: 2012 And 2013 SCFI Europe Base Port Average Freight Rate Overview, Q112-Q113 . . . . . . . . . . . . . . . . . . . . . . . . . . . . . . . . . . . . . . . . . . . . . . . . . . . . . . . . 60
Table: 2012 And 2013 SCFI USWC Base Port Average Freight Rate Overview, Q112-Q113 . . . . . . . . . . . . . . . . . . . . . . . . . . . . . . . . . . . . . . . . . . . . . . . . . . . . . . . . 61
Global Industry Overview - Dry Bulk Shipping ............................................................... 62Demand : Stimulus Benefit Dries Up, Tough Outlook Ahead ............................................................................ 62
Supply: Fleet Expansion Slowing, But Overcapacity Still The Key Worry ........................................................... 71Table: Dry Bulk Vessel Class Overview . . . . . . . . . . . . . . . . . . . . . . . . . . . . . . . . . . . . . . . . . . . . . . . . . . . . . . . . . . . . . . . . . . . . . . . . . . . . . . . . . . . . . . . . . . . . . . . . . . . . . . . . . . . . . . . . 75
Global Industry Overview - Liquid Bulk Shipping ........................................................... 76Baltic Dirty Tanker Index Under Pressure .................................................................................................... 76
VLCCs Outlook ....................................................................................................................................... 81
Bloomber Tanker Index story ..................................................................................................................... 83
Product Tankers ...................................................................................................................................... 88
Vietnam Shipping Report Q3 2013
© Business Monitor International Page 4
Global Company Strategy ................................................................................................. 95Maersk Line ........................................................................................................................................... 95
Mediterranean Shipping Company ............................................................................................................ 104
CMA CGM ........................................................................................................................................... 111
Evergreen Line ...................................................................................................................................... 119
COSCO Container Lines Company ........................................................................................................... 126
Macroeconomic Forecasts ............................................................................................. 133Table: Vietnam - Economic Activity . . . . . . . . . . . . . . . . . . . . . . . . . . . . . . . . . . . . . . . . . . . . . . . . . . . . . . . . . . . . . . . . . . . . . . . . . . . . . . . . . . . . . . . . . . . . . . . . . . . . . . . . . . . . . . . . . . . 136
Demographic Forecast ................................................................................................... 137Table: Vietnam's Population By Age Group, 1990-2020 ('000) . . . . . . . . . . . . . . . . . . . . . . . . . . . . . . . . . . . . . . . . . . . . . . . . . . . . . . . . . . . . . . . . . . . . . . . . . . . . . . . . . . . . . . . 138
Table: Vietnam's Population By Age Group, 1990-2020 (% of total) . . . . . . . . . . . . . . . . . . . . . . . . . . . . . . . . . . . . . . . . . . . . . . . . . . . . . . . . . . . . . . . . . . . . . . . . . . . . . . . . . 139
Table: Vietnam's Key Population Ratios, 1990-2020 . . . . . . . . . . . . . . . . . . . . . . . . . . . . . . . . . . . . . . . . . . . . . . . . . . . . . . . . . . . . . . . . . . . . . . . . . . . . . . . . . . . . . . . . . . . . . . . . . 140
Table: Vietnam's Rural And Urban Population, 1990-2020 . . . . . . . . . . . . . . . . . . . . . . . . . . . . . . . . . . . . . . . . . . . . . . . . . . . . . . . . . . . . . . . . . . . . . . . . . . . . . . . . . . . . . . . . . . 140
Vietnam Shipping Report Q3 2013
© Business Monitor International Page 5

BMI Industry View
Vietnam's export outlook will continue to be bolstered by China's growth outlook over the short and
medium term. Although we project China's economic growth to slow over the medium term, the real GDP
growth is still robust, estimated at 7.5% in 2013 and 6.4% over the medium term, which should have a
beneficial impact on the shipping sector in Vietnam.
Vietnam plays a key role in China's coal supply chain. The country is China's fifth-largest coal exporter,
providing the country with the thermal coal it requires for its power stations. Vietnam's role in this supply
chain looks set to continue, although BMI highlights that China is trying to decrease its power sector's
reliance on coal. While we believe that coal-fired power plants' percentage in China's energy mix will slip
over the medium term, it will remain above 70%.
Vietnam's ports and shipping sectors play a role in the global dry, liquid and container sectors. As
highlighted earlier, Vietnam plays a considerable role in China's coal supply chain, with the dry bulk
commodity being shipped out of Vietnam and into China's main coal port of Qinhuangdao. Vietnam is an
oil-producing nation, but its consumption needs have come to outweigh its supply and so the country is
making use of the liquid bulk shipping sector for the import of oil.
It is in the container shipping sector that Vietnam has seen the most development - a trend which is
expected to continue. As Vietnam has become the factory of Asia, with an emphasis on the development of
clothing and shoe exports, the country's ports and shipping links have had to keep up. As mentioned,
considerable investment was ploughed into Vietnam's container terminal sector over the last five years, with
international players participating. This investment is now starting to yield results, with Vietnam now
directly connected to the key demand market of the US (in 2009) and Europe (in 2010).
The development of Vietnam's liner connections is highlighted by data from UNCTAD's liner connectivity
index. In 2004, Vietnam was ranked lowest out of its 14 Asian peers in terms of container line
connectivity. By 2012 it had jumped up the rankings to eighth place among its 14 Asian neighbours.
The Port of Ho Chi Minh City remains by far the country's main port and will also be Vietnam's
outperformer in terms of year-on-year (y-o-y) tonnage handled in 2013 - forecast to increase 7.56% this
year to reach 38.75mn tonnes, compared with the Port of Da Nang's predicted annual growth of 4.26%
(4.16mn tonnes). On the other hand, it will be the Port of Da Nang that will enjoy the higher levels of
Vietnam Shipping Report Q3 2013
© Business Monitor International Page 7
annual growth in terms of containers handled, with double-digit y-o-y growth forecast in 2013, as opposed
to the Port of Ho Chi Minh City's protracted growth of 7.95%.
Headline Industry Data
■ 2013 tonnage throughput at the Port of Ho Chi Minh City is forecast to grow 7.56% to 38.75mn tonnes.
■ 2013 tonnage throughput at the Port of Da Nang is forecast to increase 4.26% to 4.16mn tonnes.
■ 2013 container throughput at the Port of Ho Chi Minh City is forecast to rise 7.95% to 3.58mn twenty-foot equivalent units (TEUs).
■ 2013 container throughput at the Port of Da Nang is forecast to increase 10.36% to 133,154TEUs.
■ 2013 total trade real growth is forecast to increase 5.60%.
Key Industry Trends
Global Economic Pick Up To Support Ho Chi Minh Port Growth: Annual tonnage throughput growth at
the Port of Ho Chi Minh is set to come in at a very healthy 7.56% in 2013. This faster rate of growth is in
keeping with our macroeconomic outlook on Vietnam, where we forecast that real GDP growth will
accelerate from 5.0% in 2012 to 7.0% in 2013.
Growth Potential In The New Factory Of Asia: Vietnam's shipping sector is set to benefit not only from
the steady growth outlook of its two main trade partners, the US and China, as well as an uptick in domestic
growth. Vietnam's logistics sector has been developing to keep up with the country's increasing role as
Asia's factory, especially in the manufacturing of clothing and shoes. Vietnam's connections to its key
export partners has been improving over the last three years, with the country now boasting direct container
line services to the US and Europe.
Transport Ministry Opens Cai Mep Thi Vai International Port: The end of January 2013 saw the opening
of the Cai Mep Thi Vai International Port in the southern province of Ba Ria Vung Tau. The port, which has
been designed to fulfil the rising demand of container shipping in the south, is the country's deepest and
biggest seaport. The port project, worth around US$620mn, will also open direct shipping channels with
other domestic and international ports globally, thereby reducing the intermediate and transit shipping
expenses.
Vietnam Shipping Report Q3 2013
© Business Monitor International Page 8

Key Risks To Outlook
We have witnessed a strong PMI reading of 51.6 in China, up from 50.4 in February, signalling that robust
demand from the Chinese economy could lend some support in boosting Vietnam's exports over the coming
months. Meanwhile, the infrastructure sector is expected to continue to enjoy robust growth as the
government accelerates spending on infrastructure projects to meet the country's need for a more efficient
transportation network and logistical infrastructure to support long-term growth.
The construction of the deepwater Lach Huyen Terminal in Haiphong, which is scheduled to start in April
2013, provides upside risk to our forecasts over the medium term. The US$1.2bn, 900,000 twenty-foot
equivalent units (TEUs) joint venture between Vietnam's Vinalines and Japan's Mitusi OSK Lines,
Nippon Yusen Kaisha and Itochu is a historic one in that it is the first public-private project in Vietnam.
The project is likely to be operational in 2015 and once completed will be able to accommodate vessels with
a capacity ranging between 8,000TEUs and 9,000TEUs. The new facility - which is intended to be the
gateway port to northern Vietnam - will be situated 100km north east of Hanoi and is likely to help in
easing port congestion in Haiphong.
Vietnam Shipping Report Q3 2013
© Business Monitor International Page 9

SWOT
Shipping
SWOT Analysis
Strengths ■ Vietnam's location by the South China Sea gives the country access to the main inter-
Asian shipping routes, allowing it to meet its trading needs.
■ Vietnamese facilities feature as ports of call on Maersk Line, MOL, Hanjin Shipping
and APL services.
Weaknesses ■ Significant outside investment is required for the country to match expected export
growth over the next few years, despite a surge in state investment led by a US
$4.5bn government port investment programme.
■ Decades of underinvestment have left Vietnam with a port infrastructure system
ranked 97th out of 139 countries by the World Economic Forum's Global
Competitiveness Report.
■ Overcapacity is a looming spectre over the country's shipping sector and is an issue
that must be addressed.
■ Following three years of delays and due to state overseers failing to raise US$3.6bn in
foreign and national investment, the construction of Van Phong International
Transshipment Port was halted at the behest of the Vietnamese Transport Ministry.
The decision to shelve the planned port - originally proposed to be completed by
2020 - was undertaken by the Vietnamese Deputy Prime Minister, Hoang Trung Hai
and was made public in September 2012.
Opportunities ■ There is growing international interest in Vietnam as a growth market within the box
shipping sector, catering for rising exports of manufactured goods to Western
markets.
■ The Ministry of Transport plans to invest US$4.5bn in developing port infrastructure
by 2012.
Vietnam Shipping Report Q3 2013
© Business Monitor International Page 10

SWOT Analysis - Continued
■ The steady recovery in Vietnam's trade volumes from the 2009 downturn is set to
continue.
■ Vietnam and France entered into an economic dialogue in April 2013 in Hanoi to
discuss the strengthening of bilateral economic ties, especially in trade and
investment
Threats ■ The South China Sea territorial dispute with China, combined with widespread anti-
Chinese sentiment in Vietnam, is a significant political risk factor to bilateral trade and
investment.
Vietnam Shipping Report Q3 2013
© Business Monitor International Page 11

Political
SWOT Analysis
Strengths ■ The Communist Party of Vietnam remains committed to market-oriented reforms and
we do not expect major shifts in policy direction over the next five years. The one-
party system is generally conducive to short-term political stability.
■ Relations with the US have witnessed a marked improvement, and Washington sees
Hanoi as a potential geopolitical ally in South East Asia.
Weaknesses ■ Corruption among government officials poses a major threat to the legitimacy of the
ruling Communist Party.
■ There is increasing (albeit still limited) public dissatisfaction with the leadership's tight
control over political dissent.
Opportunities ■ The government recognises the threat corruption poses to its legitimacy, and has
acted to clamp down on graft among party officials.
■ Vietnam has allowed legislators to become more vocal in criticising government
policies. This is opening up opportunities for more checks and balances within the
one-party system.
Threats ■ Macroeconomic instabilities in 2012 are likely to weigh on public acceptance of the
one-party system, and street demonstrations to protest economic conditions could
develop into a full-on challenge of undemocractic rule.
■ Although strong domestic control will ensure little change to Vietnam's political scene
in the next few years, over the longer term, the one-party-state will probably be
unsustainable.
■ Relations with China have deteriorated over recent years due to Beijing's more
assertive stance over disputed islands in the South China Sea and domestic criticism
of a large Chinese investment into a bauxite mining project in the central highlands,
which could potentially cause wide-scale environmental damage.
Vietnam Shipping Report Q3 2013
© Business Monitor International Page 12

Economic
SWOT Analysis
Strengths ■ Vietnam has been one of the fastest-growing economies in Asia in recent years, with
GDP growth averaging 7.1% annually between 2000 and 2012.
■ The economic boom has lifted many Vietnamese out of poverty, with the official
poverty rate in the country falling from 58% in 1993 to 14.0% in 2010.
Weaknesses ■ Vietnam still suffers from substantial trade, current account and fiscal deficits, leaving
the economy vulnerable to global economic uncertainties in 2012. The fiscal deficit is
dominated by substantial spending on social subsidies that could be difficult to
withdraw.
■ The heavily-managed and weak currency reduces incentives to improve quality of
exports, and also keeps import costs high, contributing to inflationary pressures.
Opportunities ■ WTO membership has given Vietnam access to both foreign markets and capital,
while making Vietnamese enterprises stronger through increased competition.
■ The government will in spite of the current macroeconomic woes, continue to move
forward with market reforms, including privatisation of state-owned enterprises, and
liberalising the banking sector.
■ Urbanisation will continue to be a long-term growth driver. The UN forecasts the
urban population rising from 29% of the population to more than 50% by the early
2040s.
Threats ■ Inflation and deficit concerns have caused some investors to re-assess their hitherto
upbeat view of Vietnam. If the government focuses too much on stimulating growth
and fails to root out inflationary pressure, it risks prolonging macroeconomic
instability, which could lead to a potential crisis.
■ Prolonged macroeconomic instability could prompt the authorities to put reforms on
hold as they struggle to stabilise the economy.
Vietnam Shipping Report Q3 2013
© Business Monitor International Page 13
Business Environment
SWOT Analysis
Strengths ■ Vietnam has a large, skilled and low-cost workforce, which has made the country
attractive to foreign investors.
■ Vietnam's location - its proximity to China and South East Asia, and its good sea links
- makes it a good base for foreign companies to export to the rest of Asia, and
beyond.
Weaknesses ■ Vietnam's infrastructure is still weak. Roads, railways and ports are inadequate to
cope with the country's economic growth and links with the outside world.
■ Vietnam remains one of the world's most corrupt countries. According to
Transparency International's 2012 Corruption Perceptions Index, Vietnam ranks 123
out of 176 countries.
Opportunities ■ Vietnam is increasingly attracting investment from key Asian economies, such as
Japan, South Korea and Taiwan. This offers the possibility of the transfer of high-tech
skills and know-how.
■ Vietnam is pressing ahead with the privatisation of state-owned enterprises and the
liberalisation of the banking sector. This should offer foreign investors new entry
points.
Threats ■ Ongoing trade disputes with the US, and the general threat of American
protectionism, which will remain a concern.
■ Labour unrest remains a lingering threat. A failure by the authorities to boost skills
levels could leave Vietnam a second-rate economy for an indefinite period.
Vietnam Shipping Report Q3 2013
© Business Monitor International Page 14

Industry Forecast
Port Of Ho Chi Minh City Throughput Outlook
Short Term: Strong 2013 Growth Ahead
Year-on-year (y-o-y) tonnage throughput growth at the Port of Ho Chi Minh is set to come in at a very
healthy 7.56% in 2013, to reach 38.75mn tonnes, which is slightly down on 2012's estimated y-o-y increase
of 7.71%. Container throughput is predicted to perform even better, forecast as it is to reach growth
of 8.03% in 2013. This faster rate of growth is in keeping with our macroeconomic outlook on Vietnam,
where we forecast that growth in 2013 will accelerate from 5.0% to 6.3%.
Macro Picture Supporting Port Throughput
Vietnam Real GDP Growth
2008
2009
2010
2011
2012
2013
f
2014
f
2015
f
2016
f
2017
f
4.5
5
5.5
6
6.5
7
7.5
f = BMI forecast. Source: Asian Development Bank
This ties in with what we are seeing in the global economy; the US and China are Vietnam's two biggest
trade partners. These two markets are essential for throughput at Vietnamese ports as the South East Asian
country is rapidly becoming the workshop of Asia as the labour market is cheaper than that in China. As
such its container-handling facilities are in demand for finished products to be exported through them. We
Vietnam Shipping Report Q3 2013
© Business Monitor International Page 15

are more optimistic with regards to economic growth in both China and the US in the coming year; at the
start of the year we revised up our China growth forecast for 2013 from 7.1% to 7.5%, and our US growth
forecast has been bumped up to 2.2% following the successful avoidance of the fiscal cliff.
It is not only the macro picture that is supporting growth at Ho Chi Minh, but also investment in new
facilities at the port complex, centred around the premier commercial centre of southern Vietnam. Despite a
slow start amid the bleak macroeconomic fundamentals affecting the eurozone, China and the US, there are
signs that Cai Mep International Terminal (CMIT) is beginning to outperform, placing upside risk on our
forecasts for the Port of Ho Chi Minh City as a result. We believe that Cai Mep's positive throughput
growth outlook for 2012 is in large part attributable to APM Terminal (APMT)'s operation of the terminal
over the year, as the company has poured in investment and attracted new clients operating on key trade
routes.
Growth Supported By Terminal Investment
Port Of Ho Chi Minh City Container Throughput, TEU, 2008-2017
Ho Chi Minh City container throughput, TEU (LHS) (LHS) (LHS)
Ho Chi Minh City container throughput, TEU~ % y-o-y (RHS) (RHS) (RHS)
2008
2009
2010
2011
2012
e
2013
f
2014
f
2015
f
2016
f
2017
f
0
5,000,000
2,500,000
10
20
0
30
e/f = BMI estimate/forecast. Source: VPA
Vietnam Shipping Report Q3 2013
© Business Monitor International Page 16

APMT's presence should support continued growth at the port over the medium term (2013-2017) as it
continues to improve the port's facilities and attract shipping lines keen to capitalise on Vietnam's positive
macroeconomic outlook. Despite being operational for just a year, CMIT likely handled close to
600,000TEUs in 2012.
Medium Term: Impressive Growth Beckons
Impressive growth will be the order of the day for the Port of Ho Chi Minh City over the medium term to
2017. Tonnage throughput will average 6.6% to reach just under 50mn tonnes by the end of the forecast
period - 49.66mn tonnes in 2017. Box throughput, meanwhile, is also set to remain very healthy, averaging
7.0% over our forecast period, which will see throughput reaching 4.65mn TEUs by the end of
2017. BMI highlights the substantial investments APMT has made in CMIT since it opened in March 2011
as an important driver of growth and believes this will continue to be the case.
BMI highlights that the Port of Ho Chi Minh previously only played a role as a feeder port, relying on the
transhipment of containers through one of Asia's larger, better equipped ports such as Singapore. Exposure
to these routes is in large part attributable to the port's ability to handle ultra-large container ships, which are
becoming the standard for shipping containers on Asia-Europe trade routes. This was demonstrated in
December 2011, when CMA CGM's 13,820TEU Laperouse docked at the terminal. We believe CMIT's
proven capacity for handling these vessels marked an important step for the terminal and will be a key
driver of growth over the medium term.
Vietnam Shipping Report Q3 2013
© Business Monitor International Page 17
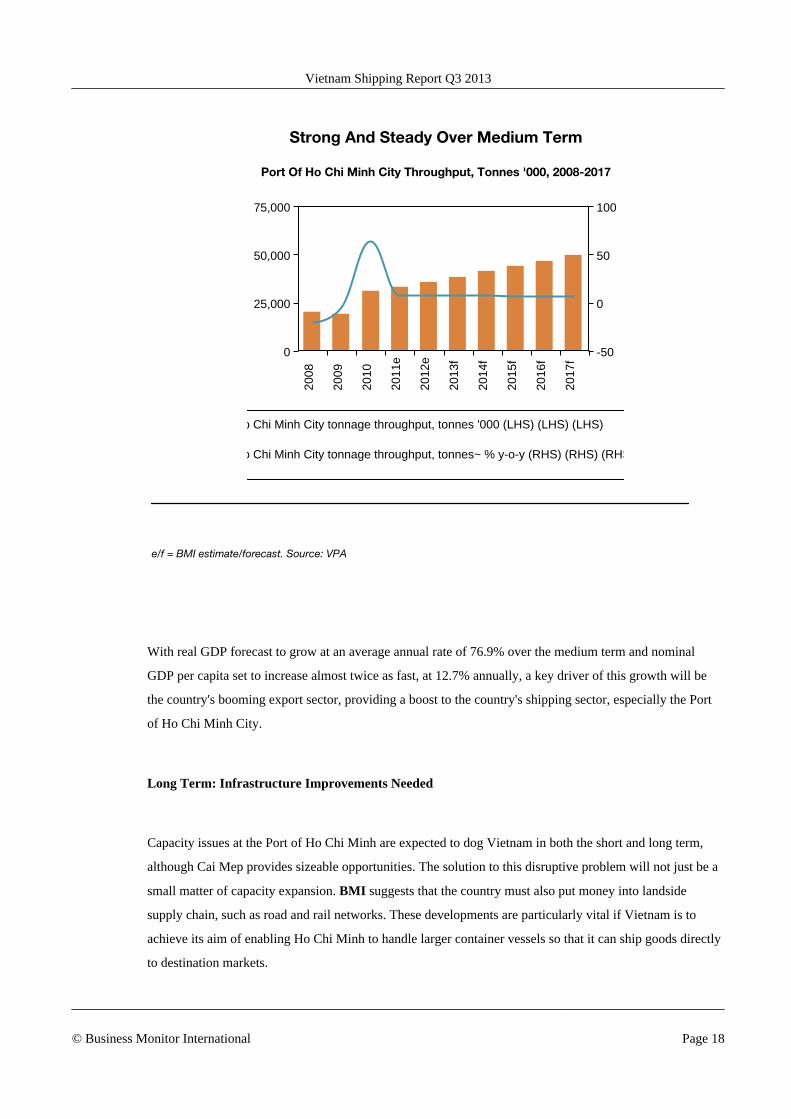
Strong And Steady Over Medium Term
Port Of Ho Chi Minh City Throughput, Tonnes '000, 2008-2017
Ho Chi Minh City tonnage throughput, tonnes '000 (LHS) (LHS) (LHS)
Ho Chi Minh City tonnage throughput, tonnes~ % y-o-y (RHS) (RHS) (RHS)
2008
2009
2010
2011
e
2012
e
2013
f
2014
f
2015
f
2016
f
2017
f
0
50,000
25,000
75,000
-50
0
50
100
e/f = BMI estimate/forecast. Source: VPA
With real GDP forecast to grow at an average annual rate of 76.9% over the medium term and nominal
GDP per capita set to increase almost twice as fast, at 12.7% annually, a key driver of this growth will be
the country's booming export sector, providing a boost to the country's shipping sector, especially the Port
of Ho Chi Minh City.
Long Term: Infrastructure Improvements Needed
Capacity issues at the Port of Ho Chi Minh are expected to dog Vietnam in both the short and long term,
although Cai Mep provides sizeable opportunities. The solution to this disruptive problem will not just be a
small matter of capacity expansion. BMI suggests that the country must also put money into landside
supply chain, such as road and rail networks. These developments are particularly vital if Vietnam is to
achieve its aim of enabling Ho Chi Minh to handle larger container vessels so that it can ship goods directly
to destination markets.
Vietnam Shipping Report Q3 2013
© Business Monitor International Page 18

Table: Major Port Data, 2010-2017
2010 2011 2012e 2013f 2014f 2015f 2016f 2017f
Port of Ho Chi MinhCity (Saigon New)throughput, tonnes'000* 31,132.00 33,450.71 36,029.40 38,753.08 41,430.13 44,146.40 46,892.52 49,658.39
Port of Ho Chi MinhCity (Saigon New)throughput, tonnes,% y-o-y* 62.65 7.45 7.71 7.56 6.91 6.56 6.22 5.90
Port of Ho Chi MinhCity (Saigon New)containerthroughput, TEU* 2,850,000 2,973,973 3,218,563 3,476,905 3,730,824 3,988,464 4,248,933 4,511,278
Port of Ho Chi MinhCity (Saigon New)containerthroughput, TEU, % y-o-y* 17.19 4.35 8.22 8.03 7.30 6.91 6.53 6.17
Port of Da Nangthroughput, tonnes'000 3,303.04 3,868.00 3,987.31 4,160.05 4,329.82 4,502.08 4,676.24 4,851.65
Port of Da Nangthroughput, tonnes,% y-o-y 5.46 17.1 3.08 4.33 4.08 3.98 3.87 3.75
Port of Da Nangcontainerthroughput, TEU 89,199.00 114,373.00 120,649.60 133,366.19 145,865.06 158,547.10 171,368.43 184,282.03
Port of Da Nangcontainerthroughput, TEU, % y-o-y 27.94 28.22 5.49 10.54 9.37 8.69 8.09 7.54
*2011 figure is an estimate. Source: VPA, BMI. e/f = BMI estimates/forecasts.
Vietnam Shipping Report Q3 2013
© Business Monitor International Page 19
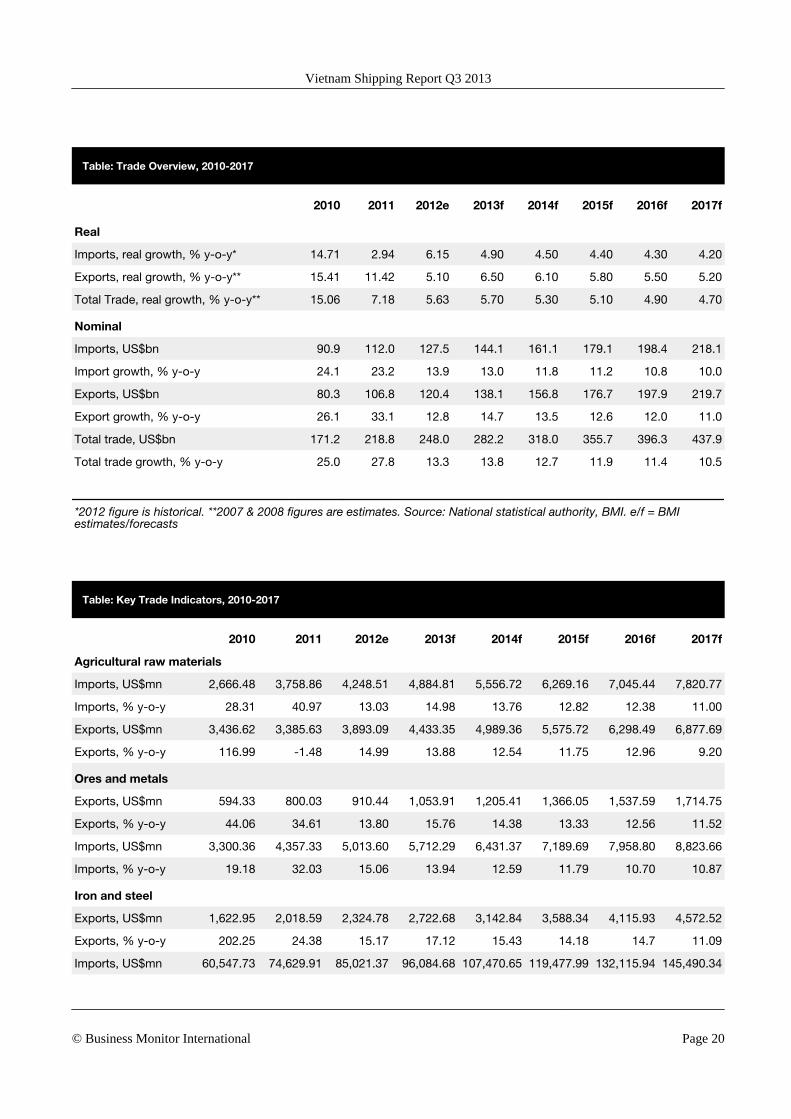
Table: Trade Overview, 2010-2017
2010 2011 2012e 2013f 2014f 2015f 2016f 2017f
Real
Imports, real growth, % y-o-y* 14.71 2.94 6.15 4.90 4.50 4.40 4.30 4.20
Exports, real growth, % y-o-y** 15.41 11.42 5.10 6.50 6.10 5.80 5.50 5.20
Total Trade, real growth, % y-o-y** 15.06 7.18 5.63 5.70 5.30 5.10 4.90 4.70
Nominal
Imports, US$bn 90.9 112.0 127.5 144.1 161.1 179.1 198.4 218.1
Import growth, % y-o-y 24.1 23.2 13.9 13.0 11.8 11.2 10.8 10.0
Exports, US$bn 80.3 106.8 120.4 138.1 156.8 176.7 197.9 219.7
Export growth, % y-o-y 26.1 33.1 12.8 14.7 13.5 12.6 12.0 11.0
Total trade, US$bn 171.2 218.8 248.0 282.2 318.0 355.7 396.3 437.9
Total trade growth, % y-o-y 25.0 27.8 13.3 13.8 12.7 11.9 11.4 10.5
*2012 figure is historical. **2007 & 2008 figures are estimates. Source: National statistical authority, BMI. e/f = BMIestimates/forecasts
Table: Key Trade Indicators, 2010-2017
2010 2011 2012e 2013f 2014f 2015f 2016f 2017f
Agricultural raw materials
Imports, US$mn 2,666.48 3,758.86 4,248.51 4,884.81 5,556.72 6,269.16 7,045.44 7,820.77
Imports, % y-o-y 28.31 40.97 13.03 14.98 13.76 12.82 12.38 11.00
Exports, US$mn 3,436.62 3,385.63 3,893.09 4,433.35 4,989.36 5,575.72 6,298.49 6,877.69
Exports, % y-o-y 116.99 -1.48 14.99 13.88 12.54 11.75 12.96 9.20
Ores and metals
Exports, US$mn 594.33 800.03 910.44 1,053.91 1,205.41 1,366.05 1,537.59 1,714.75
Exports, % y-o-y 44.06 34.61 13.80 15.76 14.38 13.33 12.56 11.52
Imports, US$mn 3,300.36 4,357.33 5,013.60 5,712.29 6,431.37 7,189.69 7,958.80 8,823.66
Imports, % y-o-y 19.18 32.03 15.06 13.94 12.59 11.79 10.70 10.87
Iron and steel
Exports, US$mn 1,622.95 2,018.59 2,324.78 2,722.68 3,142.84 3,588.34 4,115.93 4,572.52
Exports, % y-o-y 202.25 24.38 15.17 17.12 15.43 14.18 14.7 11.09
Imports, US$mn 60,547.73 74,629.91 85,021.37 96,084.68 107,470.65 119,477.99 132,115.94 145,490.34
Vietnam Shipping Report Q3 2013
© Business Monitor International Page 20
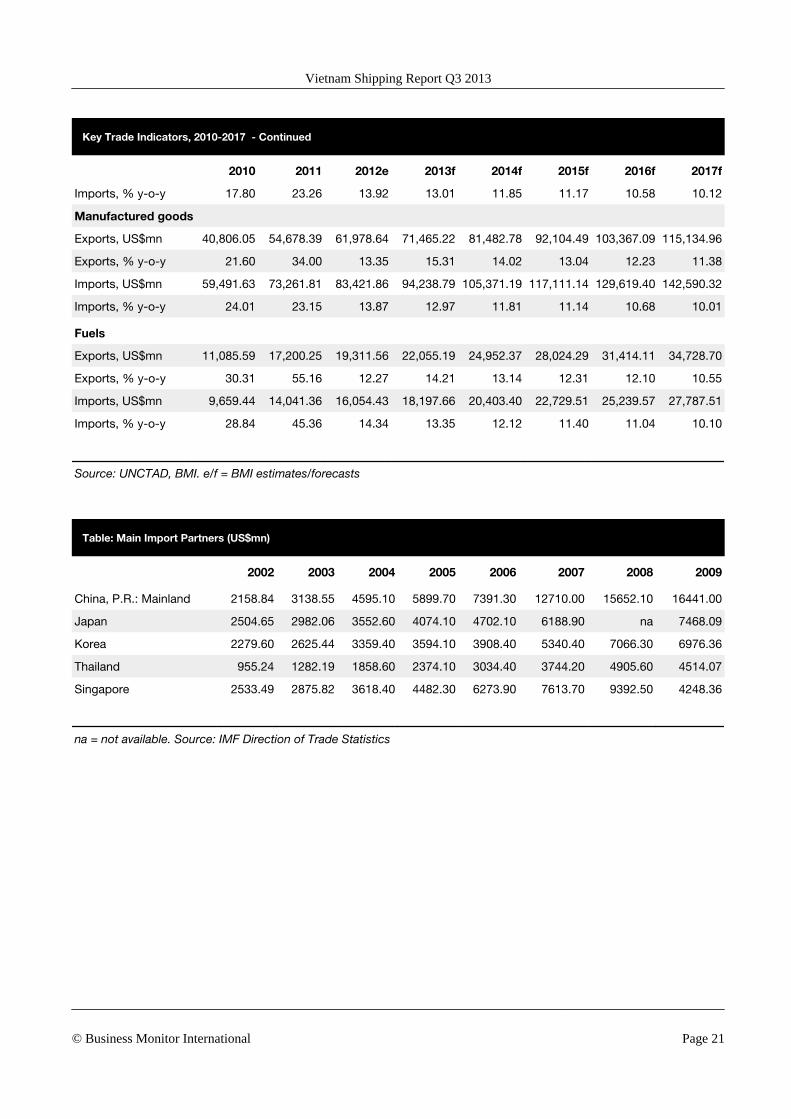
Key Trade Indicators, 2010-2017 - Continued
2010 2011 2012e 2013f 2014f 2015f 2016f 2017f
Imports, % y-o-y 17.80 23.26 13.92 13.01 11.85 11.17 10.58 10.12
Manufactured goods
Exports, US$mn 40,806.05 54,678.39 61,978.64 71,465.22 81,482.78 92,104.49 103,367.09 115,134.96
Exports, % y-o-y 21.60 34.00 13.35 15.31 14.02 13.04 12.23 11.38
Imports, US$mn 59,491.63 73,261.81 83,421.86 94,238.79 105,371.19 117,111.14 129,619.40 142,590.32
Imports, % y-o-y 24.01 23.15 13.87 12.97 11.81 11.14 10.68 10.01
Fuels
Exports, US$mn 11,085.59 17,200.25 19,311.56 22,055.19 24,952.37 28,024.29 31,414.11 34,728.70
Exports, % y-o-y 30.31 55.16 12.27 14.21 13.14 12.31 12.10 10.55
Imports, US$mn 9,659.44 14,041.36 16,054.43 18,197.66 20,403.40 22,729.51 25,239.57 27,787.51
Imports, % y-o-y 28.84 45.36 14.34 13.35 12.12 11.40 11.04 10.10
Source: UNCTAD, BMI. e/f = BMI estimates/forecasts
Table: Main Import Partners (US$mn)
2002 2003 2004 2005 2006 2007 2008 2009
China, P.R.: Mainland 2158.84 3138.55 4595.10 5899.70 7391.30 12710.00 15652.10 16441.00
Japan 2504.65 2982.06 3552.60 4074.10 4702.10 6188.90 na 7468.09
Korea 2279.60 2625.44 3359.40 3594.10 3908.40 5340.40 7066.30 6976.36
Thailand 955.24 1282.19 1858.60 2374.10 3034.40 3744.20 4905.60 4514.07
Singapore 2533.49 2875.82 3618.40 4482.30 6273.90 7613.70 9392.50 4248.36
na = not available. Source: IMF Direction of Trade Statistics
Vietnam Shipping Report Q3 2013
© Business Monitor International Page 21

Table: Main Export Partners (US$mn)
2002 2003 2004 2005 2006 2007 2008 2009
United States 2453.15 3939.56 5024.80 5924.00 7845.10 10104.50 11868.50 11355.80
Japan 2436.96 2908.60 3542.10 4340.30 5240.10 6090.00 8537.90 6291.81
China, P.R.: Mainland 1518.33 1883.12 2899.10 3228.10 3242.80 3646.10 4535.70 4909.03
Switzerland 66.67 74.67 120.20 103.90 155.70 236.90 516.90 2486.49
Australia 1328.33 1420.86 1884.70 2722.80 3744.70 3802.20 4225.20 2276.72
Source: IMF Direction of Trade Statistics
Vietnam Shipping Report Q3 2013
© Business Monitor International Page 22

Market Overview
Vietnam Container Shipping Market Overview
The Port of Ho Chi Minh City has expanded to become the largest facility in southern Vietnam. It now
accounts for more than 65% of port throughput in the Ho Chi Minh City area and 42% of throughput in
Vietnam as a whole. In 2012, the port handled an estimated 3.32mn twenty-foot equivalent units (TEUs).
The port comprises three cargo terminals, as well as depot and customs points, which are situated at
different locations within the Mekong Delta area in south-east Vietnam, in an area measuring 60km in
circumference.
Cai Mep is Vietnam's largest deep sea facility. The Port of Cai Mep was developed in response to the rapid
growth in trade volumes at the Port of Ho Chi Minh, which caused congestion in the area. The Cai Mep
facility is located approximately 85km south east of Ho Chi Minh City, at the mouth of the South China
Sea.
Connectivity
In 2012, Vietnam scored 4871 on UNCTAD's liner connectivity index - a considerable improvement on
2004's score of 12.86. Although the port is trailing far behind regional outperformer Singapore, it is well
ahead of its neighbours Cambodia and the Philippines. BMI believes that this vast improvement in its
connectivity score over seven years demonstrates Vietnam's growing importance in global containerised
shipping. The country also now has direct links with major markets in the West. However, it should be
noted that Vietnam's place in global container shipping is not yet assured, and that as the industry has struck
difficulties Vietnam has been impacted more severely than more established ports of call. This has been
demonstrated by the fact that Vietnam's score in 2012 marked a slight decline from 2011's peak of 49.71.
Vietnam Shipping Report Q3 2013
© Business Monitor International Page 23

Getting Better Connected
Vietnam's Score On The Liner Connectivity Index, 2004-2012
Source: UNCTAD
Vietnamese ports are well placed to take advantage of growing Intra-Asia trade volumes.
The rapid growth in Vietnam's port volumes has attracted ample international investment in port terminals,
giving rise to overcapacity concerns.
Alleviating economic headwinds in the US and China will support Vietnam's export markets and container
ports.
We caution that Vietnam needs to invest in its freight transport network in its entirety to ensure efficiency at
its ports.
Regional Role
The Port of Ho Chi Minh is a vital domestic and regional facility, with the port having rapidly expanded in
response to sharp growth in the Vietnamese economy. Container traffic through the port accounts for over
65% of Ho Chi Minh City's market share and more than 40% of the entire country's.
Vietnam Shipping Report Q3 2013
© Business Monitor International Page 24

Rapid Climber
Source: UNCTADstat
Intra-Asian trade has been growing rapidly, with many shipping firms using this to cushion themselves from
the slowly recovering big-money East-West routes. The Port of Ho Chi Minh has been a key part of this and
it is not only regional trade for which Vietnam is becoming key. In 2009, Hanjin Shipping became the first
carrier to launch a direct service between Vietnam and the US. In September 2010, Hanjin became the first
line to launch direct Vietnam-Europe services, followed in October 2010 by CMA CGM making the
country a port of call on its FAL3 service.
The Port of Cai Mep was developed in response to the rapid growth in trade volumes at the Port of Ho Chi
Minh City, which caused congestion in the area. BMI notes that the terminal has a considerable advantage
over Ho Chi Minh, in that it offers a draft of 14 metres (m), thereby enabling it to serve post-Panamax
container vessels, which cannot call at other Vietnamese ports due to draft and turning restrictions.
The importance of the port's depth was reflected in December 2011, when Cai Mep International Terminal
(CMIT) docked its largest ever containership. The 13,830TEU CMA CGM Laperouse is the biggest vessel
to dock in the Vietnamese port, with its accommodation made possible by the post-Panamax cranes
operating at the site.
BMI believes that Cai Mep's positive throughput growth outlook is in large part attributable to APM
Terminal (APMT)'s operation of the terminal, as the company has poured in investment and attracted new
Vietnam Shipping Report Q3 2013
© Business Monitor International Page 25

clients operating on key trade routes. We believe APMT's presence will support continued growth at the
port over the medium term (2013-2017) as it continues to improve the port's facilities and attract shipping
lines keen to capitalise on Vietnam's positive macroeconomic outlook.
Cai Mep International Terminal (CMIT) at the Port of Ho Chi Minh City (also known as New Saigon Port),
which is made up of a collection of terminals lying 50km away from Vietnam's capital city, is on course to
handle nearly 600,000 twenty-foot equivalent units (TEUs) in 2012 - its first full calendar year of
operation - according to projections from Maersk Line sister company APMT. CMIT accepted its first
vessel on March 30 2011 and in the following nine months to 2012 handled 186,000TEUs.
On The Up
Source: World Bank
BMI highlights the substantial investments APMT has made in CMIT since it opened in March 2011 as an
important driver of growth. In addition to helping to construct the port, which it did through a joint venture
(JV) with Saigon Port and Vietnam National Shipping Lines (Vinalines), APMT purchased two laden
reach stackers, an empty reach stacker, two empty container handlers and a 25-tonne forklift - all of which
were delivered by Konecranes in 2011. Weak infrastructure is one of the main factors holding back
Vietnam's shipping sector - the country ranks 111th out of 145 countries on the World Economic Forum's
Vietnam Shipping Report Q3 2013
© Business Monitor International Page 26
Global Competitiveness Report on the Quality of Port Infrastructure. As such, APMT's commitment to
improving CMIT's facilities is an important step both for the terminal and the country's shipping sector as a
whole.
Investment in the port has allowed Cai Mep to attract a client base of some of the major players in the box
shipping sector. While a foregone conclusion, given APMT's close connection with the company, Maersk
Line began pulling into the port in August 2011, boosting throughput as expected. More significantly,
CMIT has added CMA CGM and the Grand Alliance - comprising shipping lines Hapag-Lloyd, Nippon
Yusen Kaisha (NYK), and Orient Overseas Container Line (OOCL) - to its client list. These lines not
only provide positive prospects for the port given their direct impact on throughput volumes, but also
because their presence signals the industry's confidence in the terminal's growth outlook and growing role in
the region.
An important aspect of the addition of these lines to the terminal is that they have exposed CMIT to the two
largest maritime trade routes: Asia-Europe and Asia-America. Maersk has added the port to its Transpacific
string from Asia to North America, while CMA CGM and the Grand Alliance have placed it on their Asia-
Europe routes, marking the first time Vietnam had been directly connected on either of these trade routes.
We highlight that Vietnam previously only played a role as a feeder port, relying on the transhipment of
containers through one of Asia's larger, better-equipped ports such as Singapore. Exposure to these routes is
in large part attributable to the port's ability to handle ultra-large container ships, which are becoming the
standard for shipping containers on Asia-Europe trade routes. This was demonstrated in December 2011,
when CMA CGM's 13,820TEU Laperouse docked at the terminal. We believe CMIT's proven capacity for
handling these vessels marks an important step for the terminal and will be a key driver of growth over the
medium term, though in the near term there are significant hurdles to be crossed.
Overcapacity Remains A Threat
The rapid growth in Vietnam's port volumes has attracted ample international investment in port terminals.
However, concerns are being raised about the possibility of overcapacity in the country's container port
sector. This a particular concern for operators at the Port of Cai Mep. In 2006, international terminal
operators secured stakes in nine terminals at the port after the government invited foreign investment,
believing that rising throughput volumes would be quickly soaked up by increasing capacity. Five of the
nine planned terminals are in operation in the Cai Mep area, but are working well below capacity, with as
little as 20% of capacity at CMIT being utilised. With additional new facilities due to come online, BMI
Vietnam Shipping Report Q3 2013
© Business Monitor International Page 27
believes this is a considerable cause for concern. Further, as container shipping lines look to consolidate
their services Vietnam, as a relatively new addition, is at risk of being struck from the ports of call.
The lack of container traffic seen at the beginning of 2012 also poses problems for ports in the province of
Ba Ria-Vung Tau. Ports in the region have a total container handling capacity of up to 8mn TEUs; however,
the actual demand only comes to around 5mn TEUs. Ports in the Cai Mep-Thi Vai region of Ba Ria-Vung
Tau have been failing to attract a significant number of vessels, despite a total investment of over US$7bn
by the end of 2011, according to reports. The region contains several modern container ports and is set to
open several more facilities in 2012 and 2013. Industry analysts attributed the failure to a lack of
infrastructure, which has caused capacity to remain largely underutilised. Only 62.5% of overall port
capacity in the province of Ba Ria-Vung Tau is in use.
It is in this atmosphere of concern over having grown too much too soon that the construction of Van Phong
International Transshipment Port has been halted at the behest of the Vietnamese Transport Ministry. The
decision to shelve the planned port - originally proposed to be completed by 2020 - was undertaken by the
Vietnamese Deputy Prime Minister, Hoang Trung Hai and was made public in September 2012.
The estimated cost of the project was set to be US$3.6bn and the construction work would have included 37
wharves at length of 12.5km. The initial stage of the project began in October 2009 and was pencilled in to
be completed by the end of 2012; however, financial mismanagement meant that the project fell way behind
schedule. Vinalines, the project's investor, was urged to alter its plans by the Vietnamese government and so
the company came up with the idea of expanding the port in order to handle container vessels up to
12,000TEUs.
The deputy prime minister asked the Transport Ministry to look into the feasibility of raising domestic and
foreign investment to fund the project, which is located in Hon Gom peninsula. The Van Phong port has
become the target for criticism, as Vietnam's attractiveness for potential investors weakens. The Van Phong
site was described as too far from any major manufacturing companies, and the state's role in neglecting
better infrastructure at strategic locations is being highlighted.
Global Headwinds Alleviating In 2013
We forecast Vietnam's real GDP growth figure to climb to 6.3% in 2013. This marks a downwards revision
from the 7.0% we forecasted last quarter, and follows an expansion of 5.0% in 2012; this expansion in 2012
was the slowest since 1999, and reflected the headwinds buffeting Vietnam's key trade partners, namely the
US and China. However, the outlook for 2013 is looking more sanguine, resulting in our growth rate of
Vietnam Shipping Report Q3 2013
© Business Monitor International Page 28

6.3%. This is in keeping with our more buoyant general outlook for the global economy which has seen us
make a significant upwards revision to our China growth forecast for the year from 7.1% to 7.5%, and bump
the US's growth projection up to 2.3% following the avoidance of the fiscal cliff.
However, over the longer term, imports will be boosted by Vietnam's young population, as younger
populations are generally more supportive of private consumption. The country has a population of 90.7mn,
according to estimates for 2013 by BMI, 60% of which is under 35. We forecast that the population will be
94.1mn by 2017, with 57% under 35, and will rise to 97.7mn by 2022.
Road And Rail Links Need Investment
The Vietnamese government plans to deepen the Port of Ho Chi Minh City's draught, allowing larger
vessels to access the facility. BMI notes that these works are badly needed, as we are seeing a growing
trend of lines ordering larger container vessels. Recognising the need to cater for bigger vessels, Vietnam's
prime minister has directed the country's ministry of transport and its Maritime Administration to focus on
developing deep water ports. A channel depth of about 14m is required for non-tide restricted access for
vessels with capacity of up to 8,000TEUs.
BMI notes that while Vietnam's port sector has received plenty of investment, due to growing Intra-Asia
trade volumes, the freight transport networks that link the ports with production and consumer centres are
badly in need of investment. Growth in box throughput at the nation's ports has far outpaced investment in
its freight transport network. In 2010 (latest available data), total container throughput at the country's ports
reached 5.98mn TEUs, up 550% from the 919,264TEUs handled in 1999.
With a rating of 123 out of 142 in the World Economic Forum's 2011-2012 Global Competitiveness Report,
Vietnam's road infrastructure is the regional underperformer, trailing well behind regional leaders Singapore
and Hong Kong. The country's rail infrastructure fares slightly better, with a score of 71 out of 123, placing
it just ahead of the regional underperformer the Philippines. BMI believes there must be more private and
state investment in developing these links if the country's ports are to take full advantage of increasing trade
volumes.
Vietnam Shipping Report Q3 2013
© Business Monitor International Page 29
Industry Trends And Developments
Global Economic Pick Up To Support Ho Chi Minh Port Growth
Year-on-year (y-o-y) tonnage throughput growth at the Port of Ho Chi Minh is set to come in at a very
healthy 7.56% in 2013, to reach 38.75mn tonnes, which is slightly down on 2012's estimated y-o-y increase
of 7.71%. Container throughput is predicted to perform even better, forecast as it is to reach growth of
7.95% in 2013. This faster rate of growth is in keeping with our macroeconomic outlook on Vietnam, where
we forecast that real GDP growth will accelerate from 5.0% in 2012 to 7.0% in 2013.
This ties in with what we are seeing in the global economy; the US and China are Vietnam's two biggest
trade partners. These two markets are essential for throughput at Vietnamese ports as the South East Asian
country is rapidly becoming the workshop of Asia as the labour market is cheaper than that in China. As
such its container-handling facilities are in demand for finished products to be exported through them. We
are more optimistic with regards to economic growth in both China and the US in the coming year; we have
recently revised up our China growth forecast for 2013 from 7.1% to 7.5%, and our US growth forecast as
been bumped up to 2.3% following the successful avoidance of the fiscal cliff.
It is not only the macro picture that is supporting growth at Ho Chi Minh, but also investment in new
facilities at the port complex, centred around the premier commercial centre of southern Vietnam. Despite a
slow start amid the bleak macroeconomic fundamentals affecting the eurozone, China and the US, there are
signs that Cai Mep International Terminal (CMIT) is beginning to outperform, placing upside risk on our
forecasts for the Port of Ho Chi Minh City as a result. We believe that Cai Mep's positive throughput
growth outlook for 2012 is in large part attributable to APM Terminal (APMT)'s operation of the terminal
over the year, as the company has poured in investment and attracted new clients operating on key trade
routes.
APMT's presence should support continued growth at the port over the medium term (2013-2017) as it
continues to improve the port's facilities and attract shipping lines keen to capitalise on Vietnam's positive
macroeconomic outlook. Despite being operational for just a year, CMIT likely handled close to
600,000TEUs in 2012.
Vietnam Shipping Report Q3 2013
© Business Monitor International Page 30
Medium Term: Impressive Growth Beckons
Impressive growth will be the order of the day for the Port of Ho Chi Minh City over the medium term to
2017. Tonnage throughput will average 6.6% to reach just under 50mn tonnes by the end of the forecast
period - 49.66mn tonnes in 2017. Box throughput, meanwhile, is also set to remain very healthy, averaging
7.0% over our forecast period, which will see throughput reaching 4.51mn TEUs by the end of 2017. BMI
highlights the substantial investments APMT has made in CMIT since it opened in March 2011 as an
important driver of growth and believes this will continue to be the case.
BMI highlights that the Port of Ho Chi Minh previously only played a role as a feeder port, relying on the
transhipment of containers through one of Asia's larger, better equipped ports such as Singapore. Exposure
to these routes is in large part attributable to the port's ability to handle ultra-large container ships, which are
becoming the standard for shipping containers on Asia-Europe trade routes. This was demonstrated in
December 2011, when CMA CGM's 13,820TEU Laperouse docked at the terminal. We believe CMIT's
proven capacity for handling these vessels marked an important step for the terminal and will be a key
driver of growth over the medium term.
With real GDP forecast to grow at an average annual rate of 7.1% over the medium term and nominal GDP
per capita set to increase almost twice as fast, at 13.0% annually, a key driver of this growth will be the
country's booming export sector, providing a boost to the country's shipping sector, especially the Port of
Ho Chi Minh City.
Long Term: Infrastructure Improvements Needed
Capacity issues at the Port of Ho Chi Minh are expected to dog Vietnam in both the short and long term,
although Cai Mep provides sizeable opportunities. The solution to this disruptive problem will not just be a
small matter of capacity expansion. BMI suggests that the country must also put money into landside
supply chain, such as road and rail networks. These developments are particularly vital if Vietnam is to
achieve its aim of enabling Ho Chi Minh to handle larger container vessels so that it can ship goods directly
to destination markets.
Growth Potential In The New Factory Of Asia
Vietnam's shipping transport sector will benefit from the uptick in domestic growth and also the steady
growth outlook of its two main trade partners, the USA and China, which will drive export growth.
Vietnam Shipping Report Q3 2013
© Business Monitor International Page 31
Vietnam's logistics sector has been developing to keep up with the country's increasing role as Asia's
factory, especially in the manufacturing of clothing and shoes. Vietnam's connections to its key export
partners has been improving over the last three years, with the country now boasting direct container line
services to the US and Europe.
Vietnam's economic growth is picking up. While the country's economy expected to expand at a reasonable
rate of 5.0% on 2012 this year marked the second year in which Vietnam's real GDP slowed. In 2013 BMI
forecasts the country's economic expansion to get back on its growth trajectory with Vietnam's real GDP
projected to grow by 6.95%.
The country's medium-term growth will place even more pressure on the country's logistics sector with
Vietnam's economy forecast to expand quicker over the next four years, with an average growth of 7%
predicted between 2013-2017 compared to an average annual growth of 5.9% between 2008-2012.
To keep pace with this growth Vietnam will continue to need to invest in its logistics sector, but BMI
expects a lot of this investment to come from outside logistic and freight transport companies which will be
keen to enter and expand into this high-growth market. We have already witnessed this to some extent in
Vietnam's port sector, with considerable investment being made by container shipping lines and global port
operators in the development of modern box terminals at Vietnam's ports.
This investment in the country's maritime sector has ensured that Vietnam's manufacturing growth can be
achieved with greater links between the country and its main trade partner the US. Direct container shipping
links between Vietnam and the US have been in operation since 2009, which have cut both time and cost, as
previously Vietnamese shipments had to be transhipped via Singapore.
Demand from the US for Vietnam's manufactured goods looks set to continue growing, with Vietnam's
exports set to benefit from the steady recovery in the US economy. We have revised up our US real GDP
forecast for 2013 to 2.3% an improvement on the estimated increase of 2.2% in 2012. Over the medium
term (2013-2017) we forecast the US economy to expand by an average 2.4% per annum.
Transport Ministry Opens Cai Mep Thi Vai International Port
The Cai Mep Thi Vai International Port in the southern province of Ba Ria Vung Tau, Vietnam was
successfully opened by the Ministry of Transport at the end of January 2013. The port, which has been
designed to fulfil the rising demand of container shipping in the south, is the country's deepest and biggest
Vietnam Shipping Report Q3 2013
© Business Monitor International Page 32
seaport. The port project, worth around US$620mn, will also open direct shipping channels with other
domestic and international ports globally, thereby reducing the intermediate and transit shipping expenses.
Additionally, the project will offer assistance in the social economic development of Ba Ria Vung Tau and
the southern region, while offering protection from overload burdens to other ports in the south, Deputy
Prime Minister Hoang Trung Hai said. Meanwhile, the project has developed an international gateway
having an ability to export Vietnamese goods directly to European and North American ports without
stopping at international transit terminals in the region, Transport Vice Minister Nguyen Van Cong said.
Deputy Prime Minister Hoang Trung Hai explained: 'The project will also help increase the social economic
development of Ba Ria Vung Tau in particular and the southern region in general while saving other ports
in the south from overload burdens.'
The Cai Mep-Thi Vai International Container Terminal (CTICT), which was inaugurated at end-January, is
likely to worsen the port overcapacity situation in south Vietnam, reports Container Management Magazine.
The CTICT is set to officially begin commercial operations in six months following the conclusion of the
final installation of equipment by contractors. The Vietnamese government and Japanese Official
Development Assistance body jointly funded the construction of the terminal.
The terminal would ease clogging faced in southern Vietnam according to suggestions given by the
Vietnamese Ministry of Transport. However, the fact is that the terminal's capacity is extremely under-
utilised.
Vinalines Expects To Record VND2.1trn In Losses In 2013
Nguyen Canh Viet, the CEO of Vietnam National Shipping Lines (Vinalines), has announced that the
company expects to record VND2.1trn (US$100.96mn) worth of losses in 2013, owing to the downturn in
the ocean transport sector, it was reported on February 1 2013. The CEO added that losses are also
experienced by several seaports, such as CICT, SSIT, SP-PSA and CMIT, which are managed by the joint
ventures between Vinalines and international partners. Meanwhile, the company's subsidiaries sold a total
of 10 vessels in order to reduce losses in 2012. The company is looking forward to secure a VND3trn (US
$144.2mn) loan for its 14 subsidiaries in order to carry out operations even during the tough times, Viet
mentioned. Additionally, the ocean transporting market is likely to be revitalised in 2017, enabling the
company's subsidiaries to repay debts by that point of time, Viet added.
Vietnam Shipping Report Q3 2013
© Business Monitor International Page 33

Construction Of Lach Huyen Terminal To Start In April
Vietnam's Prime Minister Nguyen Tam Dung has announced that the construction of the deepwater Lach
Huyen Terminal in Haiphong is scheduled to start in April. The US$1.2bn, 900,000TEU joint venture
between Vietnam's Vinalines and Japan's Mitusi OSK Lines, Nippon Yusen Kaisha and Itochu is the first
public-private project in Vietnam. The project is likely to be operational in 2015. The terminal, which might
emerge as the largest port facility for the north of the country with a draught of 14m, will be able to
accommodate vessels with a capacity ranging between 8,000TEUs and 9,000TEUs. The new facility will be
situated 100km north east of Hanoi and is likely to help in easing port congestion in Haiphong.
Vietnam Shipping Report Q3 2013
© Business Monitor International Page 34

Company ProfileVietnam Petroleum Transport Company (VIPCO)
SWOT Analysis
Strengths ■ 60% of VIPCO's fleet is employed by Petrolimex.
■ The company boasts a relatively young fleet.
■ It has diversified away from operating in a single sector, with a real estate arm.
Weaknesses ■ VIPCO only operates in one shipping sector.
Opportunities ■ The company plans to expand its fleet.
Threats ■ Vietnam's reliance on imported refined products is decreasing as the country brings
online more refining capacity, which could negatively affect VIPCO. In the longer term,
Vietnam's refining capacity could allow the state to export.
Company Overview The Vietnam Petroleum Transport Joint Stock Company (VIPCO) offers maritime
transport for petroleum products. The company has a diversified portfolio, including
units that support its product tanker fleet - such as its port operations and freight
forwarding services. It is also engaged in real estate.
Strategy VIPCO has developed a fleet of six product tankers with a total capacity of 176,111
deadweight tonnes (DWT). The fleet is relatively young with an average age of 16 years.
VIPCO has a fleet expansion strategy in place and is prepared to invest either in
newbuilds or purchasing tankers under the age of 10 years. The company plans to
boost its fleet to 200,000DWT.
The majority of VIPCO's tanker fleet (60%) is employed to meet the transport needs of
the Vietnam National Petroleum Corporation (Petrolimex). The remaining 40% is
charted to other consignees.
Via its connection with Petrolimex, the company is able to cater for Vietnam's oil sector.
While Vietnam has estimated oil reserves of 4.6bn barrels, it imports refined products.
The company's shipping unit is complemented by its petrochemical terminal's sector.
Vietnam Shipping Report Q3 2013
© Business Monitor International Page 35
Financial Data 2012
N/A
2011
For the final quarter of 2011, VIPCO registered a drop in net income to VDN8bn, down
from VDN51.7bn a year previously. Meanwhile, in mid-February 2012, the company saw
its share price fall 2.2% to VND4,500.
For the first half ended June 2011, the company reported a net profit of VND38.66bn
(US$1.88mn), which represents a 121% year-on-year (y-o-y) increase. Revenues rose
36% y-o-y to VND943.12bn during this period, while six-month earnings per share were
VND647, compared with less than half of that for the corresponding period of 2010.
Latest Activity Petrolimex Launches New Subsidiary
The board of directors of Vietnam National Petroleum Group (Petrolimex) made an
announcement in February 2013 that a new wholly-owned subsidiary was to be
established called PG Tanker. Headquartered in Hanoi, the subsidiary forms part of
Petrolimex's restructuring plans and it will become the parent corporation to other
subsidiary companies, including VIPCO, VITACO, PTS Hai Phong and Cua Cam Port.
Vietnam Shipping Report Q3 2013
© Business Monitor International Page 36

Vietnam National Shipping Lines (Vinalines)
SWOT Analysis
Strengths ■ Diversified fleet operating in dry bulk, container and oil transport.
■ Largest commercial shipping line in Vietnam.
Weaknesses ■ Vietnam does not play a role on the major Asia-Europe routes, despite developing as
a direct port of call on these routes.
■ The US$3.6bn Van Phong International Port project, primarily constructed by state-
owned Vinalines, was suspended in June 2011 following a reassessment of the
geological conditions at the project site.
■ Vietnamese shipping company Vinalines is currently US$2.1bn in debt, reported
Reuters in June 2012.
■ Vinalines' heavy exposure to Vietnam's domestic transport sector, which has been
performing well recently, indicates that the firm's struggles go beyond the troubles
facing the global industry.
Opportunities ■ Vietnam is expanding its role in the global box market and it is fast becoming a
mainstay port of call on Asia-Europe services.
■ Potential to increase its intra-Asia role, shown by the expansion work at Cai Mep, and
well placed to be chosen as a partner on these services by major lines.
Threats ■ While Vietnam has invested heavily in its port network, the logistics supply chain
could be let down by the landside freight network, which will have a negative impact
on operators.
■ In 2011, Vinalines posted its first ever loss in 15 years of operations, with further
losses expected.
■ Overcapacity is a threat over the medium term, unless money is pumped into port
facilities and infrastructure.
Vietnam Shipping Report Q3 2013
© Business Monitor International Page 37

SWOT Analysis - Continued
■ Vietnamese police issued an arrest warrant for the former chairman due to the
scandal rocking the debt-mired company. Duong Chi Dung has been accused of
deliberately mismanaging Vinalines during his tenure.
■ Vinalines has been stung by the poor performance of the three container terminals it
has joint venture interests in.
Company Overview Vinalines is Vietnam's largest commercial shipping line. Established in 1996, it caters
for domestic trade in Vietnam and offers intra-Asia services.
The company also has a port operating division that is the largest in Vietnam, controlling
and managing ports in Quang Ninh, Hai Phong, Da Nang, Ho Chi Minh and Can Tho.
Strategy Vinalines' 14 shipping companies operate a diverse fleet, dominated by dry bulk vessels
but also boasting container ships, oil and product oil vessels.
According to the company's website, Vinalines' fleet consisted of 128 vessels. The line
is looking to expand, with a plan centred on increasing the proportion of specialised
vessels such as box ships or oil tankers.
In order to achieve this, the line was seeking to spend US$2bn on ordering new ships
from Vietnamese yards seeking state funding for the plan. Vinalines has in fact ended
up expanding its fleet quicker than intended, with the shipping line taking on 36 vessels
from the debt laden Vietnamese shipbuilder Vinashin in July 2010. Vinaline's chairman,
Duong Chi Dung, said at the time that up to two-thirds of the acquired vessels could not
be used as they failed to meet technical requirements. He estimated that the company
would need to spend US$26mn to repair the vessels and purchase insurance cover.
Dung added that the company expected some financial aid from the government for the
project.
Vinalines services the trade needs of Vietnam's domestic shipping market, but also has
exposure to the intra-Asia trade lane after joining forces with NYK in December 2010 to
launch a Thailand-Vietnam-Singapore (TVS) service. Vinalines provides a 1,100 twenty-
foot equivalent unit (TEU) vessel for the service.
BMI believes that Vinalines' presence on the intra-Asia trade route will increase, with
major lines looking to expand into the route and the company well placed to enter
partnerships with them. Vinalines is also increasing its contacts in the container sector,
partnering with a number of the majors on container terminal projects in Vietnam.
According to Port Strategy, Vietnam is of increasing interest in East Asia, due to the fact
that it is focusing on becoming better connected with both short and long haul
Vietnam Shipping Report Q3 2013
© Business Monitor International Page 38
destinations. Providing the bedrock to this strategy are the new terminals constructed in
the Cai Mep area.
Financial Data 2013
Vinalines is bracing itself for a full-year loss of VND2.1trn (US$101mn) already as the
company continues to perform abysmally following 2012's reported loss of VND2.44trn.
The company's CEO, Nguyen Canh Viet, said: 'There are few transporting contracts
amid these crisis times, while several partners refused to clear their payment on time,
despite the cheap fares.'
2012
Vinalines announced a VND1,439bn (US$69.2mn) loss during the first half of 2012,
which is around double the losses incurred for the corresponding period a year
previous. The loss was attributed to a 'perfect storm of liquidity and jobs woes',
according to Vinalines director Nguyen Canh Viet, reported by Vietnam Investment
Review.
2011
Vinalines recorded a VND62.15bn (US$3mn) profit for 2011, despite posting a loss of
VND660bn (US$32mn) in H111 - the first time this has ever occurred in the company's
15 years of operations. The results came as a surprise to analysts who were expecting
the company to suffer from the sinking of the bulker Vinalines Queen. In 2011, Vinalines
shipped 36.8mn tonnes of cargo, which was a 1% annual increase on 2010.
Latest Activity Government Asks Vinalines To Quit Port Project
Vinalines has been asked by the government to withdraw its plans to participate in the
development of the northern Lach Huyen Port, reported Sea Ship News in March 2013.
The company will continue to concentrate on its ongoing port projects; however, Hanoi
said that it needs to make arrangement of funds before it can mull over additional
expansion. Vinalines teamed up with Japan's Itochu, MOL and NYK for the
development of the port.
Vinalines Launched Country's Second Largest Carrier
On December 16 2012, Vinalines launched the second biggest bulk carrier in Vietnam in
Hai Phong city. Named Vosco Sunrise, the bulk carrier has been designed to cater for a
deadweight of 56,200DWT and according to a company statement, at the launching
ceremony, Nguyen Van Cong, Deputy Minister of the Ministry of Transport, said: 'In the
situation of difficulties faced by the ship building industry, the construction and
operation of Vosco Sunrise by Vietnamese corporations with help improve the image of
and create confidence in the Vietnam Ship building Industry.'
Vietnam Shipping Report Q3 2013
© Business Monitor International Page 39
Global Industry Overview - Container Shipping
Demand: Slow Start To 2013
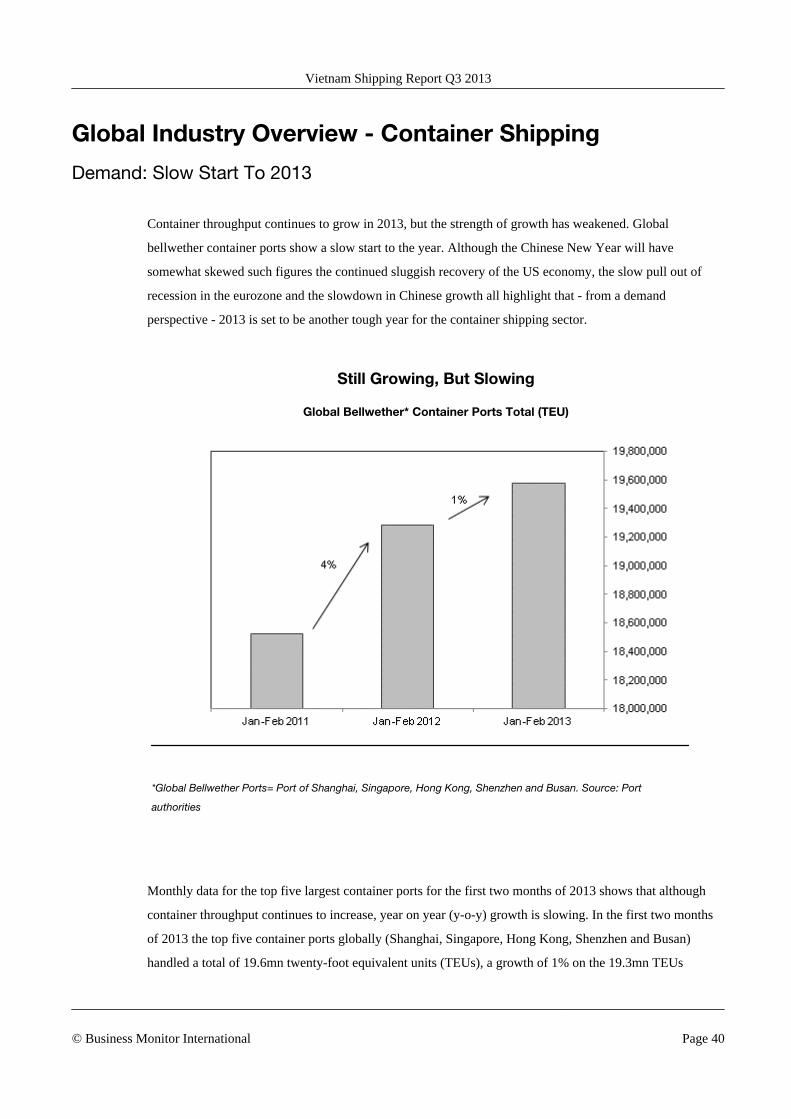
Container throughput continues to grow in 2013, but the strength of growth has weakened. Global
bellwether container ports show a slow start to the year. Although the Chinese New Year will have
somewhat skewed such figures the continued sluggish recovery of the US economy, the slow pull out of
recession in the eurozone and the slowdown in Chinese growth all highlight that - from a demand
perspective - 2013 is set to be another tough year for the container shipping sector.
Still Growing, But Slowing
Global Bellwether* Container Ports Total (TEU)
*Global Bellwether Ports= Port of Shanghai, Singapore, Hong Kong, Shenzhen and Busan. Source: Port
authorities
Monthly data for the top five largest container ports for the first two months of 2013 shows that although
container throughput continues to increase, year on year (y-o-y) growth is slowing. In the first two months
of 2013 the top five container ports globally (Shanghai, Singapore, Hong Kong, Shenzhen and Busan)
handled a total of 19.6mn twenty-foot equivalent units (TEUs), a growth of 1% on the 19.3mn TEUs
Vietnam Shipping Report Q3 2013
© Business Monitor International Page 40
handled for the same period in 2012. Container growth of just 1% is, however, considerably weaker than the
4% y-o-y increase recorded in January and February 2012.
BMI highlights that the slowdown in growth for the first two months of 2013 is partly due to the fact that
the Chinese New Year fell in February. This leads to a wind down in activity at ports in the Asia region and
can be partly blamed for the sluggish start to the year.
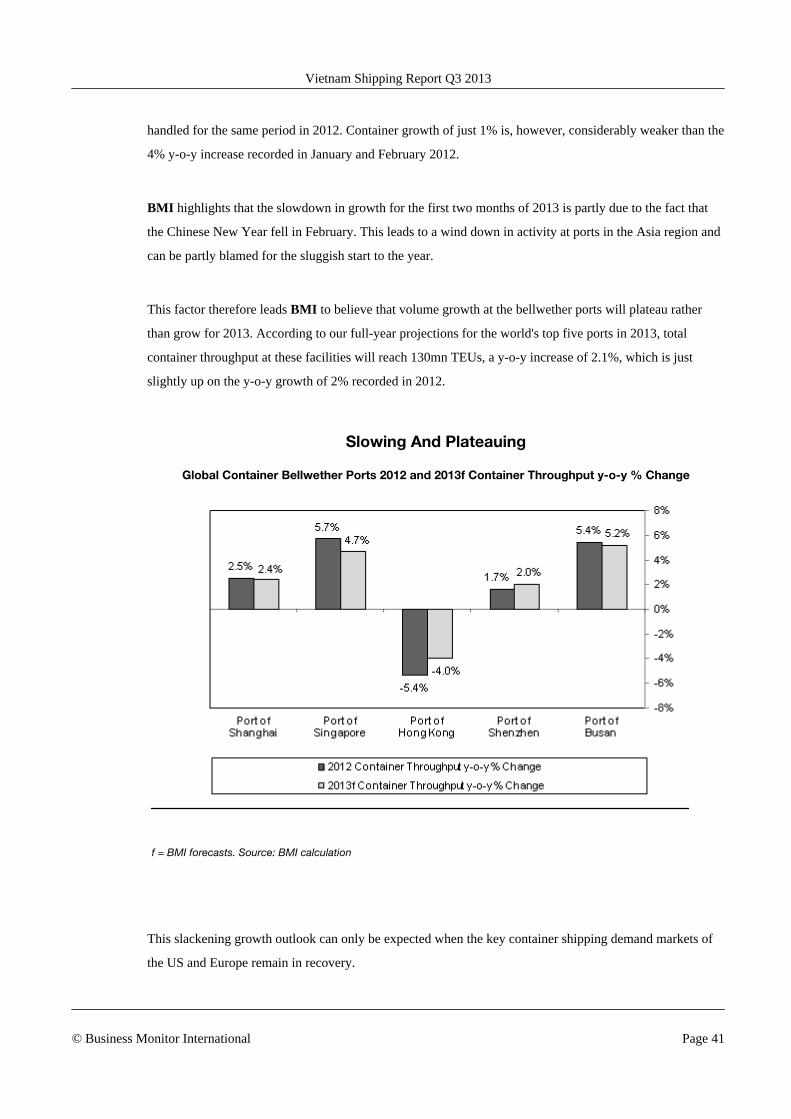
This factor therefore leads BMI to believe that volume growth at the bellwether ports will plateau rather
than grow for 2013. According to our full-year projections for the world's top five ports in 2013, total
container throughput at these facilities will reach 130mn TEUs, a y-o-y increase of 2.1%, which is just
slightly up on the y-o-y growth of 2% recorded in 2012.
Slowing And Plateauing
Global Container Bellwether Ports 2012 and 2013f Container Throughput y-o-y % Change
f = BMI forecasts. Source: BMI calculation
This slackening growth outlook can only be expected when the key container shipping demand markets of
the US and Europe remain in recovery.
Vietnam Shipping Report Q3 2013
© Business Monitor International Page 41

The US' economic recovery is projected to continue in 2013, but is set to plateau, with a forecast expansion
of 2.1% predicted, roughly at the same level to the 2.2% y-o-y growth estimated in 2012. The eurozone is
forecast to emerge from recession, with a growth of just 0.1% following an estimated contraction of 0.7% in
2012.
Demand Weakening
US, Eurozone and China Real GDP Growth, % Change y-o-y
*2012 data is a BMI estimate. Source: National Statistics Authorities
This ongoing, but sluggish, recovery in demand for goods shipped by container is being further
compounded by the slowing in Chinese growth, which has meant less robust demand growth in the
emerging market.
European Consumers Still Not Convinced
Shipping specific indicators for the demand picture on the Asia-Europe trade route have yet to be published,
with no information on container throughput from the European bellwether ports of Rotterdam, Antwerp or
Hamburg. Latest data on throughput via the Suez Canal is from December 2012, highlighting that although
the unrest in Egypt has not impacted the running of the waterway it would appear it have negatively
Vietnam Shipping Report Q3 2013
© Business Monitor International Page 42

affected the Suez Canal Authority's ability to publish data, which up until the beginning of 2013 it was
doing every month.
BMI highlights that rate data gives a partial insight into the state of demand on the Asia-Europe trade route.
The problem of overcapacity persists and according to the Shanghai Containerised Freight Index (SCFI)
rate levels are now down y-o-y and have fallen below the US$1,000-per-TEU threshold twice so far in
2013.
Our macroeconomic forecasts also highlight why container throughput volumes on this route are struggling
to expand. BMI forecasts the eurozone to emerge from recession in 2013, but predicts a growth of just 0.1%
following an estimated contraction of 0.7% in 2012. According to our projections the economic recovery in
this region will only truly start to get underway in 2014 when a y-o-y growth increase of 1.2% is forecast.
Remaining In The Doldrums
European Consumer Sentiment
Source: European Commission's Business and Consumer Survey
A major factor holding back a more robust recovery is the consumer outlook in the region. The continued
threat of the collapse of the euro, the threat that states could leave this common currency, and continued
Vietnam Shipping Report Q3 2013
© Business Monitor International Page 43
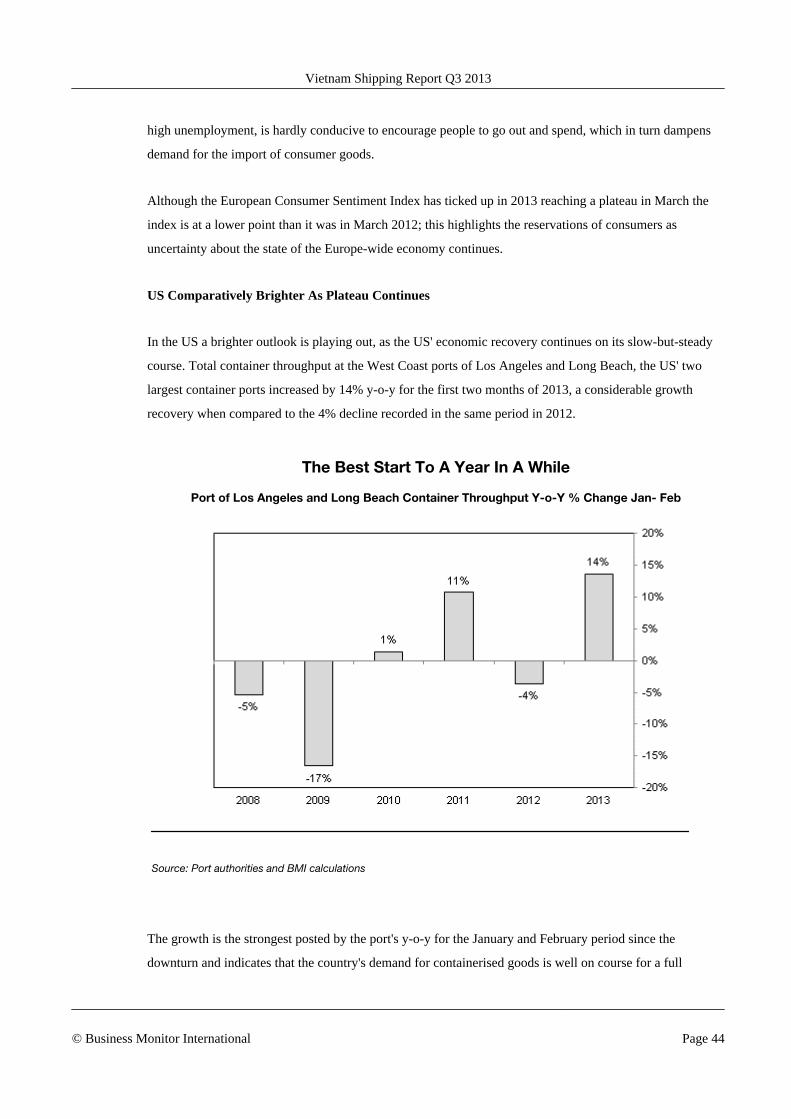
high unemployment, is hardly conducive to encourage people to go out and spend, which in turn dampens
demand for the import of consumer goods.
Although the European Consumer Sentiment Index has ticked up in 2013 reaching a plateau in March the
index is at a lower point than it was in March 2012; this highlights the reservations of consumers as
uncertainty about the state of the Europe-wide economy continues.
US Comparatively Brighter As Plateau Continues
In the US a brighter outlook is playing out, as the US' economic recovery continues on its slow-but-steady
course. Total container throughput at the West Coast ports of Los Angeles and Long Beach, the US' two
largest container ports increased by 14% y-o-y for the first two months of 2013, a considerable growth
recovery when compared to the 4% decline recorded in the same period in 2012.
The Best Start To A Year In A While
Port of Los Angeles and Long Beach Container Throughput Y-o-Y % Change Jan- Feb
Source: Port authorities and BMI calculations
The growth is the strongest posted by the port's y-o-y for the January and February period since the
downturn and indicates that the country's demand for containerised goods is well on course for a full
Vietnam Shipping Report Q3 2013
© Business Monitor International Page 44
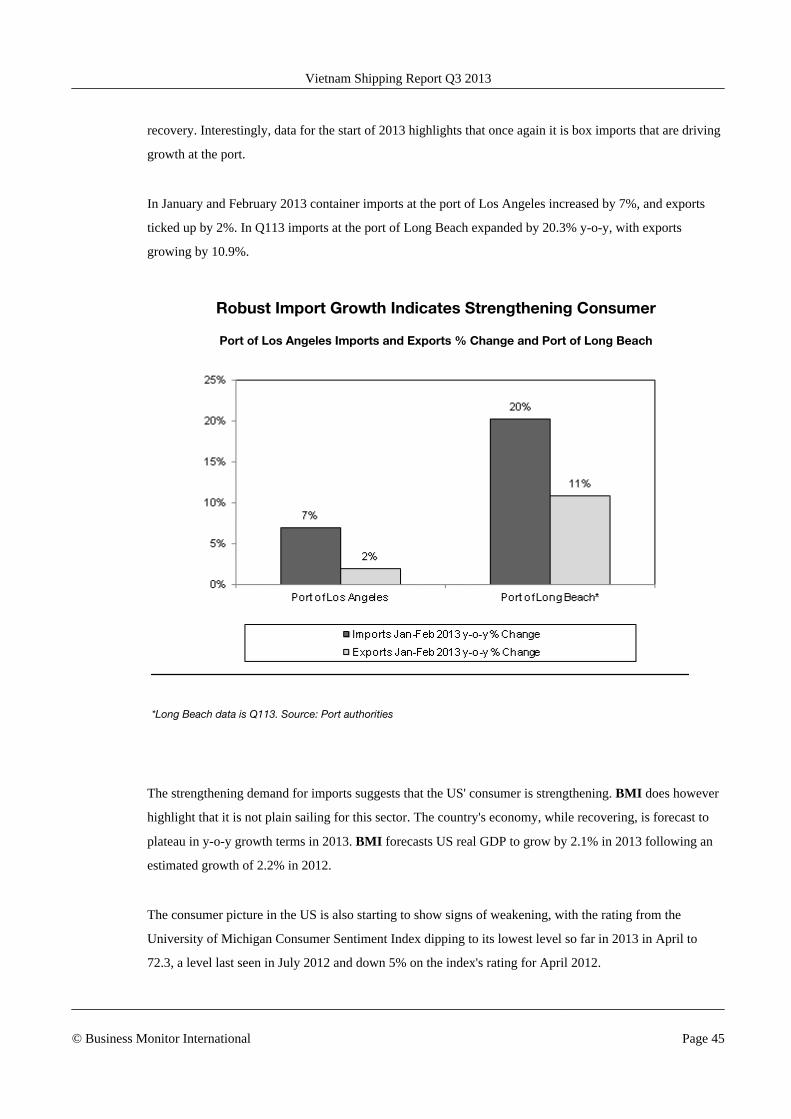
recovery. Interestingly, data for the start of 2013 highlights that once again it is box imports that are driving
growth at the port.
In January and February 2013 container imports at the port of Los Angeles increased by 7%, and exports
ticked up by 2%. In Q113 imports at the port of Long Beach expanded by 20.3% y-o-y, with exports
growing by 10.9%.
Robust Import Growth Indicates Strengthening Consumer
Port of Los Angeles Imports and Exports % Change and Port of Long Beach
*Long Beach data is Q113. Source: Port authorities
The strengthening demand for imports suggests that the US' consumer is strengthening. BMI does however
highlight that it is not plain sailing for this sector. The country's economy, while recovering, is forecast to
plateau in y-o-y growth terms in 2013. BMI forecasts US real GDP to grow by 2.1% in 2013 following an
estimated growth of 2.2% in 2012.
The consumer picture in the US is also starting to show signs of weakening, with the rating from the
University of Michigan Consumer Sentiment Index dipping to its lowest level so far in 2013 in April to
72.3, a level last seen in July 2012 and down 5% on the index's rating for April 2012.
Vietnam Shipping Report Q3 2013
© Business Monitor International Page 45

Bumpy Consumer Ride Continues
University of Michigan Consumer Sentiment Index
Source: Bloomberg
Due to these indicators BMI is projecting that although growth at the port of Long Beach and Los Angeles
with strengthen for the full year of 2013 up from a y-o-y growth of 1% in 2012 to 4% in 2013.
Vietnam Shipping Report Q3 2013
© Business Monitor International Page 46
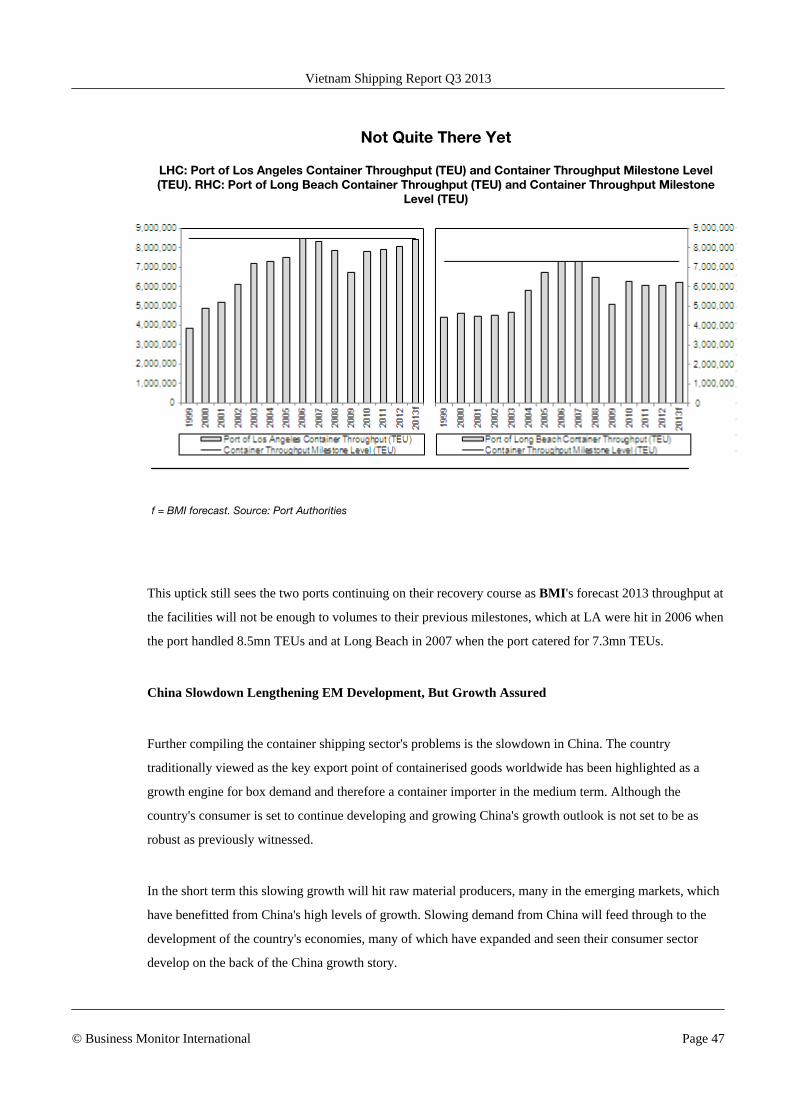
Not Quite There Yet
LHC: Port of Los Angeles Container Throughput (TEU) and Container Throughput Milestone Level(TEU). RHC: Port of Long Beach Container Throughput (TEU) and Container Throughput Milestone
Level (TEU)
f = BMI forecast. Source: Port Authorities
This uptick still sees the two ports continuing on their recovery course as BMI's forecast 2013 throughput at
the facilities will not be enough to volumes to their previous milestones, which at LA were hit in 2006 when
the port handled 8.5mn TEUs and at Long Beach in 2007 when the port catered for 7.3mn TEUs.
China Slowdown Lengthening EM Development, But Growth Assured
Further compiling the container shipping sector's problems is the slowdown in China. The country
traditionally viewed as the key export point of containerised goods worldwide has been highlighted as a
growth engine for box demand and therefore a container importer in the medium term. Although the
country's consumer is set to continue developing and growing China's growth outlook is not set to be as
robust as previously witnessed.
In the short term this slowing growth will hit raw material producers, many in the emerging markets, which
have benefitted from China's high levels of growth. Slowing demand from China will feed through to the
development of the country's economies, many of which have expanded and seen their consumer sector
develop on the back of the China growth story.
Vietnam Shipping Report Q3 2013
© Business Monitor International Page 47
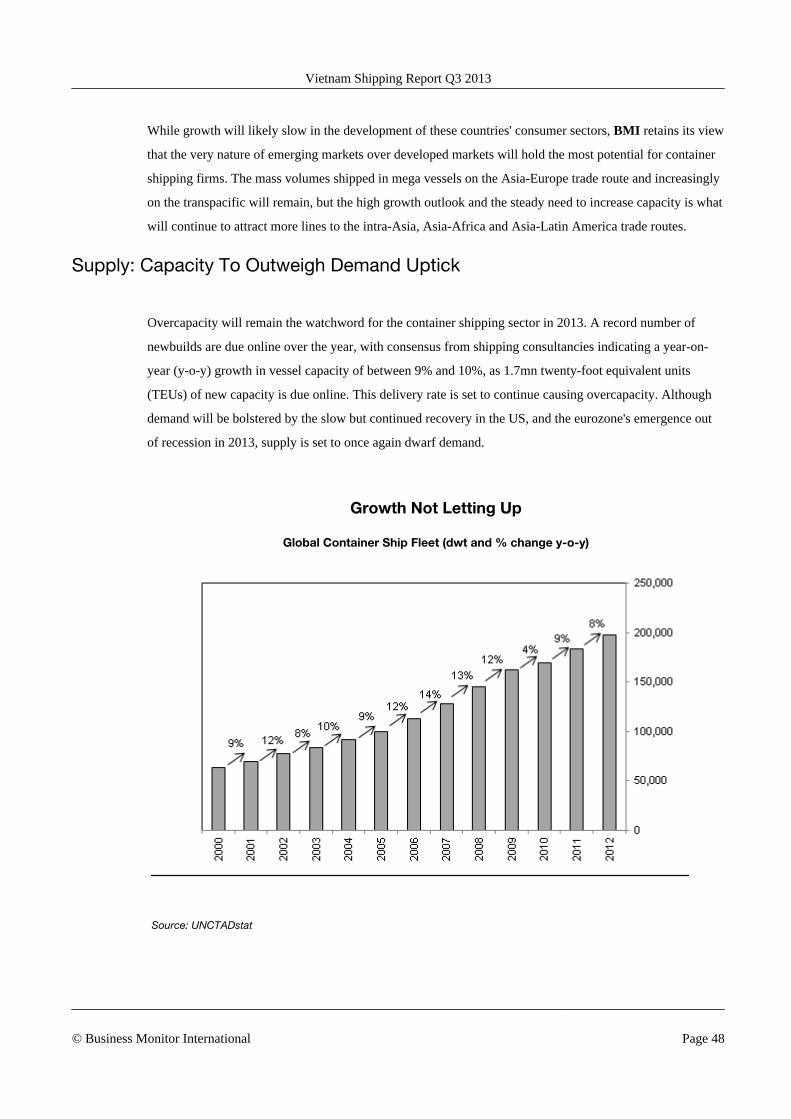
While growth will likely slow in the development of these countries' consumer sectors, BMI retains its view
that the very nature of emerging markets over developed markets will hold the most potential for container
shipping firms. The mass volumes shipped in mega vessels on the Asia-Europe trade route and increasingly
on the transpacific will remain, but the high growth outlook and the steady need to increase capacity is what
will continue to attract more lines to the intra-Asia, Asia-Africa and Asia-Latin America trade routes.
Supply: Capacity To Outweigh Demand Uptick
Overcapacity will remain the watchword for the container shipping sector in 2013. A record number of
newbuilds are due online over the year, with consensus from shipping consultancies indicating a year-on-
year (y-o-y) growth in vessel capacity of between 9% and 10%, as 1.7mn twenty-foot equivalent units
(TEUs) of new capacity is due online. This delivery rate is set to continue causing overcapacity. Although
demand will be bolstered by the slow but continued recovery in the US, and the eurozone's emergence out
of recession in 2013, supply is set to once again dwarf demand.
Growth Not Letting Up
Global Container Ship Fleet (dwt and % change y-o-y)
Source: UNCTADstat
Vietnam Shipping Report Q3 2013
© Business Monitor International Page 48
As highlighted, part of the ongoing capacity problem is the volume due online in 2013. The projected
increase of between 9% and 10% is on top of the 9% and 8% growth in the global container fleet in 2011
and 2012, respectively.
However, the major issue facing containership operators in 2013 will be the influx of vessels on the Asia-
Europe trade route. The route is just starting on the road to recovery, following a recession in the eurozone
in 2012, but is set to see the greatest concentration of new tonnage, as a new fleet of mega vessels are
launched.
Due to their size, vessels of 14,000TEU and over are restricted to the Asia-Europe route, and in 2013 even
more of these vessels are due online. In the top tier of container shipping companies the bar is being set
higher in terms of vessel capacity, with CMA CGM welcoming its second 16,000TEU ship, the Alexander
von Humboldt, which along with its sister ship, the Marco Polo, are the largest box ships afloat.
Maersk Line is set to take delivery of the first of its fleet of 20 18,000TEU vessels in mid-2013, moving the
bar even higher in terms of ships operating on the Asia-Europe route. Other carriers in the top 20, while not
going as far as CMA CGM and Maersk Line with their fleet expansions, are taking on larger vessels. APL,
NYK Line and OOCL are all due to join the mega vessel club, operating ships of 13,000TEU or above in
2013.
Vietnam Shipping Report Q3 2013
© Business Monitor International Page 49
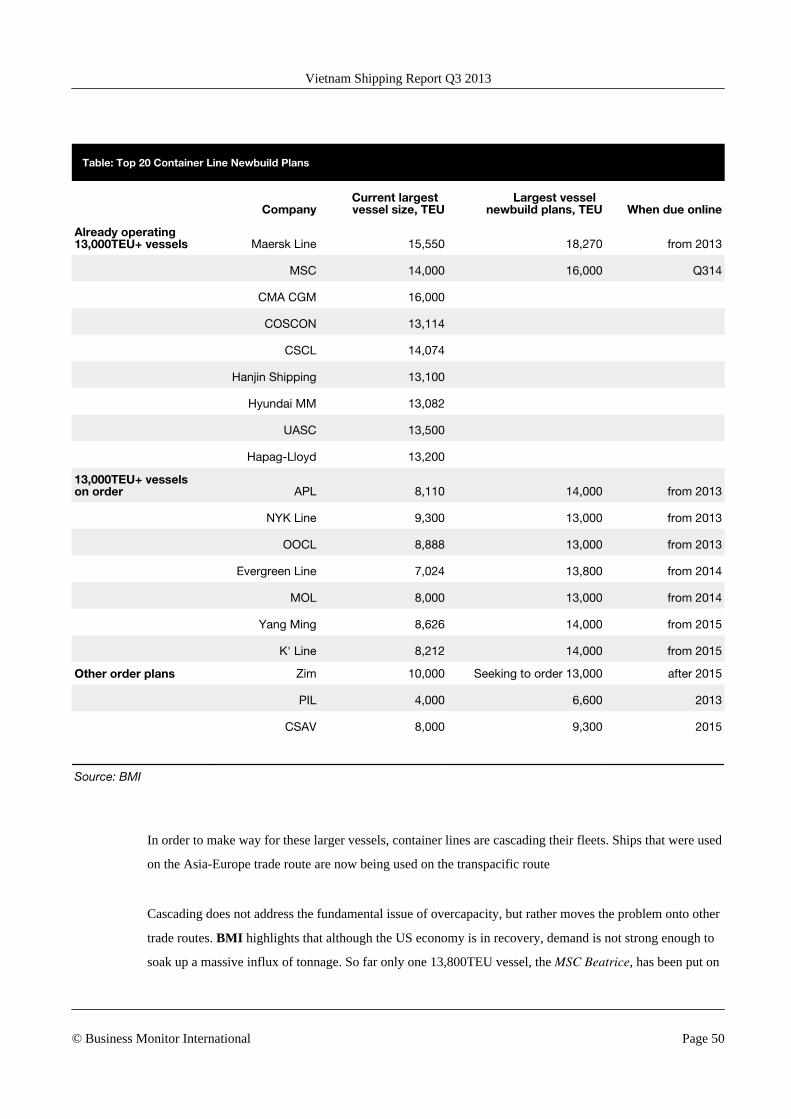
Table: Top 20 Container Line Newbuild Plans
CompanyCurrent largest vessel size, TEU
Largest vessel newbuild plans, TEU When due online
Already operating 13,000TEU+ vessels Maersk Line 15,550 18,270 from 2013
MSC 14,000 16,000 Q314
CMA CGM 16,000
COSCON 13,114
CSCL 14,074
Hanjin Shipping 13,100
Hyundai MM 13,082
UASC 13,500
Hapag-Lloyd 13,200
13,000TEU+ vessels on order APL 8,110 14,000 from 2013
NYK Line 9,300 13,000 from 2013
OOCL 8,888 13,000 from 2013
Evergreen Line 7,024 13,800 from 2014
MOL 8,000 13,000 from 2014
Yang Ming 8,626 14,000 from 2015
K' Line 8,212 14,000 from 2015
Other order plans Zim 10,000 Seeking to order 13,000 after 2015
PIL 4,000 6,600 2013
CSAV 8,000 9,300 2015
Source: BMI
In order to make way for these larger vessels, container lines are cascading their fleets. Ships that were used
on the Asia-Europe trade route are now being used on the transpacific route
Cascading does not address the fundamental issue of overcapacity, but rather moves the problem onto other
trade routes. BMI highlights that although the US economy is in recovery, demand is not strong enough to
soak up a massive influx of tonnage. So far only one 13,800TEU vessel, the MSC Beatrice, has been put on
Vietnam Shipping Report Q3 2013
© Business Monitor International Page 50
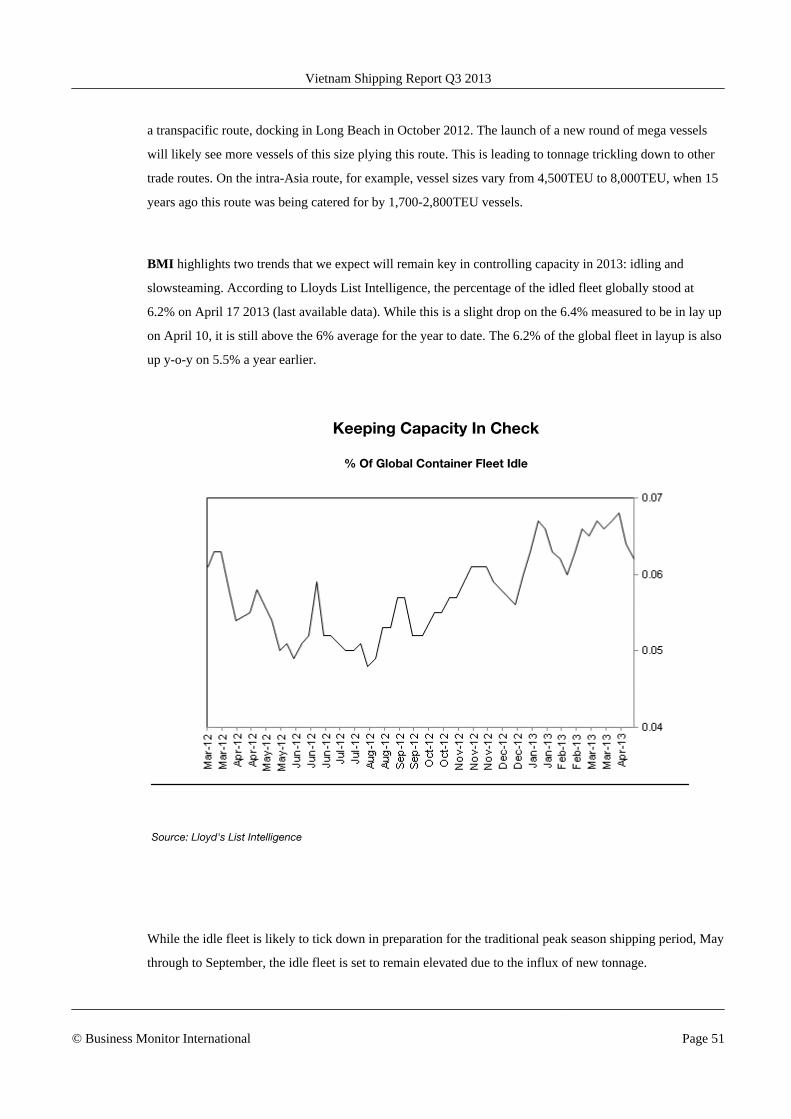
a transpacific route, docking in Long Beach in October 2012. The launch of a new round of mega vessels
will likely see more vessels of this size plying this route. This is leading to tonnage trickling down to other
trade routes. On the intra-Asia route, for example, vessel sizes vary from 4,500TEU to 8,000TEU, when 15
years ago this route was being catered for by 1,700-2,800TEU vessels.
BMI highlights two trends that we expect will remain key in controlling capacity in 2013: idling and
slowsteaming. According to Lloyds List Intelligence, the percentage of the idled fleet globally stood at
6.2% on April 17 2013 (last available data). While this is a slight drop on the 6.4% measured to be in lay up
on April 10, it is still above the 6% average for the year to date. The 6.2% of the global fleet in layup is also
up y-o-y on 5.5% a year earlier.
Keeping Capacity In Check
% Of Global Container Fleet Idle
Source: Lloyd's List Intelligence
While the idle fleet is likely to tick down in preparation for the traditional peak season shipping period, May
through to September, the idle fleet is set to remain elevated due to the influx of new tonnage.
Vietnam Shipping Report Q3 2013
© Business Monitor International Page 51
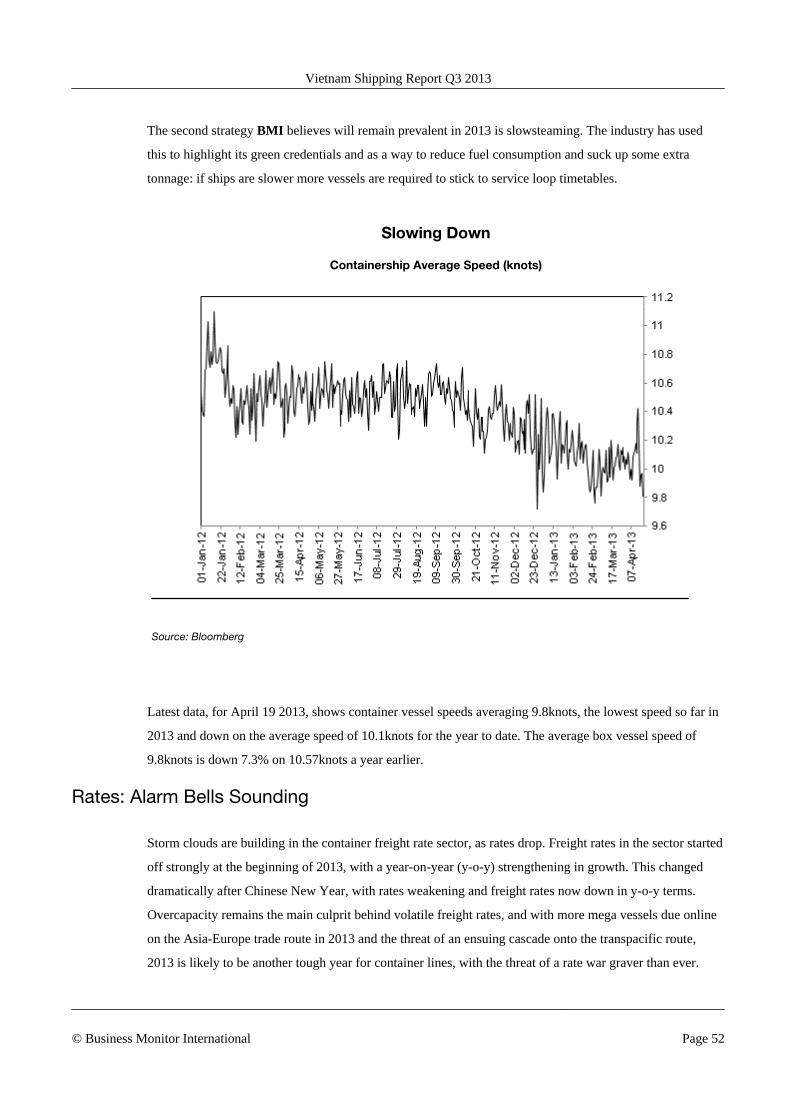
The second strategy BMI believes will remain prevalent in 2013 is slowsteaming. The industry has used
this to highlight its green credentials and as a way to reduce fuel consumption and suck up some extra
tonnage: if ships are slower more vessels are required to stick to service loop timetables.
Slowing Down
Containership Average Speed (knots)
Source: Bloomberg
Latest data, for April 19 2013, shows container vessel speeds averaging 9.8knots, the lowest speed so far in
2013 and down on the average speed of 10.1knots for the year to date. The average box vessel speed of
9.8knots is down 7.3% on 10.57knots a year earlier.
Rates: Alarm Bells Sounding
Storm clouds are building in the container freight rate sector, as rates drop. Freight rates in the sector started
off strongly at the beginning of 2013, with a year-on-year (y-o-y) strengthening in growth. This changed
dramatically after Chinese New Year, with rates weakening and freight rates now down in y-o-y terms.
Overcapacity remains the main culprit behind volatile freight rates, and with more mega vessels due online
on the Asia-Europe trade route in 2013 and the threat of an ensuing cascade onto the transpacific route,
2013 is likely to be another tough year for container lines, with the threat of a rate war graver than ever.
Vietnam Shipping Report Q3 2013
© Business Monitor International Page 52
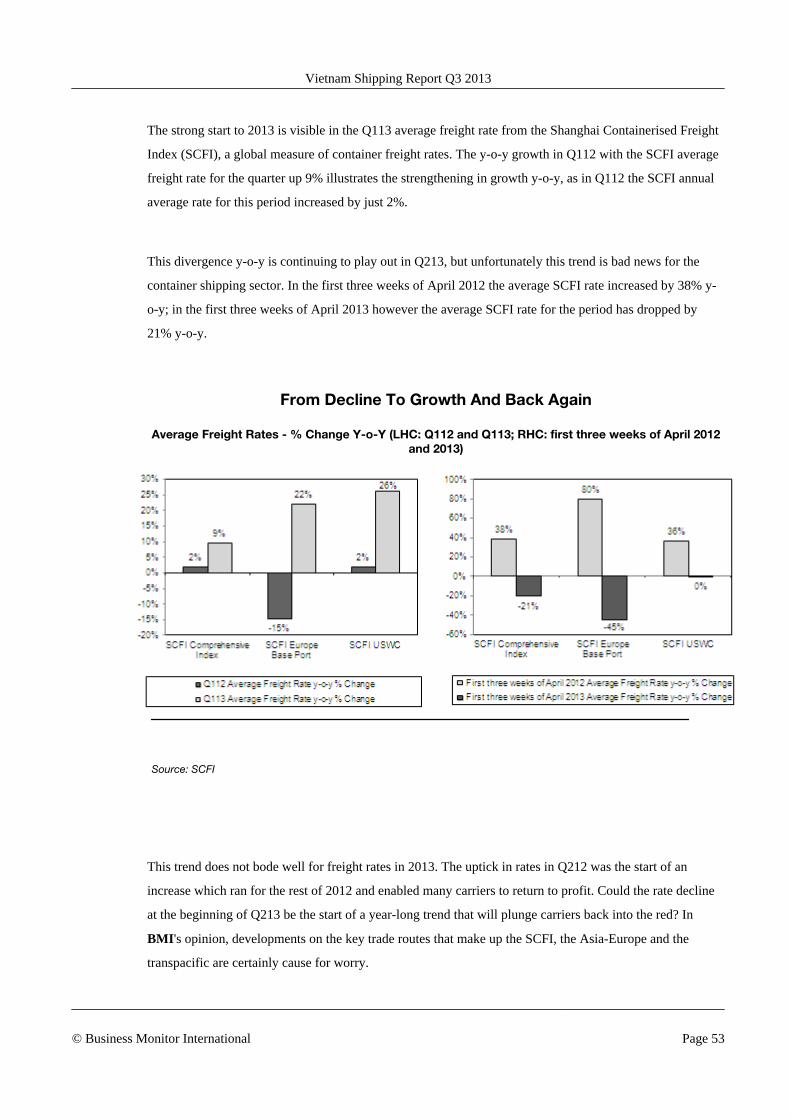
The strong start to 2013 is visible in the Q113 average freight rate from the Shanghai Containerised Freight
Index (SCFI), a global measure of container freight rates. The y-o-y growth in Q112 with the SCFI average
freight rate for the quarter up 9% illustrates the strengthening in growth y-o-y, as in Q112 the SCFI annual
average rate for this period increased by just 2%.
This divergence y-o-y is continuing to play out in Q213, but unfortunately this trend is bad news for the
container shipping sector. In the first three weeks of April 2012 the average SCFI rate increased by 38% y-
o-y; in the first three weeks of April 2013 however the average SCFI rate for the period has dropped by
21% y-o-y.
From Decline To Growth And Back Again
Average Freight Rates - % Change Y-o-Y (LHC: Q112 and Q113; RHC: first three weeks of April 2012and 2013)
Source: SCFI
This trend does not bode well for freight rates in 2013. The uptick in rates in Q212 was the start of an
increase which ran for the rest of 2012 and enabled many carriers to return to profit. Could the rate decline
at the beginning of Q213 be the start of a year-long trend that will plunge carriers back into the red? In
BMI's opinion, developments on the key trade routes that make up the SCFI, the Asia-Europe and the
transpacific are certainly cause for worry.
Vietnam Shipping Report Q3 2013
© Business Monitor International Page 53
Carriers At War On Asia-Europe
Just as the SCFI comprehensive index got off to a flying start, so too did rates on the Asia-Europe trade
route. In Q113 the average freight rate on the Asia-Europe trade route grew by 22%, up on the 15% decline
in the same period in 2012, with the Q113 average increase placing the route third in terms of y-o-y growth
of the 15 routes measured by the SCFI.
However, the start of Q213 marked a dramatic change in fortunes for Asia-Europe rates. The average rate
for the first three weeks of April was down 45% y-o-y, compared to 80% growth a year earlier. At the time
of writing (April 24 213) freight rates on the Asia-Europe route were in their eighth consecutive week of
decline, below US$1,000 per twenty-foot equivalent units (TEU), at US$875 per TEU. BMI highlights a
number of developments since the start of 2013 that give us cause for worry for full-year Asia-Europe
freight rates.
So far in 2013 carriers have only managed to push through one freight increase on the Asia-Europe trade
route. The planned rate push, with carriers seeking to raise rates by US$600-700 per TEU was a partial
success. With rates increasing by US$424 per TEU, 42.4% of the rate increase was achieved.
Vietnam Shipping Report Q3 2013
© Business Monitor International Page 54
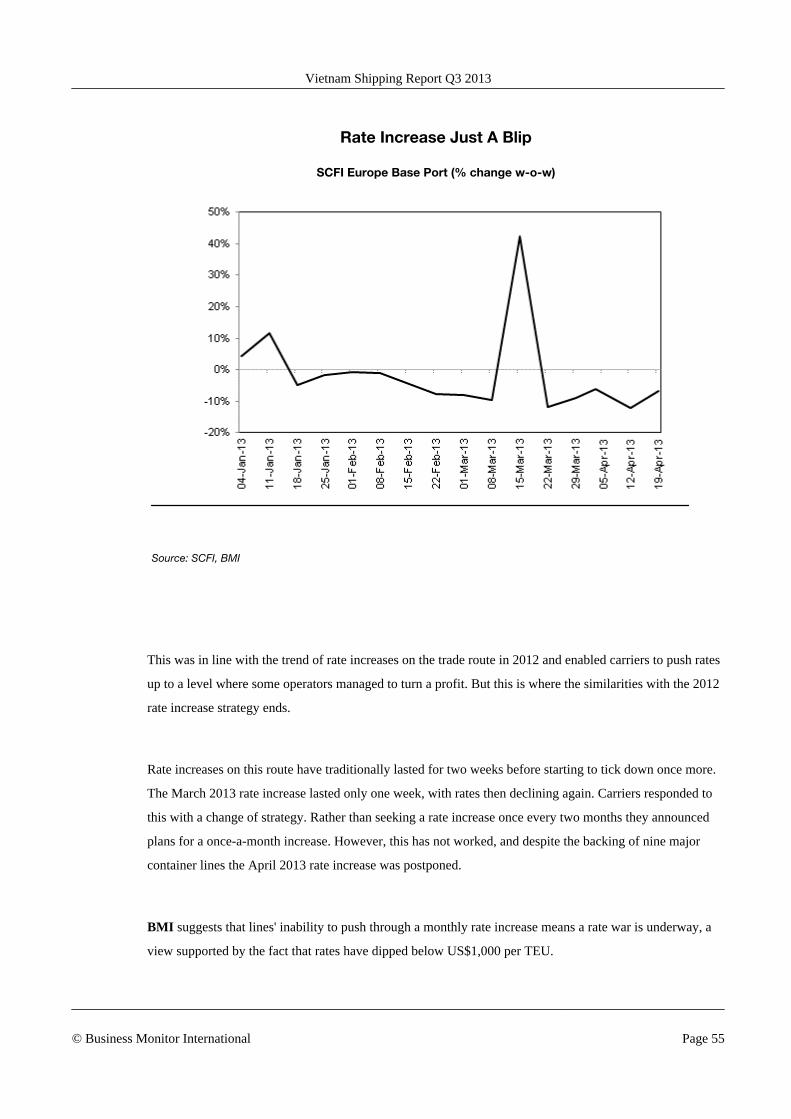
Rate Increase Just A Blip
SCFI Europe Base Port (% change w-o-w)
Source: SCFI, BMI
This was in line with the trend of rate increases on the trade route in 2012 and enabled carriers to push rates
up to a level where some operators managed to turn a profit. But this is where the similarities with the 2012
rate increase strategy ends.
Rate increases on this route have traditionally lasted for two weeks before starting to tick down once more.
The March 2013 rate increase lasted only one week, with rates then declining again. Carriers responded to
this with a change of strategy. Rather than seeking a rate increase once every two months they announced
plans for a once-a-month increase. However, this has not worked, and despite the backing of nine major
container lines the April 2013 rate increase was postponed.
BMI suggests that lines' inability to push through a monthly rate increase means a rate war is underway, a
view supported by the fact that rates have dipped below US$1,000 per TEU.
Vietnam Shipping Report Q3 2013
© Business Monitor International Page 55
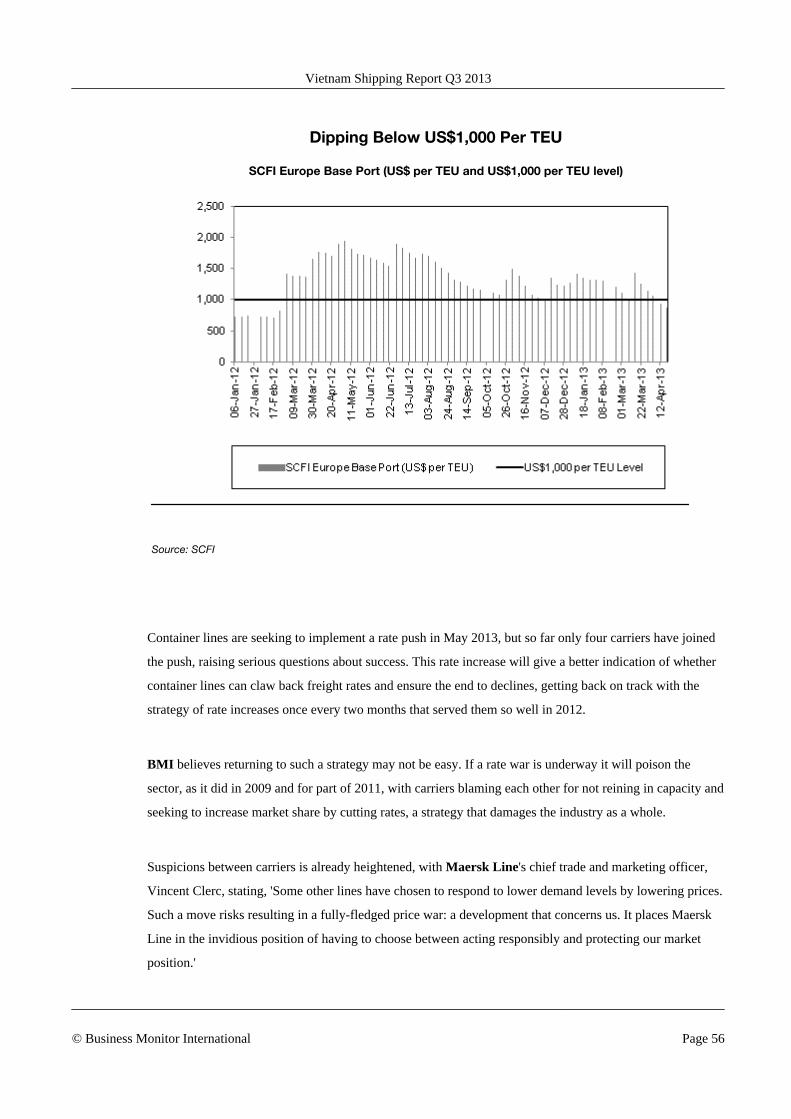
Dipping Below US$1,000 Per TEU
SCFI Europe Base Port (US$ per TEU and US$1,000 per TEU level)
Source: SCFI
Container lines are seeking to implement a rate push in May 2013, but so far only four carriers have joined
the push, raising serious questions about success. This rate increase will give a better indication of whether
container lines can claw back freight rates and ensure the end to declines, getting back on track with the
strategy of rate increases once every two months that served them so well in 2012.
BMI believes returning to such a strategy may not be easy. If a rate war is underway it will poison the
sector, as it did in 2009 and for part of 2011, with carriers blaming each other for not reining in capacity and
seeking to increase market share by cutting rates, a strategy that damages the industry as a whole.
Suspicions between carriers is already heightened, with Maersk Line's chief trade and marketing officer,
Vincent Clerc, stating, 'Some other lines have chosen to respond to lower demand levels by lowering prices.
Such a move risks resulting in a fully-fledged price war: a development that concerns us. It places Maersk
Line in the invidious position of having to choose between acting responsibly and protecting our market
position.'
Vietnam Shipping Report Q3 2013
© Business Monitor International Page 56

Meanwhile, over the past 12 months shippers have become used to carriers' rate increase strategies, and can
prepare for planned rate increases, putting them in a stronger negotiating position with the carriers.
Finally there is the issue of capacity. Rates were always going to face greater pressure in 2013, with the
influx of more tonnage and even larger vessels on the Asia-Europe trade route. The fact that a rate war
appears to have erupted prior to the bulk of this capacity coming online will further damage rate levels for
2013, and with it carriers' bottom lines.
Cascade To Put Pressure On Transpacific Rates
Freight rates on the transpacific have managed to remain afloat for longer, as capacity has not been as big a
problem as on Asia-Europe, and rates on the route have benefited from that fact that the majority of
operators are members of the Transpacific Stabilisation Agreement (TSA) and so are able to speak about
freight rate increases and coordinate them, a facility not available to operators on the Asia-Europe route
since 2008, when the European Commissioned deemed it anti-trust.
The benefits of the ability to speak together and coordinate freight rates is highlighted by the fact that
members of the TSA have managed to push through two freight rate increases in 2013, and that these
increases have been much more successful than the one achieved on the Asia-Europe trade route.
However, despite this, the trend of a strong start to 2013 followed by weakening can also be seen in
transpacific freight rates. In Q113 the average freight rate on the transpacific increased by 26% y-o-y, up
from 2% y-o-y growth in Q112. In the first three weeks of April, however, the average freight rate on the
transpacific did not increase y-o-y, down on 36% growth a year earlier. More worryingly, freight rates on
the route have now dipped in y-o-y terms, falling for two consecutive weeks.
Vietnam Shipping Report Q3 2013
© Business Monitor International Page 57

Going Into Decline
SCFI USWC, January-April 2013 (% change y-o-y)
Source: SCFI, BMI
While TSA operators have more options to control freight rates, we do warn of the impact of cascading on
the route's freight rates in 2013. The influx of new mega tonnage on the Asia-Europe trade route is leading
to a displacement of vessels to the transpacific. The first 13,000TEU ship entered into transpacific service in
2012, with the MSC Beatrice docking at the port of Long Beach in October 2012. More ships in this class
are likely to follow, as carriers look to benefit from the stronger demand outlook emanating from the US
compared to Europe. BMI believes this strategy will transfer the problem of overcapacity and will put
further pressure on transpacific freight rates.
Emerging Trade Routes Offer Promise Of Volume Growth And Profits
While the major trade routes look set for a tough 2013, there will be some success stories. These can be
found in the emerging trade routes (ETRs). While ETRs have been affected by the cascade of vessels, and
are using larger tonnage than previously, demand still outweighs supply and rates are ticking up.
Vietnam Shipping Report Q3 2013
© Business Monitor International Page 58
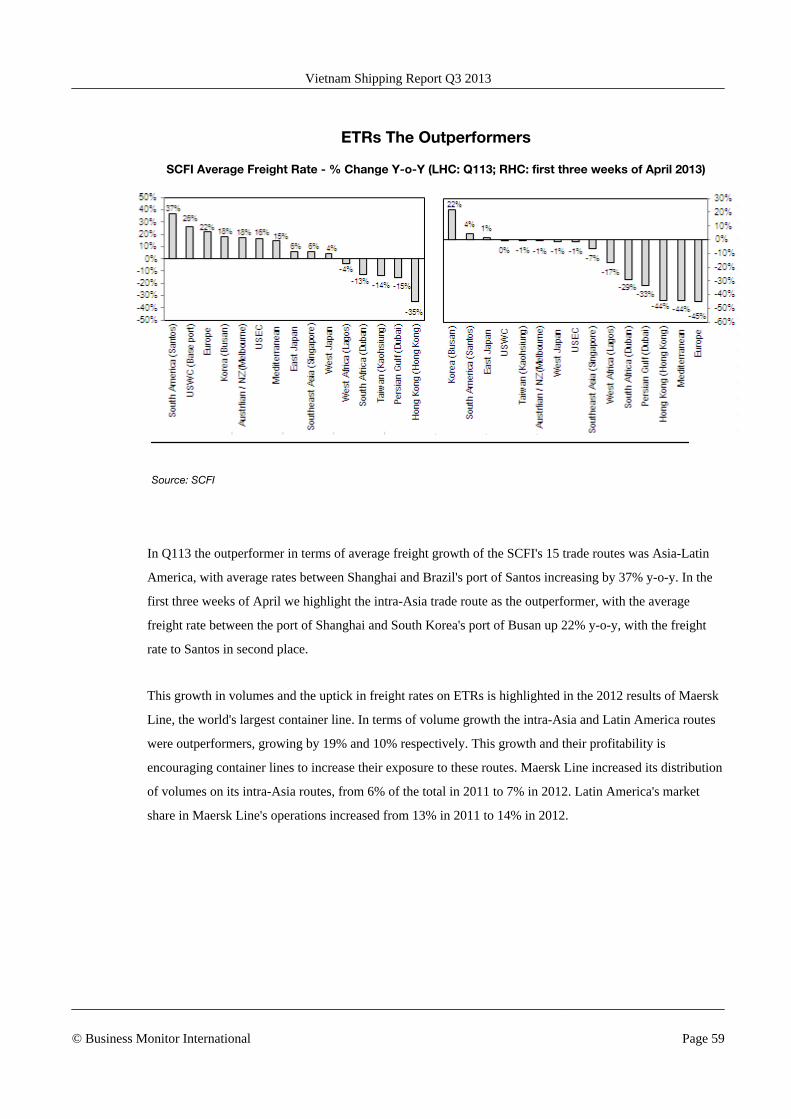
ETRs The Outperformers
SCFI Average Freight Rate - % Change Y-o-Y (LHC: Q113; RHC: first three weeks of April 2013)
Source: SCFI
In Q113 the outperformer in terms of average freight growth of the SCFI's 15 trade routes was Asia-Latin
America, with average rates between Shanghai and Brazil's port of Santos increasing by 37% y-o-y. In the
first three weeks of April we highlight the intra-Asia trade route as the outperformer, with the average
freight rate between the port of Shanghai and South Korea's port of Busan up 22% y-o-y, with the freight
rate to Santos in second place.
This growth in volumes and the uptick in freight rates on ETRs is highlighted in the 2012 results of Maersk
Line, the world's largest container line. In terms of volume growth the intra-Asia and Latin America routes
were outperformers, growing by 19% and 10% respectively. This growth and their profitability is
encouraging container lines to increase their exposure to these routes. Maersk Line increased its distribution
of volumes on its intra-Asia routes, from 6% of the total in 2011 to 7% in 2012. Latin America's market
share in Maersk Line's operations increased from 13% in 2011 to 14% in 2012.
Vietnam Shipping Report Q3 2013
© Business Monitor International Page 59
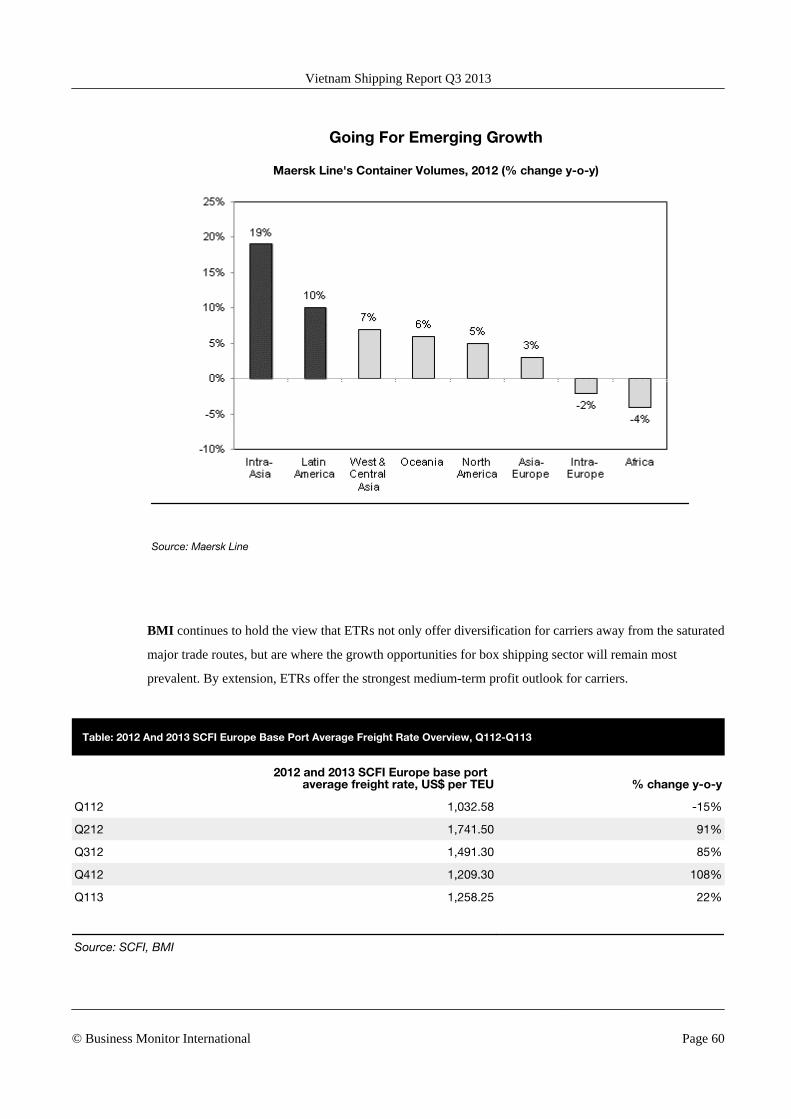
Going For Emerging Growth
Maersk Line's Container Volumes, 2012 (% change y-o-y)
Source: Maersk Line
BMI continues to hold the view that ETRs not only offer diversification for carriers away from the saturated
major trade routes, but are where the growth opportunities for box shipping sector will remain most
prevalent. By extension, ETRs offer the strongest medium-term profit outlook for carriers.
Table: 2012 And 2013 SCFI Europe Base Port Average Freight Rate Overview, Q112-Q113
2012 and 2013 SCFI Europe base port
average freight rate, US$ per TEU % change y-o-y
Q112 1,032.58 -15%
Q212 1,741.50 91%
Q312 1,491.30 85%
Q412 1,209.30 108%
Q113 1,258.25 22%
Source: SCFI, BMI
Vietnam Shipping Report Q3 2013
© Business Monitor International Page 60
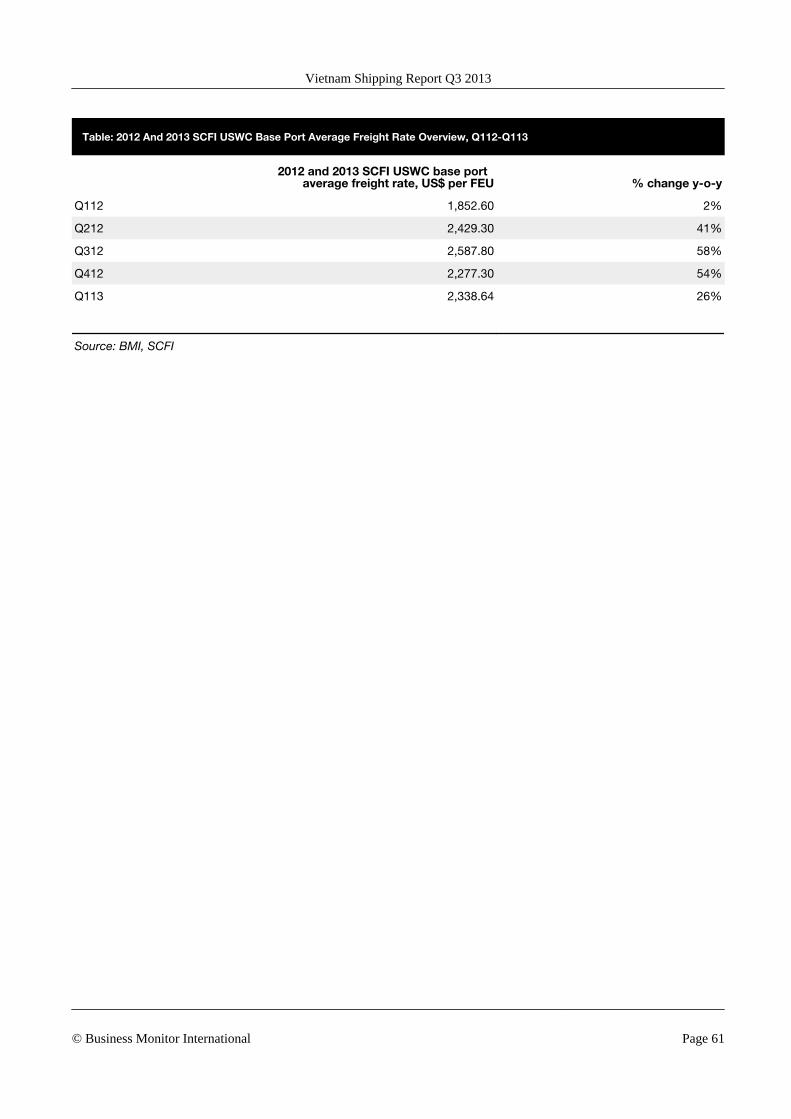
Table: 2012 And 2013 SCFI USWC Base Port Average Freight Rate Overview, Q112-Q113
2012 and 2013 SCFI USWC base port
average freight rate, US$ per FEU % change y-o-y
Q112 1,852.60 2%
Q212 2,429.30 41%
Q312 2,587.80 58%
Q412 2,277.30 54%
Q113 2,338.64 26%
Source: BMI, SCFI
Vietnam Shipping Report Q3 2013
© Business Monitor International Page 61

Global Industry Overview - Dry Bulk Shipping
Demand : Stimulus Benefit Dries Up, Tough Outlook Ahead
The dry bulk shipping sector looks set for a prolonged rough patch, as demand for iron ore in China, the
shipping sector's key cargo and main destination, falls as the impact of China's infrastructure stimulus
package runs its course. There is little to suggest a further bolstering in demand for commodities associated
with China's steel production in 2013, unless the country pulls another stimulus package out of the bag. In
the longer term a slowing in China's economic growth and a diversification in the country's power sector
will be factors that dry bulk shipping firms will need to watch when making fleet capacity decisions.
Stimulus Comes And Goes, Rates Rise And Fall
Dry bulk shipping, specifically the Capesize segment, which transports iron ore to China was the first sector
to feel the positive impact of China's US$158bn infrastructure package, which BMI had forecast would
bolster China's iron ore imports. The Capesize shipping sector benefited from the uptick in demand for iron
ore from Chinese steel mills in Q412, as steel producers ramped up imports in preparation for increased
demand as a result of the infrastructure stimulus.
In early October 2012 Capesize rates went above US$2,000, reaching a high of US$2,587 at the end of the
month and falling back below US$2,000 at the beginning of December 2012. At the time of writing (end of
April 2013) the index was in a nine-day slump, with rates for April 24 at US$1,214, the lowest level of the
year so far, with potential, from the demand side, to dip much lower.
Vietnam Shipping Report Q3 2013
© Business Monitor International Page 62

No Longer Being Stimulated
Baltic Capesize Index (US$)
Source: Bloomberg
The benefit for the dry bulk shipping sector from China's infrastructure plan appears to have ended, with
nothing to fill its place in the short term.
Iron Ore Demand Dips
For BMI, two indicators highlight the threat of an exceptionally tough climate for the dry bulk sector in
2013. Iron ore inventories at Chinese ports are being run down, heading to lows last seen in 2010. The latest
data entry for this index (April 19 2013) marks the fifth consecutive decline, with iron ore port inventories
down 22% year-on-year (y-o-y) and at their lowest level so far in 2013, a level last seen in November 2010.
Low inventories are typically viewed positively by the dry bulk shipping community, as China runs them
down only to build them up again, leading to a rush in demand and a rise in freight rates. However, there is
little to suggest this scenario will play out in the short term, with the ramp up in demand for iron ore to fuel
the steel sector in its preparation for the infrastructure stimulus having come and gone.
Vietnam Shipping Report Q3 2013
© Business Monitor International Page 63
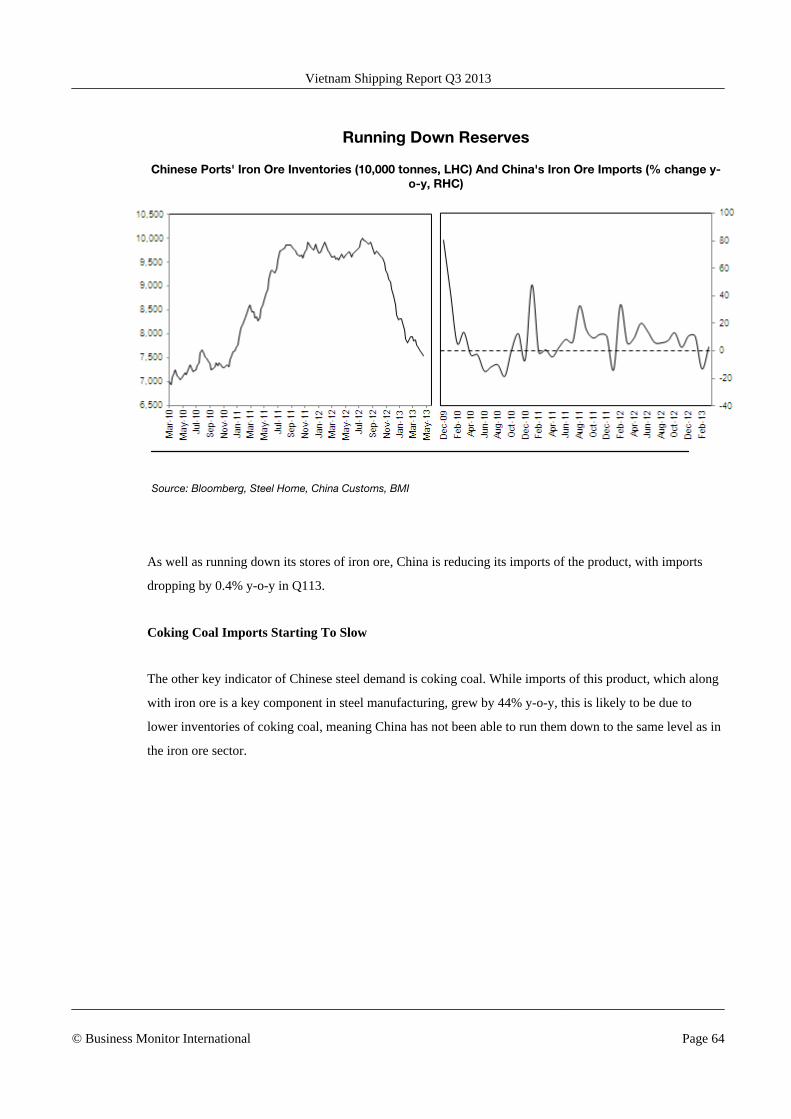
Running Down Reserves
Chinese Ports' Iron Ore Inventories (10,000 tonnes, LHC) And China's Iron Ore Imports (% change y-o-y, RHC)
Source: Bloomberg, Steel Home, China Customs, BMI
As well as running down its stores of iron ore, China is reducing its imports of the product, with imports
dropping by 0.4% y-o-y in Q113.
Coking Coal Imports Starting To Slow
The other key indicator of Chinese steel demand is coking coal. While imports of this product, which along
with iron ore is a key component in steel manufacturing, grew by 44% y-o-y, this is likely to be due to
lower inventories of coking coal, meaning China has not been able to run them down to the same level as in
the iron ore sector.
Vietnam Shipping Report Q3 2013
© Business Monitor International Page 64
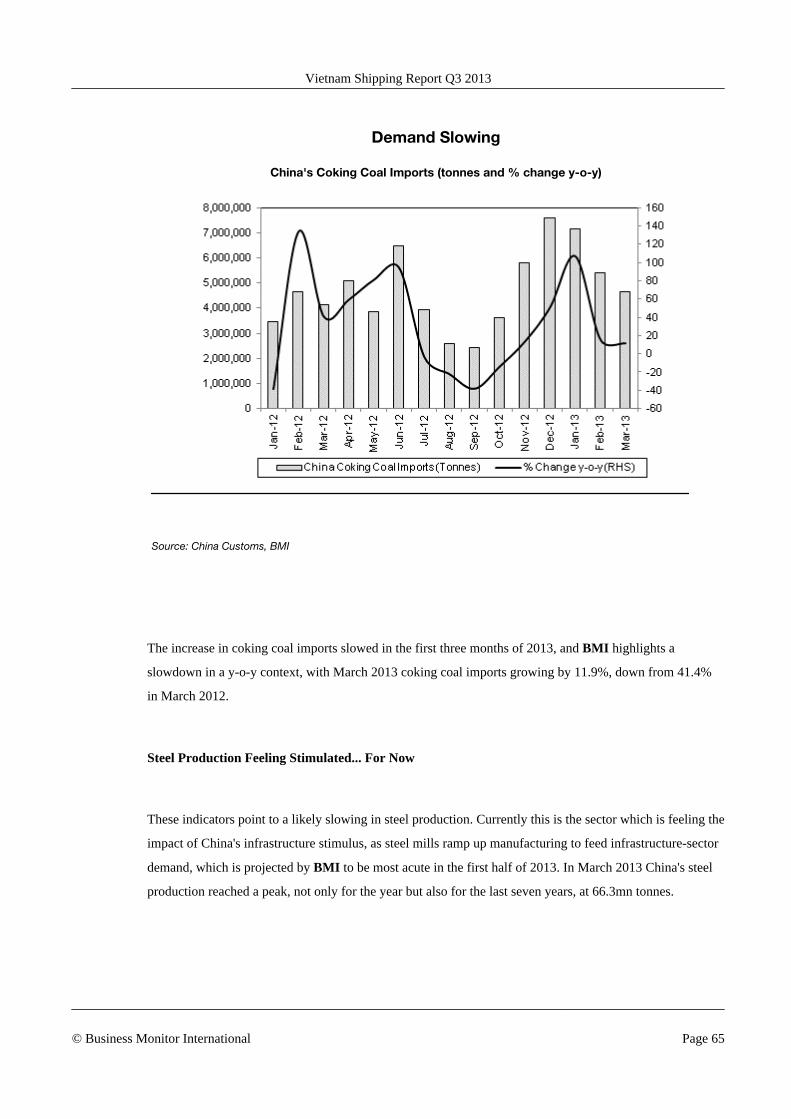
Demand Slowing
China's Coking Coal Imports (tonnes and % change y-o-y)
Source: China Customs, BMI
The increase in coking coal imports slowed in the first three months of 2013, and BMI highlights a
slowdown in a y-o-y context, with March 2013 coking coal imports growing by 11.9%, down from 41.4%
in March 2012.
Steel Production Feeling Stimulated... For Now
These indicators point to a likely slowing in steel production. Currently this is the sector which is feeling the
impact of China's infrastructure stimulus, as steel mills ramp up manufacturing to feed infrastructure-sector
demand, which is projected by BMI to be most acute in the first half of 2013. In March 2013 China's steel
production reached a peak, not only for the year but also for the last seven years, at 66.3mn tonnes.
Vietnam Shipping Report Q3 2013
© Business Monitor International Page 65

Reaching New Highs
China's Industrial Output, Crude Steel (mn tonnes)
Source: Bloomberg
The Chinese construction sector is set to be next in line to benefit from China's infrastructure stimulus
package. BMI projects China's construction industry to expand by 6.4% in 2013, up from estimated growth
of 5% in 2012. While this is a strengthening in y-o-y growth, BMI highlights that China's construction
sector growth is steadily slowing, with growth of just 6% last seen in the early 2000s.
Vietnam Shipping Report Q3 2013
© Business Monitor International Page 66
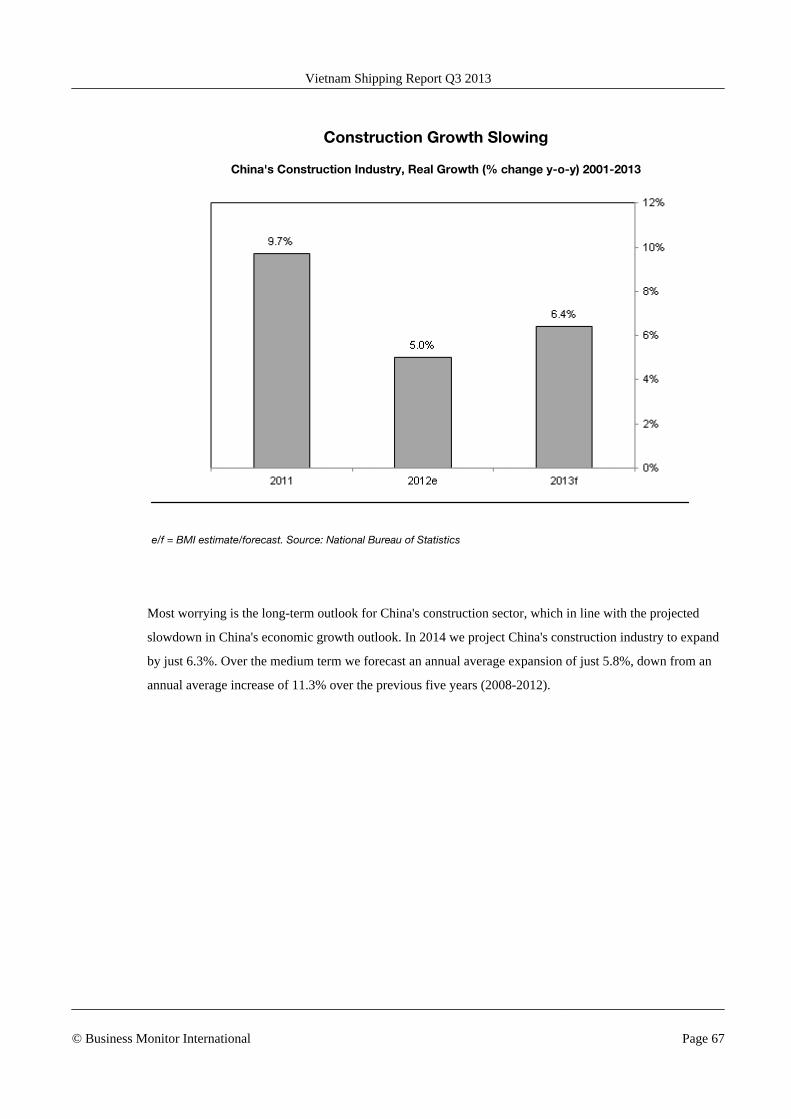
Construction Growth Slowing
China's Construction Industry, Real Growth (% change y-o-y) 2001-2013
e/f = BMI estimate/forecast. Source: National Bureau of Statistics
Most worrying is the long-term outlook for China's construction sector, which in line with the projected
slowdown in China's economic growth outlook. In 2014 we project China's construction industry to expand
by just 6.3%. Over the medium term we forecast an annual average expansion of just 5.8%, down from an
annual average increase of 11.3% over the previous five years (2008-2012).
Vietnam Shipping Report Q3 2013
© Business Monitor International Page 67
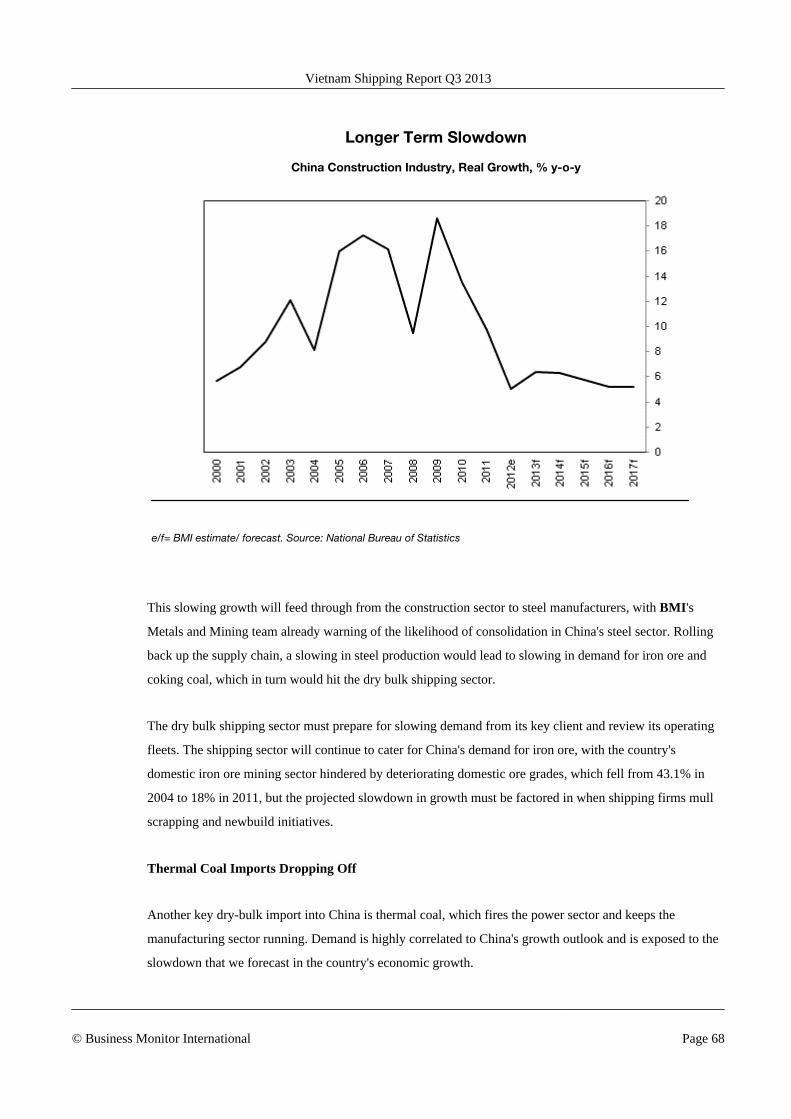
Longer Term Slowdown
China Construction Industry, Real Growth, % y-o-y
e/f= BMI estimate/ forecast. Source: National Bureau of Statistics
This slowing growth will feed through from the construction sector to steel manufacturers, with BMI's
Metals and Mining team already warning of the likelihood of consolidation in China's steel sector. Rolling
back up the supply chain, a slowing in steel production would lead to slowing in demand for iron ore and
coking coal, which in turn would hit the dry bulk shipping sector.
The dry bulk shipping sector must prepare for slowing demand from its key client and review its operating
fleets. The shipping sector will continue to cater for China's demand for iron ore, with the country's
domestic iron ore mining sector hindered by deteriorating domestic ore grades, which fell from 43.1% in
2004 to 18% in 2011, but the projected slowdown in growth must be factored in when shipping firms mull
scrapping and newbuild initiatives.
Thermal Coal Imports Dropping Off
Another key dry-bulk import into China is thermal coal, which fires the power sector and keeps the
manufacturing sector running. Demand is highly correlated to China's growth outlook and is exposed to the
slowdown that we forecast in the country's economic growth.
Vietnam Shipping Report Q3 2013
© Business Monitor International Page 68
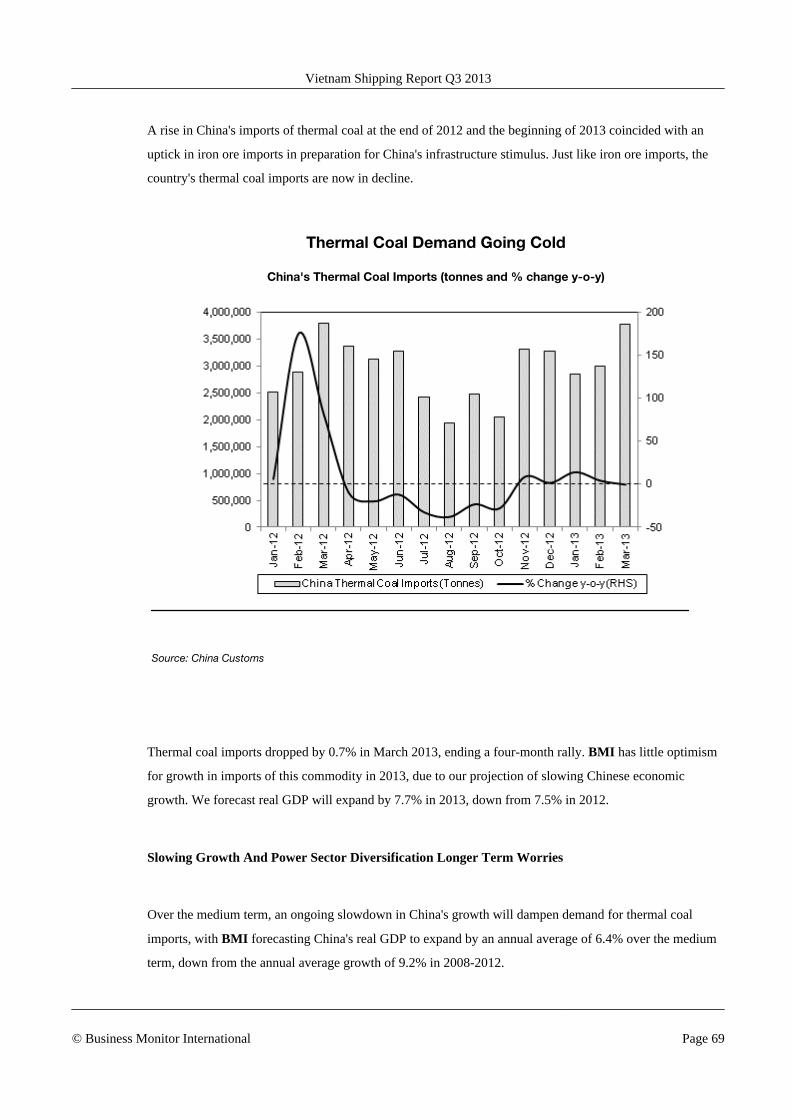
A rise in China's imports of thermal coal at the end of 2012 and the beginning of 2013 coincided with an
uptick in iron ore imports in preparation for China's infrastructure stimulus. Just like iron ore imports, the
country's thermal coal imports are now in decline.
Thermal Coal Demand Going Cold
China's Thermal Coal Imports (tonnes and % change y-o-y)
Source: China Customs
Thermal coal imports dropped by 0.7% in March 2013, ending a four-month rally. BMI has little optimism
for growth in imports of this commodity in 2013, due to our projection of slowing Chinese economic
growth. We forecast real GDP will expand by 7.7% in 2013, down from 7.5% in 2012.
Slowing Growth And Power Sector Diversification Longer Term Worries
Over the medium term, an ongoing slowdown in China's growth will dampen demand for thermal coal
imports, with BMI forecasting China's real GDP to expand by an annual average of 6.4% over the medium
term, down from the annual average growth of 9.2% in 2008-2012.
Vietnam Shipping Report Q3 2013
© Business Monitor International Page 69

Worrying Trend
China's Real GDP Growth (% change y-o-y) And Coal As A % Of China's Total Electricity Generation
e/f = BMI estimate/forecast. Source: National Bureau of Statistics, Energy Information Administration (EIA)
A longer-term trend that will also weaken demand for thermal coal imports is China's diversification away
from coal. Although we project coal to remain the country's key source for electricity production, forecast
by BMI's power team to account for over 70% in both our medium- and long-term (2018-2022) projections,
China is diversifying away from its use of coal.
In 2013 we project coal to account for 76.9% of China's total electricity production. By 2017 we forecast
this to have fallen to 73.5% and by 2022 to account for 71.9% of the country's total electricity production.
This is another area dry bulk ship operators will need to consider when planning fleets and routes.
Vietnam Shipping Report Q3 2013
© Business Monitor International Page 70

Supply: Fleet Expansion Slowing, But Overcapacity Still The Key Worry
On the supply side, dry bulk shipping firms face the same issue as those operating in the container and
tanker shipping sectors: overcapacity. While there appears to be light at the end of the tunnel, with yearly
growth of the dry bulk fleet now slowing and operators seemingly having learnt their lesson by holding off
on placing new orders, the benefit from this will only start to be felt over the medium term and so operators
will once again rely on the twin tactics of slowsteaming and idling in 2013 to manage capacity. The recent
acceptance of a Valemax vessel into a Chinese port once again raises the question of the potential impact of
these mega vessels on the global dry bulk shipping outlook. BMI, however, continues to hold the view that
China welcoming fully loaded Valemax ships into its ports is some way off and the docking of the Vale
Malaysia at Lianyungang port in April 2013, was in fact a hollow victory for Vale.
Deliveries And New Order Demand Slowing
Global growth looks set to start slowing in 2013, with fewer vessels currently under construction. In 2012,
the global dry bulk fleet expanded by 17% up from year-on-year (y-o-y) growth of 16.5% in 2011. This
growth was driven, not only by an increase in vessels coming online, but also by the size of the vessels
increasing, as dry bulk operators embraced the trend of 'bigger is better', as have container ship operators.
According to UNCTADstat in 2011 the global average size for a dry bulk vessel stood at 59,419 dead-
weight tonnes (DWT); in 2012, this increased by 63,420DWT,a y-o-y increase of 6.7%. The key driver
behind this trend has been the uptick in demand from China for iron ore, leading operators to expand their
Capesize fleet, which ship this cargo; but this has also led to the creation of a new class of dry bulk ships,
the Valemax, which boast a capacity of 380,000-400,000DWT.
Vietnam Shipping Report Q3 2013
© Business Monitor International Page 71
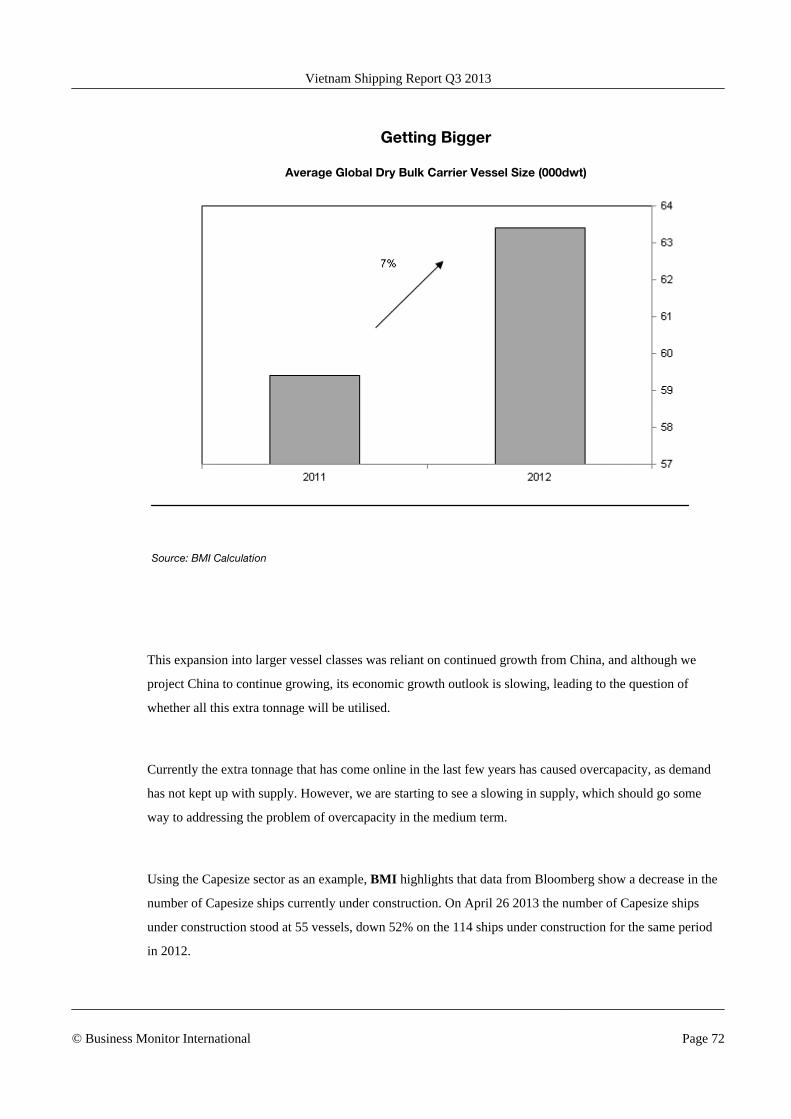
Getting Bigger
Average Global Dry Bulk Carrier Vessel Size (000dwt)
Source: BMI Calculation
This expansion into larger vessel classes was reliant on continued growth from China, and although we
project China to continue growing, its economic growth outlook is slowing, leading to the question of
whether all this extra tonnage will be utilised.
Currently the extra tonnage that has come online in the last few years has caused overcapacity, as demand
has not kept up with supply. However, we are starting to see a slowing in supply, which should go some
way to addressing the problem of overcapacity in the medium term.
Using the Capesize sector as an example, BMI highlights that data from Bloomberg show a decrease in the
number of Capesize ships currently under construction. On April 26 2013 the number of Capesize ships
under construction stood at 55 vessels, down 52% on the 114 ships under construction for the same period
in 2012.
Vietnam Shipping Report Q3 2013
© Business Monitor International Page 72

Light At The End Of The Overcapacity Tunnel
LHC: Capesize Under Construction (no. of vessels). RHC: Capesize On Order (no. of vessels)
Source: Bloomberg
The industry also appears to be learning from its mistakes, moderating its expansion plans, with fewer
newbuild orders being made. According to Bloomberg data, the current total number of Capesizes on order
stands at 120 vessels down 26% on the order book of 162 ships for the same period in 2012. This decrease
in the order book means that the problem of overcapacity in the dry bulk shipping sector is being steadily
addressed.
Lay Up And Slowsteaming Remain Key In The Short Term
BMI believes that dry bulk shipping rates will benefit as supply and demand come into closer equilibrium
over the medium term. As for how operators will tackle the problem now, BMI expects the twin tactics of
slowsteaming and idling to continue to be put to great use in order to manage capacity.
The average speed of Capesize ships has been steadily ticking down, as ship operators aim to burn less fuel,
while at the same time keeping vessels in employment for longer, thereby partially addressing the capacity
issue. On April 29 2013, Capesize vessel's average speed stood at 8.85 knots, down 7% on the 9.56 knots
for the same period in 2012.
Vietnam Shipping Report Q3 2013
© Business Monitor International Page 73

Short-Term Solution Idling
LHC: Capesize Average Speed (knots). RHC: Capesize Number Anchored (no.of vessels)
Source: Bloomberg
Laying up vessels has also been a well-used tactic to combat overcapacity and looks set to be rolled out
even further in 2013. For example on April 29 2013, the number of ships currently at anchor (an indication
of how many ships are idle) had reached 302 vessels, up 4.9% on the 288 Capesize vessels at anchor in the
same period in 2012.
Valemax A Hollow Threat?
The major short-term threat to overcapacity is the Valemax vessels. The ships were created with an eye to
making Brazilian iron ore exports into China more competitive. Currently Australia dominates China's iron
ore imports, with the country's miners benefiting from the relatively short shipping journey from Australia's
main iron ore port of Hedland to China's key iron ore port of Qingdao, a distance of 3,462 nautical miles
(nm). Brazil is China's second-largest iron ore partner, but with a distance of 11,075 between Brazil's main
iron ore port of Tubarao to the port of Qingdao the extra time and by extension extra cost, put Brazilian iron
ore miners at a disadvantage to their Australian counterparts.
That was until Brazil's Vale created the Valemax, the largest iron ore carrier afloat, with the rationale that
economies of scale would place the Brazilian iron ore miner on a more equal footing with mining firms in
Australia. The problem that has arisen in Vale's Valemax strategy, is that despite some of these vessels
Vietnam Shipping Report Q3 2013
© Business Monitor International Page 74

being constructed in China, only two have been permitted to dock at Chinese ports, with suggestions that
the Chinese Shipowners Association has been lobbying the government to place a ban on this ships owing
to fears surrounding how the Valemax vessels will impact Chinese dry bulk vessel operators.
Table: Dry Bulk Vessel Class Overview
Vessel Class Dead Weight Tonnes (DWT)
Very Large Ore Carriers (VLOC) 200,000 plus
Capesize 110,000-190,000
Post-Panamax 80,000-109,999
Panamax 60,000-79,999
Handymax/ Supramax 40,000-59,999
Handysize 0-39,999
Source: BMI Research
BMI believes that there is still a long way to go before Valemax vessels are accepted into Chinese ports,
although we note that Chinese ports are preparing for Valemax class vessels, with the Qingdao Port
Group having launched a new iron ore terminal at Dongjiakou port in March 2013, which has the technical
capacity to receive Valemax ships.
While the acceptance of the Vale Malaysia into the Chinese port of Lianyungang in April 2013 - the first
Valemax to pull into China following the ban on vessels of the Valemax class - at first glance appeared to
show a mellowing in their strategy towards this vessel class, BMI believes it was in fact a hollow victory
for the Brazilian miner.
The whole point of the Valemax strategy is that, with 400,000DWT capacity, the ships would use
economies of scale by shipping greater volumes of iron ore in one go, thereby saving on multiple trips by
multiple vessels. The reason the Vale Malaysia was permitted to dock in the port of Lianyungang is that it
was loaded with 220,000 tonnes of iron ore, thereby allowing it to circumvent China's ban on the
400,000DWT capacity ships; with just 220,000 tonnes of iron ore in the hull, however, the Valemax ship
was only offering a capacity slightly bigger than a traditional Capesize vessel, a class that boasts capacity of
up to 199,000DWT.
Vietnam Shipping Report Q3 2013
© Business Monitor International Page 75
Global Industry Overview - Liquid Bulk Shipping
Baltic Dirty Tanker Index Under Pressure
BMI is not optimistic for the global crude oil shipping sector in 2013. While the orderbook is hugely
reduced from the levels reached in 2008, the growth in the global fleet is still greater than we expect
demand for seaborne oil to be. The Baltic Dirty Tanker Index (BDTI) continues to sink lower, and we do
not foresee any convincing resurgence in its levels before the end of the year, as the global economic
recovery is still sluggish. Furthermore, tanker operators must begin preparing for the greater threat
presented by the shale revolution in the US, which could effectively remove what has been the world's
largest importer of oil from many tanker operators' ports of call.
Index Keeps Falling
The BDTI, made up of a number of global crude oil shipping routes for a variety of different vessel classes,
had its second consecutive week of declines in the period ended April 18 2013. The index fell from 674 to
634, a drop of 5.9%. This fall was even steeper than the previous week's, 4.7%, and reflects our outlook in
that the dirty tanker sector will underperform in relation to its clean counterpart in 2013. The clean index
saw a lesser decline, of 1.1%, in the period ended April 18. The outlook for product-tanker operators is
brightening, as tonne-miles are increasing, and the fleet has not suffered from over-ordering to quite the
same degree as the crude oil tanker fleet to date, although orders are now rising.
The BDTI is 14.9% down from the 745 it stood at a year earlier, and if we look further back the decline is
even more apparent. In mid 2008 the index was over 2,000. From the 2,086 recorded on June 24 2008, the
index has fallen 69.6%. The expected amelioration in the global supply and demand imbalance has failed to
happen, with the index declining towards lows last seen in August 2012.
It is perhaps no coincidence that the 2012 lows coincided with negative earnings for very large crude carrier
(VLCC) operators on the benchmark Middle East Gulf to Asia route. These operators are once again
enduring negative returns. This trend is examined in greater detail in our piece on the VLCC sector (VLCC
Operators Under Pressure, April 23 2013), but it is important to note that the wider crude oil shipping
sector is in large part driven by what is happening to these supertankers.
Vietnam Shipping Report Q3 2013
© Business Monitor International Page 76
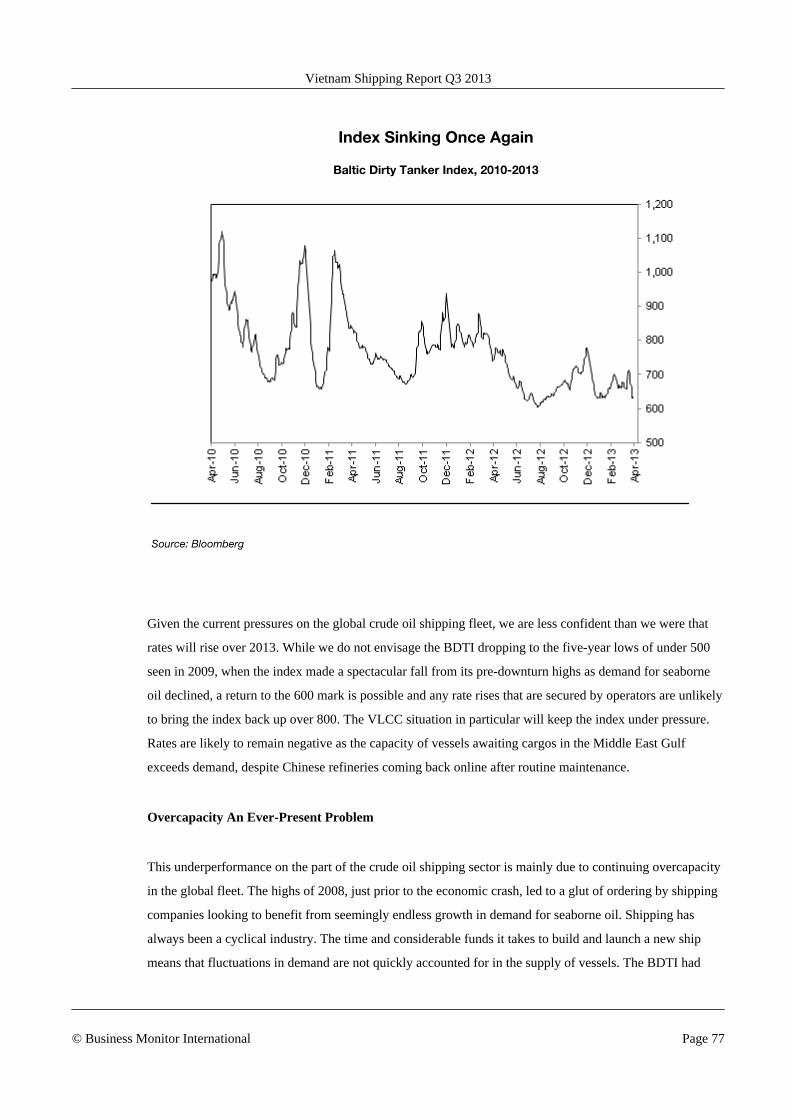
Index Sinking Once Again
Baltic Dirty Tanker Index, 2010-2013
Source: Bloomberg
Given the current pressures on the global crude oil shipping fleet, we are less confident than we were that
rates will rise over 2013. While we do not envisage the BDTI dropping to the five-year lows of under 500
seen in 2009, when the index made a spectacular fall from its pre-downturn highs as demand for seaborne
oil declined, a return to the 600 mark is possible and any rate rises that are secured by operators are unlikely
to bring the index back up over 800. The VLCC situation in particular will keep the index under pressure.
Rates are likely to remain negative as the capacity of vessels awaiting cargos in the Middle East Gulf
exceeds demand, despite Chinese refineries coming back online after routine maintenance.
Overcapacity An Ever-Present Problem
This underperformance on the part of the crude oil shipping sector is mainly due to continuing overcapacity
in the global fleet. The highs of 2008, just prior to the economic crash, led to a glut of ordering by shipping
companies looking to benefit from seemingly endless growth in demand for seaborne oil. Shipping has
always been a cyclical industry. The time and considerable funds it takes to build and launch a new ship
means that fluctuations in demand are not quickly accounted for in the supply of vessels. The BDTI had
Vietnam Shipping Report Q3 2013
© Business Monitor International Page 77
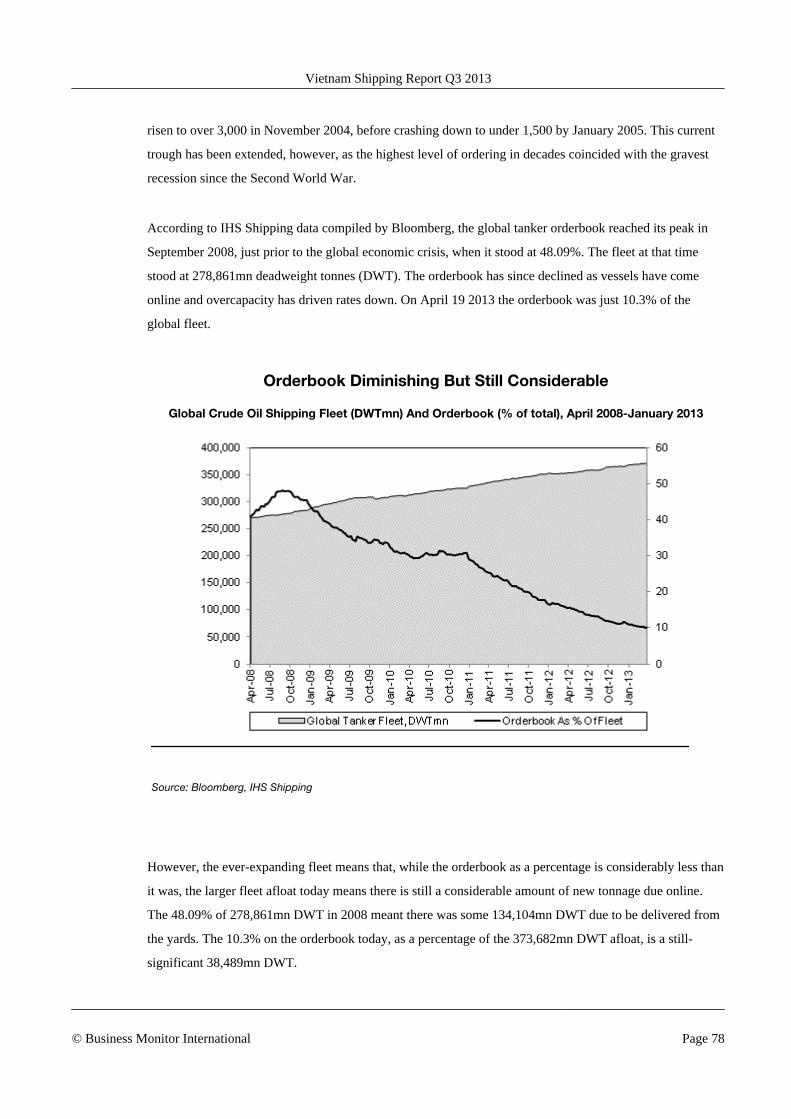
risen to over 3,000 in November 2004, before crashing down to under 1,500 by January 2005. This current
trough has been extended, however, as the highest level of ordering in decades coincided with the gravest
recession since the Second World War.
According to IHS Shipping data compiled by Bloomberg, the global tanker orderbook reached its peak in
September 2008, just prior to the global economic crisis, when it stood at 48.09%. The fleet at that time
stood at 278,861mn deadweight tonnes (DWT). The orderbook has since declined as vessels have come
online and overcapacity has driven rates down. On April 19 2013 the orderbook was just 10.3% of the
global fleet.
Orderbook Diminishing But Still Considerable
Global Crude Oil Shipping Fleet (DWTmn) And Orderbook (% of total), April 2008-January 2013
Source: Bloomberg, IHS Shipping
However, the ever-expanding fleet means that, while the orderbook as a percentage is considerably less than
it was, the larger fleet afloat today means there is still a considerable amount of new tonnage due online.
The 48.09% of 278,861mn DWT in 2008 meant there was some 134,104mn DWT due to be delivered from
the yards. The 10.3% on the orderbook today, as a percentage of the 373,682mn DWT afloat, is a still-
significant 38,489mn DWT.
Vietnam Shipping Report Q3 2013
© Business Monitor International Page 78

While scrapping goes some way to tempering the effects of the orderbook, the global tanker fleet continues
to expand, exacerbating the overcapacity crisis, given the not-as-yet realised rebound of the global
economy. Following years of excess fleet growth, tanker operators have fewer old vessels to scrap to bring
the imbalance into line. One alternative that has been used is idling. Maersk Tankers has idled two of its
VLCCs operating in the Nova Tankers pool, for example. With the fleet continuing to grow, BMI expects
more idling as operators become reluctant to scrap perfectly serviceable vessels, instead holding out in the
expectation of an improvement in the fleet imbalance. The container shipping sector is also engaging in
idling as a way to cope with overcapacity.
Demand Insufficient To Absorb Fleet Growth
The growth in the fleet would not be such a concern if there were a commensurate rise in demand for
seaborne oil. However, the global economy's recovery from the 2008/2009 global financial crisis has been
faltering at best. The eurozone re-entered recession in 2012, according to BMI's estimates, and in 2013 we
forecast another year of contraction, at 0.1%. The recovery in the world's largest economy, the US, has been
sluggish, and growth in China, the world's second-largest economy, has dipped below the magic 8% as its
key export markets have struggled to keep up demand. In 2013 we forecast real GDP growth of 2.1% and
7.5% respectively in these two economic giants.
Vietnam Shipping Report Q3 2013
© Business Monitor International Page 79

Struggling Global Economy
US, China And Eurozone Real GDP Growth, 2008-2017 (% change y-o-y)
US Real GDP growth, % change y-o-yChina Real GDP growth, % change y-o-yEurozone Real GDP growth, % change y-o-y
2008
2009
2010
2011
2012
2013
f
2014
f
2015
f
2016
f
2017
f
0
10
f = BMI forecast. 2012 figure is an estimate for US and eurozone. Eurozone is an aggregate of the 17 members:
Austria, Belgium, Cyprus, Estonia, Finland, France, Germany, Greece, Ireland, Italy, Luxembourg, Malta, the
Netherlands, Portugal, Slovakia, Slovenia, Spain. Source: Bureau of Economic Analysis, National Bureau of
Statistics, Eurostat
In 2013 our Oil and Gas team forecasts that growth in global oil demand will be 1.8%. Africa and Latin
America will register the highest growth in consumption, at 3.3% and 3.2% respectively, with Western
Europe and North America lagging behind at 0.0% and 0.4% respectively. This does not bode well for
tanker operators, with distances between the key exporters of the Middle East Gulf and Europe and North
America doing much to support the tonne-km sailed by the global tanker fleet.
With the US's development of its own shale oil supplies, its demand for imports of seaborne oil will
continue to decline, presenting a very real risk to tanker operators. Journeys from the Middle East Gulf to
China are some 12,000km longer than those from the Middle East Gulf to the US Gulf.
The result of this is that tanker operators need to worry not only about the short-to-medium term, as the
decline in rates continues to batter their bottom lines and balances and jeopardise their lines of credit, but
must ensure that they adapt to the new trade environment created by the shale revolution in the US.
Vietnam Shipping Report Q3 2013
© Business Monitor International Page 80

VLCCs Outlook
BMI believes that the Q1 results of companies operating very large crude carriers (VLCCs) on the spot
market will be disappointing, given the fact that vessels operating on the supertankers' benchmark route
generated negative returns for much of the first quarter, and were still doing so at the time of writing in mid-
April.
VLCCs remain the vessel class that continues to suffer the most in terms of falling rates and overcapacity.
Along with Capesize vessels in the dry bulk shipping fleet, these supertankers, capable of carrying 2mn
barrels of crude, reflect the exuberance of the global shipping industry in the years just prior to the global
economic crisis, when rising demand, in particular from China, saw daily returns for the vessels top US
$200,000.
The boom times led to a glut of ordering, and the global VLCC fleet has grown from 432 in April 2008 to
the 589 today. However, demand growth stalled during the economic crisis, and while it has increased again
over the past few years, it has not been sufficient to iron out the discrepancies. This issue faces most of
global shipping: dry bulk and container shipping companies have been similarly affected. Furthermore,
supertanker operators continue to place orders at shipping yards, taking advantage of lower prices as
shipyards have looked to maintain their own businesses in the face of falling demand. The orderbook as a
percentage of the global VLCC fleet has come down, from 47% in 2008 to the current 6.6%, yet capacity is
still growing more rapidly than demand.
Vietnam Shipping Report Q3 2013
© Business Monitor International Page 81
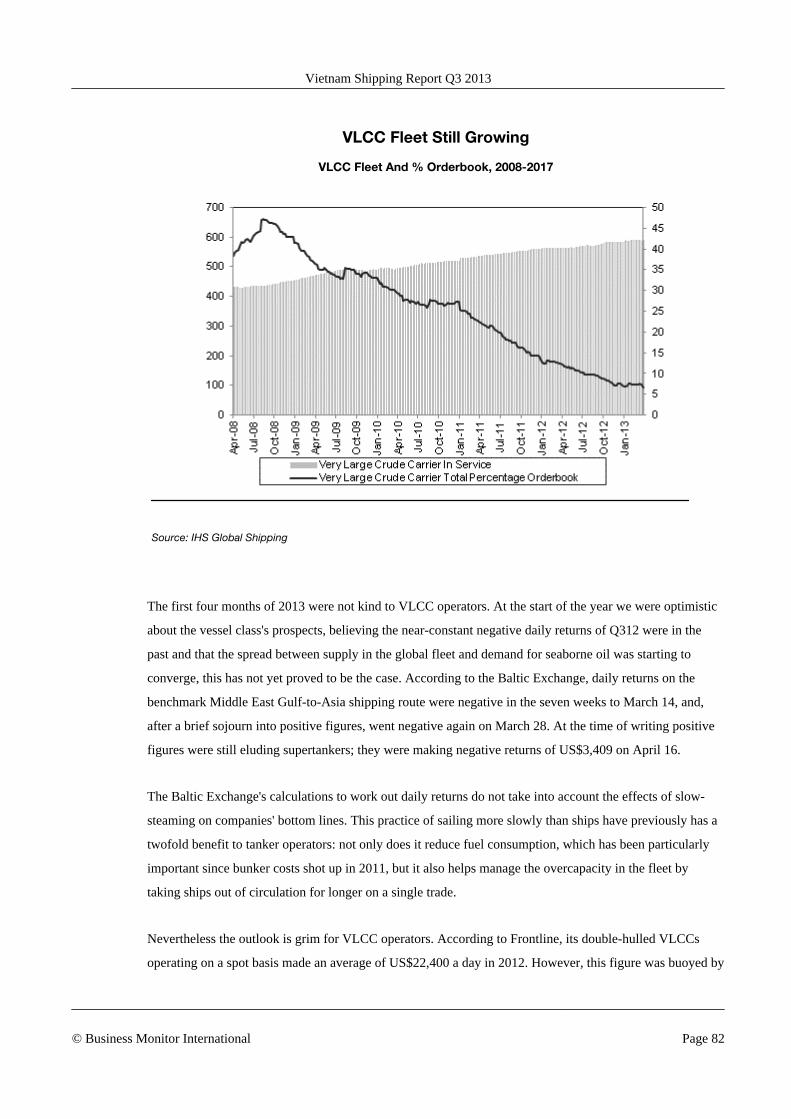
VLCC Fleet Still Growing
VLCC Fleet And % Orderbook, 2008-2017
Source: IHS Global Shipping
The first four months of 2013 were not kind to VLCC operators. At the start of the year we were optimistic
about the vessel class's prospects, believing the near-constant negative daily returns of Q312 were in the
past and that the spread between supply in the global fleet and demand for seaborne oil was starting to
converge, this has not yet proved to be the case. According to the Baltic Exchange, daily returns on the
benchmark Middle East Gulf-to-Asia shipping route were negative in the seven weeks to March 14, and,
after a brief sojourn into positive figures, went negative again on March 28. At the time of writing positive
figures were still eluding supertankers; they were making negative returns of US$3,409 on April 16.
The Baltic Exchange's calculations to work out daily returns do not take into account the effects of slow-
steaming on companies' bottom lines. This practice of sailing more slowly than ships have previously has a
twofold benefit to tanker operators: not only does it reduce fuel consumption, which has been particularly
important since bunker costs shot up in 2011, but it also helps manage the overcapacity in the fleet by
taking ships out of circulation for longer on a single trade.
Nevertheless the outlook is grim for VLCC operators. According to Frontline, its double-hulled VLCCs
operating on a spot basis made an average of US$22,400 a day in 2012. However, this figure was buoyed by
Vietnam Shipping Report Q3 2013
© Business Monitor International Page 82

a relatively strong first half. In Q3, with spot rates on the benchmark route were negative for much of the
period, Frontline's chartered supertankers made just US$13,300 a day. By mid-April around 10 weeks of the
first four months of 2013 had already been in negative figures.
In its Q412 results, Frontline gives its VLCC cash cost breakeven rates for 2013 as US$24,200, a figure we
do not believe will have been achieved through the first quarter, and so the company will likely be reporting
another quarter of losses. It should be borne in mind that Frontline's breakeven figure was reduced
considerably by a company restructuring in 2012. President John Fredriksen, through his personal
investment in Hemen Holdings, took on much of the company's debt and newbuild obligations in a new
company, Frontline 2012. Other VLCC operators exposed to the spot market will be even worse off than
Frontline if they have significant debt obligations to meet.
With the first three weeks of Q2 having generated negative returns, the outlook for Q2 is not much better
than for Q1. A Bloomberg survey on April 17 gave the median consensus estimate that there were 20%
more VLCCs available to hire over the following 30 days than there were likely to be cargoes, meaning the
situation is unlikely to improve for VLCC operators anytime soon. Nor does the 2013 outlook as a whole
look especially bright. Clarkson, the largest shipbroker in the world, forecasts that global VLCC carrying
capacity will rise by 5.1% for the year, compared to its forecast demand growth of 4.9%. The imbalance
should not widen too much further in 2013, but it is still far from narrowing.
Bloomber Tanker Index story
BMI does not believe that the Bloomberg Tanker Index is the indicator for the fortunes of dirty tanker
operating companies that it once was. From a formerly fairly even split between six liquid-bulk tanker
operators listed on the New York Stock Exchange (NYSE), the bulk of which were heavily involved in
crude oil shipping, over three quarters of the index's weighting now comes from Teekay Corp, a company
that is increasingly reliant on offshore and LNG shipping for its profits. With one former member already
delisted, and two having declared themselves bankrupt, this dynamic is likely to continue. Despite our
slightly more sanguine outlook for crude oil shipping in 2013, we do not believe that the index will see any
significant resurgence over the coming year.
The dirty tanker market continues to suffer in 2013. The sector, just like container shipping and dry bulk
shipping, is afflicted by a glut of ships which have come online having been ordered prior to the downturn.
The growth of the global fleet has far outweighed growth in demand for seaborne oil in the years since;
rates have been continuously pushed lower. The Baltic Dirty Tanker Index (BDTI), made up of a number of
Vietnam Shipping Report Q3 2013
© Business Monitor International Page 83

global crude oil shipping routes for a variety of different vessel classes, stood at 658 on February 19, a far
cry from its five-year peak of 2,347, recorded in July 2008.
Far From Five-Year Highs
Baltic Dirty Tanker Index, 2008-2013
Source: Bottom
The vessel class perhaps most affected by the overcapacity curse has been very large crude carriers
(VLCCs), the supertankers capable of carrying as much as 2mn barrels of crude. These vessels earned daily
returns in excess of US$200,000 in the pre-downturn boon years, yet are currently struggling to break even.
The VLCCs operating on the class's benchmark Saudi Arabia to Japan route endured almost constant
negative returns in the third quarter of last year, and with the recent drop in production by OPEC member
states, the situation is once again dire. Chartering vessels from the Middle East Gulf has all but collapsed,
with the benchmark route generating daily losses of around US$6,500 in the past week; the journey to the
Gulf of Mexico has been generating even greater losses of over US$30,000, according to the Baltic
Exchange.
Our outlook for crude oil shipping is more sanguine than it was in 2012; the global economy is picking up,
with BMI forecasting a return to growth in the eurozone, and growth of 2.3% and 7.5% in the US and
Vietnam Shipping Report Q3 2013
© Business Monitor International Page 84
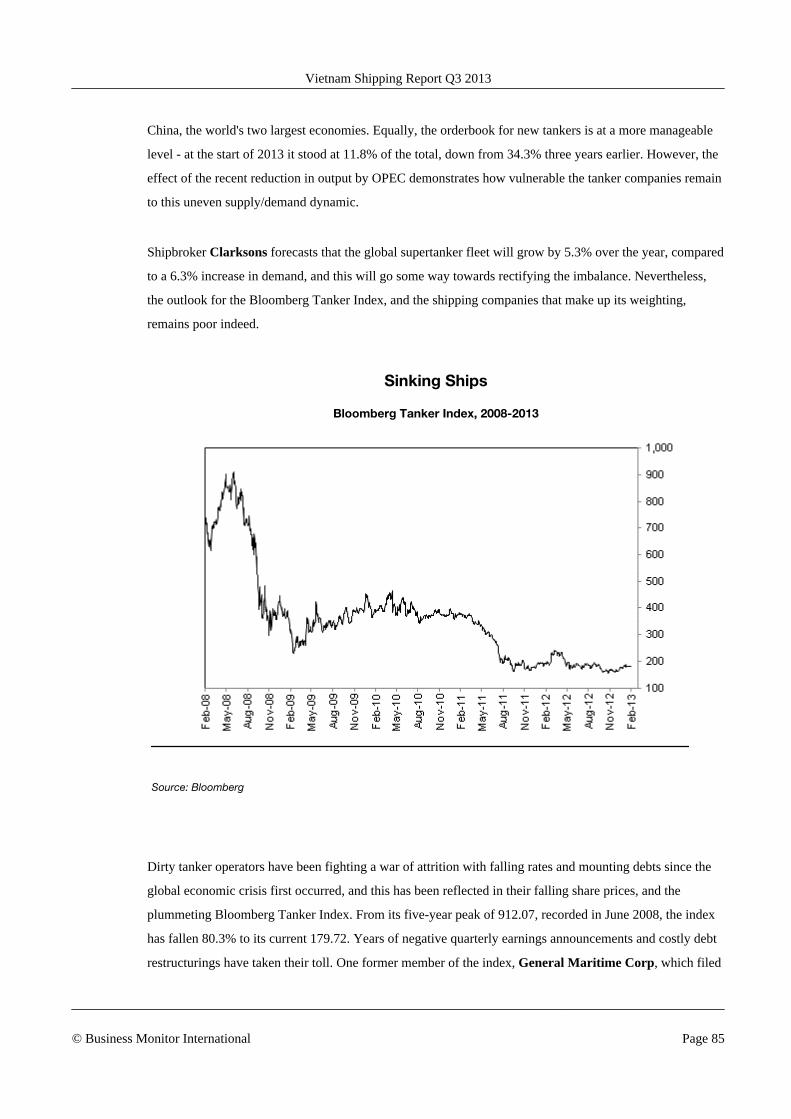
China, the world's two largest economies. Equally, the orderbook for new tankers is at a more manageable
level - at the start of 2013 it stood at 11.8% of the total, down from 34.3% three years earlier. However, the
effect of the recent reduction in output by OPEC demonstrates how vulnerable the tanker companies remain
to this uneven supply/demand dynamic.
Shipbroker Clarksons forecasts that the global supertanker fleet will grow by 5.3% over the year, compared
to a 6.3% increase in demand, and this will go some way towards rectifying the imbalance. Nevertheless,
the outlook for the Bloomberg Tanker Index, and the shipping companies that make up its weighting,
remains poor indeed.
Sinking Ships
Bloomberg Tanker Index, 2008-2013
Source: Bloomberg
Dirty tanker operators have been fighting a war of attrition with falling rates and mounting debts since the
global economic crisis first occurred, and this has been reflected in their falling share prices, and the
plummeting Bloomberg Tanker Index. From its five-year peak of 912.07, recorded in June 2008, the index
has fallen 80.3% to its current 179.72. Years of negative quarterly earnings announcements and costly debt
restructurings have taken their toll. One former member of the index, General Maritime Corp, which filed
Vietnam Shipping Report Q3 2013
© Business Monitor International Page 85
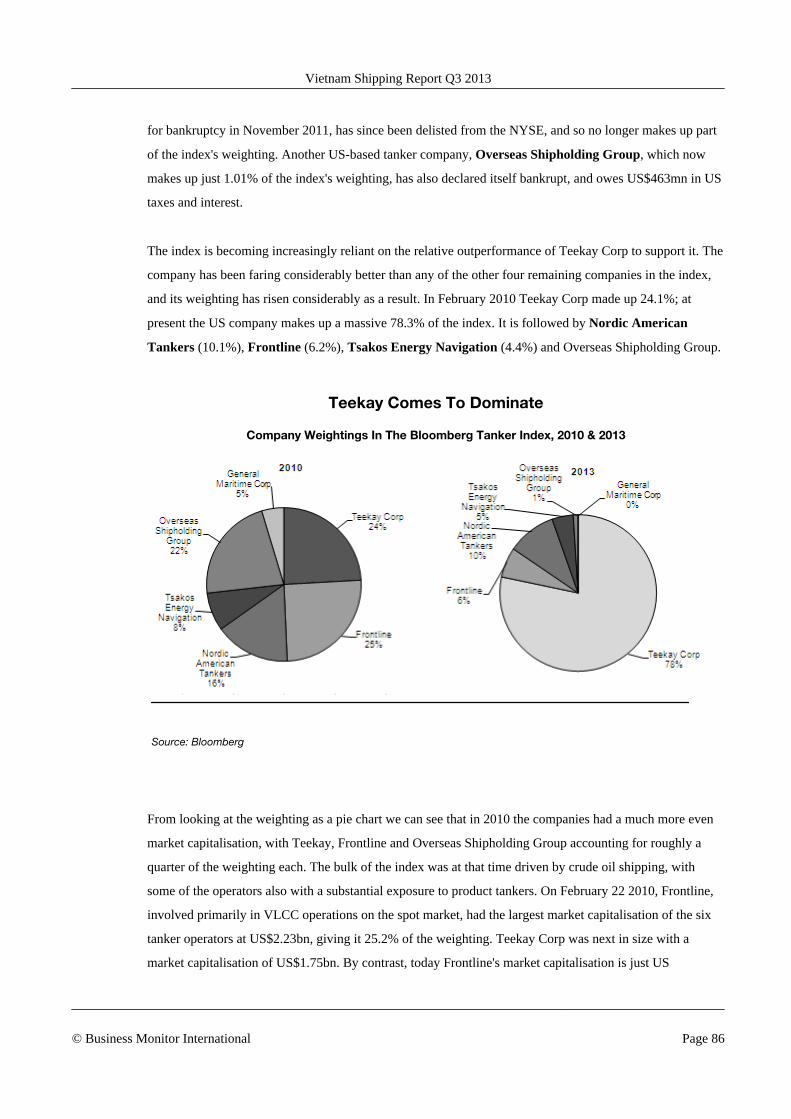
for bankruptcy in November 2011, has since been delisted from the NYSE, and so no longer makes up part
of the index's weighting. Another US-based tanker company, Overseas Shipholding Group, which now
makes up just 1.01% of the index's weighting, has also declared itself bankrupt, and owes US$463mn in US
taxes and interest.
The index is becoming increasingly reliant on the relative outperformance of Teekay Corp to support it. The
company has been faring considerably better than any of the other four remaining companies in the index,
and its weighting has risen considerably as a result. In February 2010 Teekay Corp made up 24.1%; at
present the US company makes up a massive 78.3% of the index. It is followed by Nordic American
Tankers (10.1%), Frontline (6.2%), Tsakos Energy Navigation (4.4%) and Overseas Shipholding Group.
Teekay Comes To Dominate
Company Weightings In The Bloomberg Tanker Index, 2010 & 2013
Source: Bloomberg
From looking at the weighting as a pie chart we can see that in 2010 the companies had a much more even
market capitalisation, with Teekay, Frontline and Overseas Shipholding Group accounting for roughly a
quarter of the weighting each. The bulk of the index was at that time driven by crude oil shipping, with
some of the operators also with a substantial exposure to product tankers. On February 22 2010, Frontline,
involved primarily in VLCC operations on the spot market, had the largest market capitalisation of the six
tanker operators at US$2.23bn, giving it 25.2% of the weighting. Teekay Corp was next in size with a
market capitalisation of US$1.75bn. By contrast, today Frontline's market capitalisation is just US
Vietnam Shipping Report Q3 2013
© Business Monitor International Page 86
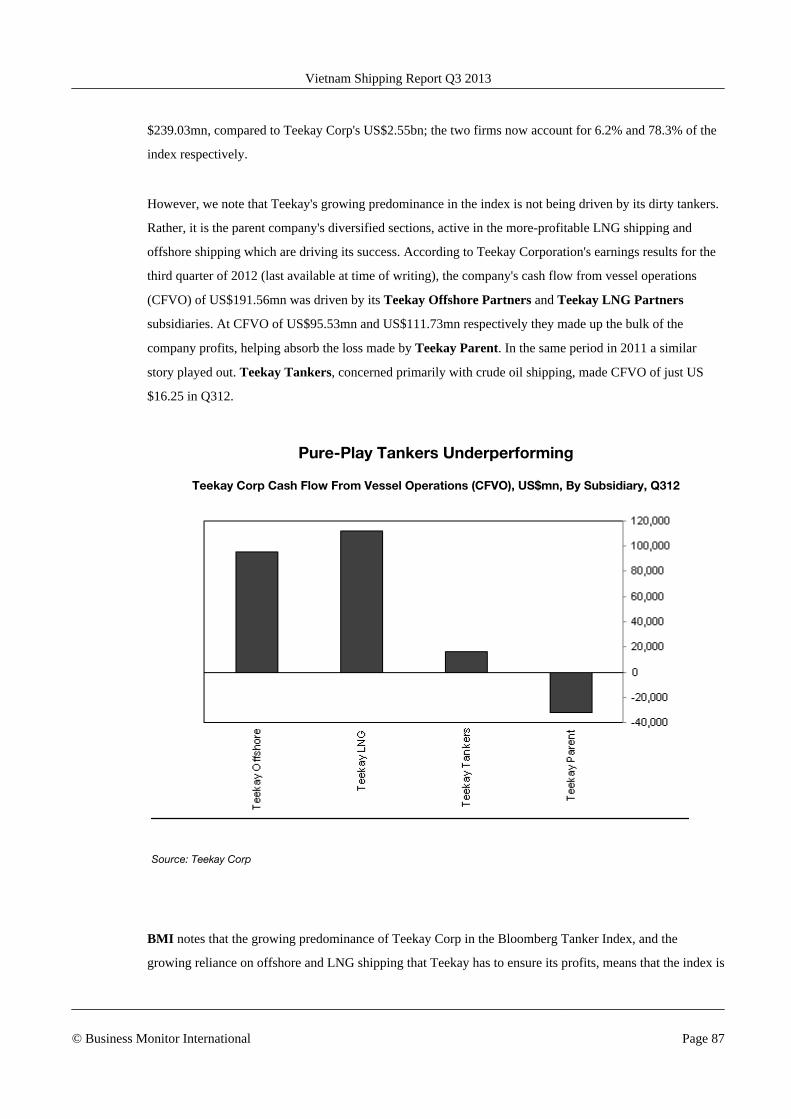
$239.03mn, compared to Teekay Corp's US$2.55bn; the two firms now account for 6.2% and 78.3% of the
index respectively.
However, we note that Teekay's growing predominance in the index is not being driven by its dirty tankers.
Rather, it is the parent company's diversified sections, active in the more-profitable LNG shipping and
offshore shipping which are driving its success. According to Teekay Corporation's earnings results for the
third quarter of 2012 (last available at time of writing), the company's cash flow from vessel operations
(CFVO) of US$191.56mn was driven by its Teekay Offshore Partners and Teekay LNG Partners
subsidiaries. At CFVO of US$95.53mn and US$111.73mn respectively they made up the bulk of the
company profits, helping absorb the loss made by Teekay Parent. In the same period in 2011 a similar
story played out. Teekay Tankers, concerned primarily with crude oil shipping, made CFVO of just US
$16.25 in Q312.
Pure-Play Tankers Underperforming
Teekay Corp Cash Flow From Vessel Operations (CFVO), US$mn, By Subsidiary, Q312
Source: Teekay Corp
BMI notes that the growing predominance of Teekay Corp in the Bloomberg Tanker Index, and the
growing reliance on offshore and LNG shipping that Teekay has to ensure its profits, means that the index is
Vietnam Shipping Report Q3 2013
© Business Monitor International Page 87
not the indicator for dirty tanker shipping that it once was, save perhaps to illustrate just how poorly the
sector is doing. Even with our more sanguine outlook for the coming years, the more pure-play crude oil
shipping companies represented in the index will have considerable debt issues for some time to come, and
it may be some time before it is as equally split as it was in 2010. Further, even Teekay Corp's relatively
profitable business has not yet been sufficient to elevate the index above the 200 mark.
Product Tankers
BMI maintains its view that the prospects for the product tanker sector are considerably more sanguine than
those of its crude oil counterpart both in the medium and longer term. The more optimistic view is
predicated not only on the supply outlook, as the orderbook remains at a reasonable level, but also on the
demand side.
Growth in demand for clean tanker operators' services is not necessarily being driven by a greater demand
for refined products, as the global economy's sluggish recovery from the global financial crisis continues to
weigh heavily on volume demand, but rather by growth in the tonne-mileage of clean tanker journeys, as
refining capacity moves from the developed markets of Europe and Australia to Asia and the Middle East.
The view that product tankers are sailing in safer waters than crude oil vessels is shared by dirty tanker
operators, a number of whom are looking to increase their exposure to the product-shipping sector, either
through new ordering or conversions. We caution that the industry must be careful not to create an
overcapacity glut through a rush on the yards however.
Index Remains Low, For Now
The Baltic Clean Tanker Index (BCTI), which covers vessels transporting 'clean' products such as chemicals
and refined petroleum products, saw a drop, its second in two weeks, over the seven-day period to April 26,
falling 3.2% to 613. The BCTI was not the only liquid bulk index at the Baltic Exchange to fall over the
period. The Baltic Dirty Tanker Index (BDTI), made up of a number of global crude oil shipping routes for
a variety of different vessel classes, saw its third consecutive week of declines, down from 634 to 623, a
drop of 1.7%.
Vietnam Shipping Report Q3 2013
© Business Monitor International Page 88

A Brighter Outlook
Baltic Clean Tanker Index, 2010-2013
Source: Bloomberg
Although the BCTI saw a greater drop that week, it remains in much better shape than its dirty counterpart.
The BCTI was down by 2.2% from 627 a year earlier, on April 26 2012. The BDTI, however, was down by
a massive 18.7% year-on-year (y-o-y), and we believe the disparity between their overall performances will
widen, with rates for clean tankers to begin to pick up much sooner than those for dirty tankers.
A Reasonable Orderbook
The disparity between the two sectors cannot be completely attributed to excess ordering in the crude oil
sector; the growth in the two fleets over the past five years is in fact remarkably similar. According to IHS
Global Shipping data compiled by Bloomberg, the global product tanker fleet stood at 1,602 on April 26,
amounting to 55.74mn deadweight tonnes (DWT), a hefty 37.2% greater than the 40.62mn DWT that made
up the fleet in May 2008. This is the same percentage growth in DWT seen in the crude oil tanker sector
over the same period. In terms of the number of ships in the respective fleets, the number of product tankers
has proportionally grown slightly more than crude oil tankers, by 24.7% to 23.8%. Today the orderbook for
clean tankers as a percentage of the fleet is higher than that for crude oil tankers, 11.8% compared to 10.3%.
Vietnam Shipping Report Q3 2013
© Business Monitor International Page 89

Orders Rising Again
Global Product Tanker Fleet, DWT ('000) And Orderbook As A % Of Total Fleet
Source: Bloomberg
While the outlook for growth in demand for crude oil tanker services is poor, new trade lanes for shipping
refined products are generating robust prospects for clean tanker operators. The two sectors' orderbooks
might be at similar levels, but while for clean tanker operators this is a reasonable rate, for crude oil
shipping it will result in more ships coming into an already overcrowded market, one with little hope of
improvement in the medium term.
After hitting a five-year low of 9.8% in November 2012, the clean tanker orderbook as a percentage of the
current fleet has begun to rise again on the back of the bright outlook for clean tankers.
Tonne-Mile Dividend
A number of new opportunities are opening up for product tanker operators, and this is due in large part to
the reduction of refining capacity in developed markets. With refineries often developed decades ago, the
costs of keeping them in operation are becoming greater than the profits to be made, especially given that
Vietnam Shipping Report Q3 2013
© Business Monitor International Page 90
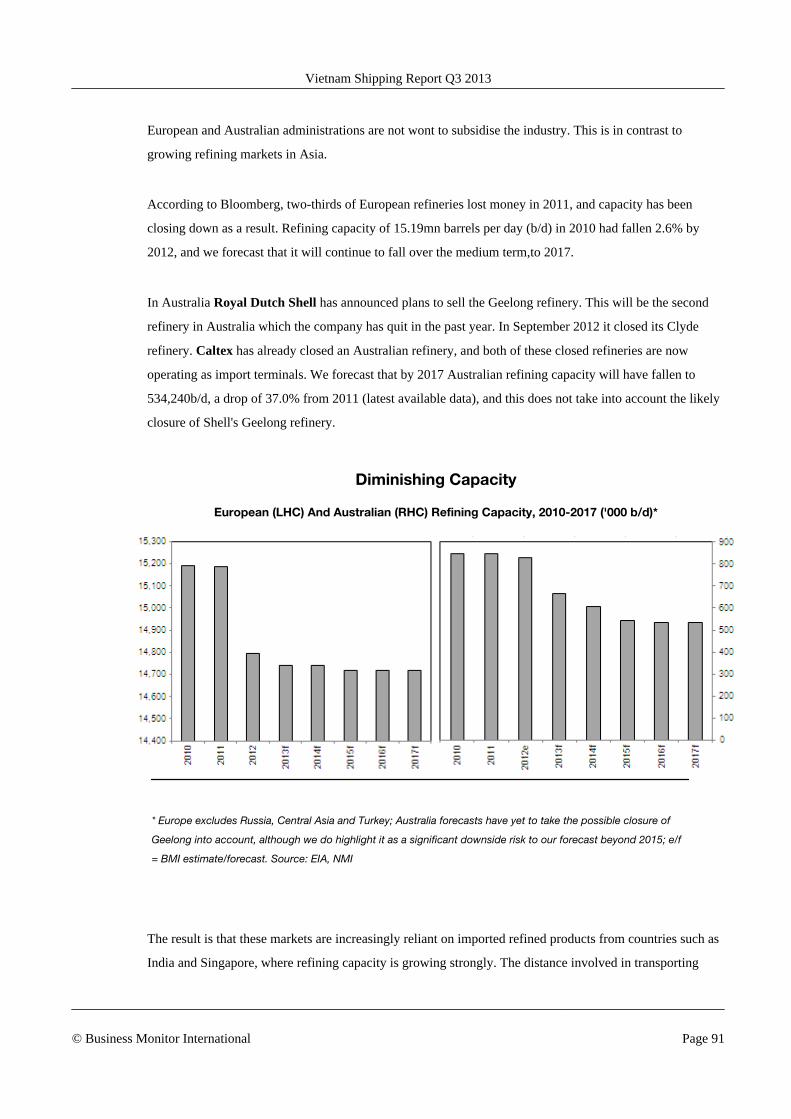
European and Australian administrations are not wont to subsidise the industry. This is in contrast to
growing refining markets in Asia.
According to Bloomberg, two-thirds of European refineries lost money in 2011, and capacity has been
closing down as a result. Refining capacity of 15.19mn barrels per day (b/d) in 2010 had fallen 2.6% by
2012, and we forecast that it will continue to fall over the medium term,to 2017.
In Australia Royal Dutch Shell has announced plans to sell the Geelong refinery. This will be the second
refinery in Australia which the company has quit in the past year. In September 2012 it closed its Clyde
refinery. Caltex has already closed an Australian refinery, and both of these closed refineries are now
operating as import terminals. We forecast that by 2017 Australian refining capacity will have fallen to
534,240b/d, a drop of 37.0% from 2011 (latest available data), and this does not take into account the likely
closure of Shell's Geelong refinery.
Diminishing Capacity
European (LHC) And Australian (RHC) Refining Capacity, 2010-2017 ('000 b/d)*
* Europe excludes Russia, Central Asia and Turkey; Australia forecasts have yet to take the possible closure of
Geelong into account, although we do highlight it as a significant downside risk to our forecast beyond 2015; e/f
= BMI estimate/forecast. Source: EIA, NMI
The result is that these markets are increasingly reliant on imported refined products from countries such as
India and Singapore, where refining capacity is growing strongly. The distance involved in transporting
Vietnam Shipping Report Q3 2013
© Business Monitor International Page 91
products from India to Europe or from Singapore to Australia means that the tonne-mile demand for product
tankers is expected to grow strongly. Longer journeys will result in more business for operators even as
volume demand sees lacklustre growth due to the anaemic economic performance in the eurozone, forecast
by BMI to see a second consecutive year of recession in 2013, and elsewhere.
The reduction in European refining, and its growth in the US as shale supplies grow, has reduced the
transatlantic trade. However, this is being offset by the growth of US exports to Latin America. Demand
growth in emerging economies in Latin America and Africa, which are lacking adequate domestic refining
capacity, provide further scope for tonne mile growth. It is worth noting that the upside for product tankers
in this equation will add to crude oil tanker operators' already considerable woes.
Money Pouring In
The sanguine outlook for the clean tanker sector is attracting considerable investment. According to an
April 2013 report by shipbroker Clarkson Hellas, product tankers, especially medium-range (MR) and
long-range (LR) ones, have been one of the largest class of vessels ordered at shipyards in 2013. Scorpio
Tankers and Sinokor Merchant Marine are among companies to have placed orders for new clean tankers
since the year began.
It is not only established players in the sector that are looking to gain from the projected growth in demand
for product tankers. It appears that John Fredriksen's Frontline 2012 is not going to be a pure-play crude oil
tanker outfit like Frontline, as he is looking to enter the clean market through the purchase of 16 product
tankers. The vessels are contracted for delivery between 2013 and 2014. Another relatively new outfit,
2010-formed Tankers Inc, backed by Barclays Natural Resources, is looking to grow its fleet. CEO
Mikael Skov told Seatrade Global: 'We are looking at any opportunity within the product tanker industry
whether it's mergers and acquisitions, second-hand vessels or newbuildings. As of now we are already in
various processes and believe 2013 is a good time to make investments.'
Newbuilds and acquisitions are not the only means by which new entrants are hoping to build exposure to
refined-product shipping; conversions are also picking up. It has been reported that at least four dirty
Aframax vessels are currently being converted into clean tankers through cleaning.
Cyclical Industry Brings With It Risks
As with any bright outlook in the shipping industry, there are downside risks, and these are largely down to
the sector's highly cyclical nature. The time and costs involved in developing a fleet of tankers mean
Vietnam Shipping Report Q3 2013
© Business Monitor International Page 92
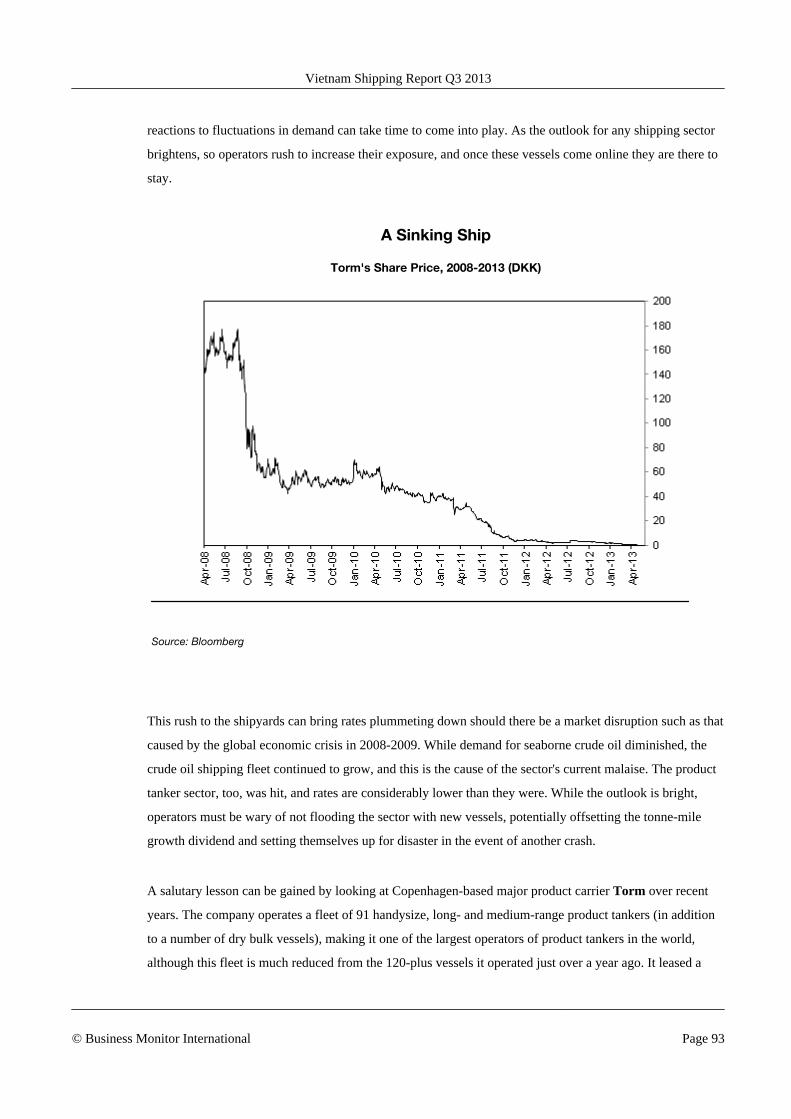
reactions to fluctuations in demand can take time to come into play. As the outlook for any shipping sector
brightens, so operators rush to increase their exposure, and once these vessels come online they are there to
stay.
A Sinking Ship
Torm's Share Price, 2008-2013 (DKK)
Source: Bloomberg
This rush to the shipyards can bring rates plummeting down should there be a market disruption such as that
caused by the global economic crisis in 2008-2009. While demand for seaborne crude oil diminished, the
crude oil shipping fleet continued to grow, and this is the cause of the sector's current malaise. The product
tanker sector, too, was hit, and rates are considerably lower than they were. While the outlook is bright,
operators must be wary of not flooding the sector with new vessels, potentially offsetting the tonne-mile
growth dividend and setting themselves up for disaster in the event of another crash.
A salutary lesson can be gained by looking at Copenhagen-based major product carrier Torm over recent
years. The company operates a fleet of 91 handysize, long- and medium-range product tankers (in addition
to a number of dry bulk vessels), making it one of the largest operators of product tankers in the world,
although this fleet is much reduced from the 120-plus vessels it operated just over a year ago. It leased a
Vietnam Shipping Report Q3 2013
© Business Monitor International Page 93
number of the vessels at market highs in 2008, and has been unable to secure charters to cover their
payments to banks and shipowners. Torm made a net loss of US$581mn in 2012, its fourth consecutive year
of net losses, and had teetered on the edge of bankruptcy in the first half of the year, forcing it into costly
debt restructuring.
Vietnam Shipping Report Q3 2013
© Business Monitor International Page 94

Global Company Strategy
Maersk Line
Overview
Maersk Line is the main container shipping unit of highly diversified shipping and energy conglomerate
AP Moller-Maersk Group. The group's other box shipping subsidiaries are MCC, which operates its intra-
Asia route network, and Safmarine, which transports boxes to and from Africa and the Middle East.
The company is based in Denmark but boasts a global presence, in 125 countries. It has around 25,000
employees.
Maersk is the largest container shipping company in the world, boasting a fleet with a capacity of 2.6mn
twenty-foot equivalent units (TEUs) and one of the largest box shipping networks. It is heavily exposed to
Asia-Europe but is increasing its role in intra-Asia trade, where it already possesses expertise in the form of
MCC.
SWOT Analysis
Strengths
■ As the world's largest container shipping line, Maersk has a greater share of global seaborne containervolumes than any other carrier.
■ Its large, expanding fleet offers it the ability to capture trade volumes.
■ Maersk is part of AP Møller-Maersk, a diversified company with activities in the oil and gas andterminal-operating sectors that synergise with its shipping operations.
■ Flexibility as a result of fleet size and type.
■ The company has a raft of strategies it can call on during the current depressed environment in thecontainer sector, including laying up vessels and super slow-steaming.
Weaknesses
■ The dominance of the Asia-Europe trade route (accounting for 24% of volumes carried in 2012) inMaersk's service portfolio leaves the company heavily exposed to a downturn on this route.
■ The company managed to post a profit in 2012.
■ With such a large fleet, Maersk is constantly running the risk of overcapacity, which could be a drain onresources if business slows.
Vietnam Shipping Report Q3 2013
© Business Monitor International Page 95

■ Its presence in the oil and gas and terminal operating sectors means Maersk risks an overreliance on thesector as an integrated whole. This could be dangerous if one sector's activities fail to hedge the other (forexample, if oil prices are at odds with bunker prices).
Opportunities
■ The company is increasing its exposure to intra-Asia, which is widely considered to offer huge growthpotential for the container shipping sector.
■ It looks set to remain number one in the container shipping sector and has cemented its position as aglobal leader with an order for 20 18,00TEU vessels.
■ The company is increasing its exposure to Russia, one of the few European markets that still offersgrowth for the container shipping sector.
■ The line's focus on emerging market routes is wise, not only as a diversification strategy from over-exposure to the 'big money' routes, but also as a way to enter potentially high-growth markets early.
Threats
■ Overcapacity fears still plague the container shipping market.
■ The trend of alliances and partnerships could put pressure on Maersk Line's market share, as its rivalsjoin forces.
■ The company is to hold off on newbuild ordering for two to three years, and this could mean that itmisses some bargains being offered by shipyards as newbuild prices have shrunk.
■ Maersk's offices, along with some of its peers, were raided in February 2013 by Russia's Federal Anti-Monopoly Service and in May 2011 by European Commission officials investigating antitrust claims. Ifthe shipping company is discovered to have acted inappropriately it will be in line for a hefty fine.
■ The company trades in kroner, which means it is vulnerable to changes in the US dollar.
■ Although the group operates in the oil and gas sector, disparities in the price of oil and bunker coststhreaten profits.
Strategy
Maersk continues to dominate the global container shipping sector, holding a 15.2% market share,
according to AXS Alphaliner. This is still some way above its nearest rival, Mediterranean Shipping
Company (MSC), which boasts a market share of 13.5%.
Routes
Maersk's tactics have seen it develop considerable exposure to the 'big money' routes, operating 10
transpacific services and 13 Asia-Europe services. Maersk is also heavily committed to intra-Asia, mainly
through its subsidiary MCC, which operates the group's intra-Asia services.
Vietnam Shipping Report Q3 2013
© Business Monitor International Page 96

In terms of volumes handled on Maersk's services, Asia-Europe dominates. In 2012 the route accounted for
24% of the total, the same as in 2011. West and Central Asia is the second largest route, accounting for 17%
of the total. Africa accounts for 15% of the total; Safmarine operates in this area with a focus on the
transportation of containers to and from Africa and the Middle East. Transpacific accounts for 15% and
Latin America for 14%, while intra-Asia currently makes up just 7%. BMI expects intra-Asia's role in
Maersk's service portfolio to increase over the medium term, with the company - along with its peers -
putting huge emphasis on the growing demand between Asian states.
While holding its dominant position on the big money trade routes, Maersk is also increasing its exposure to
emerging trade routes (ETRs). These include intra-Asia, intra-Europe and West Africa. BMI considers this
a wise strategy, as competition continues to expand on the Asia-Europe and transpacific routes, pushing
rates down. As well as offering diversification away from the big money routes, ETRs offer both less
competition and high growth potential. There are, of course, obstacles, as there tend to be in emerging
market-focused activities. However, Maersk's tactic of hiving off specific units, as in the case of intra-Asia
MCC, is a sound strategy, in BMI's view. We also highlight the lack of infrastructure at many of the ports
on ETRs and note Maersk's strategy of overcoming this by developing vessels with on-board cranes, thus
negating a risk operations.
Fleet
Maersk has the largest fleet in the world in terms of capacity with 2.6mn TEUs, comprising 594 ships. The
fleet's dynamics are fairly evenly split between owned and chartered, at 51.6% and 48.4% respectively.
Although the company charters in less capacity than it owns, it charters in more vessels, with the chartered
fleet standing at 355 ships, compared with its owned fleet of 239 vessels. Maersk appears to have a strategy
of chartering smaller vessels while owning and operating larger ones. This could be because of the prestige
of owning a large fleet, but BMI believes it is also partly because there is a larger global supply of smaller
vessels, which Maersk can charter in as needed.
The largest share of Maersk's fleet, in terms of size, comprises 4,000-5,000TEU vessels. This means the
company has flexibility to move ships between routes, with vessels in this size bracket able to be used for
both direct services and feeder lines. The company has also invested heavily in larger vessels and owns
eight of the second largest vessels afloat: the 15,000TEU 'E' class.
Maersk is implementing a strategy that should, in the medium term, ensure it remains the market leader in
terms of capacity. The company originally ordered 10 18,000TEU vessels, but has now doubled that
number. The first 10 vessels will be delivered in 2013 (the very first one in June) and 2014; the second 10
Vietnam Shipping Report Q3 2013
© Business Monitor International Page 97

are scheduled for delivery in 2014 and 2015. Maersk did have the option to take another 10 18,000TEU
vessels, but decided to let it lapse. BMI notes that while volumes on the Asia-Europe route have picked up
after the downturn, ordering vessels that can only operate on one route heightens risk.
Further highlighting Maersk's strategy of 'bigger is better' are reports that the carrier is seeking to increase
the capacity of some of its 8,600TEU vessels to 10,000TEUs. The company is, however, to hold off on
ordering newbuilds for the next two to three years.
Financial Results
Q412 And 2012
Maersk Line's revenue in Q412 increased by 2.5% year-on-year (y-o-y) to US$6.52mn, despite a 9.1% fall
in volumes to 2mn forty-foot equivalent units (FEU) and thanks to a 6.6% growth in the freight rate. As a
result, Maersk Line recorded a net operating profit after tax (NOPAT) of US$335mn, compared with the US
$593mn loss it recorded in Q411, and also helped by fall in the bunker fuel price from US$658 to US$604
per tonne.
Revenue for the year was up 8% to US$27.1bn, and volumes increased from 8.1mn FEU in 2011 to 8.5mn
FEU in 2012. Cost reductions, surcharges collection and 1.9% higher average rate y-o-y led Maersk Line
back to the black, posting a NOPAT of US$461mn in 2012 compared to a loss of US$553mn in 2011.
According to the company, it gained market share for the full year, but saw a declining share through H212.
Q312 And 9M12
In Q312 Maersk Line's revenue increased by 5.7% y-o-y to US$6.96bn. The main driver behind this
increase was a 5.7% increase in the freight rate, which averaged US$3,022 per FEU over Q312, as volumes
carried remained static y-o-y, at 2.1mn FEU.
On the back of this, Maersk Line recorded a profit of US$498mn, an improvement on the US$289mn loss in
Q311. The profit was accomplished not only by increased revenue, but by a fall in operating costs,
specifically the bunker fuel price, down 1.2% y-o-y to an average of US$648 per tonne in Q312.
The positive result in Q312 enabled Maersk Line to record a profit of US$126mn in 9M12. Over the first
nine months of 2012 the firm's revenue increased by 9.9% to US$20.6mn, with volumes growing by 10.2%
Vietnam Shipping Report Q3 2013
© Business Monitor International Page 98
and freight rates by 0.24%. Bunker prices, while down in Q312, were elevated for the other two quarters, up
11.9% for the period.
Q212 And H112
Maersk Line's net profit in Q212, while a positive signal, was not enough to drag the carrier back into the
black for the first six months of 2012. The profitable second quarter was achieved due to success in pushing
up rates on the Asia-Europe route, to which the company is most exposed. The limited success of the sector-
wide rate increase the company implemented on the route in Q312, however, offered downside risk to the
firm's ability to turn a profit for the whole of 2012.
In Q212 Maersk Line recorded a net operating profit of US$227mn, up from a US$95mn loss in Q211. The
Q212 profit was enough to wipe out the loss in Q112, with the line recording a net operating loss of US
$372mn, down from a profit of US$329mn in H111.
Maersk Line's revenue in Q212 increased by 16.7% y-o-y to US$7.3bn, with Q212 results outperforming
those the company posted in Q112 and with H112 revenue increasing by 12.2%.
Maersk Line's revenue increase in Q212 was driven by the increase in volumes, with the carrier shipping
10% more boxes than in Q211, and the uptick in rates, with the company's average freight rates increasing
by 4.2% y-o-y in Q212. Operating costs remained high, as although the bunker price ticked down in Q212,
it was still up y-o-y, with Maersk Line posting an average bunker price increase of 10.3% in Q212 and
19.6% in H112.
Vitally for Maersk Line, Q212 rate increases were successful on the Asia-Europe route, the trade route to
which it is most exposed, accounting for 24% of its operations. Maersk Line boosted rates on the route by
14%, but this was not enough to wipe out the rate declines in Q112, with rates on the trade route down 8%
y-o-y.
Q112
Despite freight volumes increasing by 22.2% in Q112, enabling Maersk Line's revenue to grow by 7.4% y-
o-y, the company remained in the red, recording a loss of US$599mn. The company was dragged down by
the 9% decline in rates and the high price of bunker, with the price of fuel increasing by 30.9% in Q112.
Vietnam Shipping Report Q3 2013
© Business Monitor International Page 99

BMI believes that the depth of Maersk Line's loss was mainly due to its exposure to Asia-Europe. In terms
of revenue generation, the trade route was the worst hit, with the average rate declining by 21% y-o-y. In
fact, Maersk Line's main route exposure, measured in distribution of volumes across its networks, in all but
one case recorded rate declines in Q112. Rates on the Asia-Europe trade route, which accounts for 37% of
Maersk Line's operations, fell 21%. The Latin America and transpacific routes, which account for 14% and
11% respectively of Maersk Line's network, recorded y-o-y rate declines of 8% and 5% respectively. Africa
coverage, which accounts for 15% of Maersk Line's operations, posted a rate increase, but this was just 2%
y-o-y.
2011
Despite Maersk Line's revenue increasing by 4.5% y-o-y from US$24bn to US$25.1mn, and transported
volumes increasing by 11%, the company still posted a loss of US$532mn; in 2010, it had recorded a profit
of US$2.8bn.The loss can be attributed to the sharp decline in freight rates, as a rate war between the major
box carriers played out in 2011, forcing Maersk Line's average freight rate down 7.7% y-o-y, to US$2,828
per TEU. This was coupled with the negative impact from spiralling fuel costs, with the bunker price
average increasing by 35.4% y-o-y to US$620 per tonne.
Maersk Line's exposure to the Asia-Europe trade route was a key factor in its 2011 loss. The route
dominates the company's operations, accounting for 39% (the operator in fact lifted its market share in this
route by 1 percentage point over the year, from 38%). While the route recorded solid throughput growth of
16% in 2011, a y-o-y decline in rates of 19% made turning a profit impossible.
Other key areas of growth for Maersk Line, in terms of container volumes, were Africa and Latin America,
which recorded throughput increases of 19% and 17% respectively. These regions also increased their role
in the carrier's distribution of volumes, with Africa accounting for 16% of the total and Latin America
accounting for 14%. Unfortunately, rates also declined on both routes. The three areas in 2011 where rates
did not decline were the transatlantic, Oceania and intra-Asia. Intra-Asia in our view, remained Maersk
Line's stand-out performer, seeing 5% volume growth. Intra-Asia still only accounted for 6% of Maersk
Line's total volume distribution, but with demand increasing and the fact that it has proved itself relatively
protected from the rate decline, BMI expected Maersk Line to continue expanding its coverage.
2010
Maersk's revenue increased by 30.65% y-o-y to US$26bn in 2010, compared with US$19.9bn in 2009. The
increase enabled the carrier to return to the black, with a full-year profit of US$2.6bn, following a loss of
Vietnam Shipping Report Q3 2013
© Business Monitor International Page 100
US$2.1bn in 2009. The recovery in revenue was driven by the global uptick in both volumes and demand in
the container shipping sector. In terms of total volumes carried, Maersk's box levels shipped increased by
5%. The major driver of Maersk's recovery, however, was its ability to raise rates. Rates grew 29% y-o-y in
2010; Asia-Europe saw the greatest rise, at 52% y-o-y, followed by the transpacific, where rates increased
by 33%.
The trend BMI noted from Maersk's results is that rates increased considerably more than volumes in all but
one case. The exception to the rule was intra-Asia, where volumes grew by 37% while rates rose 19%. This
growth in volumes further cemented BMI's view that intra-Asia trade routes hold massive growth potential
for the box shipping sector.
The company achieved its recovery in 2010 mainly through rate rises but, like its peers, the line struggled in
2011 to implement planned increases.
We note that it was not simply the uptick in volumes and rates that enabled Maersk to improve its financial
position. The firm has continued its strategy of slow-steaming, ensuring a saving on bunker fuel.
BMI expected this strategy to continue as demand in the market for express services had not yet
materialised.
Latest Activity
Maersk Line Swaps Panama For Suez
Maersk Line has stopped using the Panama Canal to transport goods from Asia's Far East to the US East
Coast from April 2013, quoting economic reasons, with larger, up to 9,000TEU, ships now being sent
through the Suez Canal instead of 4,500TEU vessels via the Panama Canal, according to CEO Soeren Skou,
as reported by Bloomberg . According to Skou, the economics are 'much, much better via the Suez Canal
simply because you have half the number of ships', and one of the reasons behind this is an increase in the
cost for sailing through the Panama Canal.
The China- US East Coast route via the Suez Canal is 4-5% longer on average, with the distance from Hong
Kong to Charleston via Suez approximately 12,000 miles, compared to 11,000 miles via Panama. However
the distance from Singapore is in fact shorter via Suez than through Panama, according to a company email
quoted by Bloomberg.
Vietnam Shipping Report Q3 2013
© Business Monitor International Page 101
The Panama Canal's fees have increased threefold over the past five years and now amount to US$450,000
per 4,500TEU vessel, Skou said. The group, however, is also 'deeply concerned' about the potential impact
of the toll increases announced by the Suez Canal Authority in February 2013, to be effective from May,
according to Maersk's statement in April.
The Panama Canal is undergoing a US$5.25bn expansion that is expected to be completed by June 2015.
According to the CEO of Maersk Line, as reported by Bloomberg, the company's use of the canal after that
'will depend on the economics'.
Triple-E Joining Maersk Fleet
Maersk Line announced that its first 18,000TEU vessel will be joining its fleet at the end of June 2013. The
Triple-E (Economy of scale, Energy efficiency and Environmentally improved) is the largest container ship
ever built. According to the company, it will consume some 35% less fuel per container than the
13,100TEU vessels being delivered to other shipping lines in these years. The CO2 emissions per container
moved will be more than halved compared to the industry average CO2 performance on the Asia-Europe
route.
The company noted that the new vessel comes online 'at a challenging time though, with weak demand
putting strains on all carriers' and said it is 'ready to adjust capacity accordingly' to avoid a repetition of the
previous years' 'devastating rate wars'. It intends to do so by 'returning chartered vessels to leasing partners,
recycling excess tonnage, idling parts of the fleet and further slow steaming'. Maersk Line plans to deploy
the Triple-E vessels on its AE10 service calling at 13 ports in Asia and Northern Europe.
In March 2013 Skou said the company expected container ship capacity to increase by 11% in 2013,
outperforming demand and despite the fact that 2% of the global container vessel fleet is projected to be
scrapped and the idling vessels will amount to 6% of it, up from 5%. According to Skou, as reported by
Dow Jones Newswires, demand on the Asia-Europe routes may increase by 3% to 5% in 2013, while
demand between Asia and Africa and Asia and Latin America is outpacing it at an annual rate of 5%.
Shipping Lines In Russia's Antitrust Probe
Russia antitrust probe targeted at least 12 container lines in February 2013, according to Lloyds Loading
List, when their offices in Moscow and St Petersburg were visited by investigators. The list of involved
companies includes the three largest lines, Maersk, MSC and CMA CGM, along with APL, Evergreen
OOCL, China Shipping, Cosco, NYK Hyundai Merchant Marine and Zim.
Vietnam Shipping Report Q3 2013
© Business Monitor International Page 102
According to Russia's Federal Anti-Monopoly Service (FAS), quoted by the same source, 'the costs of
marine container transportation constitute a significant portion of the price of goods, every increase of the
transportation costs directly affects customers across the globe.'
FAS also noted antitrust investigations by European, US and some of Asian countries' authorities. The EU
banned rate-setting conferences in 2008, and the European offices of 12 global lines were visited in May
2011, in what was thought to be part of the investigation into the surcharges setting procedure. At the time
of writing, however, it is not known whether any of the case is to be taken any further.
In a statement, Maersk Line confirmed that its offices in Moscow and St Petersburg were visited by Russian
antitrust authorities and denied any anticompetitive behavior, Lloyds Loading List reported.
Vietnam Shipping Report Q3 2013
© Business Monitor International Page 103
Mediterranean Shipping Company
Overview
Mediterranean Shipping Company (MSC) was founded in 1970 in Geneva, Switzerland. It launched its
first service between the Mediterranean and South and East Africa in the mid-1970s. In 2003, it became the
second-largest container shipper in the world, and remains in that position.
The carrier operates 200 direct and combined services weekly, calling at 316 ports. It has 480 offices in 163
countries and employs more than 37,500 staff.
SWOT Analysis
Strengths
■ MSC is the second-largest container shipper in the world.
■ The company has a forward-thinking strategy, with a fleet of 14,000-twenty-foot equivalent unit (TEU)vessels.
■ MSC is not averse to chartering, which has allowed it to expand its fleet.
■ The line is managing its capacity and exposure during volatility in the container shipping sector via linkups with other carriers and an alliance with CMA CGM.
■ The company is increasing its exposure to the US, operating the largest vessels on the transpacific traderoute.
Weaknesses
■ With such a large fleet, MSC is constantly running the risk of overcapacity, which could be a drain onresources if business slows.
■ With 16 vessels on order, at a time when overcapacity remains a major issue for container lines.
Opportunities
■ The sector has managed to push up rates in 2012 following a rate war in 2011 that decimated carriers'bottom lines; BMI believes that MSC will continue its rate push strategy into 2013.
■ The shipping sector has proved lucrative in the past two decades, with trade volumes growing year-on-year since 1982. Although the downturn affected the company, the medium- to long-term opportunity fortrade growth is ever present, and MSC is well positioned to capture these volumes.
■ The company is seeking greater exposure to emerging trade routes, specifically in South America, whichoffer new growth opportunities.
Vietnam Shipping Report Q3 2013
© Business Monitor International Page 104

Threats
■ MSC is heavily exposed to Europe, not only on its Asia-Europe routes, but also its intra-Europe portfolio.The slow growth outlook in the region will be a threat to demand, and growth in volumes on these routesis likely to remain sluggish.
■ MSC's desire to become number one could be hampered by Maersk Line, which is about to start takingdelivery of their 18,000TEU fleet.
■ Overcapacity is set to remain a major threat for lines in the short term.
Strategy
MSC continues to snap at Maersk Line's heels, with a global market share of 13.4% compared with
Maersk's 15.2%, according to AXS Alphaliner. BMI believes that MSC will continue to battle for the top
position.
By some measures, it has overtaken Maersk Line to claim top position, with Containerisation International
reporting in February 2011 that it had overtaken the Danish carrier in terms of capacity. This measurement
takes into consideration only Maersk Line and not the whole Maersk Group, which includes Safmarine and
MCC Transport. Taking the group as a whole into account, Maersk Line still holds the top position.
In December 2011, the US-based Journal of Commerce reported that, based on US import and export trade,
MSC had replaced Maersk Line as the top container line serving the US in the first nine months of 2011,
with MSC's operations almost balanced between imports and exports.
BMI highlights that MSC operates the largest vessels on the transpacific route. The company now utilises
vessels with capacities of between 11,600TEUs and 13,000TEUs on the trade route and in October docked
the largest box ship ever into the port of Long Beach, with the MSC Beatrice a 13,800TEU capacity vessel
calling there.
Routes
Despite the uptick in rates on both the Asia-Europe and the trans-Pacific routes, container lines are still
battling the threat of overcapacity and are starting to link up to better manage the problem. MSC has formed
an alliance with France's CMA CGM on the trade routes of Asia-Europe, Asia-Southern Africa and South
America. The alliance will considerably influence the market share of lines on the Asia-Europe route: the
two carriers are operating a four-route service, including 44 ships with capacities of over 11,000TEUs. The
effect of the alliance on this route was immediately felt, with the members of the Grand Alliance and New
Vietnam Shipping Report Q3 2013
© Business Monitor International Page 105
World Alliance announcing at the end of 2011 that they would join together to form a mega alliance of six
operators, called the G6 Alliance.
MSC is heavily exposed to the 'big money' routes, particularly the trans-Pacific, with the line operating five
services from Asia to US West Coast ports. The line also caters to the US East Coast market with an all-
water service.
It operates four Asia-Europe services: two (Silk Express and Lion Service) to Northern European ports and
two routes (Dragon Express and Tiger Service) to ports in the Mediterranean.
MSC also caters for intra-Asia trade, with its New Shogun service linking China and Japan and its
TongKing Service connecting China with Vietnam. Some of the line's other services serve a number of
countries in Asia before linking elsewhere in the world. The Cheetah Service links Chinese ports with the
Taiwanese port of Kaohsiung, before travelling on to Africa.
BMI believes that there is room for expansion in MSC's intra-Asia portfolio, with the potential for more
intra-Asia specific routes either operated solely or in partnership. In comparison with its peers, MSC has
only a small exposure to the intra-Asia market, which is set to be a major growth area for box carriers in the
medium term.
Fleet
MSC has the second-largest container fleet in the world, operating 471 vessels with a total capacity of
2.3mn TEUs. The fleet's dynamics are weighted toward the charter market, with chartered in ships
accounting for 55.4% of the total.
It has an owned fleet of 187 vessels with a capacity of 1.02mn TEUs, while its chartered fleet of 284 vessels
has a combined capacity of 1.27mn TEUs.
An exact breakdown of MSC's fleet is unavailable, but the line is a member of the ultra-large container ship
club, with a fleet of 14,000TEU vessels. The company stated in December 2011 that carriers must deploy
the largest vessels on the Asia-Europe trade lane in order to minimise losses. Vice-president Diego Aponte
said that he expects the Asia-Europe trade route to remain unprofitable until 2013.
MSC is preparing to take on more box ship tonnage, both owned and chartered. The company's order book
currently stands at 16 vessels with a total capacity of 184,996TEUs.
Vietnam Shipping Report Q3 2013
© Business Monitor International Page 106
While the carrier operates 14,000TEU vessels, it does not appear prepared at the moment to order larger
ships. In an interview with Lloyd's List, MSC's founder and chairman Gianluigi Aponte stated that the
company had no intention of following Maersk Line's lead and ordering 18,000TEU vessels. Aponte said
that he was 'only interested in ships up to 14,000 TEUs'. It should be noted, however, that Aponte initially
denied interest in ordering 14,000TEU vessels, yet his company has since done so. BMI will therefore not
completely rule out the development of vessels larger than 14,000TEUs by MSC in future.
Financial Results
2012
Not available.
2011
Not available.
2010
MSC does not publish its financial results. However, its operating fleet and the amount of cargo carried
increased in 2010. In that year, the line operated 432 vessels, a year-on-year increase of 14.3% from the 387
ships operated in 2009 and above the company's pre-downturn fleet of 410 vessels. Despite the downturn in
2009, the fleet's capacity continued growing, from 1.4mn TEUs in 2008 to 1.47mn TEUs in 2009 and
1.82mn TEUs in 2010.
However, the real indicator of improvement in MSC's operations is the volume of containers carried. This
grew by 17.6% y-o-y to reach 12.1mn TEUs in 2010, following a year-on-year decline of 10.5% in 2009. In
2010, levels reached and surpassed the pre-downturn handling level of 11.5mn TEUs, indicating that MSC
has recovered from the downturn. Coupled with rate increases during the year, which were implemented
across the board, this meant that the company was in the black in 2010.
Vietnam Shipping Report Q3 2013
© Business Monitor International Page 107

Latest Activity
Divesting TIL
Mediterranean Shipping Company (MSC) sold 35% stake in Terminal Investment Limited (TIL) to
Global Infrastructure Partners (GIP) for a hefty US$1,929mn. The deal is expected to close in mid-2013
contingent on relevant approvals.
TIL, which is owned by the world's second largest shipping line MSC, is the world's sixth largest container
terminal operator. Following significant expansion over recent years, the company now has, or is in the
process of acquiring, an interest in 30 container terminals globally. The deal will also see Alistair Baillie,
current chairman of GIP-owned International Port Holdings, joining TIL as president, indicating that GIP
is taking an active management role in the company. GIP's latest investment sees it gain a significant
position in the global container terminal market.
Within the broader shipping sector, port operators are outperforming. While we have remained cautious
toward the overall sector, as a result of significant oversupply of vessels, the container terminals operators
have been performing well. As container volumes pick up globally, shipping lines have remained stretched
owing to extremely low shipping rates as a result of vessel overcapacity. However, container terminal
operators have been protected from this, and are instead benefitting from overall increased throughput
volumes. While some restrictions have been placed on handling costs due to pressure from the large
shipping lines, we have seen much more stable financial results from the terminal operators versus the
relative shipping lines. In addition, operators fared much better throughout the financial crisis, reporting
more stable profits, while shipping lines saw sizable swings from profit to loss.
MSC US Strategy Expands With Long Beach Stake
MSC continues to increase its exposure to the US container shipping market with the line buying a stake in
the port Of Long Beach's Pier T. The purchase will give MSC priority access into Long Beach, the US'
second-largest container hub. BMI highlights that in the last two years MSC has been concentrating its
focus on the transpacific, with the company the first to dock a 13,800TEU vessel into a West Coast port, the
largest box ship they have handled to date. MSC's expanding US strategy will benefit the port of Long
Beach and the company's assured patronage of the facility offers upside risk to our 2013 forecasts for the
port.
Vietnam Shipping Report Q3 2013
© Business Monitor International Page 108

MSC has purchased a stake in the leasehold of Pier T, the largest container terminal at the port of Long
Beach. The shipping line already holds a financial interest in the terminal operations at Pier A.
BMI first highlighted MSC's increasing interest in the US container shipping market in 2011. In December
of that year the US-based Journal of Commerce reported that based on US import and export trade MSC
had replaced market leader Maersk Line as the top container line serving the US in the first nine months of
2011. Since then MSC has continued to ramp up its transpacific coverage. In June 2012 is added the
11,660TEU MSC Ivanka to its transpacific VSA Loop 2 (the largest ship at that point to be added to a
transpacific route). The company then proceeded to beat its own record in October 2012 by docking its
13,800TEU MSC Beatrice in Long Beach.
MSC's stake in Pier T will enable the company's ships priority access, a major benefit for a firm with MSC's
US focus as it will ensure the carrier has access to the US' second-largest container terminal.
The port of Long Beach will also benefit from this deal with MSC, as it will be assured the world's second-
largest container line as a client. The development offers upside risk to our box throughput forecasts for
Long Beach in 2013 and over the medium term.
The port of Long Beach posted its second consecutive year of container throughput decline in 2012, with
box volumes down 0.25% y-o-y to 6mn TEUs. BMI currently forecasts volumes to start improving in 2013,
as the US economy continues its steady recovery, and to keep growing over the medium term (2013-2017).
Joining Forces With ZIM
MSC and ZIM Integrated Shipping Services Ltd announced the beginning of 'a new and improved' Med-
Europe service from mid-February 2013. The route will be serviced by five 5,500-6000TEU vessels on a 35
days roundtrip calling at Felixstowe, Rotterdam, Hamburg, Antwerp, Le Havre, Ashdod, Alexandria, Haifa,
Ashdod, Valencia and Felixstowe.
Earlier, in January 2013, MSC joined ZIM in operations at the port of Tampa, Florida. Apart from Tampa,
MSC now offers direct calls to Caucedo, Kingston, Veracruz and Altamira and provides three out of five
3,000TEU vessels for the service, with the remainder provided by ZIM.
Vietnam Shipping Report Q3 2013
© Business Monitor International Page 109

MSC In Russia's Antitrust Probe
Russia antitrust probe targeted at least 12 container lines in February 2013, according to Lloyds Loading
List, when their offices in Moscow and St Petersburg were visited by investigators. The list of involved
companies includes MSC and two other largest lines Maersk and CMA CGM, along with APL, Evergreen
OOCL, China Shipping, Cosco, NYK Hyundai Merchant Marine and ZIM.
According to Russia's Federal Anti-monopoly Service (FAS), as quoted by the same source, 'the costs of
marine container transportation constitute a significant portion of the price of goods, every increase of the
transportation costs directly affects customers across the globe.'
FAS also reminded about the antitrust investigations by the European, US and some of the Asian countries'
authorities. The EU banned rate-setting conferences in 2008, and the European offices of 12 global lines
were visited in May 2011, in what was thought to be part of the investigation into the surcharges setting
procedure. By now, however, it is not known whether any of the case is to be taken any further.
Vietnam Shipping Report Q3 2013
© Business Monitor International Page 110
CMA CGM
Overview
CMA CGM is the world's third largest shipping line. Compagnie Générale Maritime (CGM) was formed in
1977 by the merger of Messageries Maritimes (MessMar) and Compagnie Générale Transatlantique
(Transat). Compagnie Maritime d'Affrètement (CMA) was founded the following year.
In 1996 CMA CGM was privatised and the following year made its first acquisition, Australian National
Lines (ANL). This was followed by a spree of acquisitions, beginning with UK-based MacAndrews in
2002. In 2006 CMA CGM purchased Delmas, an African shipping line previously owned by Groupe
Bolloré. The acquisition propelled CMA CGM to third place in ranking of the world's container shipping
lines. Strong growth enabled it to make three purchases in 2007, with the acquisition of Taiwan-based
Cheng Lie Navigation, Moroccan line COMANAV and US-based US Lines.
Turkey's Yildirim Group has a 24% stake (which it is seeking to increase to 30%) in CMA CGM and has
voting rights, but the Saadé family remains in charge, with a majority of both shares and voting rights.
The group has operations in container shipping, with a focus on reefer cargo. It also operates in the tourist
industry through subsidiary Croisières et Tourisme. CMA CGM Logistics operates 14 offices in China,
Europe and the Middle East, and owns TCX Multimodal Logistics, a bonded warehouse company that
operates in many French ports. CMA CGM's multimodal subsidiaries include French River Shuttle
Containers; ocean freight forwarder LTI France; as well as CMA Rail and Progeco, the repair arm of
CMA CGM's container business. Terminal Link is the group's terminal operating business.
SWOT Analysis
Strengths
■ The group has the third-largest container fleet in the world.
■ CMA CGM has a number of diversified subsidiaries, catering for different markets across the globe.
• Terminal Link supports the growth of the shipping division and the group's subsidiaries.
• Its multi-modal divisions also bolster growth, providing clients with an integrated 'door-to-door' service.
• The line is managing its capacity and exposure during volatility in the container shipping sector via linkups with other carriers and an alliance with Mediterranean Shipping Company (MSC).
Vietnam Shipping Report Q3 2013
© Business Monitor International Page 111

Weaknesses
■ With such a large fleet, the risk of overcapacity is ever present.
■ The firm is not as diverse as competitors such as Maersk, COSCO and China Shipping, which alsooperate in the bulk and tanker sectors.
Opportunities
■ The three-pronged acquisition of US Lines, COMANAV and Cheng Lie Navigation offers theopportunity to capture traffic volumes to and from three different regional markets.
■ The partnership with Yildirim Group will enable the company to return to a strategy of growth rather thanbeing preoccupied with the threat of insolvency.
■ The company was back in the black in 2012 and expects similar profitability for 2013.
■ Is increasing its exposure to Russia, which BMI believes will be a high-growth market.
■ Increasing its exposure to Africa, a high-growth market, expanding its services and seeking to invest inthe port of Abidjan, Côte d'Ivoire.
Threats
■ The company must ensure it does not place the importance of its market share above recovery.
■ Overcapacity and declining demand are still major issues facing the box shipping sector.
■ Debt restructuring is leading to less diversity in the company's operations portfolio, with the group sellingstakes in one of its major terminals and its cruise ship company.
■ CMA CGM's offices, along with some of its peers, were raided in February 2013 by Russia's FederalAnti-Monopoly Service and in May 2011 by EC officials investigating antitrust claims.
Strategy
CMA CGM is the third-largest global container shipping company, with an 8.4% market share, according to
AXS Alphaliner. This puts it considerably behind second-placed Mediterranean Shipping Company
(MSC) with its 13.5% market share, but significantly ahead of fourth-place Evergreen, on 4.3%.
CMA CGM managed to ride out the 2009 downturn, despite a period where it looked likely that the French
government would be required to bail it out. The shipping line was determined to remain a family
concern. It found an investor in Yildirim Group, which agreed to invest US$500mn and take a 20% stake in
the shipping line. This has since been increased to 24%, but left the Saadé family in charge, with a majority
of both shares and voting rights. However, Yildirim is making its presence felt, blocking a planned new
build strategy. Yildirim is seeking to increase its stake in CMA CGM from 24% to 30%.
Vietnam Shipping Report Q3 2013
© Business Monitor International Page 112

Debt restructuring is affecting CMA CGM's diversity of operations, with the company selling its stake in
the Marsaxlokk Malta Freeport terminal and its cruise ship company, Compagnie du Ponant.
Routes Despite the uptick in rates on the Asia-Europe and the transpacific routes, container lines are still
battling the threat of overcapacity. Lines are starting to link up in a bid to manage the problem, and CMA
CGM has formed an alliance with MSC on the Asia-Europe, Asia-Southern Africa and South America
routes. The alliance will considerably affect the market share of lines on the Asia-Europe route, with the
two carriers set to operate a four-route service and deploy 44 ships with capacities of more than 11,000
twenty-foot equivalent unit (TEUs). The impact of the alliance on the route is already being felt, with the
members of the Grand Alliance and New World Alliance announcing at the end of 2011 that they would
join together to form a mega alliance of six operators, called the G6 Alliance.
CMA CGM is a major player in Asia-Europe, boasting a service network of eight routes. It is exposed to the
transpacific with a route network of nine services and is heavily involved in intra-Asia trade. CMA CGM
offers more than 20 intra-Asia trade routes. These are, however, feeder services, and it is the company's
Asian subsidiary, CNC Line, that operates direct intra-Asia services. BMI expects CMA CGM to continue
its strategy of developing its exposure to intra-Asia trade, as the region is considered to offer major box
shipping growth potential.
Fleet Like its peers, CMA CGM's fleet is getting bigger, not only in terms of vessel numbers but also in
terms of capacity. It operates a fleet of 13,000TEU vessels, with 26 vessels of 11,000TEU-plus capacity.
The company has also welcomed the first and second of three 16,000TEU ships to its fleet, with the vessels
beginning operations on the Asia-Europe trade route at the end of 2012 and in April 2013 respectively. The
delivery of the third vessel was due in early May 2013.
CMA CGM appears set to take a break from ordering, with a proposed order for 20 10,000TEU vessels at a
Chinese yard vetoed in October 2011 by the company's new partner, Robert Yildirim. Yildirim told Lloyds
List: 'What I see in shipping is the role of ego in driving orders to keep up with the competition. This is very
dangerous.' The company has 11 vessels on its order book, according to AXS Alphaliner.
The company has concentrated on developing its fleet via chartering in tonnage and is expected to continue
this strategy. Chartered tonnage accounts for 63.8% of CMA CGM's total TEU capacity. This offers the
company considerable flexibility. During periods of decline in volumes, it can return chartered vessels when
the charter period has finished, reducing the size of its fleet and its operating costs.
Vietnam Shipping Report Q3 2013
© Business Monitor International Page 113
Financial Results
2012
CMA CGM's consolidated revenue increased by 7% year-on-year (y-o-y) in 2012, from US$ 14.9bn in
2011 to US$15.9bn, driven by container volume growth of 6%, from 10mn TEUs in 2011 to 10.6mn TEUs
in 2012. The company said it achieved US$800mn of savings over the year, well above target. It posted a
consolidated net profit of US$361mn in 2012, compared to a net loss of US$5mn a year before.
The company managed to reduce bunker costs per TEU by 12% and charter expenses by US$200mn. In
2013 it expects a similar level of profitability, helping it to cut its net debt by US$1.1bn to US$3.5bn.
A company press release mentions the strengthening of CMA CGM's balance sheet thanks to the sale of
49% of Terminal Link for EUR400mn, the closing of US$100mn equity injection from Yildirim, the
signing of US$150mn equity injection from Fonds Stratégique d'Investissement (FSI) and the closing of the
agreement with company's banks regarding its debt restructuring.
Q312 And 9M12
CMA CGM reported improved earnings for Q312. This left it on course for a full-year profit after a hugely
challenging four years for the global container sector. However, while this provides some much-needed
respite and underscores the success of its cost-cutting programme, ongoing issues of overcapacity and a
weak global growth outlook do not give cause for much optimism.
CMA CGM posted a net profit of US$371mn in Q312, bringing 9M12 profit to US$310mn, compared to
just US$13.2mn in the first nine months of 2011. An improved Q3 was attributed to internal cost-reduction
measures, as well as some rates relief and the benefits of reduced fuel costs. The ongoing challenges of
overcapacity and weak global growth saw the company state that Q4 would be weaker. Yet it remained on
track to post a full-year net profit.
Reasons for optimism for CMA CGM come in the form of the successful cost-control measures. In the first
nine months of the year it realised savings of US$550mn, equivalent to a 5% y-o-y reduction in operating
costs and well ahead of the target of US$400mn in savings for the full year. Planned asset sales, including
the disposal of a 49% stake in terminal operator Terminal Link and the sale and lease-back of some of its
self-owned vessels, should help keep operating costs under control moving into 2013. Furthermore, planned
Vietnam Shipping Report Q3 2013
© Business Monitor International Page 114
investments from French fund FSI (US$150mn) and Turkey's Yildirim (US$100mn) should help alleviate
operating pressures. Finally, perhaps most importantly and related to the aforementioned planned capital
injections, CMA CGM has reached a restructuring deal with its lenders to help manage its debt obligations
due next year.
While providing respite and putting the company on a firmer footing, BMI does not see all this as
preventing CMA CG from having another challenging year in 2013. The external operating environment is
simply too difficult. On the supply side, issues of overcapacity will only become greater, and indeed CMA
CGM is contributing to this with its own ordering strategy. On the demand side, a weak outlook for global
economic growth will act as a further headwind.
BMI forecasts global real GDP growth of 2.9% in 2013, revised down from a previous forecast of 3.0%.
While high frequency indicators suggest the outlook for global growth is weak, rather than recessionary, a
Chinese hard landing, eurozone debt woes, the US fiscal cliff, the ever more marginal gains to be realised
from expansionary monetary policy and the increasing difficulty with which governments can pursue
expansionary fiscal policy, all mean this outlook remains precarious.
Q212 And H112
In Q212 CMA CGM bounced back into the black with a US$178mn net profit. Revenue increased by 12%
to US$4.15bn. In H112 CMA CGM made a saving of US$294mn, putting it on course to realise its 2012
cost-cutting plan of US$400mn.
Q112
Although the carrier's volumes increased by 13.4% y-o-y to 2.6mn TEU and revenues grew by 2.6% to US
$3.6bn, it posted a loss of US$248mn, with the relatively high bunker fuel price being blamed.
2011
CMA CGM reported a US$30mn loss in 2011, but this was considerably lower than that being posted by the
company's peers. The loss was despite a 4% increase in revenue to US$14.87bn and 11% growth in
container volumes carried by the liner to 10mn TEUs. The loss was attributed to overcapacity in the market,
which forced rates down, and a rise in oil prices, which saw the bunker fuel price rise 34% y-o-y.
Vietnam Shipping Report Q3 2013
© Business Monitor International Page 115
CMA CGM planned to get back into the black in 2012 via a cost-saving strategy, with US$400mn in
savings planned. It believes it will save as much as US$80bn due to the decline in charter rates. In terms of
expansion, the carrier planned to increase its coverage of Russia, India, Latin America and Africa, as well as
expand its reefer coverage.
2010
CMA CGM's revenue increased by 36% in 2010 to US$14.3bn, from US$10.5bn in 2009. This enabled the
line to post a US$1.6bn profit following a loss of US$1.4bn in 2009. The recovery in revenue was driven by
the global uptick in both volumes and demand for the container shipping sector. In terms of total volumes
carried, CMA CGM's box levels shipped increased by 14.7%. The company stated that 'Asia-Europe and
intra-Asia lines enjoyed record business… Asia-US lines returned to pre-recession levels.'
BMI believes the volume uptick in 2010 is just part of the story. Volumes were up both y-o-y and on 2008
levels (by 4.4%). We believe rate increases also played a massive role.
Latest Activity
Ratings Raised After Restructuring Finalised
CMA CGM announced in February 2013 that it had finalised its financial restructuring, launched in 2011.
The agreement was closed with its banks on debt restructuring. This included a partial refinancing of a
credit line maturing in 2013 into new EUR280mn 'secured term loans of a maturity of more than [three]
years'. Secondly, a binding agreement was signed with the FSI, which, at closing, expected within three
months, will subscribe to bonds redeemable in shares for an amount of US$150mn giving rights to a 6%
stake in CMA CGM upon conversion. The restructuring involved additional investment by Yildirim Group,
with a closing of the subscription, under the terms of the existing agreement, by the Yildirim Group of
bonds redeemable in shares for an amount of US$100mn giving right to a 4% stake in CMA CGM upon
conversion.
According to CMA CGM's director, Rodolphe Saadé, the finalisation of the debt restructuring together with
new equity injection from FSI and Yildirim Group and the sale of 49% of Terminal Link is expected to
allow CMA CGM 'to operate with the required financial flexibility' and is the major step towards
'contemplating an IPO'.
Vietnam Shipping Report Q3 2013
© Business Monitor International Page 116
CMA CGM's announcement was followed later in February by a decision by ratings agency Standard and
Poor's (S&P) to raise the corporate credit rating on CMA CGM to B- from CCC+ and the issue rating on
the company's senior unsecured notes to CCC from CCC-. S&P also noted that the 'rating remains on
CreditWatch with positive implications, as we could raise our ratings on CMA CGM within the next three
months if its liquidity improved, as we expect.'
49% Of Terminal Link Sold To CMHI
CMA CGM sold a 49% stake of Terminal Link to China Merchants Holdings (International) Company Ltd
(CMHI) at the end of January, raising EUR400mn and entering into a new strategic partnership. Subject to
regulatory approvals, the deal was expected be finalised in H113. CMHI is the largest public port operator
in China. The two parties hope the deal will begin a 'highly beneficial' strategic partnership 'in operating and
developing container terminals on a global basis'.
Terminal Link, based in Marseilles, operates 15 terminals on key international shipping routes and is ranked
12th worldwide, handling 8.1mn TEUs in 2011. CMHI invests in and operates port business primarily in
eight major Chinese cities, including Shenzhen, Hong Kong, Shanghai, Ningbo, Qingdao, Tianjin, Xiamen
and Zhanjiang. In recent years it has also acquired assets in Colombo (Sri Lanka) and in Africa. In 2012 the
total container volume handled by CMHI's port assets was in excess of 60mn TEUs. The investment into
Terminal Link further internationalises CMHI's port business.
According to Alphaliner, reported by the Load Star, CMHI's acquisition covers 10 of 15 Terminal Link
terminals. Not included are the 10% stake in the Rotterdam World Gateway, the 25% stake in a Long Beach
terminal acquired in December 2012, the 50% in the Fos2XL Terminal A development, and stakes in new
and currently shelved port developments at Damietta, Egypt, and Cai Mep, Vietnam.
Baghdad Dry Port To Open In June 2013
In March 2013 CMA CGM announced that its new bonded dry port in the Abu Ghreib area near Iraq's
capital, Baghdad, would open in June. It said the facility has a total surface area of 165,000 m2, yard surface
of 90,000 m2, storage capacity for 12,000TEUs, container scanner and on-site customs offices.
CMA CGM In Russian Antitrust Probe
A Russia antitrust probe targeted at least 12 container lines in February 2013, according to Lloyds Loading
List. The lines' offices in Moscow and St Petersburg were visited by investigators. Involved companies
Vietnam Shipping Report Q3 2013
© Business Monitor International Page 117

include CMA CGM and two other large lines Maersk and MSC, along with APL, Evergreen OOCL, China
Shipping, Cosco, NYK Hyundai Merchant Marine and ZIM.
According to Russia's Federal Anti-monopoly Service (FAS), as quoted by the same source, 'the costs of
marine container transportation constitute a significant portion of the price of goods, every increase of the
transportation costs directly affects customers across the globe.' FAS also noted antitrust investigations by
European, US and some Asian authorities. The EU banned rate-setting conferences in 2008, and the
European offices of 12 global lines were visited in May 2011, in what was thought to be part of the
investigation into the surcharges setting procedure.
Earlier in the year CMA CGM resumed port calls at Vladivostok Commercial Port Terminal (VCT) in
addition to calls at the Vladivostok Fishery Terminal and at Vostochny Port. The company's upgraded
Korea/Russian Far East Express service (KRT/RUFEX) now consists of five loops.
Vietnam Shipping Report Q3 2013
© Business Monitor International Page 118
Evergreen Line
Overview
Evergreen Line is the name and global brand under which five shipping companies operate. The brand was
established in May 2007 and encompasses Evergreen Marine (Taiwan), Italia Marittima (Italy),
Evergreen Marine (Hong Kong) and Evergreen Marine (UK). A fifth carrier, Evergreen Marine
(Singapore), signed a joint service agreement in May 2009.
Evergreen Line's main routes focus on the delivery of goods from Asia, particularly Taiwan, Hong Kong,
China, South Korea and Japan. It operates to and from the US East and West Coasts, South America,
Europe, the Mediterranean, the Middle East and Africa. It also provides a container service between the east
coast of South America and the East Coast of the US, as well as a service linking Panama with the US West
Coast. The carrier provides regular feeder services in the Caribbean, the Mediterranean and around the
Indian sub-continent.
Evergreen is engaged in the port-operating sector, with terminals including the Taichung Container
Terminal and the Kaohsiung Container Terminal in Taiwan, the Colon Container Terminal in Panama, and
the Taranto Container Terminal in southern Italy, in which Hutchison Port Holdings also has a stake.
SWOT Analysis
Strengths
■ Evergreen operates one of the most globalised route networks, with strong coverage of major LatinAmerican and Middle Eastern ports in addition to its core Asian, US and European services.
■ Its route-sharing agreements allow it to reduce capacity while still meeting client demands.
■ Highly exposed to the intra-Asia trade route, which is widely considered a major growth market.
■ The CKYH Alliance (also known as the Green Alliance), made up of COSCON, 'K' Line, Yang Ming andHanjin Shipping has formed a partnership with Evergreen Line, allowing the line to compete morestrongly with other alliances, as well as market leader Maersk.
■ Has increased its routes through alliances, despite the difficult operating environment.
■ After a year of net losses, Evergreen Marine is profitable again, posting a net income of TWD128.53mnin 2012.
Vietnam Shipping Report Q3 2013
© Business Monitor International Page 119
Weaknesses
■ Evergreen Marine reported net losses of US$105mn for 2011. With a large container fleet and littlediversification into other sectors, the risk of overcapacity is ever-present. This threat is especially relevantas the company has the largest newbuild fleet currently on order, at 36 ships.
■ Flagship services are focused on Asia, so a shift in the dynamics of this region could make Evergreenvulnerable.
Opportunities
■ Seeking safety in numbers. Has joined up with the CKYH Alliance on several routes.
■ Was the first box line to return to the yards after the downturn and in the medium term plans to order 100vessels, which will give it one of the youngest and most modern fleets in the container sector (the plan for100 new vessels has been put on hold until after 2015).
■ Ordered at the bottom of the market, so has been able to expand more cheaply than its peers.
■ Well placed to take advantage of the growth in cargo traffic brought about by the opening of direct routesbetween China and Taiwan.
■ Is expanding its emerging trade route coverage, with new services connecting Asia and Africa.
■ One of the shipping lines likely to benefit from a tax reduction the Taiwanese government is proposingfor Taiwanese-flagged vessels in order to boost the merchant maritime fleet.
Threats
■ While the company has built up intra-Asian history and expertise, the region's growth potential is luringnew players, increasing the competition Evergreen will face.
■ Shipping companies' bottom lines have been hit hard by rapidly rising bunker fuel prices and BMIprojects that prices will remain elevated.
■ Evergreen's offices, along with those of some of its peers, were raided in February 2013 by Russia'sFederal Anti-Monopoly Service and in May 2011 by European Commission officials investigatingantitrust claims. If the shipping company is found to have acted inappropriately it will be in line for ahefty fine.
Strategy
Evergreen Line is continuing to claw its way back up the ranks, and is now fourth in terms of market share.
According to AXS Alphaliner, it has a capacity of 730,289 twenty-foot equivalent units (TEUs), only
748TEUs ahead of fifth-placed COSCON. The third-largest container shipping company, CMA GGM, has
nearly double the capacity of Evergreen, meaning its climb up the table has likely ended.
Vietnam Shipping Report Q3 2013
© Business Monitor International Page 120
Routes
Evergreen Line boasts a strong presence on intra-Asia trade routes and continues to launch new routes. The
latest service to be included in its intra-Asia portfolio is its CPM service linking South China, the
Philippines and East Malaysia with port rotation Shekou - Hong Kong - Manila - Kota Kinabalu - Bintulu -
Shekou. The high growth potential of intra-Asia routes has seen a number of lines expand into this area.
BMI believes Evergreen Line is positioned better than most, as intra-Asia is its traditional operating area
and it has built up expertise and a client base.
In March 2012 the line announced its return to the North America-South America route, in conjunction with
a number of other lines. Evergreen, NYK Line (NYK), Hanjin Shipping and Hyundai Merchant Marine
(HMM) jointly launched a new service between the US East Coast and South America, the Atlantic North
South Service (ANS).
The company has also developed a role on the 'big money' routes, and has 14 Asia-Europe and 13
transpacific services.
Fleet
Evergreen Line has a fleet of 188 vessels, with a capacity of 730,289TEUs. Evergreen owns and charters
almost even numbers of vessels - 95 and 93 respectively. Making up 330,910TEUs, 45.3%, of company's
fleet is chartered. The capacity Evergreen-owned vessels is 399,379TEUs.
In terms of vessel capacity, its fleet is much smaller than its peers', with vessels ranging from 1,164TEUs to
8,452TEUs. Evergreen's strategy of maintaining a large fleet made up of smaller vessels ties the carrier with
intra-Asia routes, to which it is highly exposed. The company had previously seemed unprepared to make
the leap into the mega-vessel class, a move undertaken by most of its peers. However, its orderbook shows
it is prepared to take more vessels, with capacity of 8,000TEUs in terms of owned tonnage and 8,800TEUs
in chartered tonnage.
The line's avoidance of ordering mega vessels appeared to be due to reservations by chairman and founder
Chang Yung-Fa. He has been reported to be 'a noted sceptic about the industry trend towards far larger
ships, believing that the need to fill them would end up driving down earnings'.This scepticism appears to
have been overcome, with Evergreen set to charter 10 13,800TEU ships from Greece's Enesel. The Greek
shipowner has placed a US$1.2bn order with South Korea's Hyundai Heavy Industries, with the first
Vietnam Shipping Report Q3 2013
© Business Monitor International Page 121
vessel due online in H213. BMI notes that Evergreen is ensuring some protection, as it is chartering the
vessels instead of owning them.
BMI believes Evergreen's decision to join the mega-vessel club will enable it to increase its market share. It
will also help the company to remain the number-one container line in Asia.
Evergreen's orderbook, at 360,187TEUs, or 49.3% of its current fleet, is almost triple that of COSCON (at
123,473TEUs), meaning Evergreen should comfortably retain its lead. The change in strategy will also help
the company move toward Chang's reported goal of 'steering Evergreen into becoming the world's largest
container line in his lifetime'.
The company announced in August 2012 that it would take delivery of 40 container vessels by 2015, with
the first 8,000TEU vessel delivered that month by South Korean shipbuilder Samsung Heavy Industries
Company. Samsung will deliver 20 vessels in total, with Taiwanese shipbuilder CSBC Corporation and
Greece's Enesel each delivering a further 10. The vessels will increase Evergreen Marine Corporation's
overall capacity by 378,000TEUs to 1.06mn TEUs.
The company's plans to build 100 container ships have been put on hold. Twenty 8,000TEU-plus vessels
from Samsung Heavy Industries were ordered in 2010. In 2011 Evergreen ordered a further 10 vessels of
the same specification from Taiwan Shipbuilding Corp. Eighteen of the 30 8,452TEU newbuilds are
expected to be delivered by the end of 2013. Evergreen also planned to build 20 7,024, 20 5,364TEU and 20
2,000TEU vessels. These plans are on hold until after the Panama Canal expansion project is completed,
which is due in 2015.
Financial Results
2012
Evergreen Marine returned to the black in 2012, posting a net income of TWD128.53mn, compared to a
TWD3.09bn loss in 2011. The company said it would not pay dividends.
Q312 And 9M12
Evergreen Marine recorded a net profit of TWD104.15mn (US$3.56mn) for January-September 2012, and a
TWD2.5mn profit in Q312. While it was in the black for the first nine months of 2012, profits were
considerably lower for this period than 9M11, when the company saw a profit of TWD266.8mn.
Vietnam Shipping Report Q3 2013
© Business Monitor International Page 122
Q212 And H112
Evergreen announced a net profit of TWD858mn (US$29mn) for Q212. It reported an operating income of
TWD641mn (US$22mn). However, it reported a loss of TWD2.4bn (US$82mn) in H112. This was
compounded by an operating loss of TWD2.24mn (US$76mn) in H112.
2011
Evergreen Marine reported a net loss of US$105mn in 2011. Revenue fell to US$514mn.
H111
Evergreen Marine managed to remain in the black in H111, unlike many of its peers, despite the fact that its
profit declined by 61% to TWD1.39bn (US$48mn) from TWD4.03bn in H110. Its revenue fell from
TWD8.6bn to TWD7.59bn, with the company attributing the decline to overcapacity and weakening in the
economic recovery, which suppressed demand.
2010
In 2010 Evergreen Marine registered revenue of US$3.5bn, up 39.9% year-on-year (y-o-y). This enabled it
to return to the black, with an operating profit of US$403.1mn compared to a loss of US$473mn in 2009.
Latest Activity
10th And 11th 8,452TEU Vessels Launched; Expansion To Slow
Evergreen Line's fleet continues to expand. It recently held naming ceremonies for two more ships. The
Ever Liven and Ever Logic, each with a capacity of 8,452TEU, the 10th and 11th in a series of L-type
containership to be operated by the company, were built at South Korea's Samsung Heavy Industries
shipyard. Both ships joined Evergreen Line's Far East - Europe services from late April 2013.
While the firm has been increasing its fleet it is still carefully managing capacity. It has said it will delay its
plans to build 60 medium-small box ships until after the Panama Canal expansion is complete, due in 2015.
The company said in 2010 that it planned to build 100 vessels over the medium term. Of this 30 8,000TEU
ships have been ordered, with plans to build 20 7,024, 20 5,364TEU and 20 2,000TEU ships on
hold. Eighteen of the 30 8,000TEU newbuilds are expected to be delivered by the end of 2013.
Vietnam Shipping Report Q3 2013
© Business Monitor International Page 123

Evergreen Buys Boxes
To keep up with an increase in its fleet capacity, the company is acquiring new containers. In March 2013
Evergreen purchased 50,000 containers worth US$171.7mn via two subsidiaries, according Lloyd's Loading
List. Panama-registered Evergreen Greencompass Marine paid China International Marine Containers
and Singamas Container US$121.3mn for 34,050 boxes, while Evergreen UK paid CXIC Group US
$50.4mn for 15,150 containers, according to a statement from Evergreen Marine, as reported by Lloyd's
Loading List.
Evergreen In Russia's Antitrust Probe
A Russian antitrust probe targeted at least 12 container lines in February 2013, according to Lloyd's
Loading List, when their offices in Moscow and St Petersburg were visited by investigators. The list of
involved companies includes the three largest lines Maersk, MSC and CMA CGM, along with APL,
Evergreen OOCL, China Shipping, COSCO, NYK Hyundai Merchant Marine and ZIM.
According to Russia's Federal Anti-Monopoly Service (FAS), as quoted by the same source, 'the costs of
marine container transportation constitute a significant portion of the price of goods, every increase of the
transportation costs directly affects customers across the globe.'
FAS also noted antitrust investigations by European, US and some Asian countries' authorities. The EU
banned rate-setting conferences in 2008, and the European offices of 12 global lines were visited in May
2011, in what was thought to be part of the investigation into the surcharges setting procedure. It is not
known whether any of the case is to be taken any further.
Evergreen, confirmed that its offices in Russia had been visited, saying at the time that 'Evergreen staff are
co-operating fully with the FAS on this matter.'
New And Reshuffled Services
Evergreen announced a number of changes to its services in April 2013. Firstly, it extended its service
network in the Indian Ocean by launching the ISC - Mauritius - Mozambique - Africa (IMMA) Service
linking the Indian sub-continent, Indian Ocean islands and Mozambique, together with United Africa
Feeder Line (UAFL), at the end of April. Evergreen Line provides two out of three 2,500TEU vessels for
the biweekly service, with the port rotation Karachi - Mundra - Colombo - Port Louis - Tamatave - Durban -
Maputo - Nacala - Karachi.
Vietnam Shipping Report Q3 2013
© Business Monitor International Page 124
Evergreen also reshuffled its East Med feeder network, adding the Turkish port of Gebze to its Greek -
Turkey Service (GTS) and launching a new Greece - Cyprus service (GCY) with the port rotation Piraeus -
Thessaloniki - Limassol - Piraeus, instead of the existing Greece-Turkey-Malta (GTM) service.
The company reinforced its coverage of the Red Sea, joining forces with CMA CGM in the creation of the
new South Red Sea Service (SRS2) linking South East Asia, the Indian sub-continent (ISC) and Red Sea
from May 2013. The new loop adds a link to Ethiopia via Djibouti. Evergreen Line provides three out of
five 2,200TEU vessels deployed on the weekly service, with the port rotation Tanjung Pelepas - Colombo -
Djibouti - Aden (Yemen) - Jeddah (Saudi Arabia) - Port Sudan (Sudan) - Djibouti - Colombo - Port Klang -
Tanjung Pelepas.
Evergreen upgraded its Far East-South America service (ESA) and launched new Asia-West Coast of South
America (WSA2) service. For the ESA, Evergreen has teamed up with COSCO and ZIM, providing half of
the 10 8,500TEU vessels that are now being used instead of previously used 3,000TEU. The Brazilian ports
of Rio Grande and Itapoá have been added to the service rotation, making it as follows: Shanghai - Ningbo -
Yantian - Hong Kong - Singapore - Santos - Paranagua - Montevideo - Buenos Aires - Rio Grande - Itapoá -
Santos - Singapore - Hong Kong - Shanghai.
The WSA2 is a joint service with Wan Hai Line (WHL), PIL and COSCO, and links Taiwan and China
with five countries along Central and South America's west coast. The weekly WSA2 service deploys nine
3,500-3,900TEU vessels (one provided by Evergreen) for the port rotation of Kaohsiung - Shekou - Hong
Kong - Ningbo - Shanghai - Manzanillo (Mexico) - Lázaro Cárdenas (Mexico) - Puerto Quetzal
(Guatemala) - Buenaventura (Colombia) - Callao (Peru) - Guayaquil (Ecuador) - Manzanillo - Kaohsiung.
Vietnam Shipping Report Q3 2013
© Business Monitor International Page 125
COSCO Container Lines Company
Overview
COSCO Container Lines Company (COSCON) is one of the world's largest container shipping lines and
is the largest Chinese carrier, outgunning rival line China Shipping Container Lines (CSCL) in terms of
fleet capacity.
COSCON is the container-transporting arm of China COSCO Holdings Company. The company dates
back to 1961 and was originally engaged in transport solutions. It did not become a shipping company until
1993. In 2005 the firm issued an initial public offering (IPO) and now trades on the Shanghai and Hong
Kong stock exchanges. China COSCO Holdings Company is the flagship and integrated platform of
COSCO. The group is owned by the People's Republic of China.
SWOT Analysis
Strengths
■ COSCO has a good relationship with the Bank of China, which has provided the company a source ofcredit since the 1960s.
■ Its investment in a number of shipyards gives it flexibility in adapting its order book to the economicclimate.
■ The carrier has a well-diversified fleet.
Weaknesses
■ COSCON's parent, China COSCO Holdings Company, was in the red for the second year in a row in2012.
Opportunities
■ The opening of direct shipping routes between China and Taiwan is likely to provide long-term growthopportunities for COSCO's container operations.
■ The group is well placed to take advantage of growing intra-Asian trade.
Threats
■ Ongoing overcapacity in 2013 will continue to drive down rates.
■ Continued debt crises in the eurozone will affect COSCON's Asia-Europe trade.
Vietnam Shipping Report Q3 2013
© Business Monitor International Page 126
Strategy
Routes
According to COSCON's website, the liner operates more than 76 international shipping routes and 10
international feeder routes, connecting 159 principal ports in 48 different countries and regions.
Further to its international operations, COSCON also plays a key role in domestic Chinese shipping, both
coastal and on inland waterways. It operates 21 coastal routes and 67 routes on the Pearl River Delta and
Yangtze River.
As a Chinese company, COSCON is heavily exposed to the intra-Asian market, which BMI believes is a
growth area for shipping, particularly at a time when the more traditional routes are suffering from
overcapacity. In addition to its domestic Chinese services, it also has a large number of services connecting
Chinese ports with ports in other Asian countries, such as Vietnam and Indonesia. COSCON also has high
exposure to the traditional East-West 'big money' routes of Asia-Europe and transpacific.
As well as falling rates, the company has faced rising bunker fuel prices. In an effort to combat this, it has
introduced a number of bunker adjustment surcharges. It has also tried to introduce a peak season surcharge,
but with vessel supply continuing to outweigh demand, this did not hold.
Alliances
BMI's view of an increase in link-ups between lines continues to play out, with the CKYH Alliance (also
known as the Green Alliance), made up of COSCON, 'K' Line, Yang Ming and Hanjin Shipping, forming
a partnership with Taiwan's Evergreen Line. BMI believes the development of alliances will put further
pressure on carriers on the Asia-Europe route alone, leaving them with two options: join up or drop out.
The CKYH Alliance's link up with Evergreen came into force in Q212, with the carriers operating a 12-loop
service using between 96 and 132 vessels.
Alliances are nothing new. They enable comparatively smaller players to operate on major trade routes,
which they would normally be priced out of, if operating by themselves. In 2009 link-ups between lines
became common and, as BMI projected, with the global economic environment once again turning sour,
lines are joining up once more, although it should be noted on a scale we have never before witnessed. The
launch of the G6 Alliance highlights this, with members of the Grand Alliance (Hapag-Lloyd, NYK Line
Vietnam Shipping Report Q3 2013
© Business Monitor International Page 127

and OOCL) joining with members of the New World Alliance (APL, Hyundai MM and MOL) to create a
super alliance of six members.
BMI believes it is due to the launch of this mega alliance, along with the link up of MSC and CMA CGM
on the Asia-Europe route and the continued dominance of Maersk Line, that the CKYH Alliance has joined
up with Evergreen.
Further cooperation was announced in Q412, when CSCL and COSCON announced that they were to
operate their first joint domestic service linking north east China with Fujian and Shantao in the south. The
move will protect the firms, as by working together they will dominate the country's coastal shipping sector,
making it harder for outside shipping lines to break into the market.
Fleet
According to AXS Alphaliner data, as of April 26 2013 COSCON was the fifth-largest container shipping
line in the world, with a market share of 4.3%, unchanged from the previous quarter. The company's
container fleet has a capacity of 729,541 twenty-foot equivalent units (TEUs), up 1.8% from 716,868 TEUs
on December 17 2012. COSCON's fleet is made up of 161 vessels. The majority are post-Panamax vessels
with capacities of more than 4,500TEUs. The largest vessel in the COSCON fleet is the 13,386TEU-
capacity MV COSCO Belgium, delivered in February 2013.
COSCON slipped from fourth position in 2012, when it was overtaken by fellow Asian container shipping
company Evergreen. Although Evergreen has the same market share as COSCON, its capacity is slightly
larger, by just 9,200TEUs. We expect Evergreen to maintain its new position above COSCON, as it has a
massive orderbook; 49.3% of its current fleet compared to COSCON's 16.9%.
Of its 161 vessels, COSCON has a fairly balanced ratio of chartered vessels, accounting for 45.8% of the
fleet at 334,311TEUs. COSCON's owned fleet of 105 vessels makes up the remaining 395,230TEUs of
capacity. COSCON has 14 ships on order, with a total capacity of 123,473TEUs. By 2014 COSCON
projects that, between its owned and chartered-in tonnage, it will have a fleet of 850,776TEUs.
Vietnam Shipping Report Q3 2013
© Business Monitor International Page 128

Financial Results
2012
COSCON's revenues increased by 16.9% year-on-year (y-o-y) to CNY48,446mn in 2012, compared to
CNY41,437mn in 2011. Capacity grew by 13.3% and box volumes transported by the company were up
16.0%, from 6.91mn TEUs in 2011 to 8.02mn TEUs in H112. The highest revenues were earned by the
transpacific trade services (CNY14,863mn, up 21.5% y-o-y), followed by Asia-Europe, including
Mediterranean (CNY12,067mn, up 30.7%) and intra-Asia, including Australia (CNY7,318mn, up 14.3%).
H112
COSCON's H112 revenues were CNY23,117mn, a 14.1% decline from CNY20,265mn a year earlier.
Capacity had grown by 6.3% and volumes transported by the company had climbed by 16.7%, from 3.24mn
TEUs in the first half of 2011 to 3.78mn TEUs in H112. This ties in with the wider trend that BMI has been
seeing, whereby volumes transported have risen but revenues and profits have continued to suffer as a result
of overcapacity in the global fleet, which continues to worsen.
2011
COSCON moved a total of 6.91mn TEUs in 2011, an 11.2% y-o-y increase in volumes. Even so, the tough
operating environment, in which excess capacity had driven down rates and high oil prices had driven up
bunker prices and operating costs, meant that the company (like most other container shipping lines)
recorded a loss for the year. COSCO's revenues from its container shipping segment were down 11% to
CNY41.4bn, which contributed to its overall loss of CNY10.5bn (US$1.66bn) for the year, compared with a
profit of CNY6.79bn (US$1.55bn) in 2010.
Latest Activity
COSCON Receives Its Largest Vessel
MV COSCO Belgium, COSCON's largest vessel and the first of a series of eight 13,386TEU vessels being
built for COSCON by Nantong COSCO KHI Ship Engineering Co Ltd (NACKS), was christened and
delivered on February 28 2013. The COSCO Belgium will be deployed on the CKYH North Europe Express
Service 3 (NE3). All eight 13,386TEU vessels are expected to join COSCON's fleet by Q314.
Vietnam Shipping Report Q3 2013
© Business Monitor International Page 129
Russia's Antitrust Probe
A Russian antitrust probe targeted at least 12 container lines in February 2013, according to Lloyd's
Loading List, when their offices in Moscow and St Petersburg were visited by investigators. The list of
involved companies includes the three largest lines, Maersk, MSC and CMA CGM, along with APL,
Evergreen OOCL, China Shipping, COSCO, NYK Hyundai Merchant Marine and ZIM.
According to Russia's Federal Anti-Monopoly Service (FAS), as quoted by the same source, 'the costs of
marine container transportation constitute a significant portion of the price of goods, every increase of the
transportation costs directly affects customers across the globe.'
FAS also noted antitrust investigations by the European, US and some Asian countries' authorities. The EU
banned rate-setting conferences in 2008, and the European offices of 12 global lines were visited in May
2011, in what was thought to be part of the investigation into the surcharges setting procedure. At the time
of writing it was not known whether any of the case would be taken any further.
Optimising Far East-South America Service
COSCON, Evergreen Line and ZIM optimised their Far East-South America Service (ESA) from May 11
2013. The service now deploys 10 8,500TEU vessels instead of the previously used 3,000TEU vessels. The
Brazilian ports of Rio Grande and Itapoá are to be added to the service rotation, making it as follows:
Shanghai - Ningbo - Yantian - Hong Kong - Singapore - Santos - Paranagua - Montevideo - Buenos Aires -
Rio Grande - Itapoá - Santos - Singapore - Hong Kong - Shanghai.
New Asia-West Coast Of South America Service
COSCON, Evergreen Line, PIL and Wan Hai Line began a new Asia-West Coast of South America
(WSA2) service. From May 4 2013 WSA2 links Taiwan and China with five countries along Central and
South America's west coast. The weekly WSA2 service deploys nine 3,500-3,900TEU Panamax vessels for
the port rotation of Kaohsiung - Shekou - Hong Kong - Ningbo - Shanghai - Manzanillo (Mexico) - Lázaro
Cárdenas (Mexico) - Puerto Quetzal (Guatemala) - Buenaventura (Colombia) - Callao (Peru) - Guayaquil
(Ecuador) - Manzanillo - Kaohsiung. The 63 days for a round-trip service is, in COSCON's words, 'in
response to the booming Asia/ S. America market'.
Vietnam Shipping Report Q3 2013
© Business Monitor International Page 130

CKYH Asia-US East Coast Services Restructured
The CKYH Green Alliance restructured its Asia-US East Coast services from mid-April 2013. The alliance,
which is made up of COSCON, 'K' Line, Yang Ming and Hanjin Shipping, will be offering five loops on the
route, namely AWE1, AWE2, AWE3, AWE4, and AWE7. The latter is a newcomer, replacing AWE6,
suspended during the winter season 2012.
The new port rotations are as follows. AWE1: Ningbo - Shanghai - Busan - New York - Wilmington -
Savannah - Jacksonville - Busan - Ningbo. AWE2: Qingdao - Shanghai - Ningbo - Yokohama - New York -
Boston - Norfolk - Ningbo - Qingdao. AWE3: Ningbo - Shanghai - Busan - Manzanillo - Colón - Savannah
- New York - Wilmington - Busan - Ningbo. AWE4: Ho Chi Minh - Kaohsiung - Hong Kong - Yantian
(Shenzhen) - Singapore - New York - Norfolk - Savannah - Singapore - Ho Chi Minh. AWE7: Xiamen -
Hong Kong - Yantian (Shenzhen) - Busan - New York - Savannah - Charleston - Busan - Kaohsiung -
Ningbo - Xiamen.
Reshuffling Asia-North Europe And Asia-Mediterranean Services
The CKYH Green Alliance reorganised its Asia-North Europe and Asia-Mediterranean Services from early
April 2013. For Asia-North Europe the alliance suspended its NE1 service and decided not to resume the
NE4 service, which was suspended in October 2012, while retaining both NE1 and NE4 port coverage.
CKYH Asia - North Europe Service now consists of four loops (NE2, NE3, NE6 and NE7) with the
following port rotations. NE2 : Xiamen - Kaohsiung - Yantian - Singapore - Rotterdam - Hamburg -
Felixstowe - Antwerp - Port Said - Singapore - Hong Kong - Xiamen. NE3 : Xingang - Dalian - Qingdao -
Shanghai - Ningbo - Singapore - Rotterdam - Felixstowe - Hamburg - Antwerp - Hong Kong - Xingang.
NE6 : Xingang - Kwangyang - Pusan - Shanghai - Xiamen - Yantian - Singapore - Algeciras - Hamburg -
Rotterdam - Le Havre - Algeciras - Singapore - Yantian - Hong Kong - Xingang. NE7 : Ningbo - Shanghai -
Nansha - Hong Kong - Singapore - Hamburg - Rotterdam - Felixstowe - Antwerp - Singapore - Nansha -
Yantian - Kaohsiung - Ningbo.
Alliance's Asia-Mediterranean service network has a three loop structure. MD1 : Qingdao - Shanghai -
Ningbo - Yantian - Hong Kong - Nansha - Singapore - Piraeus - La Spezia - Genoa - Barcelona - Valencia -
Piraeus - Singapore - Hong Kong - Qingdao. MD2 : Ningbo - Shanghai - Xiamen - Kaohsiung - Hong Kong
- Yantian - Singapore - Port Said - Ashdod - Genoa - Barcelona - Fos - Port Said - Singapore - Hong Kong -
Vietnam Shipping Report Q3 2013
© Business Monitor International Page 131

Ningbo. MD3 : Pusan - Shanghai - Ningbo - Hong Kong - Yantian - Singapore - Port Said - Napoli -
Livorno - La Spezia - Port Said - Singapore - Ho Chi Min City - Hong Kong - Yantian - Ningbo.
Vietnam Shipping Report Q3 2013
© Business Monitor International Page 132

Macroeconomic Forecasts
BMI View: The State Bank of Vietnam's surprise decision to cut its policy rate by 100 basis points from
10.00% to 9.00% suggests that policymakers are under increasing pressure to stimulate economic growth
in 2013. We believe that the latest move will help reinforce government efforts to boost private sector
investment. Given that money supply growth remains considerably low by historical standards, we believe
that the risks of reigniting inflationary pressure remain manageable.
The State Bank of Vietnam (SBV) cut its policy rate (refinancing rate) by 100 basis points from 10.00% to
9.00% on December 24 2012, just days before the General Statistics Office published its preliminary
estimate for GDP growth to come in slightly weaker than expected at 5.0% for 2012 (compared
with Bloomberg consensus of 5.2%). The surprise rate cut came amid growing concerns that mounting bad
debt across the banking sector is deterring banks from issuing new loans to businesses, and that this could
severely undermine government efforts to reignite economic growth in 2013. From our perspective, the
move also suggests that policymakers are under increasing pressure to adopt more aggressive measures to
stimulate economic growth in an attempt to stem the growing number of bankruptcies among small-and-
medium enterprises (SMEs) and rising unemployment. This is closely in line with our view that the
Vietnamese government's economic agenda will remain skewed towards boosting growth in 2013.
Vietnam Shipping Report Q3 2013
© Business Monitor International Page 133
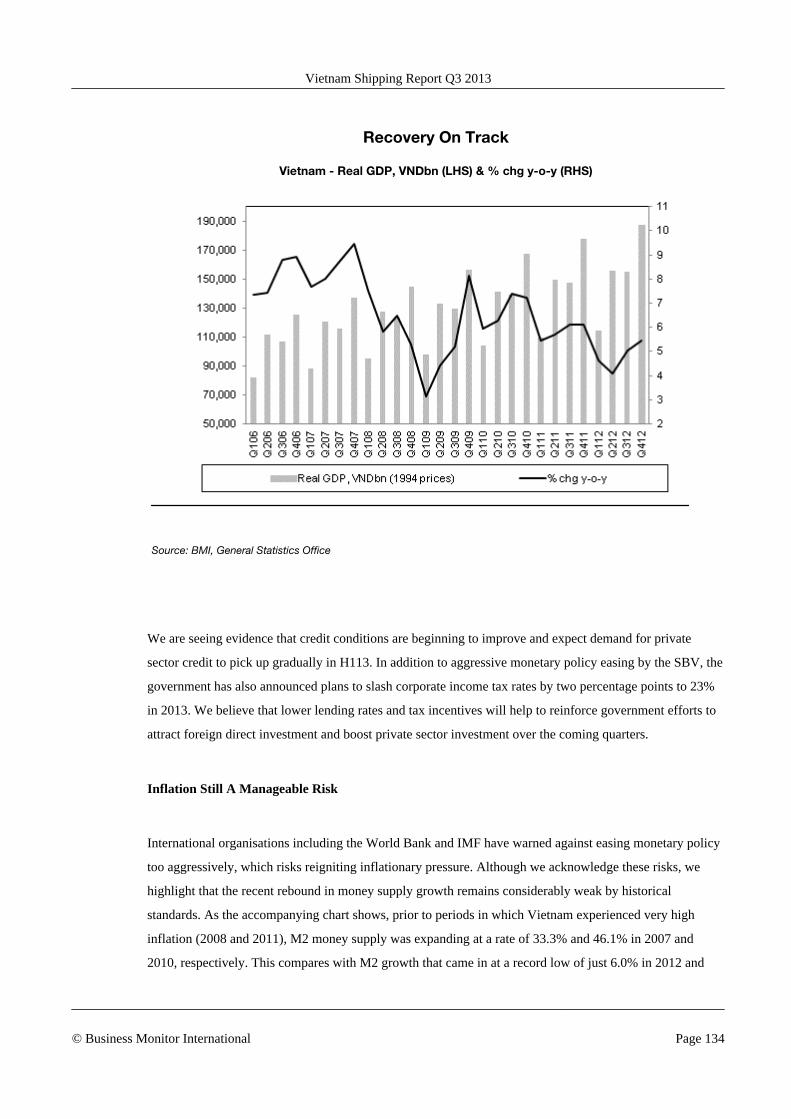
Recovery On Track
Vietnam - Real GDP, VNDbn (LHS) & % chg y-o-y (RHS)
Source: BMI, General Statistics Office
We are seeing evidence that credit conditions are beginning to improve and expect demand for private
sector credit to pick up gradually in H113. In addition to aggressive monetary policy easing by the SBV, the
government has also announced plans to slash corporate income tax rates by two percentage points to 23%
in 2013. We believe that lower lending rates and tax incentives will help to reinforce government efforts to
attract foreign direct investment and boost private sector investment over the coming quarters.
Inflation Still A Manageable Risk
International organisations including the World Bank and IMF have warned against easing monetary policy
too aggressively, which risks reigniting inflationary pressure. Although we acknowledge these risks, we
highlight that the recent rebound in money supply growth remains considerably weak by historical
standards. As the accompanying chart shows, prior to periods in which Vietnam experienced very high
inflation (2008 and 2011), M2 money supply was expanding at a rate of 33.3% and 46.1% in 2007 and
2010, respectively. This compares with M2 growth that came in at a record low of just 6.0% in 2012 and
Vietnam Shipping Report Q3 2013
© Business Monitor International Page 134
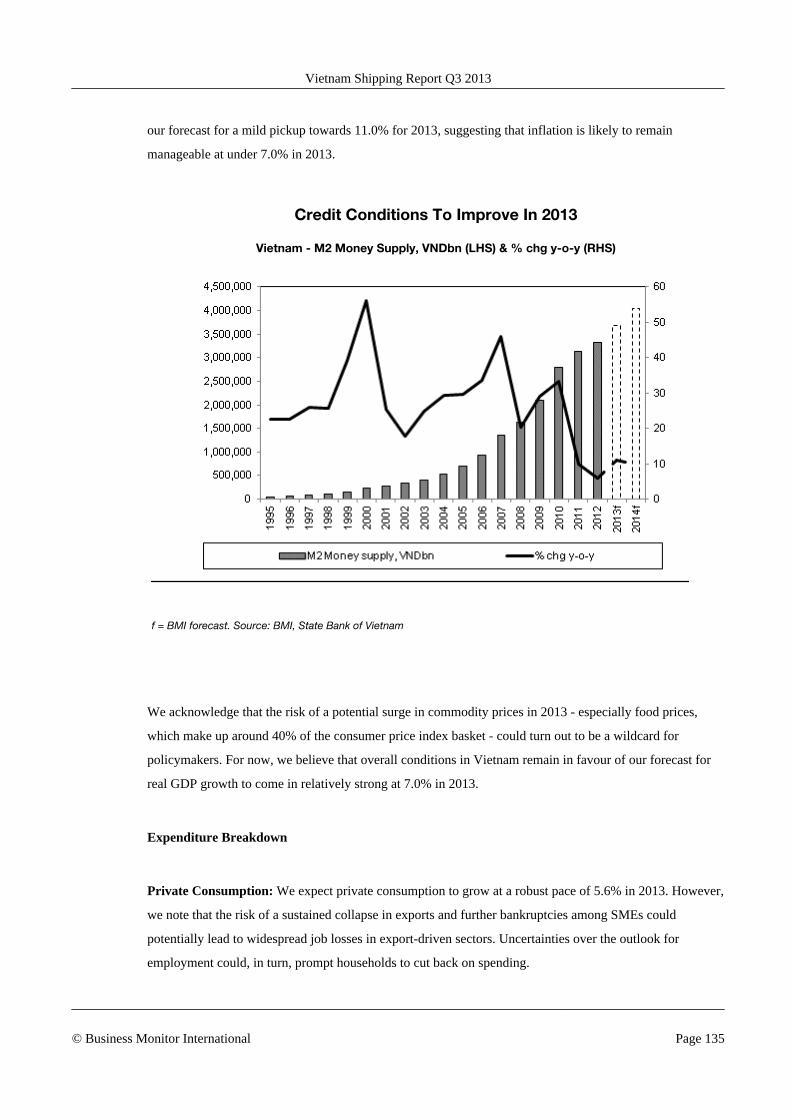
our forecast for a mild pickup towards 11.0% for 2013, suggesting that inflation is likely to remain
manageable at under 7.0% in 2013.
Credit Conditions To Improve In 2013
Vietnam - M2 Money Supply, VNDbn (LHS) & % chg y-o-y (RHS)
f = BMI forecast. Source: BMI, State Bank of Vietnam
We acknowledge that the risk of a potential surge in commodity prices in 2013 - especially food prices,
which make up around 40% of the consumer price index basket - could turn out to be a wildcard for
policymakers. For now, we believe that overall conditions in Vietnam remain in favour of our forecast for
real GDP growth to come in relatively strong at 7.0% in 2013.
Expenditure Breakdown
Private Consumption: We expect private consumption to grow at a robust pace of 5.6% in 2013. However,
we note that the risk of a sustained collapse in exports and further bankruptcies among SMEs could
potentially lead to widespread job losses in export-driven sectors. Uncertainties over the outlook for
employment could, in turn, prompt households to cut back on spending.
Vietnam Shipping Report Q3 2013
© Business Monitor International Page 135

Gross Fixed Capital Formation: We foresee a significant pickup in private sector investment growth in
2013. We believe lending rates will gradually ease over the coming months as the effect of recent rate cuts
by the SBV begins to kick in. We are also seeing evidence that credit conditions are improving.
Accordingly, we expect gross fixed capital formation growth to accelerate from 4.3% in 2012 to 5.9% in
2013.
Public Spending: We expect total public spending to remain relatively resilient in 2013, expanding at a
respectable pace of 5.4%. However, there is limited room for the government to increase spending further
owing to concerns over the need to finance a potential bailout of ailing state-owned commercial banks.
Net Exports: Net exports remain the biggest downside risk to our outlook for the Vietnamese economy,
although we expect external demand to pick up as we head into H113. Vietnam has been recording an
average monthly trade surplus of US$172mn since June 2012 (resulting in a year-to-date surplus of US
$77mn) and we see the case for a substantial pickup in external demand on the back of a rebound in
regional growth over the coming month. However, we believe that China's structural imbalances will return
in H213, becoming a drag on regional growth. Accordingly, we still expect exports to expand at a moderate
pace of 6.5% in 2013.
Table: Vietnam - Economic Activity
2009 2010 2011e 2012e 2013f 2014f 2015f 2016f 2017f
Nominal GDP,VNDbn 2 1,658,389 1,980,914 2,536,631 2,950,684 3,361,036 3,813,158 4,301,043 4,832,660 5,422,488
Nominal GDP,US$bn 2 93.16 103.53 122.82 141.44 161.59 185.42 211.56 240.43 271.12
Real GDPgrowth, %change y-o-y 2 5.3 6.8 6.0 5.0 7.0 7.2 7.2 7.0 6.9
GDP per capita,US$ 2 1,072 1,178 1,383 1,576 1,782 2,025 2,289 2,577 2,881
Population, mn3 86.9 87.8 88.8 89.7 90.7 91.6 92.4 93.3 94.1
Industrialproductionindex, % y-o-y,ave 1,4 6.7 14.1 10.9 7.0 12.0 14.0 13.0 12.0 11.0
Unemployment,% of labourforce, eop 4 6.0 4.3 4.5 6.0 4.8 4.7 4.6 4.5 4.4
Notes: e BMI estimates. f BMI forecasts. 1 at 1994 prices. Sources: 2 Asian Development Bank, General Statistics Office; 3World Bank/UN/BMI; 4 General Statistics Office.
Vietnam Shipping Report Q3 2013
© Business Monitor International Page 136
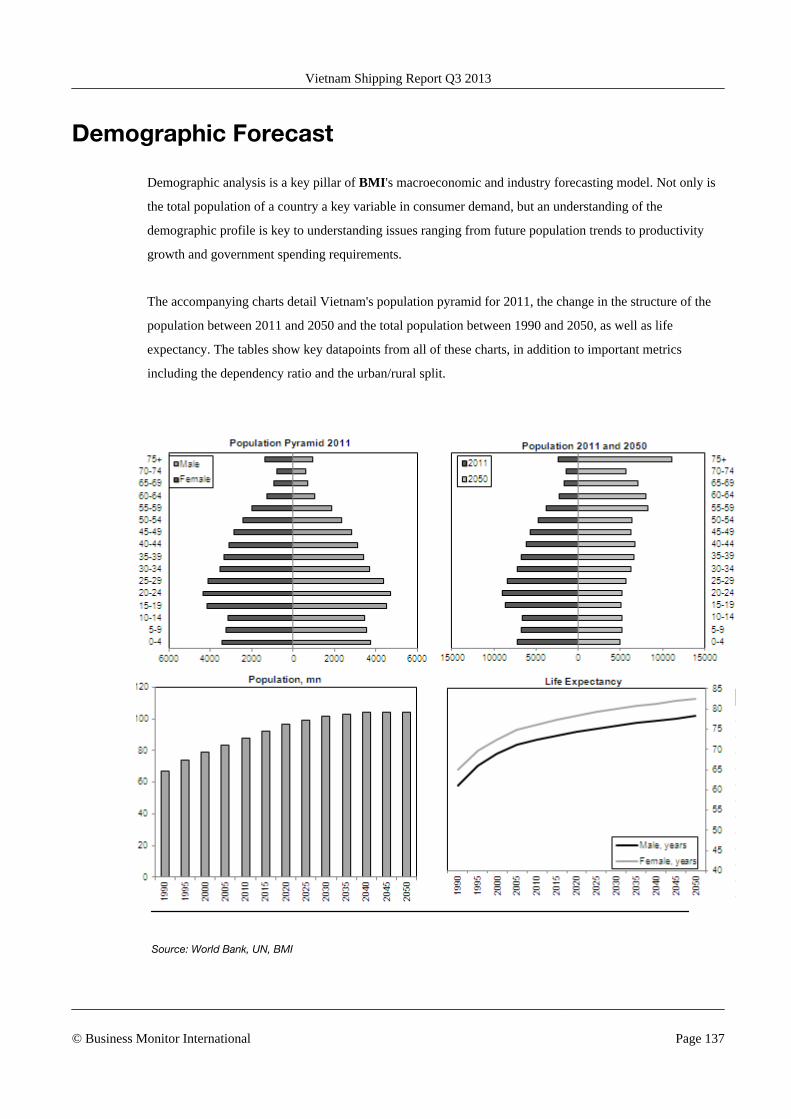
Demographic Forecast
Demographic analysis is a key pillar of BMI's macroeconomic and industry forecasting model. Not only is
the total population of a country a key variable in consumer demand, but an understanding of the
demographic profile is key to understanding issues ranging from future population trends to productivity
growth and government spending requirements.
The accompanying charts detail Vietnam's population pyramid for 2011, the change in the structure of the
population between 2011 and 2050 and the total population between 1990 and 2050, as well as life
expectancy. The tables show key datapoints from all of these charts, in addition to important metrics
including the dependency ratio and the urban/rural split.
Source: World Bank, UN, BMI
Vietnam Shipping Report Q3 2013
© Business Monitor International Page 137
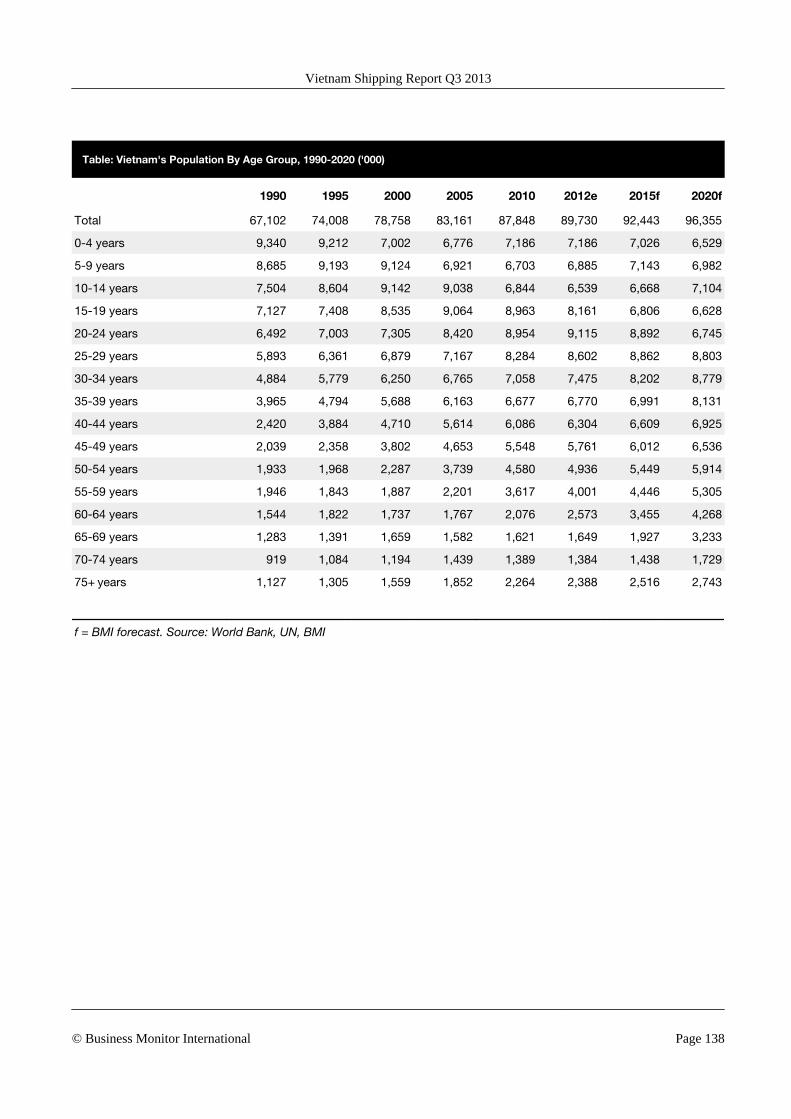
Table: Vietnam's Population By Age Group, 1990-2020 ('000)
1990 1995 2000 2005 2010 2012e 2015f 2020f
Total 67,102 74,008 78,758 83,161 87,848 89,730 92,443 96,355
0-4 years 9,340 9,212 7,002 6,776 7,186 7,186 7,026 6,529
5-9 years 8,685 9,193 9,124 6,921 6,703 6,885 7,143 6,982
10-14 years 7,504 8,604 9,142 9,038 6,844 6,539 6,668 7,104
15-19 years 7,127 7,408 8,535 9,064 8,963 8,161 6,806 6,628
20-24 years 6,492 7,003 7,305 8,420 8,954 9,115 8,892 6,745
25-29 years 5,893 6,361 6,879 7,167 8,284 8,602 8,862 8,803
30-34 years 4,884 5,779 6,250 6,765 7,058 7,475 8,202 8,779
35-39 years 3,965 4,794 5,688 6,163 6,677 6,770 6,991 8,131
40-44 years 2,420 3,884 4,710 5,614 6,086 6,304 6,609 6,925
45-49 years 2,039 2,358 3,802 4,653 5,548 5,761 6,012 6,536
50-54 years 1,933 1,968 2,287 3,739 4,580 4,936 5,449 5,914
55-59 years 1,946 1,843 1,887 2,201 3,617 4,001 4,446 5,305
60-64 years 1,544 1,822 1,737 1,767 2,076 2,573 3,455 4,268
65-69 years 1,283 1,391 1,659 1,582 1,621 1,649 1,927 3,233
70-74 years 919 1,084 1,194 1,439 1,389 1,384 1,438 1,729
75+ years 1,127 1,305 1,559 1,852 2,264 2,388 2,516 2,743
f = BMI forecast. Source: World Bank, UN, BMI
Vietnam Shipping Report Q3 2013
© Business Monitor International Page 138

Table: Vietnam's Population By Age Group, 1990-2020 (% of total)
1990 1995 2000 2005 2010 2012 2015f 2020f
0-4 years 13.92 12.45 8.89 8.15 8.18 8.01 7.60 6.78
5-9 years 12.94 12.42 11.58 8.32 7.63 7.67 7.73 7.25
10-14 years 11.18 11.63 11.61 10.87 7.79 7.29 7.21 7.37
15-19 years 10.62 10.01 10.84 10.90 10.20 9.10 7.36 6.88
20-24 years 9.68 9.46 9.27 10.13 10.19 10.16 9.62 7.00
25-29 years 8.78 8.60 8.73 8.62 9.43 9.59 9.59 9.14
30-34 years 7.28 7.81 7.94 8.14 8.03 8.33 8.87 9.11
35-39 years 5.91 6.48 7.22 7.41 7.60 7.55 7.56 8.44
40-44 years 3.61 5.25 5.98 6.75 6.93 7.03 7.15 7.19
45-49 years 3.04 3.19 4.83 5.59 6.32 6.42 6.50 6.78
50-54 years 2.88 2.66 2.90 4.50 5.21 5.50 5.89 6.14
55-59 years 2.90 2.49 2.40 2.65 4.12 4.46 4.81 5.51
60-64 years 2.30 2.46 2.21 2.12 2.36 2.87 3.74 4.43
65-69 years 1.91 1.88 2.11 1.90 1.85 1.84 2.08 3.36
70-74 years 1.37 1.46 1.52 1.73 1.58 1.54 1.56 1.79
75+ years 1.68 1.76 1.98 2.23 2.58 2.66 2.72 2.85
f = BMI forecast. Source: World Bank, UN, BMI
Vietnam Shipping Report Q3 2013
© Business Monitor International Page 139
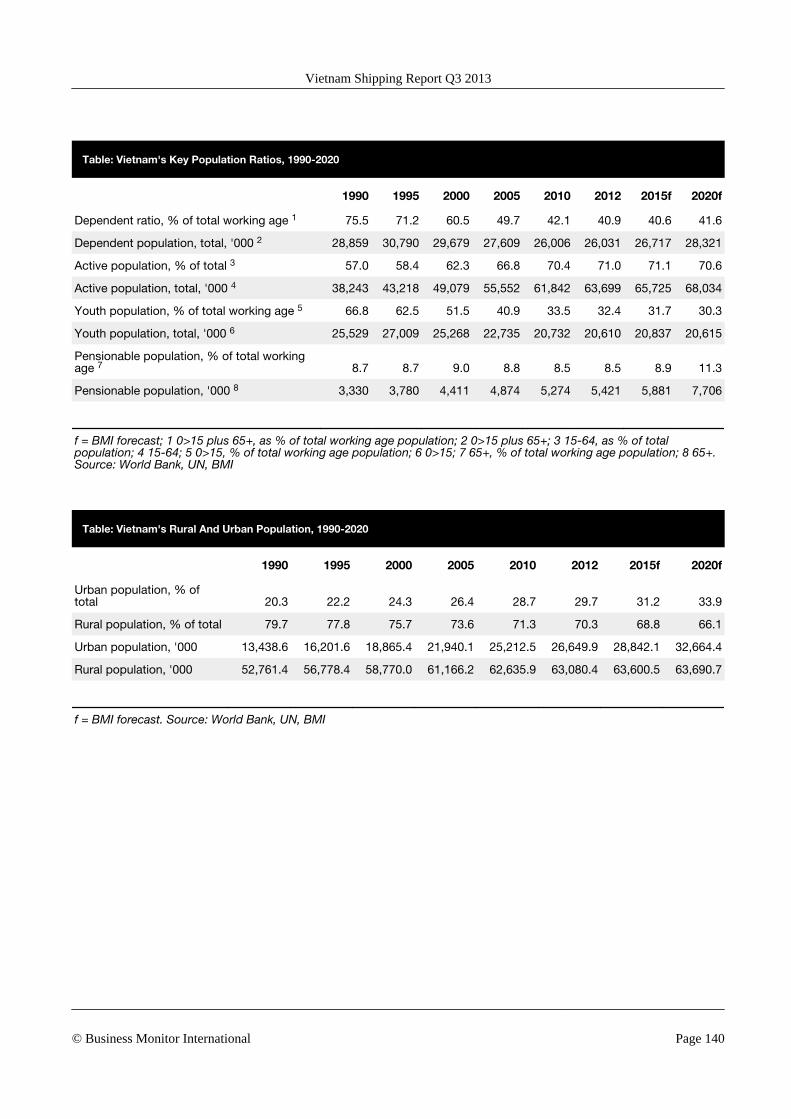
Table: Vietnam's Key Population Ratios, 1990-2020
1990 1995 2000 2005 2010 2012 2015f 2020f
Dependent ratio, % of total working age 1 75.5 71.2 60.5 49.7 42.1 40.9 40.6 41.6
Dependent population, total, '000 2 28,859 30,790 29,679 27,609 26,006 26,031 26,717 28,321
Active population, % of total 3 57.0 58.4 62.3 66.8 70.4 71.0 71.1 70.6
Active population, total, '000 4 38,243 43,218 49,079 55,552 61,842 63,699 65,725 68,034
Youth population, % of total working age 5 66.8 62.5 51.5 40.9 33.5 32.4 31.7 30.3
Youth population, total, '000 6 25,529 27,009 25,268 22,735 20,732 20,610 20,837 20,615
Pensionable population, % of total workingage 7 8.7 8.7 9.0 8.8 8.5 8.5 8.9 11.3
Pensionable population, '000 8 3,330 3,780 4,411 4,874 5,274 5,421 5,881 7,706
f = BMI forecast; 1 0>15 plus 65+, as % of total working age population; 2 0>15 plus 65+; 3 15-64, as % of totalpopulation; 4 15-64; 5 0>15, % of total working age population; 6 0>15; 7 65+, % of total working age population; 8 65+.Source: World Bank, UN, BMI
Table: Vietnam's Rural And Urban Population, 1990-2020
1990 1995 2000 2005 2010 2012 2015f 2020f
Urban population, % oftotal 20.3 22.2 24.3 26.4 28.7 29.7 31.2 33.9
Rural population, % of total 79.7 77.8 75.7 73.6 71.3 70.3 68.8 66.1
Urban population, '000 13,438.6 16,201.6 18,865.4 21,940.1 25,212.5 26,649.9 28,842.1 32,664.4
Rural population, '000 52,761.4 56,778.4 58,770.0 61,166.2 62,635.9 63,080.4 63,600.5 63,690.7
f = BMI forecast. Source: World Bank, UN, BMI
Vietnam Shipping Report Q3 2013
© Business Monitor International Page 140