Embed Size (px)
Citation preview

Viet Nam
GLOBAL FOREST RESOURCES ASSESSMENT 2015
COUNTRY REPORT
Rome, 2014

FAO, at the request of its member countries, regularly monitors the world´s forests and theirmanagement and uses through the Global Forest Resources Assessment (FRA). This country reportis prepared as a contribution to the FAO publication, the Global Forest Resources Assessment 2015(FRA 2015).The content and the structure are in accordance with the recommendations and guidelines given byFAO in the document Guide for country reporting for FRA 2015 (http://www.fao.org/3/a-au190e.pdf).These reports were submitted to FAO as official government documents.
The content and the views expressed in this report are the responsibility of the entity submitting thereport to FAO. FAO may not be held responsible for the use which may be made of the informationcontained in this report.

FRA 2015 – Country Report, Viet Nam
3
TABLE OF CONTENTSReport preparation and contact persons...............................................................................................................................41. What is the area of forest and other wooded land and how has it changed over time? ................................................. 52. What is the area of natural and planted forest and how has it changed over time? ..................................................... 183. What are the stocks and growth rates of the forests and how have they changed? .....................................................254. What is the status of forest production and how has it changed over time? .................................................................365. How much forest area is managed for protection of soil and water and ecosystem services? ..................................... 436. How much forest area is protected and designated for the conservation of biodiversity and how has it changed overtime? ................................................................................................................................................................................... 487. What is the area of forest affected by woody invasive species? .................................................................................. 518. How much forest area is damaged each year? ............................................................................................................ 549. What is the forest area with reduced canopy cover? ....................................................................................................5910. What forest policy and regulatory framework exists to support implementation of sustainable forest managementSFM? .................................................................................................................................................................................. 6011. Is there a national platform that promotes stakeholder participation in forest policy development? ............................ 6212. What is the forest area intended to be in permanent forest land use and how has it changed over time? .................. 6313. How does your country measure and report progress towards SFM at the national level? ........................................ 6614. What is the area of forest under a forest management plan and how is this monitored? ........................................... 6815. How are stakeholders involved in the management decision making for publicly owned forests? .............................. 7016. What is the area of forest under an independently verified forest certification scheme? .............................................7117. How much money do governments collect from and spend on forests? .....................................................................7318. Who owns and manages the forests and how has this changed? ..............................................................................7519. How many people are directly employed in forestry? ................................................................................................. 8020. What is the contribution of forestry to Gross Domestic Product (GDP)? .................................................................... 8321. What is forest area likely to be in the future ...............................................................................................................84

FRA 2015 – Country Report, Viet Nam
4
Report preparation and contact personsContact personsThe present report was prepared by the following person(s)
Name (FAMILYNAME, first name)
Institution/address Email Tables
Nguyen Danh Thanh Hai Forest Protection Department.Vietnam Forest Administration(VNFOREST), Ministryof Agriculture and RuralDevelopment.
Hieu Minh Vietnam Forest Administration(VNFOREST), Ministryof Agriculture and RuralDevelopment
Hoang Viet Anh Vietnam Academy of ForestScience
N/A N/A N/A N/A
Introductory TextPlace an introductory text on the content of this report
Vietnam has been carrying out National Forest Inventory, Assessment and Monitoring of Forest ResourcesChange Program since 1991. This Program aims to establish forest resource map based on ETM, SPOT images,field checks and data from primary permanent sample plots. This Program is reviewed each 5 years. The resultsof Program will be used for National Forest Development Strategy and Planning as well as National ForestDevelopment Policies.
However, data of the Program does not cover all needed information for FRA 2010. Therefore, additionalsources are used to collect data for FRA 2010 such as: Forestry Inventory and Planning Institute (FIPI),Department of Forestry (DoF), Forestry Protection Department (FPD), Forestry Support Sector Program (FSSP)and others.
Desk Study?
Check "yes" if this survey is a Desk Study, "no" otherwise
Desk Study? no

FRA 2015 – Country Report, Viet Nam
5
1. What is the area of forest and other wooded land and how has it changed over time?Documents for this question:
• Guide for country reporting FRA 2015• FRA 2015 Terms and Definitions
1.1 Categories and definitions
Category Definition
Forest Land spanning more than 0.5 hectares with trees higher than 5 meters and a canopy cover of more than10 percent or trees able to reach these thresholds in situ. It does not include land that is predominantlyunder agricultural or urban land use.
Other wooded land Land not classified as "Forest" spanning more than 0.5 hectares with trees higher than 5 meters anda canopy cover of 5-10 percent or trees able to reach these thresholds ; or with a combined coverof shrubs bushes and trees above 10 percent. It does not include land that is predominantly underagricultural or urban land use.
Other land All land that is not classified as "Forest" or "Other wooded land".
...of which with tree cover(sub-category)
Land considered as "Other land", that is predominantly agricultural or urban lands use and has patchesof tree cover that span more than 0.5 hectares with a canopy cover of more than 10 percent of trees ableto reach a height of 5 meters at maturity. It includes bothe forest and non-forest tree species.
Inland water bodies Inland water bodies generally include major rivers, lakes and water reservoirs.
Forest expansion Expansion of forest on land that, until then, was not defined as forest.
...of which afforestation(sub-category)
Establishment of forest through planting and/or deliberate seeding on land that, until then, was notdefined as forest.
...of which naturalexpansion of forest (sub-category)
Expansion of forests through natural succession on land that, until then, was under another land use(e.g. forest succession on land previously used for agriculture).
Deforestation The conversion of forest to other land use or the longterm reduction of the tree canopy cover below theminimum 10 percent threshold.
...of which humaninduced (sub-category)
Human induced conversion of forest to other land use or the permanent reduction of the tree canopycover below the minimum 10 percent threshold.
Reforestation Natural regeneration or re-establishment of forest through planting and/or deliberate seeding on landalready in forest land use.
...of which artificialreforestation (sub-category)
Re-establishment of forest through planting and/or deliberate seeding on land already in forest land use.
1.2 National data
1.2.1 Data sources
References to sourcesof information
Variables Years Additional comments
1 Database of Forest Inventoryand Planning Institute (FIPI)and Ministry of Agricultureand Rural Development(MARD )
N/A 1992 N/A

FRA 2015 – Country Report, Viet Nam
6
2 Database of Forest Inventoryand Planning Institute (FIPI)and MARD
N/A 1995 N/A
3 Database of Forest Inventoryand Planning Institute (FIPI)and MARD
N/A 2000 N/A
4 Database of Protection Forestdepartment (PFD) and FIPI
N/A 2002 N/A
5 Database of Protection ForestDepartment (PFD) and FIPI
N/A 2003 N/A
6 National program forsurveying, evaluating thechanges of forest resources
N/A 2005 N/A
7 National program forsurveying, evaluating thechanges of forest resources
N/A 2010 N/A
8 Database of Protection ForestDepartment (PFD)
N/A 2004 N/A
9 National plan for forestprotection and development2011 - 2020
2015 trend prediction 2010 N/A
1.2.2 Classification and definitions
National class Definition
Forest A site of at least 0.5 ha, with trees higher than 3 m and thecanopy cover 0.3 or the growing stock over than 30m3/ha.It includes forest plantations. - Bamboo of such a mentionedcanopy and at least 5000 stem/ha.
Unused land Land Type I C The IC means
Afforestation Same as 2015 definition.
Reforestation Re-establishment of forest through planting and/or deliberateseeding on land classified as forest. (Same to FAO definition in2010)
Natural expansion of forest Expansion of forests through natural succession on land that,until then, was under another land use (e.g. forest succession onland previously used for agriculture). (Same to FAO definition in2010 and in 2015)
1.2.3 Original data
The general statistics office of Vietnam ( http://www.gso.gov.vn /) provides following national statistics forthe year 2012.
All country 33095.1

FRA 2015 – Country Report, Viet Nam
7
Agriculture land 26280.5
Agriculture production land 10151.1
Annual crop 6401.3
Rice 4092.8
Grass land for grazing 45.5
Other annual crop 2263.0
Perennial crop 3749.7
Forestry land 15373.1
Production forest 7406.6
Protection forest (soil and water protection) 5827.3
Special use forest 2139.2
Aquaculture land 712.0
Salt production land 17.9
Other agriculture land 26.5
None agriculture land 3740.6
Residential land 690.9
Urban residential land 141.3
Rural residential land 549.6
Special used land 1846.8
Office and official building land 19.6
Military land 331.0
None-agriculture production land 267.3
Public used land 1228.9
Religious land 14.9
Cementary land 101.0
Special use water body 1082.9

FRA 2015 – Country Report, Viet Nam
8
Other none-agriculture land 4.1
Un-used land 3074.0
Flat un-used land 235.8
Hilly un-used land 2549.0
Rocky mountain un-used land 289.2
Forest area in 2005 data from Forset Protection Department
Forset type 2005 By forest function
Protection Special use Production
Total Area 33019611 0 0 0
I. Forested land 12616699.7 6172061.94 1958320.24 4486317.52
A. Natural forest 10283173.2 5302651.79 1874828.5 3105692.91
1. Woody forest 8113580.35 4148209.1 1498289.28 2467081.97
2. Bamboo foret 783667.26 341889.33 83500.02 358277.91
3. Mixed woody +bamboo forest
684957.54 314706.82 119118.17 251132.55
4. Mangrove 63263.49 40458.43 11009.85 11795.21
5. Rocky mountainforest
637704.51 457388.11 162911.18 17405.22
B. Plantation forest 2333526.48 869410.15 83491.74 1380624.59
1. Plantation forestwith volume
825485.13 317187.58 32208.27 476089.28
2. Youngplantation forestwithout volume
1209882.45 468992.63 48132.91 692756.91
3. Bamboo 86911.43 11133.16 235.31 75542.96
4. Industrial tree(cashew, rubber,other)
211247.47 72096.78 2915.25 136235.44
II. Bare land 6411989.85 3377416.69 417715.8 2616857.36

FRA 2015 – Country Report, Viet Nam
9
1. Ia (bare landwith only grass)
1968270.06 980905.34 119843.96 867520.76
2. Ib (bare landwith shrub)
2071765.87 1041230.27 134433.96 896101.64
3. Ic (bareland withshrub + scatter woodytree)
1790787.81 944022.63 142922.28 703842.9
4. rocky mountainwithout forets
344575.58 240359.81 16187.76 88028.01
5. Sand dune,swamp
236590.53 170898.64 4327.84 61364.05
III. Other land 13990921.5 0 0 0
The general statistics office of Vietnam ( http://www.gso.gov.vn /) provides following national statistics forthe year 2007.
Land Use in 2007 Total area in 000 ha
Agricultural land 9,407
Annual crops land 5,978
Miscellaneous gardens 623
Perennial crops land 2,213
Weed land for animal raising 40
Water surface land for fishing 553
Forestry land covered by trees 12,051
Specially used land 1,615.9
Homesteadland 451.3
Unused land and river, spring, mountain 9,405
FRA 2015 – Country Report, Viet Nam
10
Unused flat land 536
Unused mountainous land 7,137
Unused water surface land 150
River and spring 749
Non tree rock mountain 618
Other unused land 215
WHOLE COUNTRY 32,930
Forest area in “000”haFRACategory
1990 1995 2000 2002 2003 2005 2007
Naturalforest
8,396 8,252 9,675 9,879 10,004 10283 10,284
Plantationforest
745 1,050 1,638 1,914 2,090 2,334 2,553
Totalforest
9,141 9,302 11,315 11,793 12,094 12,617 12 837
RubberPlantations
222 278 412 429 436 460 550
OtherWoodedland
na na 1,816 2,166 2,082 1,791 1,524
OtherLand withtrees
na na na na na na n.a.
Source of data year 2005, 2007: Forest Protection Department, Forestry Program No.32, data of rubberplantation is collected by Center for Information and Statistics of Ministry of Agriculture and RuralDevelopment.
Forest expansion, reforestation
There is no data of plantation of each species. The following is main species for plantations:
TT Common name Scientific name

FRA 2015 – Country Report, Viet Nam
11
1 Lát Mexico Cedrela odorata
2 Lát hoa Chukrasia tabularia A.Juss
3 Trám trắng Canarium album (Lour.)Raeusch
4 Keo lai Acacia mangium x Acacia.Auriculiformis
5 Keo tai tượng Acacia mangium Wild
6 Keo lá tràm Acacia auriculiformis
7 Keo lưỡi liềm Acasia crassicarpa A.Cunn. exBenth
8 Bạch đàn Urophylla Eucalyptus. urophyllaS.T.Blake
9 Bạch đàn Camall Eucalyptus camaldulensisDehanh
10 Phi lao Casuarina equesetifolia Forst etForst f
11 Xà cừ Khaya senegalensis (Desr)A.Fuss
12 Hoè Sophora Japonica L
13 Trẩu Vernicia montana
14 Xoan ta Melia azedarach
15 Tếch Tectona grandis
16 Mỡ Mangletia conifera Dandy
17 Bồ đề Styrax tonkinensis (Pierre)Craib ex Hardw
18 Chè đắng Ilex kaushue S.Y.Hu
19 Tông dù Toona sinensis (A.Juss)M.Roem
20 Tre điềm trúc Dendracalamus ohlami Kengf
21 Luồng Dendrocalamus membranceusMunro
22 Trúc sào Phyllostachys pubescens Majielex.H.de lehaie

FRA 2015 – Country Report, Viet Nam
12
23 Quế Cinnamomum casia (L.) J.Presl
24 Thông mã vĩ Pinus masoniana Lamb
25 Thông nhựa Pinus merkusii Jungh.et.deVries
26 Thông caribê Pinus caribaea Morelet
27 Thông 3 lá Pinus kesiya Royle ex Gordon
28 Sa mộc Cinnamomum casia (L.) J.Presl
29 Hồi Illicium verum Hook.f
30 Sồi phảng (dẻ bốp, cồng) Lipthocarpus fissus Champ. exbenth
31 Huỷnh Tarrietia javanica Blume
32 Dó trầm Aquilarria crassna Pierre exlecomte
33 Bông gòn Ceiba pentandra (L.) Gaertn
34 Dầu rái Dipterocapus alatusRoxb.Ex.G.Don
35 Sao đen Hopera odorata Roxb
36 Giổi xanh Michelia meriocris Dandy
37 Bơì lời đỏ Litsea glutinosa (Lowr.)C.B.Rob
38 Xoan mộc Toona suremi Blume Merr
39 Đước Rhizophora apiculata Blume
40 Tràm cừ Melaleuca cajuputi Powell
41 Tràm Lơca Melaleuca leucadendra L
1.3 Analysis and processing of national data
1.3.1 Adjustment
Forest area

FRA 2015 – Country Report, Viet Nam
13
Forest area in “000”haFRACategory
1990 1995 2000 2005 2010 2011 2012
Naturalforest
8,396 8,252 9,675 10,283 10,305 10,285 10,424
Plantationforest
745 1,050 1,638 2,334 3,083 3,230 3,438
RubberPlantations
222 278 412 460 740 802 911
OtherWoodedland
1,816 1,791
Otherland
21 644 21 427 17 466 16 139 16 395 16 139 16 096
OtherLand withtrees
na na na na na na n.d.a.
Inlandwaterbody
1,924 1924 924 1,924 1,924 1,924 1,924
TotalArea ofCountry
32,931 32,931 32,931 32,931 32,931 32,931 32,931
Source of data year 2005: Forest Protection Department, Forestry Program No.32, data of rubber plantation iscollected by Center for Information and Statistics of Ministry of Agriculture and Rural Development.
Calibration is carried out in order to ensure that the total land area/country area match the official UN statisticsin FAOSTAT.
FAOSTAT figures for 2005:
Land area: 31 007 (000ha)
Inland water: 1 924 (000ha)
Country area: 32 931 (000ha)

FRA 2015 – Country Report, Viet Nam
14
The difference between the total country area and the sum of forest, other wooded land and inland water hasbeen considered as other land.
1.3.2 Estimation and forecasting
Forest area
Only forecasting has been done to develop figures for Forest (natural forest, forest plantation) for 2010 sincethe original figures for 1990, 2000, 2005 and 2007 are available. The rubber plantation in year 2010 (630 ha)is come from the rubber development plan.
To use the long time series data in case of natural forests and forest plantation the regression method has beenused.
FRA Category Forest area in “000”ha
2015 2000 2005 2010
Natural forest 10,654 9,675 10,283 10,305
Plantation forest 3,239 1,638 2,334 3,083
RubberPlantations
800 412 460 740
Other Woodedland
NA 1,816 1,791
Other land 21 644 17 466 16 139 16,087
Other Land withtrees
n.d.a. n.d.a. n.d.a. n.d.a.
Inland water body 1924 1924 1924 1924
Total Area ofCountry
32,931 32,931 32,931 32,931
Other wooded land and other land
Other wooded land has been recalculated based on Vietnam original data for 2000, 2005 and 2007.
The other land has beed deducted accordingly (the figure is close to the original data provided above).
Vietnam original data

FRA 2015 – Country Report, Viet Nam
15
1990 2000 2005 2007 2010 2015
OtherWooded land
1841 1816 1791 1524 1124 456
1.3.3 Reclassification
Forest area
Percentage of a national class belonging to FRA classNational landuse classes
Forest Other woodedland
Other land withtree
Other land
Natural Forest 100
Plantation Forest 100
Rubber Plantation 100
Other woodedland
100
1.4 DataTable 1a
Area (000 hectares)Categories
1990 2000 2005 2010 2015
Forest 9363 11727 13077 14128 14773
Other wooded land 1841 1816 1791 1124 456
Other land 21166 17563 16139 15755 15778
... of which with tree cover N/A N/A N/A N/A N/A
Inland water bodies 554 1818 2114.2 2088.7 2088.7
TOTAL 32924.00 32924.00 33121.20 33095.70 33095.70
Table 1b
CategoriesAnnual forest establishment /loss (000 hectares per year)
...of which of introducedspecies (000 hectares per year)

FRA 2015 – Country Report, Viet Nam
16
1990 2000 2005 2010 1990 2000 2005 2010
Forest expansion 37.98 175.084 682.157 304.473 N/A N/A N/A N/A
... of which afforestation 32.26 118.245 138.92 197.571 N/A N/A N/A N/A
... of which naturalexpansion of forest
5.72 56.839 543.237 106.902 N/A N/A N/A N/A
Deforestation N/A N/A N/A 3.942 N/A N/A N/A N/A
... of which human induced N/A N/A N/A 3.942 N/A N/A N/A N/A
Reforestation 116.72 209.54 327.785 37 N/A N/A N/A N/A
... of which artificial N/A N/A N/A 37 N/A N/A N/A N/A
Tiers
Category Tier for status Tier for reported trend
Forest Tier 3 Tier 2
Other wooded land Tier 1 Tier 1
Forest expansion Tier 3 Tier 2
Deforestation Tier 3 Tier 2
Reforestation Tier 3 Tier 2
Tier criteria
Category Tier for status Tier for reported trend
• Forest• Other wooded land• Afforestation• Reforestation• Natural expansion of forest• Deforestation
Tier 3 : Data sources: Either recent(less than 10 years ago) National ForestInventory or remote sensing, with groundtruthing, or programme for repeatedcompatible NFIs Tier 2 : Data sources:Full cover mapping / remote sensing orold NFI (more than 10 years ago) Tier 1 :Other
Tier 3 : Estimate based on repeatedcompatible tiers 3 (tier for status) Tier 2 :Estimate based on repeated compatible tier2 or combination tier 3 and 2 or 1 (tier forstatus) Tier 1 : Other
1.5 Comments
CategoryComments related todata definitions etc
Comments on the reported trends
Forest The country report has added areaof rubber in the area of forest for thepurposes of reporting to FRA only.
Data of year year 2010 is calculatedbased on its interrelation for: (i) Forest và(ii) Other wooded land). Trend predictionfor 2015 is based on "National plan forforest protection and development 2011 -2020"

FRA 2015 – Country Report, Viet Nam
17
Other wooded land N/A Decline in OWL is due to conversion ofmany OWL areas into forest plantation orestate crops
Other land For reporting to FRA purposes only, thecountry report has adopted the FAOSTATfigures and has adjusted all the differencesin area of "Other land".
N/A
Other land with tree cover N/A N/A
Inland water bodies N/A Increase in inland water body figuresbetween 1990, 2000,2005, 2010 is due tocreation of many new hydro-power damsin Vietnam. Between 1990 to 2010 thereare more than 50 hydro-power plants wereput into operation
Forest expansion The same to FRA 2010 Data of natural expansion has changedso much because Vietnam launched the5 million ha of reforestation programme.Natural expansion forest is one componentin the programme. The farmers getforestry land and they want to improvenatural forest by natural regeneration.
Deforestation N/A N/A
Reforestation Data is calculated from plantation Woodremovals and average yield per ha.
We have no data for reforestationevery year. Area of reforestation areincluded in afforestation. But from othersource, reforestation can calculatedfor reforestation: Most of plantationare belonged to households or forestcompanies. After cutting on plantationarea which are plated in the same yearor next year because the land is suitablefor planting. these areas are plantedin priority. From harvesting wood onplantation and average yield per ha ofplantation we calculate the area of cutting.This area is reforestation per year.
Other general comments to the table
Vietnam has launched the program of forest resources inventory and monitoring every 5 year. Earlier the data of forest waspublished by the government at interval of 5 years but from 2002 data the data is ratified and published every year. The forestryofficer of each commune yearly sends the data to higher level, which is finally aggregated at the national level. The Forest inventoryand planning institute (FIPI) directly collects and analyses the data through its Forest Resources Inventory Assessment andMonitoring Program (FRIAM). The data from Protection Forest Department (PFD) is the statistics collected from local level up tonational level.

FRA 2015 – Country Report, Viet Nam
18
2. What is the area of natural and planted forest and how has it changed over time?Documents for this question:
• Guide for country reporting FRA 2015• FRA 2015 Terms and Definitions
2.1 Categories and definitions
Term Definition
Naturally regeneratedforest
Forest predominantly composed of trees established through natural regeneration.
Naturalized introducedspecies
Other naturally regenerated forest where the tree species are predominantly non-native and do not needhuman help to reproduce/maintain populations over time.
Introduced species A species, subspecies or lower taxon occurring outside its natural range (past or present) and dispersalpotential (i.e. outside the range it occupies naturally or could occupy without direct or indirectintroduction or care by humans).
Category Definition
Primary forest Naturally regenerated forest of native species where there are no clearly visible indications of humanactivities and the ecological processes are not significantly disturbed.
Other naturallyregenerated forest
Naturally regenerated forest where there are clearly visible indications of human activities.
...of which of introducedspecies (sub-category)
Other naturally regenerated forest where the trees are predominantly of introduced species.
...of which naturalized(sub-sub category)
Other naturally regenerated forest where the trees are predominantly of naturalized introduced species.
Planted forest Forest predominantly composed of trees established through planting and/or deliberate seeding.
...of which of introducedspecies (sub-category)
Planted forest where the planted/seeded trees are predominantly of introduced species.
Mangroves Area of forest and other wooded land with mangrove vegetation.
...of which planted (sub-category)
Mangroves predominantly composed of trees established through planting.
2.2 National data
2.2.1 Data sources
References to sourcesof information
Variables Years Additional comments
1 Data base of FIPI and MARD Characteristics 1992 N/A
2 Data base of FIPI and MARD Characteristics 1995 N/A
3 Data base of FIPI and MARD Characteristics 2000 N/A
4 Database of PFD and FIPI Characteristics 2002 N/A

FRA 2015 – Country Report, Viet Nam
19
5 Database of PFD and FIPI Characteristics 2003 N/A
6 Database of PFD and FIPI Characteristics 2005 N/A
7 Database of PFD and FIPI Characteristics 2010 N/A
2.2.2 Classification and definitions
National class Definition
Rich Forest Forest of native species, where there are no clearly visibleindications of human activities, the ecological processes are notsignificantly disturbed and they contain high standing volume(the forest type IV or IIIB).
Impact natural forest Forest of naturally regenerated native species where there areclearly visible indications of human activities.
Semi-natural Forest of native species, established through planting, seeding orassisted natural regeneration. But in Vietnam it is not separatesemi-natural from impact Natural forest . So that semi-naturalforest is included in impact Natural forest.
Productive plantation Forest of introduced species and in some cases native speciesestablished through planting or seeding mainly for production ofwood or non-wood goods.
Protective plantation Forest of native or introduced species, established throughplanting or seeding mainly for provision of services. Forest ofnative species which is established on bio-diversity open land isincluded protective plantation in the national reporting table.
2.2.3 Original data
Area in “000” ha.NationalCategory
Sub-Category
1990 1995 2000 2005 2010
Naturalforest
Rich forest 384 289 187 85 CK4
Other foresttypes
8,012 7,963 9,488 10,198 CK4
Total 8,396 8,252 9,675 10,283 CK4
Plantationexcludingrubber
Production 442 623 972 KTRA KTRA

FRA 2015 – Country Report, Viet Nam
20
Protection 272 384 599 KTRA KTRA
Bio-diversity
31 43 67 KTRA KTRA
745 1,050 1,638 2,648 KTRA
Rubber 222 278 412 460 740
2.3 Analysis and processing of national data
2.3.1 Adjustment
2.3.2 Estimation and forecasting
A. Rich Forests
The rich forest area in 2005 has been forecasted with the help of linear extra-polation using data of two lastpoints in time (1995 and 2000) since regression is not advisable with only three points in time.
The area of Rich forest in 2010 = CK4 (000 ha)
The area of reach forest in 2015 = ????????? (000 ha)
B. Other forest types
The area of other forest types for 2005 is simply the area of natural forests in 2005 (Table 1) after excludingthe above area of rich forests in 2005.
The area of “Other forest types” in natural forests in 2010 = CK4 (Total of Natural forest area)
– CK4 (Rich forest area)= ???????? (000 ha)
The area of “Other forest types” in natural forests in 2015 = ???????? (Total of Natural forest area)
– ??????? (Rich forest area)= ????????? (000 ha)

FRA 2015 – Country Report, Viet Nam
21
C. Area of Plantations
To capture the latest trend in relative categories (Productive, Productive and biodiversity conservation) ofplantations the ratio among different categories of plantations in 2003 have been applied to the total area offorest plantation (excluding rubber) forecasted for 2005 in Table 1 and the same has been done for 2010.
Forest area in “000”ha FRACategory
1,990 1,995 2,000 2,002 2,003 2,005 2,007 2,010
Naturalforest
8,396 8,252 9,675 9,879 10,004 10,283 10,284 10,305
Plantationforest
745 1,050 1,638 1,914 2,090 2,334 2,553 3,083
RubberPlantations
222 278 412 429 436 460 550 740
Totalforest
9,363 9,580 11,725 12,222 12,530 13,077 13,387 14,128
Category ofPlantation
2003 % Area in 2005(000 ha)
Area in 2010(000 ha)
ProductionPlantations
1,238 59 1 382 2276
ProtectionPlantations
760 36 849 614
Bio-diversityPlantations
92 4 103 80
Total 2,090 2334 2960
Category 1990 2000 2005 2010

FRA 2015 – Country Report, Viet Nam
22
Rich forest 384 187 85 80
Other forest types 8012 9488 10198 10260
ProductionPlantations
442 972 1383 1707
ProtectionPlantations
272 599 849 1048
Bio-diversityPlantations
31 67 103 127
RubberPlantations
222 412 460 630
Total 9,363 11,725 13,077 13,798
2.3.3 Reclassification
FRA 2005 CategoryNational Category
Primary Other Naturallyregenerated forest
Planted forest
Rich forest 100
Other forest types 100
Production Plantations 100
Protection Plantations 100
Bio-diversityPlantations
100
Rubber Plantations 100
2.4 DataTable 2a
Forest area (000 hectares)Categories
1990 2000 2005 2010 2015
Primary forest 384 187 85 83 83

FRA 2015 – Country Report, Viet Nam
23
Other naturally regeneratedforest
8012 9488 10283 10222 11027
... of which of introducedspecies
N/A N/A N/A N/A N/A
... of which naturalized N/A N/A N/A N/A N/A
Planted forest 967 2052 2709 3823 3663
... of which of introducedspecies
N/A N/A N/A N/A N/A
TOTAL 9363.00 11727.00 13077.00 14128.00 14773.00
Table 2b
Primary forest converted to (000 ha)
1990-2000 2000-2010 2010-2015
Othernatural
regenerationPlanted Other land
Othernatural
regenerationPlanted Other land
Othernatural
regenerationPlanted Other land
N/A N/A N/A N/A N/A N/A N/A N/A N/A
Table 2c
Area (000 hectares)Categories
1990 2000 2005 2010 2015
Mangroves (forest and OWL) 73 70.684 62.073 261.74 270
... of which planted N/A N/A N/A 207.835 N/A
Tiers
Category Tier for status Tier for reported trend
Primary forest Tier 3 Tier 2
Other naturally regenerated forest Tier 3 Tier 2
Planted forest Tier 3 Tier 2
Mangroves Tier 3 Tier 2
Tier Criteria
Category Tier for status Tier for reported trend

FRA 2015 – Country Report, Viet Nam
24
Primary forest/Other naturally regeneratedforest/Planted forest
Tier 3 : Data sources: Recent (less than10 years) National Forest Inventory orremote sensing with ground truthing ordata provided by official agencies orprogramme for repeated compatible NFIsTier 2 : Data sources: Full cover mapping/remote sensing or old NFI (more than 10years) Tier 1 : Other
Tier 3 : Estimate based on repeatedcompatible tiers 3 (tier for status) Tier 2 :Estimate based on repeated compatible tier2 or combination tier 3 and 2 or 1 (tier forstatus) Tier 1 : Other
2.5 Comments
CategoryComments related todata definitions etc
Comments on reported trend
Primary forest There is data of primary forest convertedto other in total but no specific forcategories as referring on table 2b
N/A
Other naturally regenerating forest N/A N/A
Planted forest N/A N/A
Mangroves Data for 1990 were calculated fromLandsat TM and ground survey. Data for2000 were calculated from Landsat TM,2005 and 2010 from SPOT 5. Data for2010 is including plantation Mangrovewhich was not accounted before in FRA2010. That is why the value of 2010 isincreased.
Data from 1990 to 2005 do not includeMangroves plantation.
Other general comments to the table
N/A

FRA 2015 – Country Report, Viet Nam
25
3. What are the stocks and growth rates of the forests and how have they changed?Documents for this question:
• Guide for country reporting FRA 2015• FRA 2015 Terms and Definitions
3.1 Categories and definitions
Category Definition
Growing stock Volume over bark of all living trees with a minimum diameter of 10 cm at breast height (or abovebuttress if these are higher). Includes the stem from ground level up to a top diameter of 0 cm,excluding branches.
Net Annual Increment(NAI)
Average annual volume of gross increment over the given reference period less that of natural losses onall trees, measured to minimum diameters as defined for "Growing stock".
Above-ground biomass All living biomass above the soil including stem stump branches bark seeds and foliage.
Below-ground biomass All biomass of live roots. Fine roots of less than 2 mm diameter are excluded because these often cannotbe distinguished empirically from soil organic matter or litter.
Dead wood All non-living woody biomass not contained in the litter either standing lying on the ground or in thesoil. Dead wood includes wood lying on the surface dead roots and stumps larger than or equal to 10 cmin diameter or any other diameter used by the country.
Carbon in above-groundbiomass
Carbon in all living biomass above the soil including stem stump branches bark seeds and foliage.
Carbon in below-groundbiomass
Carbon in all biomass of live roots. Fine roots of less than 2 mm diameter are excluded because theseoften cannot be distinguished empirically from soil organic matter or litter.
Carbon in dead wood Carbon in all non-living woody biomass not contained in the litter, either standing, lying on the ground,or in the soil. Dead wood includes wood lying on the surface, dead roots and stumps larger than or equalto 10 cm in diameter or any other diameter used by the country.
Carbon in litter Carbon in all non-living biomass with a diameter less than the minimum diameter for dead wood (e.g.10 cm ) lying dead in various states of decomposition above the mineral or organic soil.
Soil carbon Organic carbon in mineral and organic soils (including peat) to a soil depth of 30 cm.
3.2 National data
3.2.1 Data sources
References to sourcesof information
Variables Years Additional comments
1 Forest Inventory andPlanning Institute and MARD
Growing stock 1989 N/A
2 Forest Inventory andPlanning Institute and MARD
Growing stock 1995 N/A
3 Forest Inventory andPlanning Institute and MARD
Growing stock 1999 N/A
4 FRA 2010 guidelines default values for AG-Biomass and BG-Biomass;default values for carbon
N/A Annex 5

FRA 2015 – Country Report, Viet Nam
26
5 Forest Inventory andPlanning Institute and MARD
Growing stock 2005 N/A
6 Forest Inventory andPlanning Institute and MARD
Growing stock 2010 N/A
3.2.2 Classification and definitions
National class Definition
Growing stock Volume over bark of all living trees more than 8 cm in diameterat breast height (1.3 m). Includes the stem from ground level orstump height up to a top of the tree.
N/A As required by FAO, forest growing stock should be calculatedfor volume with bark. Vietnam definition on the mentionedentities is mainly similar to FAO proposal, however stock isnot calculated for the land with trees with stock. According toVietnam definition, the stock only accounts for forest with stockat least of 30m3/ha and upward. Some of the regulated stockthresholds for calculation can bee seen below
Growing stock It is the over bark standing volume of (standing) trees withdiameter of 10 cm and more at the breast height (dbh) or abovethe buttress (if higher than breast height). Explanation: Itincludes the stump above the ground surface with minimumdiameter of 10 cm. It includes volume of merchantable branchesup to a diameter of 5 cm
N/A No information on national classification and definitions relevantto the biomass and carbon stock is available
3.2.3 Original data
Growing stock
The FIPI carried out a complete national forest inventory in 1989 but only for the natural forests and submittedto government for publication. From 1991 – 1995, FIPI implemented the program on assessment and monitoringthe change of forest resources. The program assessed the state of forest on 5-year cycle. It provided data in1995. The FIPI carried out another complete national forest inventory in 1999 and that covered both the naturalforest and the plantations.
Following table contains national data on over bark growing stock reflecting stem volume including volume ofmerchantable branches up to a diameter of 5 cm.
Unit: area: ,000ha; Volume: ,000m 3
Categories
1989 1995 1999

FRA 2015 – Country Report, Viet Nam
27
Area Growingstock
Area Growingstock
Area Growingstock
NaturalForest
8,396 638,096 8,252 627,152 9,676 754,728
PlantationForest
745 n.a. 1,050 22,050 1,639 31,141
Total 9,141 n.a. 9,302 649,202 11,315 785,869
The species wise details of growing stock are not available prior to 1995.
Biomass stock
Since no original data on biomass is available, estimates have been carried out following FRA 2010 Guidelinesand using IPCC default values for conversion from growing stock to biomass.
Carbon stock
The default value of 0,47 has been used to estimate carbon.
3.3 Analysis and processing of national data
3.3.1 Adjustment
3.3.2 Estimation and forecasting
Growing stock
A. Growing Stock in Forests
The inventory figures of 1989 and 1999 are being assumed for 1990 and 2000 respectively. The per hectaregrowing stock in forests in 2005 is assumed same as in 2000 (78 m 3 / ha). This per hectare figure has beenmultiplied by the area of forest in Table 1 to forecast growing stock in forest in 2005.
Growing Stock (000 m3) in ForestsCategories
CK4 2000 2005
Growing stock (000m3)
638,096 754,728 802,157

FRA 2015 – Country Report, Viet Nam
28
Area (000 ha) 8,396 9,675 10,283
Growing stock/ha (m3/ha)
76 78 78
According to counted data, it is about 74 m3/ha of Growing stock/ha in year 2005. It would be no change in theGrowing stock/ha of forest in year 2010. We know that 74m3/ha is not maximum standing volume. It meansthat the growing stock/ha is increased about 1.5-2% per year. After 5 years the growing stock/ha must be higher.But after 5 years natural forest is added a big area by natural regeneration. These areas are generally low ofgrowing stock. Two process make growing stock not changed so much.
Growing Stock (000 m3) in Forests ???????????Categories
1990 2000 2005 2010
Growing stock(000 m3)
638,096 754,650 760,942 761,164
Area (000 ha) 8,396 9,675 10,283 10,286
Growing stock/ha (m3/ha)
76 78 74 74
B. Growing Stock in Forest Plantations (excluding Rubber)
The 1999 growing stock in forest plantations is being assumed for 2000. The per hectare growing stock inplantation in 1995 is being assumed for 1990 and that in 2000 for 2005 as well. The growing stock in forestplantations (excluding rubber) in 1990 and 2005 has been calculated by using the per hectare growing stockfigures assumed above and the area reported in Table 1.
Growing Stock (000 m3) in Forest Plantations??????????Categories
1995 2000 1990 2005 2010
Growing stock(000 m3)
22,050 31,122 15,645 44 346 54,749
Area (000 ha) 1050 1,638 745 2 334 2,882
averagegrowing stock(m3/ha)
21 19 21 19 19
Growing stock of forest plantation is low because they are recently established.
FRA 2015 – Country Report, Viet Nam
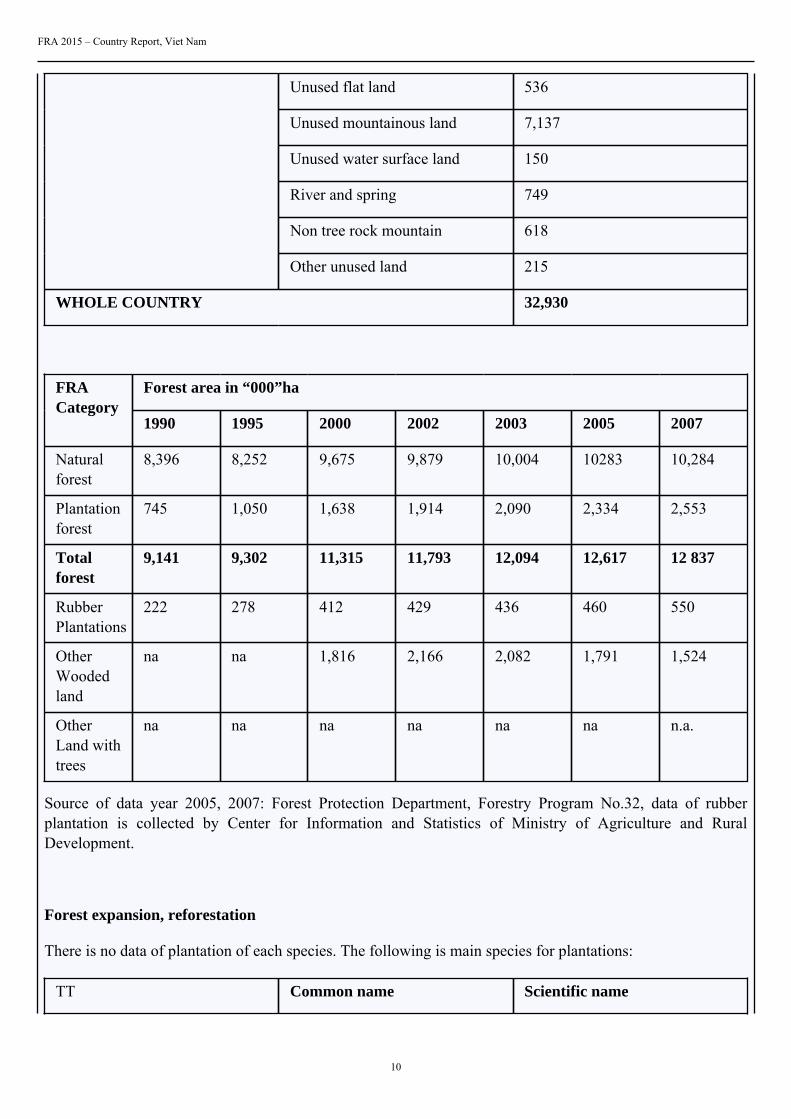
29
According to counted data, it is about 23 m3/ha of Growing stock/ha in year 2005 of plantation. It would be nochange in the Growing stock/ha of plantation in year 2010.
Growing Stock (000 m3) in Forest PlantationsCategories
1,995 2,000 1,990 2,005 2,010
Growing stock(000 m3)
22,050 31,122 15,645 53,682 66,286
Area (000 ha) 1,050 1,638 745 2,334 2,882
averagegrowing stock(m3/ha)
21 19 21 23
23
C. Growing Stock in Rubber Plantations
No figures are available to estimate growing stock in rubber plantations. Therefore per hectare growing stockfigures of forest plantations have been assumed for Rubber plantations.
Growing stock in rubbert plantation recalculated using data from Question 1.
Reference Year
Categories 1990 2000 2005 2010 2015
Growing stock/ha in forest (m3/ha)
21 19 23 23 23
Rubberplantations Area(000 ha)
222 412 460 740 911
Rubberwood GS(000 m3)
4,662 7,828 10,580 17020 20953
The data for 1999 of species-wise growing stock has been assumed for 2000 and it has been sorted to identify top10 species in terms growing stock for the year 2000. The species wise details of growing stock are not availableprior to 1995. Therefore, the growing stock for 1990 has been apportioned in same species-wise ration as in2000 assuming that the percentage species composition of the growing stock in 2000 also holds good for 1990.
1,990 2,000 2,005 2,010

FRA 2015 – Country Report, Viet Nam
30
Natural forest 638,096 754,728 802,157 802,352
Plantations 15645 31122 44346 54,749
Rubber plant 4,662 7,828 8,740 13,015
Total growingstock
658,403 793,678 855,243 870,115
---
Growing Stock (000 m3) Forest excl. RubberCategories
1990 2000 2005 2010
Natural forest 638,096 754,650 760,942 761,164
Plantations 15,645 31,122 53,682 66,286
Total growingstock excl.rubberplantations
653,741 785,772 814,624 827,450
GS/ha 72 69 65 61.8053481
Growing Stock 1990 2000 2005 2010 2015
Forest 653741 785772 814624 827450 856,746
Rubber plant 4,662 7,828 10,580 17,020 20,953
Total growingstock
658403 793600 825204 844470 877,699
Biomass stock
For Above ground biomass the following factors have been used:
Conifers: 0.9
Broadleaved: 2
For below ground biomass the coefficient of 0.275 has been adopted.

FRA 2015 – Country Report, Viet Nam
31
3.3.3 Reclassification
Growing stock
Percentage of a National Class to a FRA ClassNational Classification
Growing
Stock
Commercial Growing Stock
Growing stock 100
3.4 DataTable 3a
Growing stock volume (million m 3 over bark)
Forest Other wooded landCategory
1990 2000 2005 2010 2015 1990 2000 2005 2010 2015
Totalgrowingstock
658 794 825 844 878 N/A N/A N/A N/A N/A
... ofwhichconiferous
N/A N/A N/A N/A N/A N/A N/A N/A N/A N/A
... ofwhichbroadleaved
N/A N/A N/A N/A N/A N/A N/A N/A N/A N/A
Table 3b
Category/Species name Growing stock in forest (million cubic meters)
Rank Scientific name Common name 1990 2000 2005 2010
1 st Lagerstromiacalyculata
Bằng lăng 19 21 22 24
2 nd Lythocarpusducampii
Dẻ đỏ 18 20 21 22.1
3 rd Vaticaodorata var.brevipetiolata
Táu mật 14 16 17 18.5
4 th Shorea obtusa Cà chắc 14 15 16 17.5

FRA 2015 – Country Report, Viet Nam
32
5 th Lithocarpusdeabatus
Dẻ trắng 13 14 15 16.8
6 th Schimakhasiana
Vối thuốc 12 13 13 14.2
7 th Quercus spp Sồi quang 12 13 13 14.6
8 th Syzygiumwightianum
Trâm trắng 12 13 13 14.2
9 th Madhucapasquieri
Sến mật 10 11 12 13.1
10 th Nepheliummelliferum
Trường vải 10 11 11 12
Remaining 524 647 672 677
TOTAL 658.00 794.00 825.00 844.00
THE PRE-FILLED VALUES FOR GROWING STOCK REFER TO THE FOLLOWINGTHRESHOLD VALUES (SEE TABLE BELOW)
Item Value Complementary information
Minimum diameter (cm) at breast heightof trees included in growing stock (X)
8 cm Tree with minimum diameter of 8 cmat breast height (1.3 m) is included incalculation of growing stock
Minimum diameter (cm) at the top end ofstem for calculation of growing stock (Y)
5 cm Minimum diameter of 5 cm at the top endof stem for calculation of growing stock
Minimum diameter (cm) of branchesincluded in growing stock (W)
N/A In Vietnam, branches are not calculatedfor growing stock
Volume refers to above ground (AG) orabove stump (AS)
AG In Vietnam, volume refers to "aboveground"
PLEASE NOTE THAT THE DEFINITION OF GROWING STOCK HAS CHANGED AND SHOULDBE REPORTED AS GROWING STOCK DBH 10 CM INCLUDING THE STEM FROM GROUNDLEVEL UP TO A DIAMETER OF 0 CM, EXCLUDING BRANCHES.
Table 3c
Net annual increment (m 3 per hectare and year)
ForestCategory
1990 2000 2005 2010 2015
Net annualincrement
3 3 3 3 4
... of whichconiferous
N/A N/A N/A N/A N/A
... of whichbroadleaved
N/A N/A N/A N/A N/A

FRA 2015 – Country Report, Viet Nam
33
Table 3d
Biomass (million metric tonnes oven-dry weight)
Forest Other wooded landCategory
1990 2000 2005 2010 2015 1990 2000 2005 2010 2015
Abovegroundbiomass
1297 1546 1608 1645 1710 N/A 36.2 128.2 66.9 62.4
Belowgroundbiomass
356 425 442 452 470 N/A 9.7 34.6 18 16.8
Deadwood
N/A N/A N/A N/A N/A N/A N/A N/A N/A N/A
TOTAL 1653.00 1971.00 2050.00 2097.00 2180.00 .00 45.90 162.80 84.90 79.20
Table 3e
Carbon (Million metric tonnes)
Forest Other wooded landCategory
1990 2000 2005 2010 2015 1990 2000 2005 2010 2015
Carbonin abovegroundbiomass
610 727 756 773 804 N/A 18 64 33.4 31.2
Carbonin belowgroundbiomass
168 200 208 213 221 N/A 4.86 17.28 9 8.4
SubtotalLivingbiomass
777 927 963 986 1025 N/A N/A N/A N/A N/A
Carbonin deadwood
N/A N/A N/A N/A N/A N/A N/A N/A N/A N/A
Carbonin litter
49 61 68 72 N/A N/A N/A N/A N/A N/A
SubtotalDeadwoodand litter
N/A N/A N/A N/A N/A N/A N/A N/A N/A N/A
Soilcarbon
440 551 615 651 651 N/A N/A N/A N/A N/A
TOTAL 1267.00 1539.00 1647.00 1709.00 1676.00 .00 22.86 81.28 42.40 39.60
Tiers

FRA 2015 – Country Report, Viet Nam
34
Variable/category Tier for status Tier for trend
Total growing stock Tier 3 Tier 2
Net annual increment Tier 2 Tier 1
Above ground biomass Tier 1 Tier 1
Below ground biomass Tier 1 Tier 1
Dead wood Tier 1 Tier 1
Carbon in above-ground biomass Tier 1 Tier 1
Carbon in below ground biomass Tier 1 Tier 1
Carbon in dead wood and litter Tier 1 Tier 1
Soil carbon Tier 1 Tier 1
Tier criteria
Category Tier for status Tier for reported trend
Total growing stock Tier 3: Data sources Recent 10 yearsNational Forest Inventory or remotesensing with ground truthing orprogramme for repeated compatible NFI10 years Domestic volume functions Tier2: Data sources/registers and statisticsmodelling or old NFI 10 years or partialfield inventory Tier 1: Other data sources
Tier 3: Estimate based on repeatedcompatible tiers 3 (tier for status)Domestic growth functions Tier 2:Estimate based on repeated compatible tier2 or combination tier 3 and 2 or 1 tier forstatus Tier 1: Other
Net annual increment Tier 3: Scientifically tested nationalvolume and growth functions Tier 2:Selection of volume and growth functionsas relevant as possible Tier 1: Other
Tier 3: Confirmation/adjustment offunctions used through scientific workTier 2: Review work done to seekalternative functions Tier: 1 Other
Biomass Tier 3: Country-specific national or sub-national biomass conversion expansionfactors applied or other domestic orotherwise nationally relevant biomassstudies Tier 2: Application of countryspecific national or sub-national biomassconversion factors from other countrywith similar climatic conditions and foresttypes Tier 1: International/regional defaultbiomass expansion factors applied
Tier 3 : Estimate based on repeatedcompatible tiers 3 (tier for status) Tier 2 :Estimate based on repeated compatible tier2 or combination tier 3 and 2 or 1 (tier forstatus) Tier 1 : Other

FRA 2015 – Country Report, Viet Nam
35
• Carbon in above ground biomass• Carbon in below ground biomass• Carbon in dead wood and litter• Soil carbon
Tier 3: Country-specific national or sub-national biomass conversion expansionfactors applied Tier 2: Applicationof country specific national or sub-national biomass conversion factorsform from other country with similarclimatic conditions and forest types Tier1: International/regional default biomassexpansion factors applied
Tier 3 : Estimate based on repeatedcompatible tiers 3 (tier for status) Tier 2 :Estimate based on repeated compatible tier2 or combination tier 3 and 2 or 1 (tier forstatus) Tier 1 : Other
3.5 Comments on growing stock biomass and carbon
CategoryComments related todata definitions etc
Comments on the reported trend
Total growing stock N/A N/A
Growing stock of broadleaved coniferous Vietnam do not separate growing stock ofconifer and broad leaf. However the areaof conifer forest is relatively small
N/A
Growing stock composition Vietnam do not separate growing stock ofconifer and broad leaf.
The 1990 figures are based on intra-species composition of 2000
Net annual increment N/A N/A
Above-ground biomass Coefficient of coniferous: 0.9 Coefficientof broadleaved: 2.0
N/A
Below-ground biomass Coefficient 0.275 N/A
Dead wood Data not available N/A
Carbon in above-ground biomass N/A N/A
Carbon in below-ground biomass BGB = 0.27 * AGB N/A
Carbon in dead wood Data not avaiable N/A
Carbon in litter Coefficient 5.2 t/ha N/A
Soil carbon Coefficient 47 t/ha N/A
Other general comments to the table
For 2010 and 2015, the above ground biomass and biomass carbon is calculated using country specific data for growing stock ofeach forest type.

FRA 2015 – Country Report, Viet Nam
36
4. What is the status of forest production and how has it changed over time?Documents for this question:
• Guide for country reporting FRA 2015• FRA 2015 Terms and Definitions
4.1 Categories and definitions
Term Definition
Primary designatedfunction
The primary function or management objective assigned to a management unit either by legalprescription documented decision of the landowner/manager or evidence provided by documentedstudies of forest management practices and customary use.
Non wood forest product(NWFP)
Goods derived from forests that are tangible and physical objects of biological origin other than wood.
Commercial value ofNWFP
For the purpose of this table, value is defined as the commercial market value at the forest gate.
Category Definition
Production forest Forest area designated primarily for production of wood, fibre, bio-energy and/or non-wood forestproducts.
Multiple use forest Forest area designated for more than one purpose and where none of these alone is considered as thepredominant designated function.
Total wood removals The total of industrial round wood removals and woodfuel removals.
...of which woodfuel The wood removed for energy production purposes, regardless whether for industrial, commercial ordomestic use.
4.2 National data
4.2.1 Data sources
References to sourcesof information
Variables Years Additional comments
1 Database of Forest Inventoryand Planning Institute andMARD
N/A 1992 N/A
2 Database of Forest Inventoryand Planning Institute andMARD
N/A 1995 N/A
3 Database of Forest Inventoryand Planning Institute andMARD
N/A 2000 N/A
4 Database of Forest Inventoryand Planning Institute andMARD
N/A 2002 N/A
5 Database of Forest Inventoryand Planning Institute andMARD
N/A 2003 N/A

FRA 2015 – Country Report, Viet Nam
37
6 Database of Forest Inventoryand Planning Institute andMARD
N/A 2005 N/A
7 Database of Forest Inventoryand Planning Institute andMARD
N/A 2007 N/A
4.2.2 Classification and definitions
National class Definition
Production function Forest / Other wooded land designated for production andextraction of forest goods, including both wood and non-woodforest products.
Social services function Forest / Other wooded land designated for the provision of socialservices, which composes of conservation of bio-diversity
Multiple purpose function Forest / Other wooded land designated to any combination of:production of goods, protection of soil and water, conservationof biodiversity and provision of social services and where noneof these alone can be considered as being significantly moreimportant than the others.
No or unknown function Forest / Other wooded land for which a specific function has notbeen designated or where designated function is unknown.
4.2.3 Original data
Area by the year in “000” haCategories
1990 1995 2000 2002 2003 2005 2007
Productionforests
5,485 4,925 4,241 4,452 4,552 4,486 5,780
Protectionforests
2,925 3,479 5,502 5,614 5,699 6,172 4,979
Bio-diversity
731 898 1,570 1,727 1,843 1,959 2,078
TotalwithoutRubber
9,141 9,302 11,313 11,793 12,094 12,617 12,837
RubberArea
222 278 412 429 436 460 550
ProductionwithRubber
5,707 5,203 4,653 4,881 4,988 4,946 6,330

FRA 2015 – Country Report, Viet Nam
38
Total Forestwith Rubber
9,363 9,580 11,725 12,222 12,530 13,077 13,387
Source: Forest Protection Department, Forest Program No.32
4.3 Analysis and processing of national data
4.3.1 Adjustment
4.3.2 Estimation and forecasting
The figures are available for 1990 and 2005 and hence there is not need to conduct estimation for these years.The forecasting for 2010 has been done with the help of ratio among different categories of designation in 2007since the regression estimate do not provide right trend for production areas because pre and past 2005 dataindicate have apposite trend.
2007
Production: 47% of total forest
Protection: 37% of total forest
Biodiversity conservation: 16% of total forest
Category Area in 2010 (“000” ha)
Production forest including rubber 6524
Protection of water/soil 5131
Bio-diversity conservation 2142
Total 13797

FRA 2015 – Country Report, Viet Nam
39
4.3.3 Reclassification
Percentage of a National Class to a FRA Classes of Primary Function
ProductionFor./OWL
Protection
For./OWL
Conservation
ofBiodiversity
SocialService
Multiple
Function
Unknown
Function.
NationalClass
% % % % % %
Production 100
Protection 100
Conservation 100
MultiplePur.
100
4.4 DataTable 4a
Forest area (000 hectares)Categories
1990 2000 2005 2010 2015
Production forest 5707 4653 4946 6373 6870
Multiple useforest
0 0 0 0 0
Table 4b
Rank Name of product Key species
Commercial valueof NWFP removals
2010 (value 1000local currency)
NWFP category
1 st Bamboo and bambooshot
Dendrocalamusmembranaceus Munro(Lu#ng), Bambusabalcooa (L# ô),Bambusa fax (Lour.)(n#a)
N/A 5
2 nd Honey N/A N/A 1
3 rd Rattan Calamus bousigoniiBecc. ; Calamustetradactylus Hance
N/A 5

FRA 2015 – Country Report, Viet Nam
40
4 th Cinnamon Cinnamomum cassiaPresl
N/A 3
5 th Star anise Illicium verum N/A 4
6 th Resin Pinus merkusii N/A 3
7 th N/A N/A N/A N/A
8 th N/A N/A N/A N/A
9 th N/A N/A N/A N/A
10 th N/A N/A N/A N/A
TOTAL .00
2010
Name of local currency Vietnam dong (VND)
Category
Plant products / raw material
1 Food
2 Fodder
3 Raw material for medicine and aromatic products
4 Raw material for colorants and dyes
5 Raw material for utensils handicrafts construction
6 Ornamental plants
7 Exudates
8 Other plant products
Animal products / raw material
9 Living animals
10 Hides skins and trophies
11 Wild honey and beewax
12 Wild meat
13 Raw material for medicine

FRA 2015 – Country Report, Viet Nam
41
14 Raw material for colorants
15 Other edible animal products
16 Other non-edible animal products
Table 4c Pre-filled data from FAOSTAT
FRA 2015 category (1000 m 3 u.b.)Year
Total wood removals ...of which woodfuel
1990 31203.43 26534.43
1991 31554.37 26708.37
1992 31216.3 26752.3
1993 31163.06 26814.06
1994 31215.01 26828.01
1995 31595.3 26793.3
1996 31641.13 26764.13
1997 31324.71 26767.71
1998 31032.97 26706.97
1999 30220.32 26695.32
2000 30868.55 26685.55
2001 30798.19 26615.19
2002 30729.5 26546.5
2003 26437 21500
2004 26487 21250
2005 26004 21250
2006 26121 21250
2007 27450 22000
2008 27850 22000
2009 27850 22000
2010 28200 21500

FRA 2015 – Country Report, Viet Nam
42
2011 27100 20400
Tiers
Category Tier for status Tier for reported trend
Production forest Tier 3 Tier 3
Multiple use forest Tier 1 Tier 1
Tier Criteria
Category Tier for status Tier for reported trend
Production forest Multiple use forest Tier 3: Updated including fieldverifications national forest mapsincluding functions Tier 2: Forest mapsolder than 6 years including forestfunctions Tier 1: Other
Tier 3 : Estimate based on repeatedcompatible tiers 3 (tier for status) Tier 2 :Estimate based on repeated compatible tier2 or combination tier 3 and 2 or 1 (tier forstatus) Tier 1 : Other
4.5 Comments
CategoryComments related todata definitions etc
Comments on the reported trend
Production forest N/A Based on national development plan
Multiple use forest Vietnam do not have the category ofmultiple use forest. Vietnam have only3 type for forest management function:production forest, watershed protectionforest, and special use forest (national parkand nature reserve)
N/A
Total wood removals N/A N/A
Commercial value of NWFP N/A N/A
Other general comments to the table
N/A

FRA 2015 – Country Report, Viet Nam
43
5. How much forest area is managed for protection of soil and water and ecosystemservices?Documents for this question:
• Guide for country reporting FRA 2015• FRA 2015 Terms and Definitions
5.1 Categories and definitions
Category Definition
Protection of soil andwater
Forest area designated or managed for protection of soil and water
...of which productionof clean water (sub-category)
Forest area primarily designated or managed for water production, where most human uses are excludedor heavily modified to protect water quality.
...of which coastalstabilization (sub-category)
Forest area primarily designated or managed for coastal stabilization.
...of which desertificationcontrol (sub-category)
Forest area primarily designated or managed for desertification control.
...of which avalanchecontrol (sub-category)
Forest area primarily designated or managed to prevent the development or impact of avalanches onhuman life assets or infrastructure.
...of which erosion, floodprotection or reducingflood risk (sub-category)
Forest area primarily designated or managed for protecting communities or assets from the impacts oferosion riparian floods and landslides or for providing flood plain services.
...of which other (sub-category)
Forest area primarily designated or managed for other protective functions.
Ecosystem services,cultural or spiritual values
Forest area primarily designated or managed for selected ecosystem services or cultural or spiritualvalues.
...of which publicrecreation (sub-category)
Forest area designated or managed for public recreation.
...of which carbon storageor sequestration (sub-category)
Forest area designated or managed for carbon storage or sequestration.
...of which spiritual orcultural services (sub-category)
Forest area designated or managed for spiritual or cultural services.
...of which other (sub-category)
Forest area designated or managed for other ecosystem services.
5.2 National data
5.2.1 Data sources
References to sourcesof information
Variables Years Additional comments
1 National Forest Inventory2005
Protection forest 2005 N/A

FRA 2015 – Country Report, Viet Nam
44
2 National Forest Inventory2010
Protection forest 2010 N/A
3 N/A N/A N/A N/A
4 N/A N/A N/A N/A
5.2.2 Classification and definitions
National class Definition
Protection forest Protection forests are maintained to protect water streams andsoils, prevent soil erosion and mitigate natural disasters.
N/A N/A
N/A N/A
N/A N/A
5.2.3 Original data
5.3 Analysis and processing of national data
5.3.1 Adjustment
5.3.2 Estimation and forecasting
5.3.3 Reclassification
5.4 DataTable 5a
Forest area (1000 hectares)Categories
1990 2000 2005 2010 2015
Protection of soiland water
7000 5614 6172 4846 5200
... of whichproduction ofclean water
N/A N/A N/A N/A N/A

FRA 2015 – Country Report, Viet Nam
45
... of whichcoastalstabilization
N/A N/A N/A N/A N/A
... of whichdesertificationcontrol
N/A N/A N/A N/A N/A
... of whichavalanchecontrol
N/A N/A N/A N/A N/A
... of whicherosion, floodprotection orreducing floodrisk
N/A N/A N/A N/A N/A
... of which other(please specifyin commentsbelow the table)
N/A N/A N/A N/A N/A
Other
N/A
Table 5b
Forest area (1000 hectares)Categories
1990 2000 2005 2010 2015
Ecosystem services,cultural or spiritualvalues
N/A N/A N/A N/A N/A
...of which publicrecreation
N/A N/A N/A N/A N/A
...of whichcarbon storage orsequestration
N/A N/A N/A N/A N/A
...of which spiritualor cultural services
N/A N/A N/A N/A N/A
...of which other(please specify incomments belowthe table)
N/A N/A N/A N/A N/A
Tiers
Category Tier for reported trend Tier for status
Protection of soil and water Tier 2 Tier 3
Ecosystem services, cultural or spiritualvalues
Tier 2 Tier 2

FRA 2015 – Country Report, Viet Nam
46
Tier criteria
Category Tier for status Tier for reported trend
Protection of soil and water Tier 3: High reliability data derived eitherfrom high intensity sample survey or dataobtained from national or state agenciesresponsible for regulations or legislationrelating to soil and water protection. Tier2: Approaches based on low intensityor incomplete sample-based surveys orstudies that provide data for specific areasthat is extrapolated through statisticalanalysis to national level estimates. Tier 1:Other
Tier 3 : Estimate based on repeatedcompatible tiers 3 (tier for status) Tier 2 :Estimate based on repeated compatible tier2 or combination tier 3 and 2 or 1 (tier forstatus) Tier 1 : Other
• Cultural or spiritual values• Public recreation• Spiritual or cultural services• Other
Tier 3: High reliability data derivedeither from high intensity sample surveyor data obtained from national or stateagencies responsible for regulations. Tier2: Approaches based on low intensityor incomplete sample-based surveys orstudies that provide data for specific areasthat is extrapolated through statisticalanalysis to national level estimates. Tier 1:Other
Tier 3 : Estimate based on repeatedcompatible tiers 3 (tier for status) Tier 2 :Estimate based on repeated compatible tier2 or combination tier 3 and 2 or 1 (tier forstatus) Tier 1 : Other
5.5 Comments
CategoryComments related todata definitions etc
Comments on the reported trend
Protection of soil and water N/A N/A
Production of clean water N/A N/A
Coastal stabilization N/A N/A
Desertification control N/A N/A
Avalanche control N/A N/A
Erosion, flood protection or reducing floodrisk
N/A N/A
Other protective functions N/A N/A
Ecosystem services, cultural or spiritualvalues
N/A N/A
Public recreation N/A N/A
Carbon storage or sequestration N/A N/A
Spiritual or cultural services N/A N/A
Other ecosystem services N/A N/A

FRA 2015 – Country Report, Viet Nam
47
Other general comments to the table
In Vietnam protection forest is a general class that include all forest designated for protection of watershed, soil erosion, floodingand coastal protection. At the lower level there might be further classification of protection forest to such sub-category. However atnational level data is reporting only as one class: protection forest. Therefore in table 5a we only report one general class: protectionforest for soil and water

FRA 2015 – Country Report, Viet Nam
48
6. How much forest area is protected and designated for the conservation of biodiversityand how has it changed over time?Documents for this question:
• Guide for country reporting FRA 2015• FRA 2015 Terms and Definitions
6.1 Categories and definitions
Category Definition
Conservation ofbiodiversity
Forest area designated primarily for conservation of biological diversity. Includes but is not limited toareas designated for biodiversity conservation within the protected areas.
Forest area withinprotected areas
Forest area within formally established protected areas independently of the purpose for which theprotected areas were established.
6.2 National data
6.2.1 Data sources
References to sourcesof information
Variables Years Additional comments
1 Database of Forest Inventoryand Planning Institute andMARD
N/A 1992 N/A
2 Database of Forest Inventoryand Planning Institute andMARD
N/A 1995 N/A
3 Database of Forest Inventoryand Planning Institute andMARD
N/A 2000 N/A
4 Database of Protection ForestDepartment and FIPI
N/A 2002 N/A
5 Database of Protection ForestDepartment and FIPI
N/A 2003 N/A
6 FIPI and PFD submit toMARD and publishing
N/A 2005 N/A
7 FIPI and PFD submit toMARD and publishing
N/A 2007 N/A
6.2.2 Classification and definitions
National class Definition
Protection Forest / Other wooded land designated for protection of soiland water. Logging is not allowed. Its compose of watershed,control soil erosion, tidal along costal, fixation moving sandduns, reduce pollution nearby the plant or factories

FRA 2015 – Country Report, Viet Nam
49
Production Production forests have the main purpose of supplying timberand non-timber forest products (NTFPs), but in addition provideenvironmental protection.
Special use forest The main role of special-use forests is nature conservation,protection of historical and cultural site, and tourism.
N/A N/A
6.2.3 Original data
See 4.2.3.
6.3 Analysis and processing of national data
6.3.1 Adjustment
6.3.2 Estimation and forecasting
See 4.3.2.
6.3.3 Reclassification
See 4.3.3.
6.4 DataTable 6
Forest area (000 hectares)Categories
1990 2000 2005 2010 2015
Conservation ofbiodiversity
731 1570 1959 2002 2040
Forest areawithin protectedareas
731 1570 1959 2002 2040
Tiers
Category Tier for status Tier for reported trend
Conservation of biodiversity Tier 3 Tier 2
Forest area within protected areas Tier 3 Tier 2

FRA 2015 – Country Report, Viet Nam
50
Tier criteria
Category Tier for status Tier for reported trend
• Conservation of biodiversity• Forests within protected areas
Tier 3: Data obtained from national orstate agencies responsible for conservationand protected area or legislation relatingto area protection. Tier 2: Studies thatprovide data for specific areas that isextrapolated through statistical analysis tonational level estimates Tier 1 Other
Tier 3 : Estimate based on repeatedcompatible tiers 3 (tier for status) Tier 2 :Estimate based on repeated compatible tier2 or combination tier 3 and 2 or 1 (tier forstatus) Tier 1 : Other
6.5 Comments
CategoryComments related todata definitions etc
Comments on the reported trend
Conservation of biodiversity Special use forest in Vietnam include3 type of forest: 1) national park +nature reserve; 2) Tourism and spiritualforest; 3) Research forest. Therefore the"Conservation of biodiversity" data intable 6 is calculated as: Total area ofSpecial use forest subtract the area oftourism and research forest
N/A
Forest area within protected areas No data avaiable N/A
Other general comments to the table
N/A

FRA 2015 – Country Report, Viet Nam
51
7. What is the area of forest affected by woody invasive species?Documents for this question:
• Guide for country reporting FRA 2015• FRA 2015 Terms and Definitions
7.1 Categories and definitions
Category Definition
Invasive species Species that are non-native to a particular ecosystem and whose introduction and spread cause, or arelikely to cause, socio-cultural, economic or environmental harm or harm to human health.
7.2 National data
7.2.1 Data sources
References to sourcesof information
Variables Years Additional comments
1 Circular 22/2011/TT-BTNMT by Ministry ofEnvironment and NaturalResources, issued on 01July 2011, on Criteria toidentify invasive species andpromulgate the list of exitinginvasive species
Invasive species 2011 N/A
2 N/A N/A N/A N/A
3 N/A N/A N/A N/A
4 N/A N/A N/A N/A
7.2.2 Classification and definitions
National class Definition
N/A N/A
N/A N/A
N/A N/A
N/A N/A
7.2.3 Original data
Goverment Circular on invasive species here:

FRA 2015 – Country Report, Viet Nam
52
http://vanban.chinhphu.vn/portal/page/portal/chinhphu/hethongvanban?class_id=1&mode=detail&document_id=170254
7.3 Analysis and processing of national data
7.3.1 Adjustment
7.3.2 Estimation and forecasting
7.3.3 Reclassification
7.4 DataTable 7
Forest area affected (000 ha)Scientific name of
woody invasive species2005 2010
Mimosa pigra (Trinh nữ thân gỗ, maidương)
N/A N/A
Leucaena leucocephala (Keo giậu, keodậu)
N/A N/A
Lantana camara (Cây ngũ sắc ,bông ổi) N/A N/A
Melaleuca quinquenervia (Cây tràmquinquenervia)
N/A N/A
N/A N/A N/A
N/A N/A N/A
N/A N/A N/A
N/A N/A N/A
N/A N/A N/A
N/A N/A N/A
Total N/A N/A
Tiers
Category Tier for status Tier for reported trend

FRA 2015 – Country Report, Viet Nam
53
Invasive species Tier 1 Tier 1
Tier Criteria
Category Tier for status Tier for reported trend
Invasive species Tier 3: Systematic assessment in forestinventory or other survey (e.g. byconservation department) within the last5 years) Tier 2: Systematic assessment inforest inventory or other survey (e.g. byconservation department conducted morethan 5 years ago) Tier 1: Other
Tier 3 : Estimate based on repeatedcompatible tiers 3 (tier for status) Tier 2 :Estimate based on repeated compatible tier2 or combination tier 3 and 2 or 1 (tier forstatus) Tier 1 : Other
7.5 Comments
CategoryComments related todata definitions etc
Comments on the reported trend
Invasive species N/A N/A
Other general comments to the table
There is no data available on area affected by invasive species, therefore we only reporting name of invasive species.

FRA 2015 – Country Report, Viet Nam
54
8. How much forest area is damaged each year?Documents for this question:
• Guide for country reporting FRA 2015• FRA 2015 Terms and Definitions
8.1 Categories and definitions
Category Definition
Number of fires Number of fires per year
Burned area Area burned per year
Outbreaks of insects A detectable reduction in forest health caused by a sudden increase in numbers of harmful insects.
Outbreaks of diseases A detectable reduction in forest health caused by a sudden increase in numbers of harmful pathogens,such as bacteria, fungi, phytoplasma or virus.
Severe weather events Damage caused severe weather events, such as snow, storm, drought, etc.
8.2 National data
8.2.1 Data sources
References to sourcesof information
Variables Years Additional comments
1 National Forest monitoring2010. Forest ProtectionDepartment. VietnamForest Administration(VNFOREST). Ministryof Agriculture and RuralDevelopment. 2010
N/A N/A N/A
2 N/A N/A N/A N/A
3 N/A N/A N/A N/A
4 N/A N/A N/A N/A
8.2.2 Classification and definitions
National class Definition
N/A N/A
N/A N/A
N/A N/A

FRA 2015 – Country Report, Viet Nam
55
N/A N/A
8.2.3 Original data
Forest change 2010
Decision 1828 /QĐ-BNN-TCLN date 11/Aug /2011)
Unit: ha
Category Code Totalchange
Affore-station
Logging Forestfire
Insect,disease
Defore-station
Changeof landcategory
Naturalregene-ration
Other
Forestedland
1000 129,537
197,571
(49,635)
(4,549)
(39)
(3,942)
(46,519)
106,902
(70,251)
A.Naturalforest
1100 (33,775)
(37,504)
(1,892)
(1,892)
-
(1,447)
(29,088)
106,901
(68,853)
1.Woodyforest
1110 (8,686)
(22,996)
(1,534)
(1,394)
-
(712)
(19,080)
93,664
(56,632)
2.Bambooforest
1120 (49,252)
(7,074)
(98)
(60)
-
(180)
(2,558)
394
(39,676)
3.Mixedwoody+bamboo
1130 28,103
(7,554)
(260)
(79)
-
(311)
(5,118)
13,791
27,635
4.Mangrove
1140 (518)
120
-
-
-
-
(11)
2
(629)
5.Limestoneforest
1150 (3,423)
- -
(359)
-
(243)
(2,320)
(950)
450
B.Plantation
1200 163,312
235,075
(47,743)
(2,657)
(39)
(2,495)
(17,431)
- (1,398)
1.Plantationforestwithvolume
1210 195,451
- (46,765)
(1,419)
(16)
(1,095)
(15,147)
144,123
115,769
2.Plantationforsetwithoutvolume
1220 (53,045)
216,952
- (920)
(23)
(1,400)
(784)
(144,123)
(122,747)

FRA 2015 – Country Report, Viet Nam
56
3.Bamboo
1230 (4,879)
50
(9)
(1)
-
-
(13)
(4,907)
4.Industrialmaterialtree
1240 (18,427)
15,890
(969)
(36)
-
-
(256)
(33,056)
5.Mangrove
1250 44,213
2,183
-
(282)
-
-
(1,231)
-
43,543
8.3 Analysis and processing of national data
8.3.1 Adjustment
8.3.2 Estimation and forecasting
8.3.3 Reclassification
8.4 DataTable 8a
000 ha, number of fires
2003 2004 2005 2006 2007Category
000 ha # 000 ha # 000 ha # 000 ha # 000 ha #
Totalland areaburned
175.71 N/A 396.91 N/A 235.54 1148 120.24 496 257.98 773
... ofwhichforestareaburned
76.65 N/A 75.33 N/A 79.93 N/A 29.07 N/A 108.67 N/A
2008 2009 2010 2011 2012Category
000 ha # 000 ha # 000 ha # 000 ha # 000 ha #
Totalland areaburned
60.74 277 115.41 337 216.6 897 46.99 241 75.15 385

FRA 2015 – Country Report, Viet Nam
57
... ofwhichforestareaburned
18.78 N/A 47.28 N/A 66.44 N/A 14.03 N/A 28.91 N/A
Table 8b
Outbreak category Description/name Year(s) of latest outbreak Area damaged (000 hectares)
N/A N/A 1998 2.5
Insects n/a 2010 0.039
N/A N/A N/A N/A
N/A N/A N/A N/A
N/A N/A N/A N/A
N/A N/A N/A N/A
N/A N/A N/A N/A
N/A N/A N/A N/A
N/A N/A N/A N/A
N/A N/A N/A N/A
Outbreak category
1 Insects
2 Diseases
3 Severe weather events
Tiers
Category Tier for status Tier for trend
Area affected by fire Tier 2 Tier 2
• Insects• Diseases• Severe weather events
Tier 3 Tier 2
Tier criteria
Category Tier for status Tier for reported trend

FRA 2015 – Country Report, Viet Nam
58
Burned area Tier 3 : National fire monitoring routinesTier 2 : Remote sensing surveys Tier 1 :Other
Tier 3 : Estimate based on repeatedcompatible tiers 3 (tier for status) Tier 2 :Estimate based on repeated compatible tier2 or combination tier 3 and 2 or 1 (tier forstatus) Tier 1 : Other
• Insects• Diseases• Severe weather events
Tier 3 : Systematic survey (e.g. viainventory or aerial damage assessment)Tier 2 : Management records Tier 1 :Other
Tier 3 : Estimate based on repeatedcompatible tiers 3 (tier for status) Tier 2 :Estimate based on repeated compatible tier2 or combination tier 3 and 2 or 1 (tier forstatus) Tier 1 : Other
8.5 Comments
CategoryComments related todata definitions etc
Comments on the reported trend
Burned area N/A N/A
Insects N/A N/A
Diseases N/A N/A
Severe weather events N/A N/A
Other general comments to the table
N/A

FRA 2015 – Country Report, Viet Nam
59
9. What is the forest area with reduced canopy cover?Documents for this question:
• Guide for country reporting FRA 2015• FRA 2015 Terms and Definitions
Category Definition
Reduction in canopycover
Forest that has undergone a reduction of canopy cover of more than 20% between the years 2000 and2010 within the forest canopy cover range of 30-80% as detected by the MODIS VCF sensor.
Table 9
Category Area of forest with reduced canopy cover (000 ha)
Reduction in canopycover
6045.46
Tiers
Category Tier for reported trend
Reduction in canopycover
Tier 2
Tier criteria
Category Tier for reported trend
Reduction in canopycover
Tier 3 : Remote sensing with ground truthing and/or Landsat imagery Tier 2 : Remote sensing usingModis (using pre-filled data provided by FAO) Tier 1 : Expert opinion
Comments
Category Comments related to data definitions etc
Reduction in canopycover
N/A
Other general comments

FRA 2015 – Country Report, Viet Nam
60
10. What forest policy and regulatory framework exists to support implementation ofsustainable forest management SFM?Documents for this question:
• Guide for country reporting FRA 2015• FRA 2015 Terms and Definitions
10.1 Categories and definitions
Category Definition
Policies supportingsustainable forestmanagement
Policies or strategies that explicitly encourage sustainable forest management.
Legislation andregulations supportingsustainable forestmanagement
Legislation and regulations that govern and guide sustainable forest management, operations and use.
10.2 National data
10.2.1 Data sources
References to sourcesof information
Variables Years Additional comments
1 N/A N/A N/A N/A
2 N/A N/A N/A N/A
3 N/A N/A N/A N/A
4 N/A N/A N/A N/A
10.2.2 Classification and definitions
National class Definition
N/A N/A
N/A N/A
N/A N/A
N/A N/A
10.2.3 Original data
10.3 Data

FRA 2015 – Country Report, Viet Nam
61
Table 10
Sub-nationalCategoryNational
Regional Provincial/State Local
Policies supportingsustainable forestmanagement
yes no no no
... of which, in publiclyowned forests
yes no no no
... of which, in privatelyowned forests
yes no no no
Legislation andregulations supportingsustainable forestmanagement
yes no no no
... of which, in publiclyowned forests
yes no no no
... of which, in privatelyowned forests
yes no no no
10.4 Comments
Variable / category Comments related to data definitions etc
Policies supporting sustainable forest management N/A
Legislation and regulations supporting sustainable forestmanagement
N/A
Other general comments

FRA 2015 – Country Report, Viet Nam
62
11. Is there a national platform that promotes stakeholder participation in forest policydevelopment?Documents for this question:
• Guide for country reporting FRA 2015• FRA 2015 Terms and Definitions
11.1 Categories and definitions
Category Definition
National stakeholderplatform
A recognized procedure that a broad range of stakeholders can use to provide opinions, suggestions,analysis, recommendations and other input into the development of national forest policy.
11.2 National data
11.2.1 Data sources
References to sources of information Years Additional comments
1 N/A N/A N/A
2 N/A N/A N/A
3 N/A N/A N/A
4 N/A N/A N/A
Table 11Is there a national platform that promotes or allows forstakeholder participation in forest policy development?
yes
11.3 Comments
Category Comments related to data definitions etc
National stakeholder platform [tbd]
Other general comments

FRA 2015 – Country Report, Viet Nam
63
12. What is the forest area intended to be in permanent forest land use and how has itchanged over time?Documents for this question:
• Guide for country reporting FRA 2015• FRA 2015 Terms and Definitions
12.1 Categories and definitions
Category Definition
Forest area intended to bein permanent forest landuse
Forest area that is designated or expected to be retained as forest and is highly unlikely to be convertedto other land use.
...of which permanentforest estate (sub-category)
Forest area that is designated by law or regulation to be retained as forest and may not be converted toother land use.
12.2 National data
12.2.1 Data sources
References to sourcesof information
Variables Years Additional comments
1 Decision 1828 /QĐ-BNN-TCLN Dated 11/8/2011 byMARD
N/A 2011 N/A
2 N/A N/A N/A N/A
3 N/A N/A N/A N/A
4 N/A N/A N/A N/A
12.2.2 Classification and definitions
National class Definition
N/A N/A
N/A N/A
N/A N/A
N/A N/A
12.2.3 Original data

FRA 2015 – Country Report, Viet Nam
64
12.3 Analysis and processing of national data
12.3.1 Adjustment
12.3.2 Estimation and forecasting
12.3.3 Reclassification
12.4 DataTable 12
Categories Forest area 2010 (000 ha)
Forest area intended to be in permanentforest land use
2002
... of which permanent forest estate 2002
Tiers
Category Tier for status
Forest area intended to be in permanent forest land use Tier 3
Permanent forest estate Tier 3
Tier Criteria
Category Tier for status
Forest area intended to be in permanent forest land use Tier 3 : National or sub-national land use plans strategydocuments or other reports within the past 10 years Tier 2 :National or sub-national land use plans strategy documents orother reports within the past 20 years Tier 1 : Other
Permanent forest estate Tier 3 : National or sub-national land use plans strategydocuments or other reports within the past 10 years Tier 2 :National or sub-national land use plans strategy documents orother reports within the past 20 years Tier 1 : Other
12.5 Comments
Category Comments related to data definitions etc
Forest area intended to be in permanent forest land use N/A
Permanent forest estate N/A

FRA 2015 – Country Report, Viet Nam
65
Other general comments

FRA 2015 – Country Report, Viet Nam
66
13. How does your country measure and report progress towards SFM at the nationallevel?Documents for this question:
• Guide for country reporting FRA 2015• FRA 2015 Terms and Definitions
13.1 Categories and definitions
Category Definition
Forest area monitoredunder a national forestmonitoring framework
Forest area monitored by a national monitoring framework or systems that provide measurement basedperiodic monitoring of forest extent and quality.
Forest reporting atnational scale
National reporting of forest extent and characteristics that includes some measure of progress towardsustainable forest management.
13.2 National data
13.2.1 Data sources
References to sourcesof information
Variables Years Additional comments
1 N/A N/A N/A N/A
2 N/A N/A N/A N/A
3 N/A N/A N/A N/A
4 N/A N/A N/A N/A
13.2.2 Classification and definitions
National class Definition
N/A N/A
N/A N/A
N/A N/A
N/A N/A
13.3 DataTable 13a

FRA 2015 – Country Report, Viet Nam
67
Check all boxes that apply
Category% of totalforest area
Mostrecent year
Continuous PeriodicPermanent
groundplots
Temporaryground
plots
Aerial/remotesensingsamplebased
Aerial/remote
sensing fullcoverage
Forestinventory
100 2010 yes yes yes yes
Other fieldassessments
N/A N/A
Updatesto othersources
100 2013 yes yes no no no no
Expertestimate
N/A N/A
Table 13b
Type of forest reporting used at national scale Check boxes that apply
1 Criteria and Indicators reporting no
2 Periodic national state of the forest report yes
3 Other (please document) yes
4 None
Other type of forest reporting
Each year MARD releases a report with data on national forest. The report is part of an official decision by MARD so that otherministry can use this data for planning.
13.4 Comments
Category Comments
N/A N/A
N/A N/A
N/A N/A
Other general comments

FRA 2015 – Country Report, Viet Nam
68
14. What is the area of forest under a forest management plan and how is this monitored?Documents for this question:
• Guide for country reporting FRA 2015• FRA 2015 Terms and Definitions
14.1 Categories and definitions
Category Definition
Forest area withmanagement plan
Forest area that has a long-term documented management plan, aiming at defined management goalswhich is periodically revised
...of which for production(sub-category)
Forest management plan mainly focused on production
...of which forconservation (sub-category)
Forest management plan mainly focused on conservation
Monitoring of forestmanagement plans
Government monitoring of forest management plan implementation conducted through field visits oraudits of forest management plan performance
14.2 National data
14.2.1 Data sources
References to sourcesof information
Variables Years Additional comments
1 N/A N/A N/A N/A
2 N/A N/A N/A N/A
3 N/A N/A N/A N/A
4 N/A N/A N/A N/A
14.3 DataTable 14a
Forest plan type Forest area 2010 (000 ha)
Forest area with management plan 8375
... of which for production 6373
... of which for conservation 2002
Table 14b
Indicate which (if any) of the following are required in forest management plans in your country
1 Soil and water management yes

FRA 2015 – Country Report, Viet Nam
69
2 High conservation value forest delineation yes
3 Social considerations community involvement yes
Table 14c
Percent of area under forest management plan that is monitored annually 27.6
Tiers
Category Tier for status
Forest area with management plan Tier 2
Percent of area under forest management plan that is monitoredannually
Tier 2
Tier criteria
Category Tier for status
Forest area with management plan Tier 3 : Reports that describe national records 5 years old or lessthat contain long-term forest monitoring plans Tier 2 : Industryor other records indicating the presence of a long-term forestmanagement plan Tier 1 : Other
Percent of area under forest management plan that is monitoredannually
Tier 3 : Government documentation of monitoring extent Tier 2: Reports from forest managers or other documental sources Tier1 : Other
14.4 Comments
Category Comments
Forest area with management plan Production forest have also management plans, but data are notavailable.
N/A All forest in Vietnam should haTất cả diện tích rừng của VN đều có kế hoạch quản lý, trong đó toàn bộ rừng DD, PH và phần lớn diện tích rừng sản xuất có kế hoạch quản lý được cấp có thẩm quyền phê duyệt.
N/A N/A
Other general comments

FRA 2015 – Country Report, Viet Nam
70
15. How are stakeholders involved in the management decision making for publiclyowned forests?Documents for this question:
• Guide for country reporting FRA 2015• FRA 2015 Terms and Definitions
15.1 Categories and definitions
Category Definition
Stakeholder involvement Stakeholder involvement is defined as significant inputs into at least one aspect of forest management atthe operational scale
Table 15
Please indicate the type of stakeholder involvement in forest management decision making required in your country
1. Planning phase yes
2. Operations phase yes
3. Review of operations yes
Tiers
Category Tier for status
Type of stakeholder inputs Tier 3
Tier criteria
Category Tier for status
Type of stakeholder inputs Tier 3 : Government (national or sub-national) documentation ofstakeholder inputs Tier 2 : Government (national or subnational)requirement but stakeholder inputs not documented Tier 1 :Other
15.2 Comments
Category Comments
N/A N/A
N/A N/A
N/A N/A
Other general comments

FRA 2015 – Country Report, Viet Nam
71
16. What is the area of forest under an independently verified forest certification scheme?Documents for this question:
• Guide for country reporting FRA 2015• FRA 2015 Terms and Definitions
16.1 Categories and definitions
Category Definition
FSC certification Forest area certified under the Forest Stewardship Council certification scheme
PEFC certification Forest area certified under the Programme for the Endorsement of Forest Certification scheme
Other international forestmanagement certification
Forest area certified under an international forest management certification scheme with publishedstandards and is independently verified by a third-party, excluding FSC and PEFC certification.
Certified forest areausing a domestic forestmanagement certificationscheme
Area certified under a forest management certification scheme with published standards that arenationally recognized and independently verified by a thirdparty
16.2 DataTable 16a
Forest area (000 ha)International forest
management certification2000 2001 2002 2003 2004 2005 2006
FSC 0 0 0 0 0 0 0
PEFC 0 0 0 0 0 0 0
Other 0 0 0 0 0 0 0
2007 2008 2009 2010 2011 2012
FSC 9.9 9.78 9.78 9.78 15.64 41.34
PEFC 0 0 0 0 0 0
Other 0 0 0 0 0 0
Table 16b
Forest area (000 ha)Domestic forest
management certification2000 2001 2002 2003 2004 2005 2006
N/A 0 0 0 0 0 0 0
N/A 0 0 0 0 0 0 0
N/A 0 0 0 0 0 0 0

FRA 2015 – Country Report, Viet Nam
72
2007 2008 2009 2010 2011 2012
0 0 0 0 0 0
0 0 0 0 0 0
0 0 0 0 0 0
Tier criteria
Category Tier for status
International forest management certification Tier 3: International forest management scheme recordsmaintained by the certifying organization for the reporting yearTier 2: International forest management scheme records reportedby the certifying organization for a period 2 years prior to thereporting year Tier: 1 Other
Domestic forest management certification Tier 3: National registry reports for domestic forest managementcertification maintained by the certifying organization for thereporting year Tier 2: Domestic forest management schemerecords reported by the certifying organization for a period 2years prior to the reporting year Tier: 1 Other
Tiers
Category Tier for status
International forest management certification Tier 3
Domestic forest management certification Tier 3
16.3 Comments
Category Comments related to data definitions etc
Certified forest area using an international forest managementcertification scheme
N/A
Domestic forest management certification N/A
Other general comments

FRA 2015 – Country Report, Viet Nam
73
17. How much money do governments collect from and spend on forests?Documents for this question:
• Guide for country reporting FRA 2015• FRA 2015 Terms and Definitions
17.1 Categories and definitions
Category Definition
Forest revenue All government revenue collected from the domestic production and trade of forest products andservices. For this purpose revenue include:• Goods : roundwood; sawnwood; biomass; woodbased panels; pulp and paper and non-wood forest
products.• Services : including concession fees and royalties, stumpage payments, public timber sales revenue
taxes and charges based on forest area or yield, taxes on domestic trade and export of forest products,special levies on forestry activities and payments into forest related funds, other miscellaneousinspection, licence and administrative fees levied by forest administrations, permit and licence feesfor recreation and other forest related activities.
Public expenditure onforestry
All government expenditure on forest related activities.
17.2 National data
17.2.1 Data sources
References to sourcesof information
Variables Years Additional comments
1 Ministry of planning andinvestment 2007
expenditure 2001-2005 N/A
2 N/A N/A N/A N/A
3 N/A N/A N/A N/A
4 N/A N/A N/A N/A
17.3 DataTable 17
Revenues / expenditures (000 local currency)Category
2000 2005 2010
Forest revenue N/A N/A N/A
Public expenditure on forestry 2802000000 3555000000 4000000000
2000 2005 2010
Name of Local Currency VND VND VND

FRA 2015 – Country Report, Viet Nam
74
17.4 Comments
Category Comments related to data definitions etc
Forest revenue N/A
Public expenditure on forestry N/A
Other general comments N/A
Other general comments

FRA 2015 – Country Report, Viet Nam
75
18. Who owns and manages the forests and how has this changed?Documents for this question:
• Guide for country reporting FRA 2015• FRA 2015 Terms and Definitions
18.1 Categories and definitions
Category Definition
Public ownership Forest owned by the State or administrative units of the public administration or by institutions orcorporations owned by the public administration.
...of which owned by thestate at national scale(sub-category)
Forest owned by the State at the national scale or administrative units of the public administration or byinstitutions or corporations owned by the public administration.
...of which owned by thestate at the sub-nationalgovernment scale (sub-category)
Forest owned by the State at the sub-national government scale or administrative units of the publicadministration or by institutions or corporations owned by the public administration.
Private ownership Forest owned by individuals, families, communities, private cooperatives corporations and otherbusiness entities, private, religious and educational institutions, pension or investment funds, NGOs,nature conservation associations and other private institutions.
...of which individuals(sub-category)
Forest owned by individuals and families.
...of which privatebusiness entities andinstitutions (sub-category)
Forest owned by private corporations cooperatives companies and other business entities as well asprivate nonprofit organizations such as NGOs nature conservation associations, and private religiousand educational institutions etc.
...of which local tribal andindigenous communities(sub-category)
Forest owned by a group of individuals belonging to the same community residing within or in thevicinity of a forest area or forest owned by communities of indigenous or tribal people The communitymembers are coowners that share exclusive rights and duties and benefits contribute to the communitydevelopment.
Unknown ownership Forest area where ownership is unknown includes areas where ownership is unclear or disputed.
Categories related tomanagement rights
of public forestsDefinition
Public Administration The Public Administration (or institutions or corporations owned by the Public Administration) retainsmanagement rights and responsibilities within the limits specified by the legislation.
Individuals households Forest management rights and responsibilities are transferred from the Public Administration toindividuals or households through long-term leases or management agreements.
Private companies Forest management rights and responsibilities are transferred from the Public Administration tocorporations, other business entities private cooperatives, private nonprofit institutions and associations,etc., through long-term leases or management agreements.
Communities Forest management rights and responsibilities are transferred from the Public Administration to localcommunities (including indigenous and tribal communities) through long-term leases or managementagreements.
Other form ofmanagement rights
Forests for which the transfer of management rights does not belong to any of the categories mentionedabove.
18.2 National data

FRA 2015 – Country Report, Viet Nam
76
18.2.1 Data sources
References to sourcesof information
Variables Years Additional comments
1 Forest inventory and planninginstitute submit to MARDand publishing
N/A 1990 N/A
2 Forest inventory and planninginstitute submit to MARDand publishing
N/A 1998 N/A
3 Forest protection department N/A 2002 N/A
4 Forest protection department N/A 2003 N/A
5 FIPI and PFD submit toMARD and publishing
N/A 2005 N/A
6 FIPI and PFD submit toMARD and publishing
N/A 2007 N/A
18.2.2 Classification and definitions
National class Definition
Private ownership Land owned by individuals, families, villages and communes,private co-operatives, religious and educational institutions,pension or investment funds, and other private institutions.
Public ownership Land owned by the State (national, state and regionalgovernments) or government-owned institutions or corporationsor other public bodies including cities, municipalities or landallocated to army, police …
Other ownership Not identified
N/A N/A
18.2.3 Original data
Forest area by the year (1000 hectares)CategoryFRA 2005
1990 2000 2002 2003 2005 2007
Privateownership
109 2,255 3,023 2,804 3,120 3,110
Publicownership
5,603 6,402 6,622 9,053 9,398 9,586
Others 3,651 3,068 2,577 673 559 691

FRA 2015 – Country Report, Viet Nam
77
Source: from FRA 2005 of Vietnam, Forest Protection Department
18.3 Analysis and processing of national data
18.3.1 Adjustment
The above data have been adjusted to get to the total of forest area reported in Question1a. Unknow ownershiphave been incremented accordingly.
18.3.2 Estimation and forecasting
18.3.3 Reclassification
18.4 DataTable 18a
Forest area (1000 hectares)Categories
1990 2000 2005 2010
Public ownership 5603 6402 9398 9587
... of which ownedby the state atnational scale
N/A N/A N/A 290
... of which ownedby the state atthe sub-nationalgovernment scale
N/A N/A N/A 9297
Private ownership 109 2255 3120 3543
... of which ownedby individuals
N/A N/A N/A N/A
... of which ownedby private businessentities andinstitutions
N/A N/A N/A N/A
... of which ownedby local, tribaland indigenouscommunities
N/A N/A N/A N/A
Unknownownership
3651 3070 559 998

FRA 2015 – Country Report, Viet Nam
78
TOTAL 9363.00 11727.00 13077.00 14128.00
Tiers
Category Tier for status Tier for reported trend
Public ownership Tier 3 Tier 2
Private ownership Tier 3 Tier 2
Unknown ownership Tier 3 Tier 2
Tier criteria
Category Tier for status Tier for reported trend
Ownership Tier 3: National forestry statistics registersof land titles or maps on land ownershipor all forest area under one ownershipcategory that is five years old or less. Tier2:National forestry statistics registers ofland titles or maps on land ownership orquestionnaires that are more than fiveyears old. Tier 1: Other
Tier 3 : Estimate based on repeatedcompatible tiers 3 (tier for status) Tier 2 :Estimate based on repeated compatible tier2 or combination tier 3 and 2 or 1 (tier forstatus) Tier 1 : Other
Table 18b - Holder of management rights of public forests
Forest area (000 hectares)Categories
1990 2000 2005 2010
Public Administration N/A 5896 6319 2108
Individuals N/A 2738 2854 3431
Private companies N/A 25.6 66.6 2018
Communities N/A N/A 55.4 258.2
Other N/A 2477 103 1771.8
TOTAL .00 11136.60 9398.00 9587.00
Category Tier for reported trend Tier for status
Public Administration Tier 2 Tier 3
Individuals Tier 2 Tier 3
Private companies Tier 2 Tier 3
Communities Tier 2 Tier 3

FRA 2015 – Country Report, Viet Nam
79
Other Tier 2 Tier 3
18.5 Comments
CategoryComments related todata definitions etc
Comments on the reported trend
Public ownership N/A N/A
Private ownership N/A N/A
Unknown ownership N/A N/A
Management rights N/A N/A
Other general comments to the table
N/A

FRA 2015 – Country Report, Viet Nam
80
19. How many people are directly employed in forestry?Documents for this question:
• Guide for country reporting FRA 2015• FRA 2015 Terms and Definitions
19.1 Categories and definitions
Category Definition
Full-time equivalents(FTE)
A measurement equal to one person working full-time during a specified reference period.
Employment in forestry Employment in activities related to production of goods derived from forests. This category correspondsto the ISIC/NACE Rev. 4 activity A02 (Forestry and logging).
19.2 National data
19.2.1 Data sources
References to sourcesof information
Variables Years Additional comments
1 Report of forestry sector Labour of forestrycompanies, forest protectionand special-use forest
2005 N/A
2 N/A N/A N/A N/A
3 N/A N/A N/A N/A
4 N/A N/A N/A N/A
19.2.2 Classification and definitions
National class Definition
Not available N/A
N/A N/A
N/A N/A
N/A N/A
19.2.3 Original data
Estimation and forecasting
Employment through forest with public ownership

FRA 2015 – Country Report, Viet Nam
81
According to report of forestry sector, there are about 20,000 staff working for forest companies, forestprotection and special-use forest (about 6 million ha).
Employment through rubber plantation
An estimate of labour time to take care of plantations, to protect it from fire and collect resin etc. was developedand applied over the areas of rubber plantation in 1.3.2 to provide data on annual employment. It is assumedthat one employment takes care of 4 ha plantation.
1990 2000 2005
Rubber Plantation 222 000 412000 460000
Employment per ha 0.25 0.25 0.25
Employment (FTE) 56 000 103 000 115 000
Employment through forest with private ownership
There are 3.12 million ha which is allocated in 2005 to households and communities. One person may manage30 ha of forest on average. Therefore, there are about 104,000 people working on this allocated land.
1990 2000 2005
Forest with PrivateOwnership
109,000 2,255,000 3,120,000
Employment per ha 0.033 0.033 0.033
Employment (FTE) 4 000 75 000 104 000
Rangers: about 7,000 staff.
------
2010
Rubber plantation 2010: 749000 ha
Employment in Rubber: 749000*0.25 = 187250
Employment in foset with private ownership: 104000
Ranger: 7000

FRA 2015 – Country Report, Viet Nam
82
Total : 298000
19.3 DataTable 19
Employment (000 years FTE)Category
1990 2000 2005 2010
Employment inforestry
80 198 239 298
... of which female N/A N/A N/A N/A
19.4 Comments
CategoryComments related todata definitions etc
Comments on the reported trend
Employment in forestry Staff in forestry companies, forestprotection and special-use forest
N/A
Other general comments to the table
N/A

FRA 2015 – Country Report, Viet Nam
83
20. What is the contribution of forestry to Gross Domestic Product (GDP)?Documents for this question:
• Guide for country reporting FRA 2015• FRA 2015 Terms and Definitions
20.1 Categories and definitions
Category Definition
Gross value added fromforestry (at basic prices)
This category corresponds to the ISIC/NACE Rev. 4 activity A02 (Forestry and logging).
20.2 DataTable 20 (Pre-filled data from UNdata/EUROSTAT)
Category Million CurrencyYear for latest
available information
Gross value added fromforestry (at basic prices)
1.72831298E7 Dong 2011
20.3 Comments
Category Comments
N/A N/A
Other general comments

FRA 2015 – Country Report, Viet Nam
84
21. What is forest area likely to be in the futureDocuments for this question:
• Guide for country reporting FRA 2015• FRA 2015 Terms and Definitions
21.1 Categories and definitions
Category Definition
Government target/aspiration for forest area
Government target/aspiration for forest area for a specific year.
Forests earmarked forconversion
Forest area that is allocated/classified or scheduled to be converted into non-forest uses.
21.2 National data
21.2.1 Data sources
References to sourcesof information
Variables Years Additional comments
1 N/A N/A N/A N/A
2 N/A N/A N/A N/A
3 N/A N/A N/A N/A
4 N/A N/A N/A N/A
21.3 DataTable 21a
Forest area (000 ha)Category
2020 2030
Government target/aspiration for forestarea
15100 N/A
Table 21b
Forest area (000 ha)Category
2013
Forests earmarked for conversion N/A
21.4 Comments
Category Comments
Government target/aspiration for forest area N/A

FRA 2015 – Country Report, Viet Nam
85
Forests earmarked for conversion N/A
Other general comments