Embed Size (px)
Citation preview
Video Conference: Video Conference: Organic Markets and CertificationOrganic Markets and Certification
Organic Production and Markets:Organic Production and Markets:The National PictureThe National Picture
Catherine GreeneSenior Agricultural EconomistEconomic Research ServiceUnited States Department of Agriculturewww.ers.usda.gov/briefing/organic

Fruits and Vegetables Accounted for 39% Fruits and Vegetables Accounted for 39% of U.S. Organic Food Sales in 2005of U.S. Organic Food Sales in 2005
Fruit&Veg
DairyBeverages
Pkgd, Prepared FoodBreads & Grains
Snack Foods
Condiments
Meat, Fish, Poultry
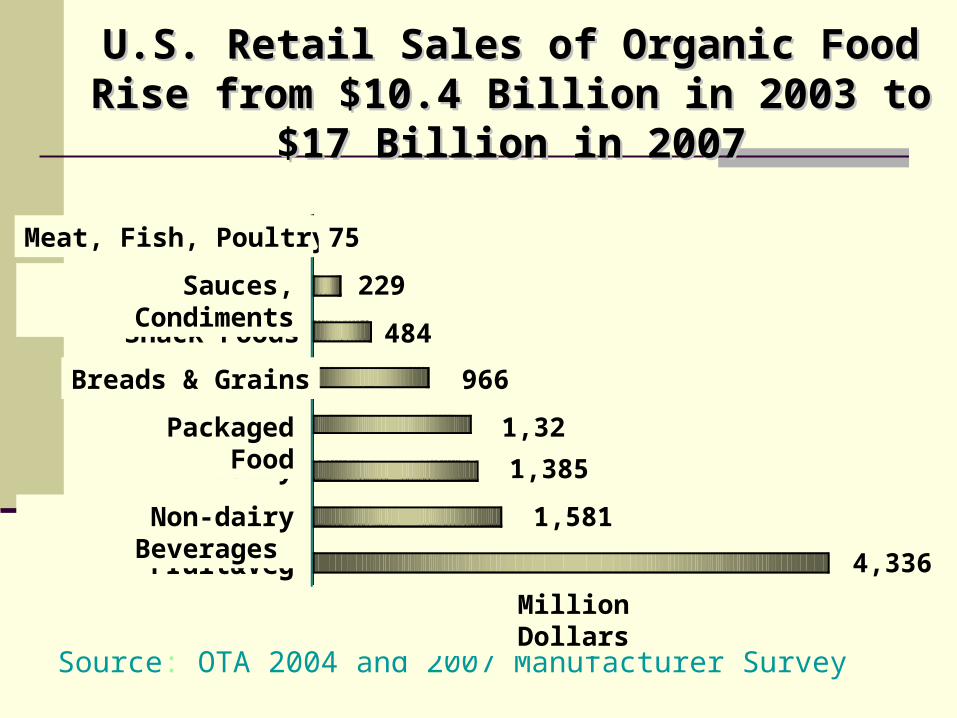
U.S. Retail Sales of Organic Food Rise from U.S. Retail Sales of Organic Food Rise from $10.4 Billion in 2003 to $17 Billion in 2007$10.4 Billion in 2003 to $17 Billion in 2007
Source: OTA 2004 and 2007 Manufacturer Survey
484
229
75
4,336
1,581
1,385
1,326
966
Fruits & vegetables
Nondairy beverages
Dairy products
Packaged foods
Bread & grains
Snack foods
Sauces Condiments
Meat Fish Poultry
Million dollarsFruit&Veg
Dairy
Non-dairy Beverages
Packaged Food
Breads & Grains
Snack Foods
Sauces, Condiments
Meat, Fish, Poultry 75
229
484
966
1,326
1,385
1,581
4,336
Million Dollars

U.S. Organic Food Growth and PenetrationU.S. Organic Food Growth and Penetration
Source: Organic Trade Association Manufacturer Survey 2004; Forecast Foreign Agricultural Service, USDA
0
5
10
15
20
25
1997 1998 1999 2000 2001 2002 2003 2004F
Annual Growth Rate
0
0.5
1
1.5
2
2.5
% of Total Food Sales
Growth Rate PenetrationGrowth Rate
Penetration
An
nu
al G
row
th R
ate
% o
f T
ota
l Fo
od
Sal
es
10
20
2000 2002 2004F1998
1
2
1.5
0.5
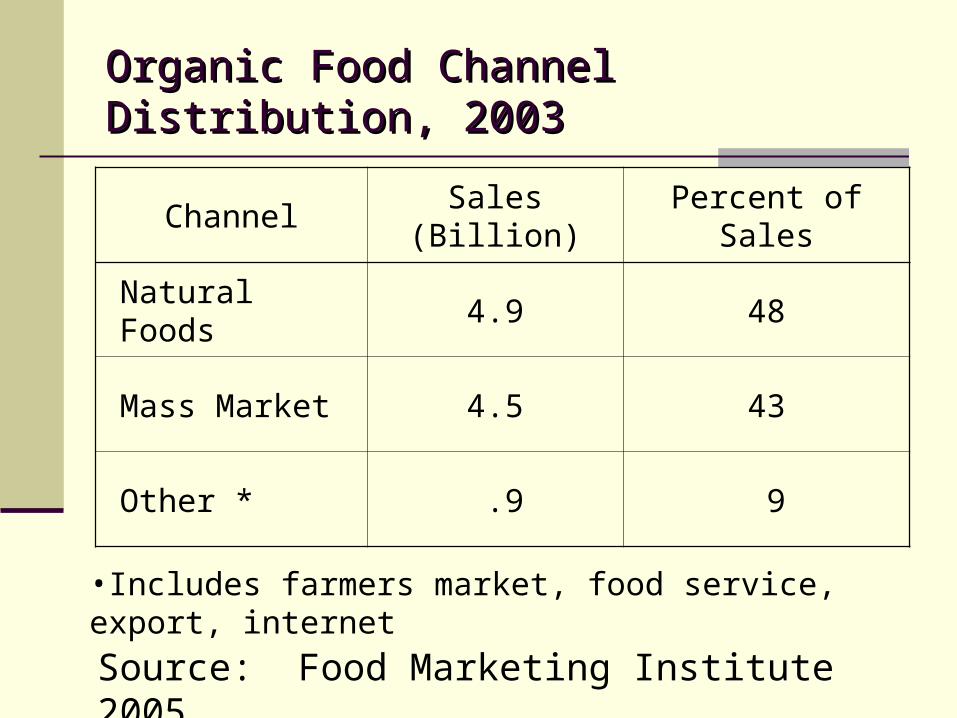
Organic Food Channel Distribution, 2003Organic Food Channel Distribution, 2003
Channel Sales (Billion) Percent of Sales
Natural Foods 4.9 48
Mass Market 4.5 43
Other * .9 9
•Includes farmers market, food service, export, internet
Source: Food Marketing Institute 2005

Organic Retail Price Premiums, 2005Organic Retail Price Premiums, 2005
Commodity Premium
Milk, butter 50 – 100%
Fruit 0 – 50%
Vegetables 50 – 150%
Corn, soybeans 100 – 150%
Beef, chicken 100 – 150%
Source: Rodale Institute; Current prices, www.newfarm.org/opx
USDA-AMS Market News Prices, USDA-AMS Market News Prices, Fruits and VegetablesFruits and Vegetables
AMS Market News publishes organic fruit and vegetable prices in some terminal markets (including Boston and San Francisco) www.ams.usda.gov/fv/mncs/TERMVEG.HTM
See an ERS analysis of farmgate and wholesale prices, 1999—2006 www.ers.usda.gov/data/OrganicPrices

USDA-AMS Market News Prices, USDA-AMS Market News Prices, Organic Poultry and EggsOrganic Poultry and Eggs
Market News began reporting organic poultry prices in the weekly in Jan. 2004, www.ams.usda.gov/mnreports/aj_PY050.txt
The report tracks prices paid to poultry or egg companies by the first receiver—such as a retailer, distributor, or manufacturer.
USDA-AMS Milk Marketing Order StatisticsUSDA-AMS Milk Marketing Order Statistics Organic Fluid Milk ProductsOrganic Fluid Milk Products
In Jan. 2006, AMS began reporting sales (in volume) of organic fluid milk products www.ams.usda.gov/dyfmos/mib/inareaslsbyprod.htm
In July 2007, organic milk sales were 2.7% of total milk sales—up from 1.7% in Jan. 2006
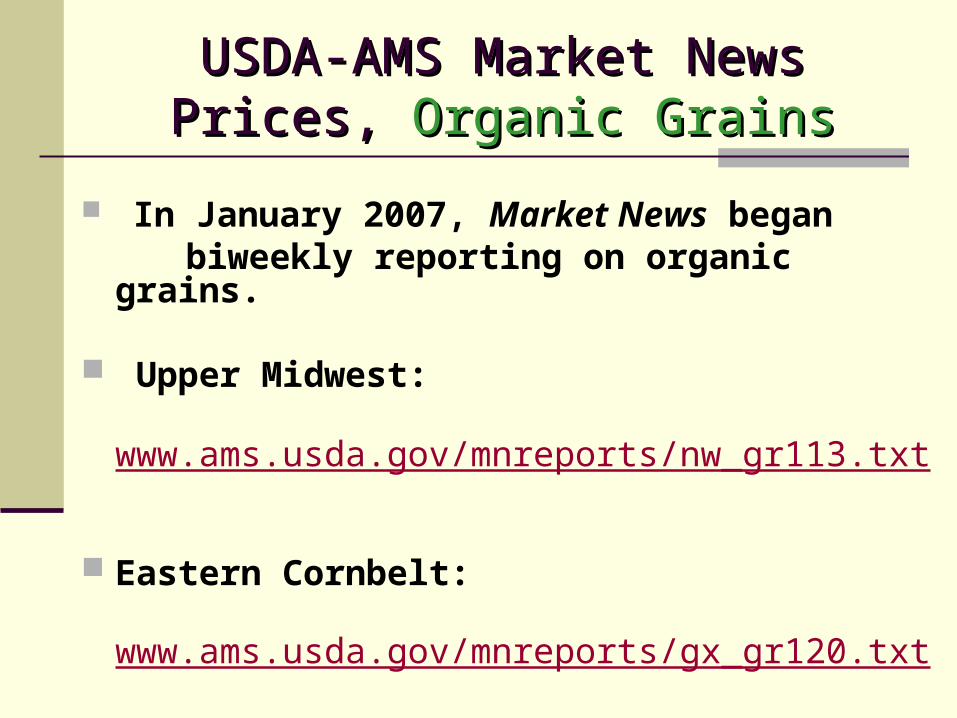
USDA-AMS Market News Prices, USDA-AMS Market News Prices, Organic GrainsOrganic Grains
In January 2007, Market News began biweekly reporting on organic grains.
Upper Midwest: www.ams.usda.gov/mnreports/nw_gr113.txt
Eastern Cornbelt: www.ams.usda.gov/mnreports/gx_gr120.txt
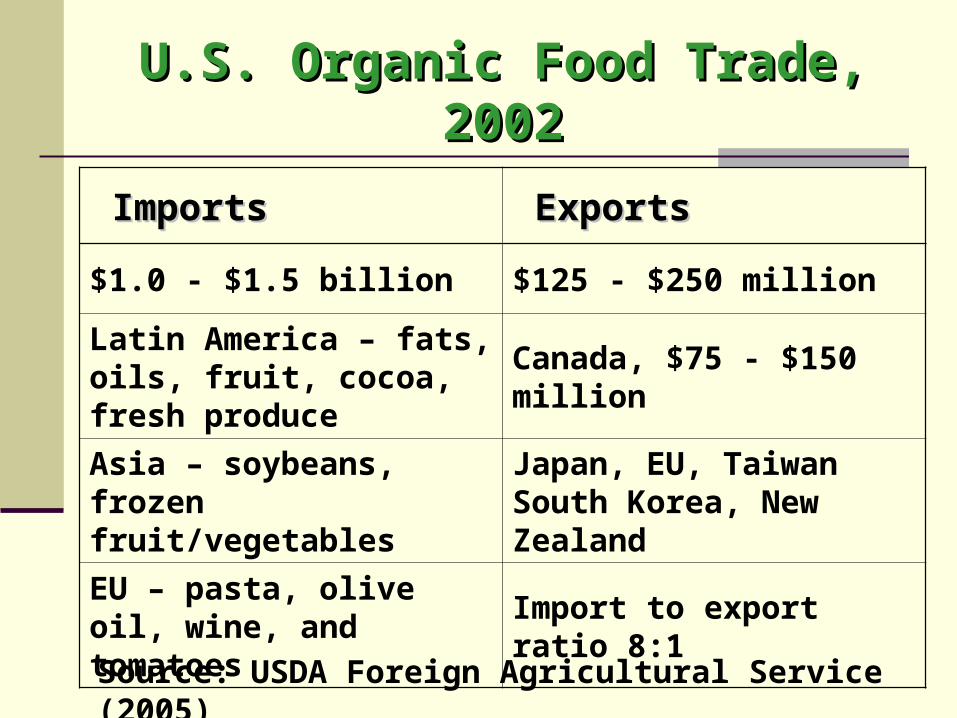
U.S. Organic Food Trade, 2002U.S. Organic Food Trade, 2002
ImportsImports ExportsExports
$1.0 - $1.5 billion $125 - $250 million
Latin America – fats, oils, fruit, cocoa, fresh produce
Canada, $75 - $150 million
Asia – soybeans, frozen fruit/vegetables
Japan, EU, Taiwan South Korea, New Zealand
EU – pasta, olive oil, wine, and tomatoes
Import to export ratio 8:1
Source: USDA Foreign Agricultural Service (2005)
ERS Organic Activities:ERS Organic Activities:Tracking adoption of organic farmingTracking adoption of organic farming
ERS has tracked the adoption of certified organic farming systems in the U.S since the mid-1990s
ERS collaborates with over 50 state and private certifiers, other USDA agencies, and several state offices of USDA’s National Agricultural Statistics Service to make estimates
Estimates available by commodity and state, 1997, 2001-2005, www.ers.usda.gov/Data/Organic

U.S. Certified Organic Cropland and U.S. Certified Organic Cropland and Pasture, 1992 - 2005Pasture, 1992 - 2005
1/ Excluding Alaska. Sources: 1992-94 ,USDA-AMS; 1995 Agrisystems International; 1997,2000-05, USDA-ERS
-
500
1,000
1,500
2,000
2,500
3,000
1992 1993 1994 1995 1997 2000 2001 2002 2003 2004 2005
Year
1,000 acres
Pasture 1/
Cropland
PastureCropland
1,00
0 A
cres
1,000
2,000
3,000
Year19
9219
9420
0020
0220
04

U.S. Certified Organic Acreage and Operations, 2005
Source: USDA, Economic Research Service, based on information from USDA-accredited State and private organic certifiers.

U.S. Organic Adoption Rate U.S. Organic Adoption Rate Specialty Crops, 2005Specialty Crops, 2005
Certified organic crop acreage accounts for:
1.6% U.S. tomato acreage 2.4% U.S. grape acreage 3.4% U.S. apple acreage 3.7% U.S. lettuce acreage 5.8% U.S. carrot acreage
(5% all U.S.vegetables; 2.5% all U.S. fruit)
Source: USDA Economic Research Service

U.S. Organic Adoption Rate U.S. Organic Adoption Rate Field Crops, 2005Field Crops, 2005
Certified organic crop acreage accounts for:
0.2% U.S. corn acreage0.2% U.S. soybean acreage 0.5% U.S. wheat acreage0.8% U.S. rice acreage3.1% U.S. dry pea-lentil acreage
Source: USDA Economic Research Service
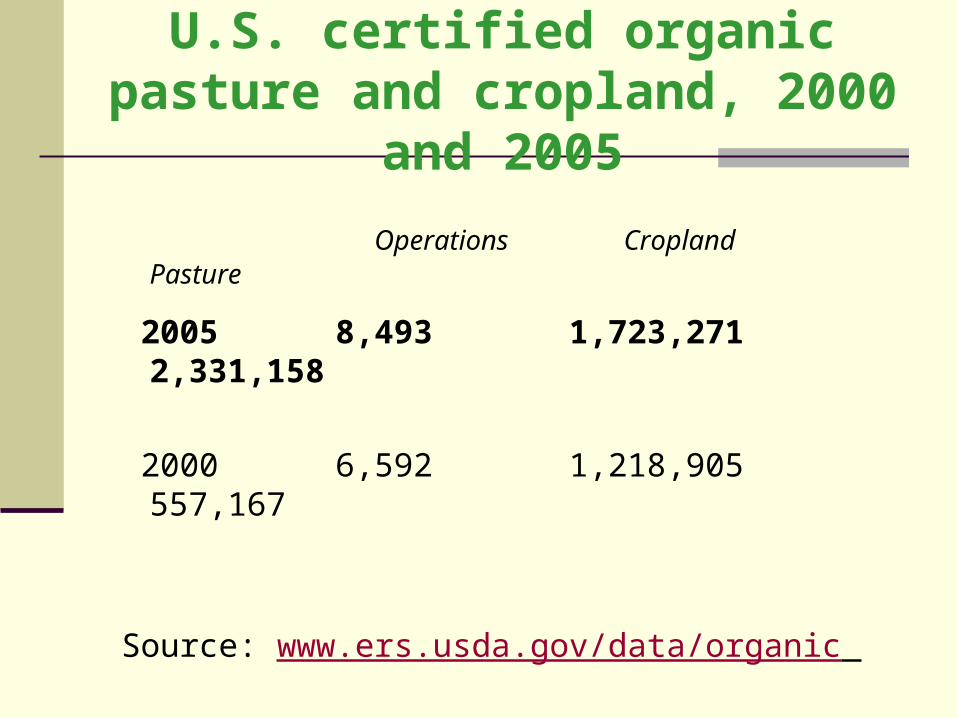
U.S. certified organic pasture and cropland, 2000 and 2005
Operations Cropland Pasture
2005 8,493 1,723,271 2,331,158
2000 6,592 1,218,905 557,167
Source: www.ers.usda.gov/data/organic

Certified organic pasture and cropland, Selected States, 2000 and 2005
Operations Cropland Pasture Indiana 2005 43 4,253 903
2000 73 5,347 270
Illinois 2005 131 24,682 1,694
2000 95 18,603 865 Ohio 2005 284 34,502 5,219
2000 262 35,469 4,744 Michigan 2005 164 43,105 1,414
2000 143 30,502 846
Source: www.ers.usda.gov/data/organic

ERS Organic Activities:ERS Organic Activities:Expanding USDA’s ARMS Producer SurveyExpanding USDA’s ARMS Producer Survey
ERS expanded the Agricultural Resources and Management Survey (ARMS) in 2005.
Targeted samples of organic producers: dairy in 2005 soybeans in 2006 apples in 2007
Findings on organic costs and revenue, www.ers.usda.gov/briefing/organic

For more information
ERS Organic Briefing Room,
www.ers.usda.gov/briefing/organic
—provides links to all ERS organic research reports, articles, and data