Embed Size (px)
Citation preview

Victorian Rock Lobster Fishery
Stock Assessment Report 2014/15 Season
February 2016

© The State of Victoria Department of Economic Development, Jobs, Transport and Resources
This work is licensed under a Creative Commons Attribution 3.0 Australia licence. You are free to re-use the work under that licence, on the condition that you credit the State of Victoria as author. The licence does not apply to any images, photographs or branding, including the Victorian Coat of Arms, the Victorian Government logo and the Department of Environment and Primary Industries logo. To view a copy of this licence, visit http://creativecommons.org/licenses/by/3.0/au/deed.en
ISBN 1 74146 111 1
Accessibility
If you would like to receive this publication in an alternative format, please telephone the Customer Service Centre 136 186, email [email protected], via
the National Relay Service on 133 677 www.relayservice.com.au. This document is also available on the internet at www.economicdevelopment.vic.gov.au
Disclaimer
This publication may be of assistance to you but the State of Victoria and its employees do not guarantee that the publication is without flaw of any kind or is wholly
appropriate for your particular purposes and therefore disclaims all liability for any error, loss or other consequence which may arise from you relying on any information
in this publication.

1
VICTORIAN ROCK LOBSTER FISHERY STOCK ASSESSMENT REPORT:
2014/15 SEASON
Adrian Linnane1, Richard McGarvey1, John Feenstra1, Lachlan McLeay1 and David J. Reilly2
1South Australian Research and Development Institute, PO Box 120, Henley Beach, South Australia 5022 2Fisheries Victoria, Department of Economic Development, Jobs, Transport and Resources, PO Box 114, Queenscliff, Victoria, 3225
SUMMARY
Western Zone
In 2014/15, the catch in Western Zone Rock Lobster Fishery over the fishing year (November –
September) was 224 tonnes (t). This was the sixth consecutive season that the total allowable
commercial catch (TACC) was fully taken. The TACC is set for a quota year (June – July) and was
230 t in 2014/15 (decreased from 260 t in 2013/14). Effort required to take the fishing year catch
was 416,000 potlifts.
The newly proposed harvest strategy for the fishery uses standardised catch per unit effort (CPUE)
as a primary indicator of rock lobster abundance1. All references to CPUE in this report are
therefore standardised values. Between 1991/92 to 2003/04, CPUE was relatively stable at 0.47–
0.62 kg/potlift, but then progressively declined over the next five years to an all-time low of 0.34
kg/potlift in 2008/09. Between 2009/10 and 2013/14, CPUE recovered to 0.48 kg/potlift, but in
2014/15 decreased to 0.46 kg/potlift.
While CPUE has increased over recent seasons, the abundance of undersized lobsters obtained from
fixed-site surveys, as well as modelled estimates of recruitment, indicate that recruitment levels to
the fishery have been low since 2010/11. The 2014/15 estimate of undersized lobsters was 0.85
undersized/potlift, the lowest on record. Mean weight of legal sized lobsters has also increased over
the last four seasons, providing further evidence that recruitment into the fishery is currently low.
The fishery stock assessment model estimated egg production in 2014/15 at 69% of the egg
production in the 2001/02 reference year (based on 90% probability). This was well above the limit
reference point of 35%.
In 2014/15, the available biomass was estimated to be 650 tonnes, with a corresponding fishing
exploitation rate of 34.4%.
In summary, despite some increases in CPUE in recent seasons, current catch rates remain low
historically. Combined with signals of reduced recruitment in the short-to-medium term, this report
confirms that conservative TACCs are warranted to maintain the resource on which the Western
Zone rock lobster fishery depends.
Eastern Zone
In 2014/15, the fishing year catch in the Eastern Zone Rock Lobster Fishery was 57 t. This reflected
the fifth consecutive season that the TACC was fully taken (the quota year TACC was 59 t). Effort
required to take the fishing year catch was 109,000 potlifts.
Standardised CPUE increased from 0.38 kg/potlift in 2008/09 to 0.59 kg/potlift in 2013/14. In
2014/15, it decreased to 0.55 kg/potlift.
1 Note that standardised CPUE values have been scaled to enable a TACC determination under the newly proposed
harvest strategy and therefore are slightly different to previous stock assessment reports.

2
As in the Western Zone, while CPUE has increased in recent seasons, the abundance of undersized
lobsters obtained from fixed-site surveys and modelled estimates of recruitment indicate that
recruitment levels to the fishery have also been low in recent seasons. The 2014/15 estimate of
undersized lobsters was 0.03 undersized/potlift, which is the lowest on record. Further, mean weight
of legal sized lobsters has also increased over the last three seasons.
The current stock assessment model estimated egg production in 2014/15 at 155% of the level of
egg production in the reference year of 2001/02 (based on 90% probability). This estimate is well
above the limit reference point of 104% of egg production in 2001/02. In 2014/15, the available
biomass was estimated to be 319 tonnes, with a corresponding fishing exploitation rate of 17.8%.
In summary, as with the Western Zone fishery, despite recent increases in CPUE in the Eastern
Zone fishery, information on future recruitment indicates that careful consideration of TACCs are
warranted in the short-to-medium term.
INTRODUCTION
The Victorian Rock Lobster Fishery Management Plan requires annual assessment of the southern
rock lobster (Jasus edwardsii) stock in Victoria to enable review of the Total Allowable
Commercial Catch (TACC) (Department of Primary Industries 2009).
The primary control tool for the fishery is individual catch quotas, where each licence holder is
annually assigned a proportion of the TACC through individual transferable quota units.
Catch Rate Standardisation
The stock assessment model uses standardised CPUE (Walker et al. 2012). All catch and effort data
are obtained from mandatory logbook returns and are firstly checked for any errors before being
entered into the Fisheries Victoria rock lobster database. Prior to standardisation, the data are
filtered to ensure that only data from fishers contributing returns in more than two separate fishing
years and contributing 200 or more records are included in the CPUE standardisation. CPUE is then
standardised for each zone separately by adjusting for average long-term differences among the
regions, depth ranges, fishing seasons, months, fishers and vessels. For standardisation, the regions
are Portland, Warrnambool and Apollo Bay in the Western Zone, and Queenscliff, San Remo and
Lakes Entrance in the Eastern Zone. The fishing depth ranges are <40 m and ≥40 m. Only
interactions between region and year are now included, which permits yearly estimates of
standardised CPUE by region.
Stock Assessment Model
The stock assessment uses a model that has been designed for rock lobster fisheries in Victoria,
South Australia, and Tasmania. It was developed through CSIRO and a series of FRDC projects
(Hobday and Punt 2001; Hobday and Punt 2009; Hobday et al. 2005). The model is length-
structured and currently set up in Victoria to account for numbers of rock lobsters in 5-mm-
carapace length-classes.
The model infers change and absolute levels of stock abundance from three principal data sources:
(i) standardised CPUE, to which biomass is assumed to vary in direct proportion, (ii) catches in both
weight and number, which provide a highly precise measure of mean weight of lobsters in the catch,
and (iii) length-frequency data interpreted in combination with the length-transition matrices to
yield estimates of mortality rate and absolute biomass.
Recruitment in the model is dependent on changes in mean size and size distribution of the catch
from length-frequency data, and on changes in CPUE, where, for example, a rise in CPUE and a

3
decrease in mean size signals an increase in recruitment and visa-versa. For males and females
separately, the model tracks, for each month, the number of rock lobsters in the population of size
equal to or larger than 60 mm carapace length. The model also accounts for both natural mortality
and fishing mortality.
Growth is modelled using length-transition matrices that specify the proportion of lobsters in each
length category that grow into larger length classes during each summer and autumn moulting
period. Growth in the model is sex specific, as is length-selectivity. Catchability by month is non-
sex specific. The length-transition matrices were estimated using extensive tag-recovery data.
STOCK ASSESSMENT RESULTS
Western Zone Stock Assessment
In the 2014/15 fishing year (Nov-Sept), 224 t of rock lobsters were harvested (Table 1, Figure 1).
The TACC was reduced over a 10 year period following its introduction in 2001/02 at 450 t and has
ranged between 230 t and 260 t for the past six fishing years (Table 2).
Effort levels have not decreased at the same rate as catch, averaging approximately 667,000 potlifts
from 2001/02 to 2008/09. Since 2010/11 however, effort has declined and in 2014/15 was 416,000
potlifts.
The newly proposed harvest strategy for the fishery uses standardised catch per unit effort (CPUE)
as a primary indicator of rock lobster abundance. All CPUE values reported in the text are therefore
standardised values. Between 1991/92 to 2003/04, CPUE was relatively stable at 0.47–0.62
kg/potlift, but then progressively declined over the next five years to an all-time low of 0.34
kg/potlift in 2008/09. Between 2009/10 and 2013/14, CPUE recovered to 0.48 kg/potlift, but in
2014/15 decreased to 0.46 kg/potlift (Figure 2).
Within the regions, the highest catch in 2014/15 came from the Portland region (101 t), followed by
Warrnambool (81 t) and Apollo Bay (42 t). Standardised catch rates in Portland and Apollo Bay
remained relatively stable while declines over the last two seasons were evident in Warrnambool
(Figure 3), where effort has been rising over the last three seasons.
Despite increases in CPUE, the abundance of undersized lobsters obtained from fixed-site surveys,
as well as modelled estimates of recruitment, indicate that recruitment levels to the fishery have
been low in recent seasons (Figures 4 and 5). The survey catch rate of undersized lobsters has
declined over the last four seasons, with the 2014/15 estimates of 0.85 undersized/potlift, the lowest
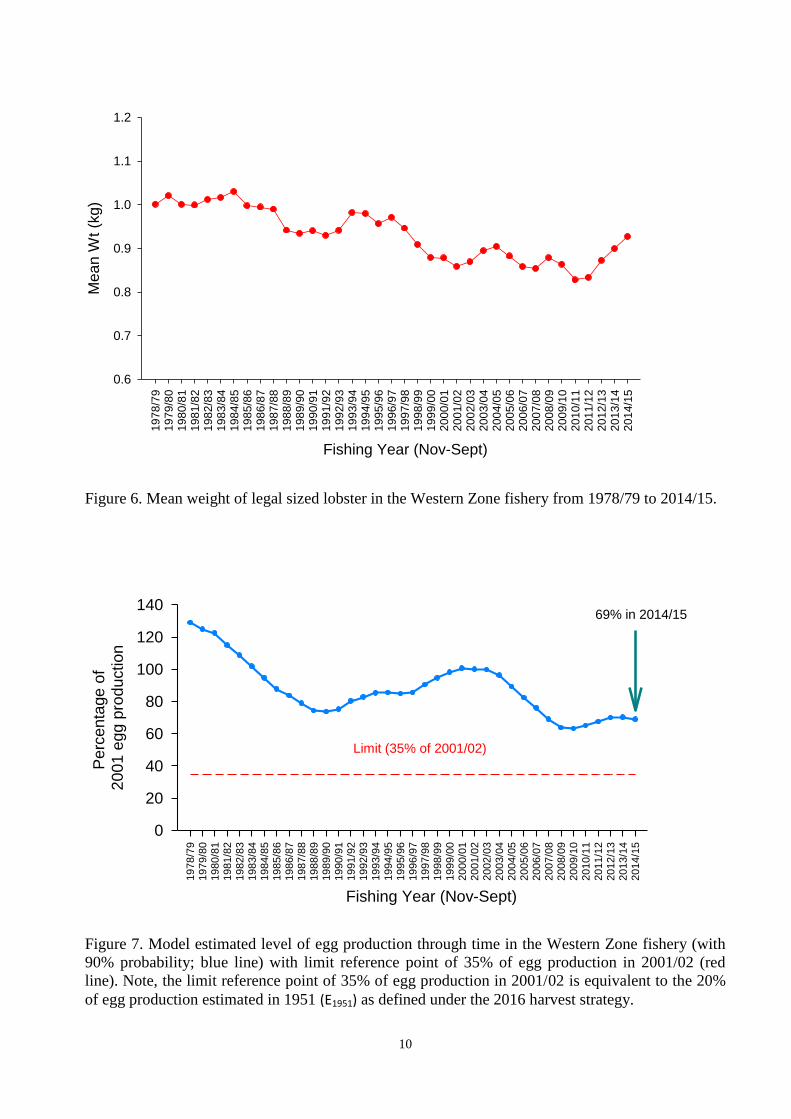
on record (Figure 4). Mean weight of legal sized lobsters has also increased over the last four
seasons, providing further evidence that recruitment into the fishery is currently low (Figure 6). In
addition, mean weight is likely rising due to lower yearly effort inducing lower levels of
exploitation, allowing lobsters to survive and grow to a larger size prior to harvest.
The current stock assessment model estimated egg production in 2014/15 at 69% of the level of egg
production in the reference year of 2001/02. This estimate is well above the limit reference point of
35% of egg production in 2001/02 (Figure 7) by more than 90% probability.
In 2014/15, the available biomass was estimated to be 650 tonnes, with a corresponding fishing
exploitation rate of 34.4% (Figure 8).
Length frequency data (used as input to the fishery model) from both the onboard observer and
fixed site sampling sources in the Western Zone are provided in Figures 9 through to 12.

4
Eastern Zone Stock Assessment
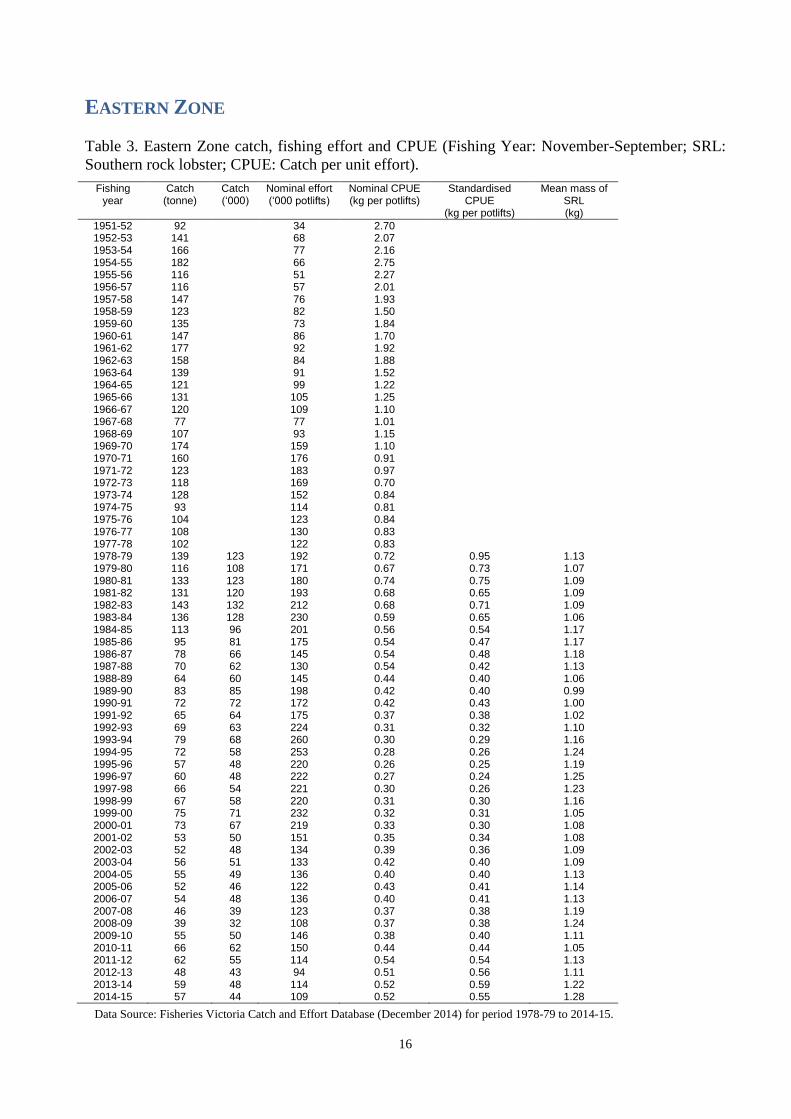
Since the implementation of a TACC in 2001, catches in the Eastern Zone have ranged between 39 t
(2008/09) and 66 t (2010/11) (Table 3, Figure 13). In 2014/15, the fishing year catch (Nov-Sept)
was 57 tonnes. This reflected the fifth consecutive season that the TACC was fully taken (Table 4).
Effort required to take the fishing year catch was 109,000 potlifts (Table 3).
Between 2008/09 and 2013/14 standardised CPUE improved from 0.38 kg/potlift to 0.59 kg/potlift
(Figure 14). In 2014/15, it decreased to 0.55 kg/potlift. The breakdown of catch within the regions
was consistent with that of previous years, with the majority of catch coming from Queenscliff and
San Remo (Figure 15). Between 2013/14 and 2014/15, standardised CPUE decreased in Queenscliff
and San Remo, and increased in Lakes Entrance.
While CPUE levels have improved in the Eastern Zone, trends in undersized lobsters obtained from
fixed-site surveys and levels of modelled recruitment suggest that recruitment levels to the fishery
have been low for the past four to five seasons (Figures 16 and 17). The abundance of undersized
lobsters has declined over the last three seasons, with the 2014/15 estimates of 0.03
undersized/potlift, the lowest on record. As in the Western Zone, mean weight of legal sized
lobsters in the Eastern Zone has also increased over the last four seasons (Figure 18).
The current stock assessment model estimated egg production in 2014/15 at 155% of the level of
egg production in the reference year of 2001/02. This estimate is well above the limit reference
point of 104% of egg production in 2001/02 (Figure 19), exceeding it by more than the 90%
probability threshold.
In 2014/15, the available biomass was estimated to be 319 tonnes, with a corresponding fishing
exploitation rate of 17.8% (Figure 20).
Length frequency data (used as input to the fishery model) from both the onboard observer and
fixed site sampling sources in the Eastern Zone are provided in Figures 21 through to 24.
References
Department of Primary Industries (2009). Victorian Rock Lobster Fishery Management Plan 2009. 'Fisheries Victoria Management
Report Series No. 70'. vi + 51 pp. Department of Primary Industries, Melbourne, Victoria, Australia.
Hobday, D., and Punt, A. E. (2001). Size-structured population modelling and risk assessment of the Victorian southern rock lobster,
Jasus edwardsii, fishery. Marine & Freshwater Research 52, 1495–1507.
Hobday, D., and Punt, A. E. (2009). How much spatial structure can data for rock lobster off Victoria, Australia support? New
Zealand Journal of Marine and Freshwater Research 43, 373–385.
Hobday, D., Punt, A. E., and Smith, D. C. (2005). Modelling the effects of Marine Protected Areas (MPAs) on the southern rock
lobster (Jasus edwardsii) fishery of Victoria, Australia. New Zealand Journal of Marine and Freshwater Research 39, 675–686.
Walker, T.I., Giri, K., Trinnie, F.I., and Reilly, D.J. (2012). CPUE data screening, selection and standardisation for stock assessment
of southern rock lobster (Jasus edwardsii) in Victoria. pp 23−74. In ‘Sustainability of the rock lobster resource in south-eastern
Australia in a changing environment: implications for assessment and management.’ Draft final report to Fisheries Research and
Development Corporation. November 2012. South Australian Research and Development Institute (Aquatic Sciences), Adelaide,
South Australia, Australia.

5
WESTERN ZONE
Table 1. Western Zone catch, fishing effort and CPUE (Fishing Year: November-September; SRL:
Southern rock lobster; CPUE: Catch per unit effort).
Fishing Year
Catch (tonne)
Catch (‘000)
Nominal effort (‘000 potlifts)
Nominal CPUE (kg per potlifts)
Standardised CPUE
(kg per potlifts)
Mean mass of SRL (kg)
1951-52 102 42 2.41 1952-53 132 54 2.43 1953-54 177 69 2.56 1954-55 292 115 2.54 1955-56 177 87 2.03 1956-57 134 75 1.79 1957-58 152 93 1.64 1958-59 147 84 1.75 1959-60 182 104 1.75 1960-61 268 138 1.95 1961-62 396 202 1.96 1962-63 326 226 1.44 1963-64 279 201 1.39 1964-65 233 175 1.33 1965-66 325 250 1.30 1966-67 308 288 1.07 1967-68 372 373 1.00 1968-69 413 455 0.91 1969-70 430 495 0.87 1970-71 441 497 0.89 1971-72 458 583 0.79 1972-73 463 638 0.73 1973-74 429 555 0.77 1974-75 286 430 0.67 1975-76 303 406 0.75 1976-77 339 464 0.73 1977-78 309 433 0.71 1978-79 486 485 622 0.78 1.04 1.00 1979-80 453 444 576 0.79 0.89 1.02 1980-81 549 548 680 0.81 0.89 1.00 1981-82 499 499 637 0.78 0.85 1.00 1982-83 460 455 608 0.76 0.88 1.01 1983-84 421 414 571 0.74 0.80 1.02 1984-85 406 394 578 0.70 0.73 1.03 1985-86 345 346 569 0.61 0.63 1.00 1986-87 351 353 595 0.59 0.63 0.99 1987-88 345 349 557 0.62 0.62 0.99 1988-89 304 322 577 0.53 0.55 0.94 1989-90 331 355 613 0.54 0.56 0.93 1990-91 317 337 650 0.49 0.52 0.94 1991-92 408 439 712 0.57 0.62 0.93 1992-93 408 433 779 0.52 0.59 0.94 1993-94 448 456 754 0.59 0.61 0.98 1994-95 435 444 789 0.55 0.54 0.98 1995-96 423 442 761 0.56 0.53 0.96 1996-97 402 414 787 0.51 0.47 0.97 1997-98 466 492 841 0.55 0.51 0.95 1998-99 516 568 861 0.60 0.57 0.91 1999-00 521 592 897 0.58 0.54 0.88 2000-01 525 598 895 0.59 0.53 0.88 2001-02 438 510 704 0.62 0.57 0.86 2002-03 430 495 630 0.68 0.60 0.87 2003-04 461 515 659 0.70 0.60 0.89 2004-05 408 451 667 0.61 0.53 0.90 2005-06 358 405 705 0.51 0.43 0.88 2006-07 336 392 698 0.48 0.43 0.86 2007-08 289 338 668 0.43 0.37 0.85 2008-09 235 268 606 0.39 0.34 0.88 2009-10 239 277 650 0.37 0.35 0.86 2010-11 254 307 590 0.43 0.41 0.83 2011-12 233 279 475 0.49 0.45 0.83 2012-13 259 296 485 0.53 0.47 0.87
2013-14 269 299 486 0.55 0.48 0.90 2014-15 224 242 416 0.54 0.46 0.93
Data Source: Fisheries Victoria Catch and Effort Database (December 2014) for period 1978-79 to 2014-15.

6
Table 2. Western Zone history of TACCs for each quota period from 2001-02 to 2014-15 (TACC:
Total Allowable Commercial Catch).
TACC
set TACC Caught Number
of months fished
Number of active
licenses
Number of
vessels (tonne) (tonne) per cent
2001-02* 1 Nov - 31 Mar 320 2002-03 1 Apr - 31 Mar 450 440 98 12 79 83 2003-04 1 Apr - 31 Mar 450 436 97 12 80 79 2004-05 1 Ap - 31 Mar 450 421 94 12 79 86 2005-06 1 Apr - 31 Mar 450 405 90 12 75 77 2006-07 1 Apr - 31 Mar 450 329 73 12 71 68 2007-08 1 Apr - 31 Mar 380 319 84 12 68 64 2008-09 1 Apr - 31 Mar 320 244 76 12 61 60
2009 1 Apr– 30 Jun 55.2 36 64 3 54 53 2009-10 1 Jul – 30 Jun 240 230 96 12 54 55 2010-11 1 Jul – 30 Jun 240 237 99 12 54 55 2011-12 1 Jul – 30 Jun 240 237 99 12 51 54 2012-13 1 Jul – 30 Jun 260 258 99 12 47 46 2013-14 1 Jul – 30 Jun 260 260 100 12 48 48 2014-15 1 Jul – 30 Jun 230 230 100 12 48 47
* Quota was introduced 1 November 2001 for a shortened quota period.
Data Source: Fisheries Victoria FILS Database.

7
Figure 1. Total catch (tonnes) and nominal effort (x1000 potlifts) in the Western Zone from
1978/79–2014/15. Arrow indicates TACC introduction (450 t) in 2001/02.
Figure 2. Standardised versus nominal CPUE (kg/potlift) in the Western Zone from 1978/79–
2014/15.
Note: standardised CPUE values marginally differ from those previously presented due to the need to rescale CPUE
each year so that the mean of yearly standardised CPUE equals the mean of nominal CPUE over the 1978-2013 period.
This fixes the average historical level of standardised CPUE to a constant that will not change from year to year from
this point forward, giving a more precise yearly zonal CPUE as input to the harvest strategy table for quota setting.
Fishing Year (Nov-Sept)
19
78
/79
19
79
/80
19
80
/81
19
81
/82
19
82
/83
19
83
/84
19
84
/85
19
85
/86
19
86
/87
19
87
/88
19
88
/89
19
89
/90
19
90
/91
19
91
/92
19
92
/93
19
93
/94
19
94
/95
19
95
/96
19
96
/97
19
97
/98
19
98
/99
19
99
/00
20
00
/01
20
01
/02
20
02
/03
20
03
/04
20
04
/05
20
05
/06
20
06
/07
20
07
/08
20
08
/09
20
09
/10
20
10
/11
20
11
/12
20
12
/13
20
13
/14
20
14
/15
Ca
tch
(to
nn
es)
0
100
200
300
400
500
600E
ffort (X
10
00
po
tlifts)
0
200
400
600
800
1000
1200
CatchEffort
Quota introduced

8
Figure 3. Regional catch (tonnes), effort (x1000 potlifts), and standardised CPUE (kg/potlift) in the
Western Zone from 1978/79-2014/15.

9
Figure 4. Number of undersized female (LML = 105 mm CL) and male (LML = 110 mm CL)
lobsters per potlift combined in fixed-site surveys in the Western Zone fishery from 2001/02 to
2014/15.
Figure 5. Relative abundance of recruits (to 60 mm in CL) in the Western Zone Fishery. These data
are used in the length-frequency model. The long-term historical average is also indicated (solid
black line).
Fishing year (Nov-Sept)
20
01
/02
20
02
/03
20
03
/04
20
04
/05
20
05
/06
20
06
/07
20
07
/08
20
08
/09
20
09
/10
20
10
/11
20
11
/12
20
12
/13
20
13
/14
20
14
/15
Un
de
rsiz
ed
/po
tlift
0.0
0.5
1.0
1.5
2.0
2.5
3.0
3.5
10
Figure 6. Mean weight of legal sized lobster in the Western Zone fishery from 1978/79 to 2014/15.
Figure 7. Model estimated level of egg production through time in the Western Zone fishery (with
90% probability; blue line) with limit reference point of 35% of egg production in 2001/02 (red
line). Note, the limit reference point of 35% of egg production in 2001/02 is equivalent to the 20%
of egg production estimated in 1951 (E1951) as defined under the 2016 harvest strategy.
Fishing Year (Nov-Sept)
19
78
/79
19
79
/80
19
80
/81
19
81
/82
19
82
/83
19
83
/84
19
84
/85
19
85
/86
19
86
/87
19
87
/88
19
88
/89
19
89
/90
19
90
/91
19
91
/92
19
92
/93
19
93
/94
19
94
/95
19
95
/96
19
96
/97
19
97
/98
19
98
/99
19
99
/00
20
00
/01
20
01
/02
20
02
/03
20
03
/04
20
04
/05
20
05
/06
20
06
/07
20
07
/08
20
08
/09
20
09
/10
20
10
/11
20
11
/12
20
12
/13
20
13
/14
20
14
/15
Mea
n W
t (k
g)
0.6
0.7
0.8
0.9
1.0
1.1
1.2
Fishing Year (Nov-Sept)
19
78
/79
19
79
/80
19
80
/81
19
81
/82
19
82
/83
19
83
/84
19
84
/85
19
85
/86
19
86
/87
19
87
/88
19
88
/89
19
89
/90
19
90
/91
19
91
/92
19
92
/93
19
93
/94
19
94
/95
19
95
/96
19
96
/97
19
97
/98
19
98
/99
19
99
/00
20
00
/01
20
01
/02
20
02
/03
20
03
/04
20
04
/05
20
05
/06
20
06
/07
20
07
/08
20
08
/09
20
09
/10
20
10
/11
20
11
/12
20
12
/13
20
13
/14
20
14
/15
Pe
rce
nta
ge
of
20
01
egg p
rod
uctio
n
0
20
40
60
80
100
120
140
Limit (35% of 2001/02)
69% in 2014/15

11
Figure 8. Model estimated levels of available biomass (solid red line) and associated fishing
exploitation rates (green line) in the Western Zone fishery between 1951 and 2014.

12
Figure 9. Length-frequency distribution of the number of female rock lobsters per 1,000 potlifts
caught in the Western Zone onboard observer program from 2004–05 to 2014–15 fishing years
(Nov–Sept). n, total number of lobsters measured.

13
Figure 10. Length-frequency distribution of the number of male rock lobsters per 1,000 potlifts
caught in the Western Zone onboard observer program from 2004–05 to 2014–15 fishing years
(Nov–Sept). n, total number of lobsters measured.

14
Figure 11. Length-frequency distribution of the number of female rock lobsters per 1,000 potlifts
caught in the Western Zone fixed-site survey program from 1995–96 to 2014–15 fishing years
(Nov–Sept). n, total number of lobsters measured.

15
Figure 12. Length-frequency distribution of the number of male rock lobsters per 1,000 potlifts
caught in the Western Zone fixed-site survey program from 1995–96 to 2014–15 fishing years
(Nov–Sept). n, total number of lobsters measured.
16
EASTERN ZONE Table 3. Eastern Zone catch, fishing effort and CPUE (Fishing Year: November-September; SRL:
Southern rock lobster; CPUE: Catch per unit effort).
Fishing year
Catch (tonne)
Catch (‘000)
Nominal effort (‘000 potlifts)
Nominal CPUE (kg per potlifts)
Standardised CPUE
(kg per potlifts)
Mean mass of SRL (kg)
1951-52 92 34 2.70 1952-53 141 68 2.07 1953-54 166 77 2.16 1954-55 182 66 2.75 1955-56 116 51 2.27 1956-57 116 57 2.01 1957-58 147 76 1.93 1958-59 123 82 1.50 1959-60 135 73 1.84 1960-61 147 86 1.70 1961-62 177 92 1.92 1962-63 158 84 1.88 1963-64 139 91 1.52 1964-65 121 99 1.22 1965-66 131 105 1.25 1966-67 120 109 1.10 1967-68 77 77 1.01 1968-69 107 93 1.15 1969-70 174 159 1.10 1970-71 160 176 0.91 1971-72 123 183 0.97 1972-73 118 169 0.70 1973-74 128 152 0.84 1974-75 93 114 0.81 1975-76 104 123 0.84 1976-77 108 130 0.83 1977-78 102 122 0.83 1978-79 139 123 192 0.72 0.95 1.13 1979-80 116 108 171 0.67 0.73 1.07 1980-81 133 123 180 0.74 0.75 1.09 1981-82 131 120 193 0.68 0.65 1.09 1982-83 143 132 212 0.68 0.71 1.09 1983-84 136 128 230 0.59 0.65 1.06 1984-85 113 96 201 0.56 0.54 1.17 1985-86 95 81 175 0.54 0.47 1.17 1986-87 78 66 145 0.54 0.48 1.18 1987-88 70 62 130 0.54 0.42 1.13 1988-89 64 60 145 0.44 0.40 1.06 1989-90 83 85 198 0.42 0.40 0.99 1990-91 72 72 172 0.42 0.43 1.00 1991-92 65 64 175 0.37 0.38 1.02 1992-93 69 63 224 0.31 0.32 1.10 1993-94 79 68 260 0.30 0.29 1.16 1994-95 72 58 253 0.28 0.26 1.24 1995-96 57 48 220 0.26 0.25 1.19 1996-97 60 48 222 0.27 0.24 1.25 1997-98 66 54 221 0.30 0.26 1.23 1998-99 67 58 220 0.31 0.30 1.16 1999-00 75 71 232 0.32 0.31 1.05 2000-01 73 67 219 0.33 0.30 1.08 2001-02 53 50 151 0.35 0.34 1.08 2002-03 52 48 134 0.39 0.36 1.09 2003-04 56 51 133 0.42 0.40 1.09 2004-05 55 49 136 0.40 0.40 1.13 2005-06 52 46 122 0.43 0.41 1.14 2006-07 54 48 136 0.40 0.41 1.13 2007-08 46 39 123 0.37 0.38 1.19 2008-09 39 32 108 0.37 0.38 1.24 2009-10 55 50 146 0.38 0.40 1.11 2010-11 66 62 150 0.44 0.44 1.05 2011-12 62 55 114 0.54 0.54 1.13 2012-13 48 43 94 0.51 0.56 1.11 2013-14 59 48 114 0.52 0.59 1.22 2014-15 57 44 109 0.52 0.55 1.28
Data Source: Fisheries Victoria Catch and Effort Database (December 2014) for period 1978-79 to 2014-15.

17
Table 4. Eastern Zone history of TACCs for each quota period from 2001/02 to 2014/15 (TACC:
Total Allowable Commercial Catch).
TACC
set TACC Caught Number of
months fished
Number of active
licenses
Number of vessels
(tonne) (tonne) Per cent 2001-02* 1 Nov - 31 Mar 42 2002-03 1 Apr - 31 Mar 60 49.9 83 12 39 34 2003-04 1 Apr - 31 Mar 60 54.4 91 12 41 36 2004-05 1 Apr - 31 Mar 60 53.2 89 12 41 39 2005-06 1 Apr - 31 Mar 60 55.7 93 12 30 29 2006-07 1 Apr - 31 Mar 60 53.5 89 12 30 30 2007-08 1 Apr - 31 Mar 66 50.1 76 12 31 31 2008-09 1 Apr - 31 Mar 66 41.3 63 12 26 24 2009-09 1 Apr - 30 Jun 6.9 5.8 84 3 19 20 2009-10 1 Jul - 30 Jun 66 43.9 67 12 22 21 2010-11 1 Jul - 30 Jun 66 64.8 98 12 29 28 2011-12 1 Jul - 30 Jun 66 65.3 99 12 25 26 2012-13 1 Jul - 30 Jun 48 47.3 99 12 26 25 2013-14 1 Jul - 30 Jun 51 50.8 100 12 27 27 2014-15 1 Jul - 30 Jun 59 59 100 12 25 23
* Quota was introduced 1 November 2001 for a shortened quota period.
Data Source: Fisheries Victoria FILS Database.

18
Figure 13. Total catch (tonnes) and nominal effort (x1000 potlifts) in the Eastern Zone from
1978/79–2014/15. Arrow indicates TACC introduction (60 t) in 2001/02.
Figure 14. Standardised CPUE (kg/potlift) in the Eastern Zone from 1978/79–2014/15.
Note: standardised CPUE values marginally differ from those previously presented due to the need to rescale CPUE
each year so that the mean of yearly standardised CPUE equals the mean of nominal CPUE over the 1978-2013 period.
This fixes the average historical level of standardised CPUE to a constant that will not change from year to year from
this point forward, giving a more precise yearly zonal CPUE as input to the harvest strategy table for quota setting.
Fishing Year (Nov-Sept)
19
78
/79
19
79
/80
19
80
/81
19
81
/82
19
82
/83
19
83
/84
19
84
/85
19
85
/86
19
86
/87
19
87
/88
19
88
/89
19
89
/90
19
90
/91
19
91
/92
19
92
/93
19
93
/94
19
94
/95
19
95
/96
19
96
/97
19
97
/98
19
98
/99
19
99
/00
20
00
/01
20
01
/02
20
02
/03
20
03
/04
20
04
/05
20
05
/06
20
06
/07
20
07
/08
20
08
/09
20
09
/10
20
10
/11
20
11
/12
20
12
/13
20
13
/14
20
14
/15
Catc
h (
tonnes)
0
30
60
90
120
150
180
Effo
rt (X 1
000 p
otlifts
)
0
50
100
150
200
250
300CatchEffort
Quota introduced

19
Figure 15. Regional catch (tonnes), effort (x1000 potlifts) and standardised CPUE (kg/potlift) in the
Eastern Zone from 1978/79-2014/15.

20
Figure 16. Number of undersized female (LML = 105 mm CL) and male (LML = 110 mm CL)
lobsters per potlift combined in fixed-site surveys in the Eastern Zone fishery from 2001/02 to
2014/15
Figure 17. Relative abundance of recruits (to 60 mm in CL) in the Eastern Zone Fishery. These data
are applied in the length-frequency model. The long-term historical average is also indicated (solid
black line).
Fixed-site surveys (commercial pots)
20
01
/02
20
02
/03
20
03
/04
20
04
/05
20
05
/06
20
06
/07
20
07
/08
20
08
/09
20
09
/10
20
10
/11
20
11
/12
20
12
/13
20
13
/14
20
14
/15
Nr/
po
tlift
0.0
0.1
0.2
0.3
0.4
Fishing Year (Nov-Sept)

21
Figure 18. Mean weight of legal sized lobster in the Eastern Zone fishery from 1978/79 to 2014/15.
Figure 19. Model estimated level of egg production through time in the Eastern Zone fishery (with
90% probability; blue line) with limit reference point of 104% of egg production in 2001/02 (red
line). Note, the limit reference point of 104% of egg production in 2001/02 is equivalent to the 20%
of egg production estimated in 1951 (E1951) as defined under the 2016 harvest strategy.
Fishing Year
19
78
/79
19
79
/80
19
80
/81
19
81
/82
19
82
/83
19
83
/84
19
84
/85
19
85
/86
19
86
/87
19
87
/88
19
88
/89
19
89
/90
19
90
/91
19
91
/92
19
92
/93
19
93
/94
19
94
/95
19
95
/96
19
96
/97
19
97
/98
19
98
/99
19
99
/00
20
00
/01
20
01
/02
20
02
/03
20
03
/04
20
04
/05
20
05
/06
20
06
/07
20
07
/08
20
08
/09
20
09
/10
20
10
/11
20
11
/12
20
12
/13
20
13
/14
20
14
/15
Mean W
t (k
g)
0.8
0.9
1.0
1.1
1.2
1.3
1.4
Fishing Year (Nov-Sept)
1978/7
91979/8
01980/8
11981/8
21982/8
31983/8
41984/8
51985/8
61986/8
71987/8
81988/8
91989/9
01990/9
11991/9
21992/9
31993/9
41994/9
51995/9
61996/9
71997/9
81998/9
91999/0
02000/0
12001/0
22002/0
32003/0
42004/0
52005/0
62006/0
72007/0
82008/0
92009/1
02010/1
12011/1
22012/1
32013/1
42014/1
5
Perc
enta
ge o
f 2001 e
gg p
roduction
0
20
40
60
80
100
120
140
160
180
200
Limit (104% of 2001/02)
155% in 2014/15

22
Figure 20. Model estimated levels of available biomass (red line) and associated fishing exploitation
rates (green line) in the Eastern Zone fishery between 1951 and 2014.

23
Figure 21. Length-frequency distribution of the number of female rock lobsters per 1,000 potlifts
caught in the Eastern Zone onboard observer program from 1995–96 to 2014–15 fishing years
(Nov–Sept). n, total number of lobsters measured.

24
Figure 22. Length-frequency distribution of the number of male rock lobsters per 1,000 potlifts
caught in the Eastern Zone onboard observer program from 1995–96 to 2014–15 fishing years
(Nov–Sept). n, total number of lobsters measured.

25
Figure 23. Length-frequency distribution of the number of female rock lobsters per 1,000 potlifts
caught in the Eastern Zone fixed-site survey program using commercial pots from 1995–96 to
2014–15 fishing years (Nov–Sept). n, total number of lobsters measured.

26
Figure 24. Length-frequency distribution of the number of male rock lobsters per 1,000 potlifts
caught in the Eastern Zone fixed-site survey program using commercial pots from 1995–96 to
2014–15 fishing years (Nov–Sept). n, total number of lobsters measured.