Embed Size (px)
Citation preview

Western rock Lobster Fishery harvest strategy and
decision ruLes FrameWorkProPosaLs
A Discussion Paper
Published byDepartment of Fisheries168 St. Georges Terrace
Perth WA 6000
March 2010
ISSN 0819-4327
FISHERIES MANAGEMENT PAPER NO. 239

ii Fisheries Management Paper No.239

Fisheries Management Paper No.239 iii
oPPortunity to comment
This paper was prepared by the Department of Fisheries. It is designed to encourage public involvement in making changes to harvest strategy and decision rules, which are used for the management of the west coast rock lobster resource.
Comments about this discussion paper are sought from all stakeholders, including commercial and recreational fishers, industry members and organisations, relevant community interest groups, government agencies and interested members of the public.
Once the public comments received on this draft discussion paper have been considered, a final proposal will be presented to the Minister for Fisheries for his approval.
Although specific issues have been identified for comment, your views are sought on any of the matters in the document that are of significance to you and/or your group.
To ensure your submission is as effective as possible, please:
• Make it clear and concise.
• List your points according to the topic sections and page numbers in this paper.
• Describe briefly each topic or issue you wish to discuss.
• State whether you agree or disagree with any or all of the information within each topic, or just what is of specific interest to you. Clearly state your reasons, particularly if you disagree, and give sources of information where possible.
• Suggest alternatives to address any issues that you disagree with.
Where and when to send your submission
The closing date for submissions is 12 May 2010. Please send your submission before this date, along with your full name, address, and association details (if applicable) to:
The Chief Executive Officer
Attention: Mr Rhys Brown
Southern Regional Office
The Department of Fisheries
Suite 7 Frederick House
70-74 Frederick Street
ALBANY 6330
Or by email to:
iv Fisheries Management Paper No.239
citation
K. Donohue, N. Caputi, S. de Lestang, R. Brown and W. Fletcher. 2010. Western Rock Lobster Fishery – Harvest Strategy and Decision Rules Proposals. Western Australian Department of Fisheries, 3rd Floor The Atrium, 168 St Georges Terrace, Perth, Western Australia, 6000.
Copyright © 2010
Western Australian Department of Fisheries, 3rd Floor The Atrium, 168 St Georges Terrace, Perth Western Australia, 6000.
Reproduction or translation of any part of this work is subject to Australian Copyright Law and is not allowed without the permission of the copyright owner. Requests for permission or further information should be addressed to Western Australian Department of Fisheries, 3rd Floor The Atrium, 168 St Georges Terrace, Perth Western Australia, 6000. Phone: (08) 9482 7333

Fisheries Management Paper No.239 1
contents
oPPortunity to comment ..................................................................................... iii
citation ............................................................................................................................ iv
gLossary and abbreviations .............................................................................. 3
executive summary .................................................................................................. 5
Summary of Proposals .................................................................................................. 6Objectives............................................................................................................ 7Indicators ............................................................................................................. 7Proposed Decision Rules .................................................................................... 9
1.0 introduction ...................................................................................................... 11
1.1 Background to the Fishery .................................................................................. 11
1.2 History of Decision Rules ................................................................................... 12
1.3 Current Initiatives ................................................................................................ 13
1.4 Taking Account of Uncertainty ........................................................................... 13
1.5 Indicators, Reference Values and Performance .................................................. 141.5.1 Indicators ................................................................................................. 141.5.2 Reference Values ..................................................................................... 151.5.3 Performance ............................................................................................ 15
2.0 management obJectives .............................................................................. 16
2.1 Sustainability Objective ...................................................................................... 16
2.2 Economic Objective ............................................................................................ 17
3.0 indicators ............................................................................................................ 18
3.1 Egg Production Measures .................................................................................... 183.1.1 Fishery-Dependent Breeding Stock Index Estimates .............................. 183.1.2 Fishery-Independent Breeding Stock Index Estimates ............................ 193.1.3 Model Estimates ..................................................................................... 19
3.2 Harvest Rate Measures ........................................................................................ 203.2.1 Depletion Analysis Estimates .................................................................. 203.2.2 Model estimates ....................................................................................... 21
4.0 reFerence vaLues ............................................................................................. 22
4.1 Egg Production ................................................................................................... 22
4.2 Harvest Rate ........................................................................................................ 23
5.0 PerFormance ...................................................................................................... 24
5.1 Egg Production .................................................................................................... 24
5.2 Harvest Rates ....................................................................................................... 26

2 Fisheries Management Paper No.239
6.0 decision ruLes FrameWork ....................................................................... 27
6.1 Management Guidelines ...................................................................................... 27
6.2 Proposed Guidelines for Decision Rules ............................................................. 276.2.1 Egg production......................................................................................... 276.2.2 MEY Harvest Rate ................................................................................... 29
7.0 Future directions ........................................................................................... 31
7.1 Bio-economic Modelling ..................................................................................... 31
7.2 Stock Assessment Model Improvements ............................................................. 31
7.3 Stock and Recruitment Relationship and Environment Effects .......................... 31
7.3 Integrated Fisheries Management – Recreational Sector .................................... 31
8.0 reFerences ........................................................................................................... 32
9.0 aPPendices ............................................................................................................ 33
Appendix 1 History of Regulation of the Western Rock Lobster Fishery .................. 33
Appendix 2 Bio-economic Modelling Project Summary ............................................... 36
Appendix 3 Research Projects - Investigating Aspects of Rock Lobster Stock and Recruitment and the Effects of Environmental Factors on Puerulus Recruitment .................................................................................. 37
Fisheries Management Paper No.239 3
gLossary and abbreviations
biomass: the total weight estimate of a stock or of a component of a stock.
breeding biomass: the total weight estimate of all mature female lobsters in a population (also referred to as spawning stock biomass).
decision rules: agreed responses that management makes under pre-defined circumstances regarding stock status and harvest rate.
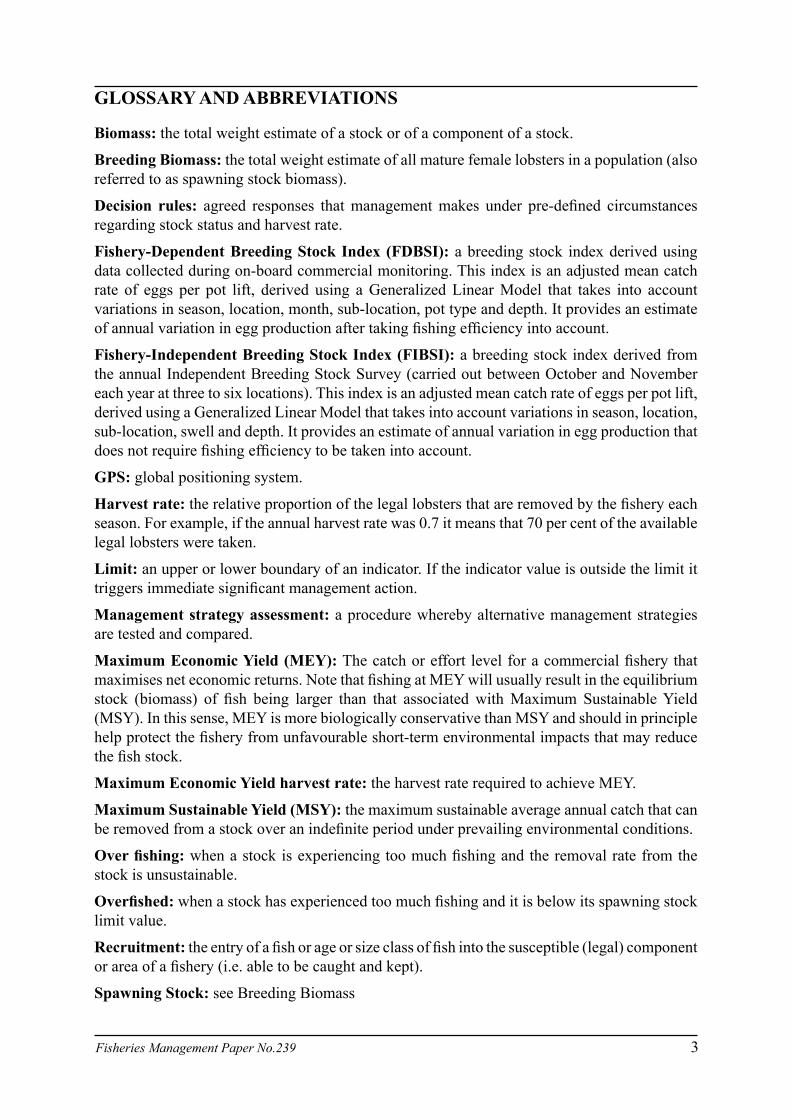
Fishery-dependent breeding stock index (Fdbsi): a breeding stock index derived using data collected during on-board commercial monitoring. This index is an adjusted mean catch rate of eggs per pot lift, derived using a Generalized Linear Model that takes into account variations in season, location, month, sub-location, pot type and depth. It provides an estimate of annual variation in egg production after taking fishing efficiency into account.
Fishery-independent breeding stock index (Fibsi): a breeding stock index derived from the annual Independent Breeding Stock Survey (carried out between October and November each year at three to six locations). This index is an adjusted mean catch rate of eggs per pot lift, derived using a Generalized Linear Model that takes into account variations in season, location, sub-location, swell and depth. It provides an estimate of annual variation in egg production that does not require fishing efficiency to be taken into account.
gPs: global positioning system.
harvest rate: the relative proportion of the legal lobsters that are removed by the fishery each season. For example, if the annual harvest rate was 0.7 it means that 70 per cent of the available legal lobsters were taken.
Limit: an upper or lower boundary of an indicator. If the indicator value is outside the limit it triggers immediate significant management action.
management strategy assessment: a procedure whereby alternative management strategies are tested and compared.
maximum economic yield (mey): The catch or effort level for a commercial fishery that maximises net economic returns. Note that fishing at MEY will usually result in the equilibrium stock (biomass) of fish being larger than that associated with Maximum Sustainable Yield (MSY). In this sense, MEY is more biologically conservative than MSY and should in principle help protect the fishery from unfavourable short-term environmental impacts that may reduce the fish stock.
maximum economic yield harvest rate: the harvest rate required to achieve MEY.
maximum sustainable yield (msy): the maximum sustainable average annual catch that can be removed from a stock over an indefinite period under prevailing environmental conditions.
over fishing: when a stock is experiencing too much fishing and the removal rate from the stock is unsustainable.
overfished: when a stock has experienced too much fishing and it is below its spawning stock limit value.
recruitment: the entry of a fish or age or size class of fish into the susceptible (legal) component or area of a fishery (i.e. able to be caught and kept).
spawning stock: see Breeding Biomass

4 Fisheries Management Paper No.239
stock: a functionally discrete population that is largely distinct from other populations of the same species. The west coast rock lobster forms a single stock.
target: The optimum value for an indicator(s) from a biological and/or economic and/or social perspective.
threshold: an upper or lower boundary of an indicator, outside of which management action may be required.
uncertainty: The level of error in the measurement or estimation of an individual indicator or the outcomes from a full stock assessment. It can also relate to the number of alternative scenarios, possible states or outcomes for a stock where probabilities are assigned to each possible state or outcome.

Fisheries Management Paper No.239 5
executive summary
This paper outlines proposals designed to be used in an updated and improved Harvest Strategy and Decision Rules Framework (referred to as the ‘Decision Rules’) that has been developed to meet the short and long term sustainability and economic needs of the West Coast Rock Lobster Managed Fishery. This approach represents international ‘best practice’ for fisheries management and is consistent with the Commonwealth Government’s Fisheries Harvest Strategy Policy1.
The main proposals contained in this paper are to revise the primary sustainability/biological objective (Proposal 1) to ensure that the breeding stock level in each Zone of the fishery is above its threshold level and will remain above this level for at least the next five years (Proposals 5 and 7). It is proposed that the egg production (breeding stock) indicators for each Zone of the fishery be estimated using the new stock assessment model (Proposal 3).
The performance of the fishery against the sustainability objective will explicitly incorporate the level of uncertainty associated with the estimates of egg production, up to five years into the future, to better determine if additional management actions are required (Proposal 7).
It is also proposed that a new economic objective based on delivering the maximum economic yield (MEY)2 from the fishery be introduced to the Decision Rules (Proposal 2). Harvest rates would be used as the indicator to measure the economic performance of the fishery (Proposal 4). This would usually mean that the harvest rate would be well below that required for sustainability, however, if there were any conflict between the two objectives, the sustainability objective would take priority.3
The concept of introducing harvest rate and uncertainty into the Decision Rules was proposed by the Department of Fisheries in early 2007 and was endorsed during a review of the stock assessment of the fishery conducted by four international scientists as part of the Western Rock Lobster Stock Assessment and Harvest Strategy Workshop, 16-20 July 20074. These concepts were also supported in recommendations of the Marine Stewardship Council’s auditors5.
The inclusion of these additional factors will make the Decision Rules more comprehensive and robust and ensure that future management decisions are more consistent, predictable and transparent.
Although not explicitly referred to in this document, the consideration of social issues that could be impacted by any management changes would be expected to be central to the consultative process.
1 Commonwealth Fisheries Harvest Strategy Policy and Guidelines, 2007 can be found at: http://www.daff.gov.au/fisheries/domestic/harvest_strategy_policy
2 There are major economic, social and sustainability advantages in managing the rock lobster fishery at its Maximum Economic Yield. It usually means that the harvest rate will be well below that required for sustainability.
3 The total abundance of legal lobsters would usually be greater under an MEY harvest rate compared to just using a sustainability objective.
4 The report can be found at: http://www.fish.wa.gov.au/docs/op/op050/index.php?0706 5 Scientific Certifications Systems performed the reassessment and annual audits on behalf of the MSC. Their
reports on the fishery can be found at: http://www.msc.org/track-a-fishery/certified/south-atlantic-indian-ocean/western-australia-rock-lobster/reassessment-downloads-1 In particular see the 2006 reassessment and 2007, 2008 and 2009 annual surveillance reports.
6 Fisheries Management Paper No.239
your views are sought on each of the proposals, the comments that are associated with them and any other issues contained in this paper. During the public comment period a number of international stock assessment experts will also be asked to provide comments on the proposals.
Following a six week public comment period, a final proposal for the harvest strategy and decision rules framework will be recommended to the Minister for Fisheries for approval.
summary of Proposals
The main focus of the proposals is to establish the basic principles that will underpin a future Harvest Strategy and Decision Rules Framework. The actual egg production and harvest rate estimates provided in this report may change in the near future, as the stock assessment model will be reviewed and updated in the first half of 2010 (which may result in changes to the estimates of egg production) and a new project will commence in early 2010 to improve the bio-economic assessment of the fishery to help determine the target harvest rate required to achieve MEY. However, these changes will not affect the principles that are the basis of the proposals in this paper.

Fisheries Management Paper No.239 7
objectives
Proposal 1
sustainability objective
Ensure that the egg production in each Zone of the fishery remains above its threshold level (currently the early 1980s level for the coastal zones6), and the probability of still being above this level in five years time is at least 75 per cent.
Comment:
It is proposed that the probability that the egg production will still be above the limit value in five years time is at least 90 per cent.
An alternative set of probabilities that take into account that there is greater uncertainty around the estimates of egg production the longer the time horizon, could be:
• The probability that the egg production is currently and in one or two years time will be above the threshold value is 90 per cent.
• The probability that the egg production in three, four and five years time will be above the threshold value is 75 per cent.
Proposal 2
economic objective
Ensure harvest rates for the fishery are consistent with the principles of Maximum Economic Yield (MEY).
Comment:
The MEY harvest rate indicator values used in the decision rules framework will be estimated annually. The estimates provided in this report are indicative only, as the stock assessment model and the MEY assessment are being updated. The harvest rate to achieve MEY would usually be well below that required for sustainability, however, where there is any conflict, the sustainability objective must first be met.7
indicators
Proposal 3
That the egg production values used in the decision rules framework are those estimates derived from the stock assessment model.
Comment:
The empirical data derived from the fishery-dependent (FDBSI) and independent (FIBSI) breeding stock indices will be used as inputs in the stock assessment model (part of the objective function) and hence will be reflected in the model estimates of current egg production.
6 The early 1980s level refers to the average level of breeding stock estimated to have been present in the fishery
between 1980, 1981 and 1982.7 The total abundance of legal lobsters would usually be greater under an MEY harvest rate compared to just
using a sustainability objective.

8 Fisheries Management Paper No.239
Proposal 4
That the harvest rate values used in the decision rules framework are those estimates derived from the stock assessment model.
reference values
Proposal 5
that the egg production reference values for Zones b and c (coastal areas north and south of 30°s respectively, see Figure 1b) are:
target range Egg production above the early 1980s level8.
threshold value Egg production at the early 1980s level.
Limit value Egg production 20 per cent below the threshold level.
That the breeding stock reference values for A Zone (Figure 1b) are:
target range Egg production above the level of the mid 1980s9.
threshold value Egg production at the level of the mid 1980s.
Limit value Egg production 20 per cent below the threshold level (mid 1980s).
Comment:
Your views are sought on whether the proposed egg production levels for the targets, thresholds and limits are appropriate.
Proposal 6
That the harvest rate reference values for each Zone of the fishery are:
target range MEY harvest rate ± 0.1
Comment:
No threshold or limit values are provided for the MEY harvest rate because they are not meaningful in terms of the economic objective.
The MEY harvest rate values will vary annually based on stock size and economic factors, such as the price paid for lobsters, exchange rates, cost of fishing – fuel, bait, crew, finance, etc. Thus, none of these reference values are expected to be static.
The harvest rate to achieve MEY would usually be well below that required for sustainability, however, where there is any conflict, the sustainability objective must first be met.
Your views are sought on the MEY target range.
8 The early 1980s level now refers to the average of 1980, 1981 and 1982. See Figure 1b for the Zones of the fishery.
9 The mid 1980s level for Zone A refers to the period 1984/84 to 1986/87.

Fisheries Management Paper No.239 9
Proposed decision rules
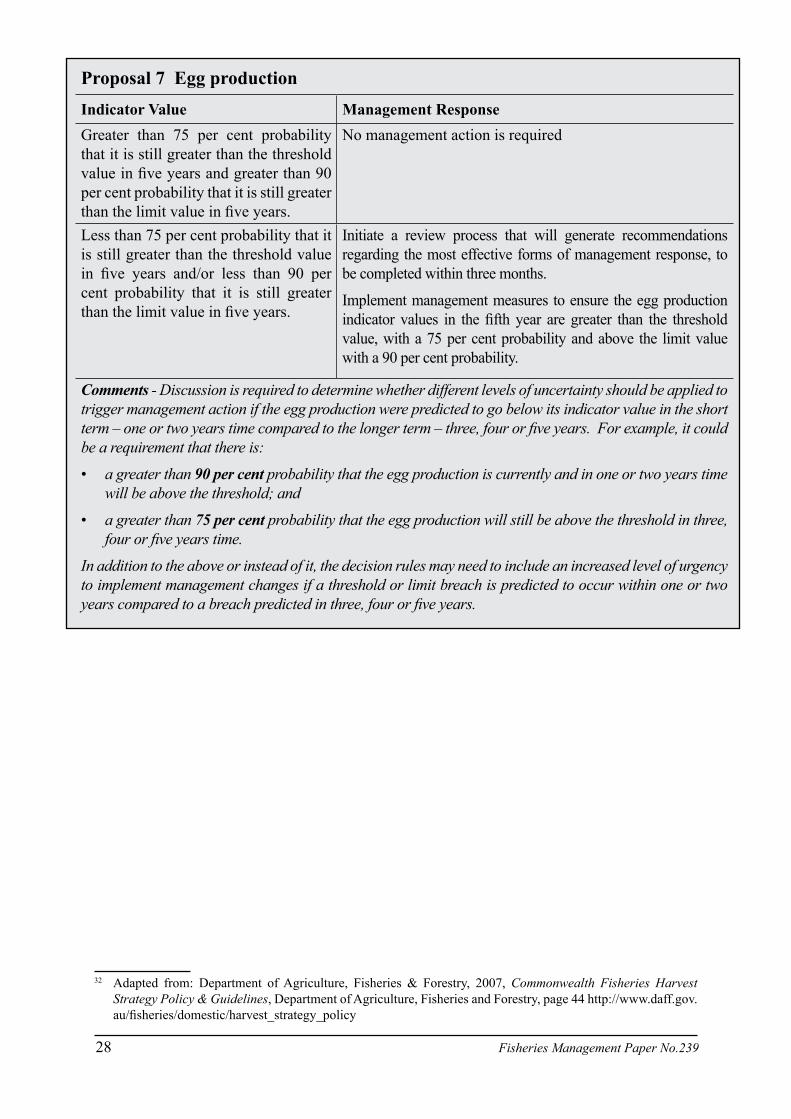
Proposal 7 egg production
indicator value management response
Greater than 75 per cent probability that it is still greater than the threshold value in five years and greater than 90 per cent probability that it is still greater than the limit value in five years
No management action is required
Less than 75 per cent probability that it is still greater than the threshold value in five years and/or less than 90 per cent probability that it is still greater than the limit value in five years
Initiate a review process that will generate recommendations regarding the most effective forms of management response, to be completed within three months.
Implement management measures to ensure the egg production indicator values in the fifth year are greater than the threshold value, with a 75 per cent probability and above the limit value with a 90 per cent probability.
In general any stock rebuilding or harvest rate reduction strategy should include the following32:
• clear specifications of objectives, including targets and time frames;
• performance criteria to evaluate the effectiveness of the strategy against its objectives;
• actions required to achieve the objectives of the strategy;
• key threats to recovery of the stock or to the economic performance of the fishery and strategies to counter them;
• the estimated duration and cost of the strategy / process, including apportionment of cost across government and other stakeholders;
• parties affected by the implementation of the strategy; and
• any significant related environmental impacts (positive or negative) arising from the implementation of the strategy.
10 Fisheries Management Paper No.239
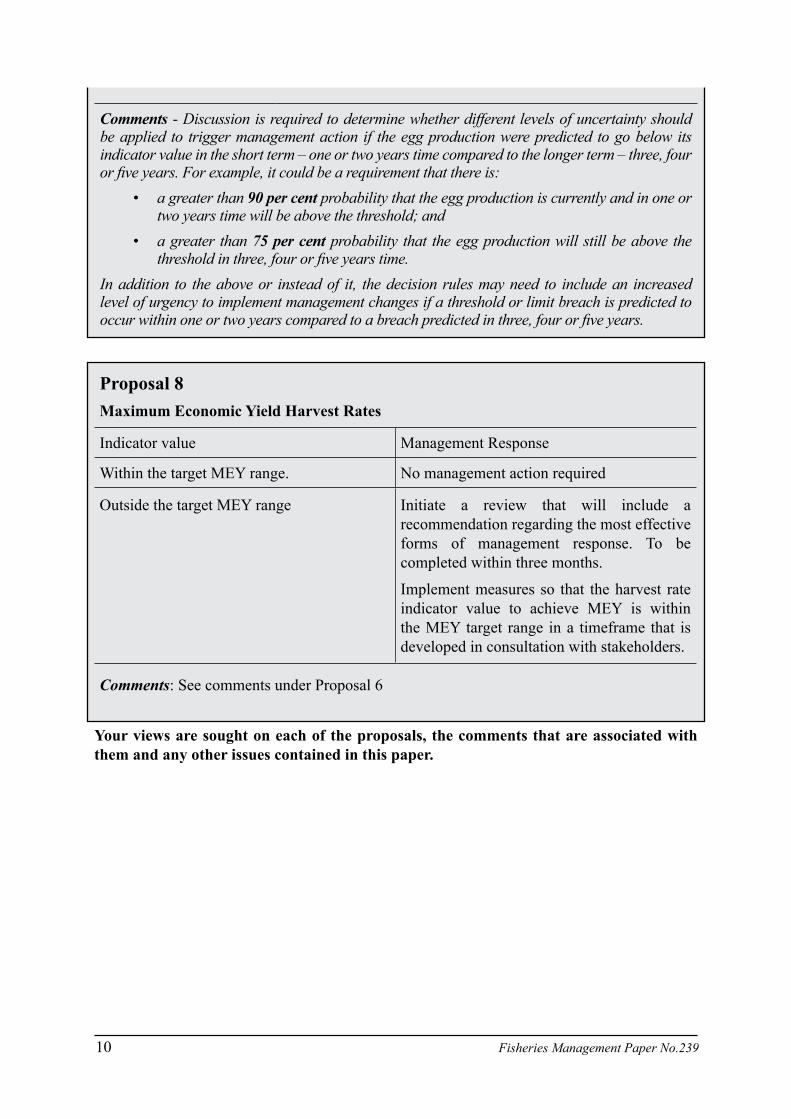
Comments - Discussion is required to determine whether different levels of uncertainty should be applied to trigger management action if the egg production were predicted to go below its indicator value in the short term – one or two years time compared to the longer term – three, four or five years. For example, it could be a requirement that there is:
• a greater than 90 per cent probability that the egg production is currently and in one or two years time will be above the threshold; and
• a greater than 75 per cent probability that the egg production will still be above the threshold in three, four or five years time.
In addition to the above or instead of it, the decision rules may need to include an increased level of urgency to implement management changes if a threshold or limit breach is predicted to occur within one or two years compared to a breach predicted in three, four or five years.
Proposal 8
maximum economic yield harvest rates
Indicator value Management Response
Within the target MEY range. No management action required
Outside the target MEY range Initiate a review that will include a recommendation regarding the most effective forms of management response. To be completed within three months.
Implement measures so that the harvest rate indicator value to achieve MEY is within the MEY target range in a timeframe that is developed in consultation with stakeholders.
Comments: See comments under Proposal 6
your views are sought on each of the proposals, the comments that are associated with them and any other issues contained in this paper.

Fisheries Management Paper No.239 11
1.0 introduction
1.1 background to the Fishery
The West Coast Rock Lobster Managed Fishery targets the western rock lobster, Panulirus cygnus, on the west coast of Western Australia between Shark Bay and Cape Leeuwin (Figure 1a), using baited pots (traps). The long term annual production averages about 11,000 tonnes, making it Australia’s most valuable single species fishery. Recently, however, catches have declined significantly due to low levels of puerulus settlement and hence recruitment to the fishery.
Fisheries Management Paper No. 239
15
1 INTRODUCTION
1.1 Background to the Fishery The West Coast Rock Lobster Managed Fishery targets the western rock lobster, Panulirus cygnus, on the west coast of Western Australia between Shark Bay and Cape Leeuwin (Figure 1a), using baited pots (traps). The long term annual production averages about 11,000 tonnes), making it Australia’s most valuable single species fishery. Recently, however, catches have declined significantly due to low levels of puerulus settlement and hence recruitment to the fishery.
Figure 1a. Distribution of the Wester Rock Lobster, Panulirus cygnus.
Figure 1b. Boundary of the west coast rock lobster managed fishery and the major management Zones, A, B and C. Big Bank is only a separate sub-zone of Zone B for approximately four weeks each season.
Figure 1a. Distribution of the Wester Rock Lobster, Panulirus cygnus.
Fisheries Management Paper No. 239
15
1 INTRODUCTION
1.1 Background to the Fishery The West Coast Rock Lobster Managed Fishery targets the western rock lobster, Panulirus cygnus, on the west coast of Western Australia between Shark Bay and Cape Leeuwin (Figure 1a), using baited pots (traps). The long term annual production averages about 11,000 tonnes), making it Australia’s most valuable single species fishery. Recently, however, catches have declined significantly due to low levels of puerulus settlement and hence recruitment to the fishery.
Figure 1a. Distribution of the Wester Rock Lobster, Panulirus cygnus.
Figure 1b. Boundary of the west coast rock lobster managed fishery and the major management Zones, A, B and C. Big Bank is only a separate sub-zone of Zone B for approximately four weeks each season.
Figure 1b. Boundary of the west coast rock lobster managed fishery and the major management Zones, A, B and C. Big Bank is only a separate sub-zone of Zone B for approximately four weeks each season.

12 Fisheries Management Paper No.239
The fishery is managed using a total allowable effort (TAE) system and associated input controls. The primary control mechanism is the number of traps (pots) used and the number of days on which fishing can occur, which create the TAE pot days. The fishery is divided into three major Zones (A, B and C, Figure 1b), which helps distribute effort across the fishery and allows the implementation of different management controls to address Zone specific issues.
The recreational rock lobster fishery mainly targets lobsters in relatively shallow waters around the coastal urban centres, e.g. Bunbury, Perth/Fremantle, Jurien and Geraldton.
For further information about the fishery see the State of the Fisheries Reports at: http://www.fish.wa.gov.au/docs/sof/index.php?0706
1.2 history of decision rules
The first formalised decision-making framework for maintaining the sustainability of the fishery was established in 1993 with the adoption of the following management objective:
That management arrangements maintain, or restore as the case may be,
the abundance of breeding lobsters at or above the levels in 1980.
This biologically-based objective identified the breeding stock as the indicator and the level of coastal breeding stock in 1980 as the reference point (Rock Lobster Industry Advisory Committee 1993, Fisheries Management Paper No. 55 and Bowen 1994, see references). This combination of indicator and reference point underpinned the development of the significant set of management changes that were implemented during the 1993/94 and 1994/95 seasons (Rock Lobster Industry Advisory Committee 1993, Fisheries Management Paper No. 55 – fishing effort reductions and protection of mature females), which resulted in a rapid rebuild of the breeding stock (see changes in stock indices over time, Figure 3, 4 and 5 and Appendix 1 for a history of management changes). Since then, the management of the fishery has essentially been based on the objective of ensuring the breeding stock remained above this level.
The breeding stock level in 198010 was chosen as the threshold level because it was considered to represent an adequate and safe level. It was assumed that if the early 1980s breeding stock levels were a safe level, then any variations seen in puerulus settlement would only be due to environmental conditions.
In response to concerns that the management process was not operating in a strategic manner, which was creating unnecessary uncertainty amongst stakeholders about the timing and extent of future management changes, a Decision Rules Framework was developed in 2004 to enable management decisions to be made using explicit, clear and targeted objectives (Bray 2004). These Decision Rules provided stakeholders with a greater understanding of why and when management changes would be needed and therefore a greater opportunity to become involved in developing future management strategies to meet the objectives of the fishery.
10 The 1980 level now refers to the average of 1980, 1981 and 1982.

Fisheries Management Paper No.239 13
Given the breeding stock levels within each Zone at that time, the 2004 Decision Rules were used to determine the management changes needed to protect the breeding stock in the 2005/06 season (see Appendix 1). While this framework was a significant advance on the 1993 version it still did not include:
• measures of uncertainty in the estimates of the performance indicators, e.g. the egg production (breeding stock);
• explicit consideration of an economic objective and harvest rates11 (levels of exploitation);
• projected trends in recruitment to the fishery and future breeding stock levels extending to a five year time horizon; and
• explicit target levels in addition to threshold and limit levels.
1.3 current initiatives
Expanding the Decision Rules Framework to include harvest rates, including the consideration of maximum economic yield (MEY) target levels, was proposed by the Department of Fisheries in 2007 and supported by international fisheries experts who took part in the Western Rock Lobster Stock Assessment and Harvest Strategy Workshop, 16-20 July 2007.12 Explicitly introducing uncertainty into the decision-making framework was also recommended by the workshop and the Marine Stewardship Council’s stock assessment reviewers13 and was supported by the Department of Fisheries.
Under the Department of Fisheries’ Integrated Fisheries Management (IFM) policy, the decision rules framework and the stock assessment model will be updated to include the catch share of the fishery’s other stakeholders (e.g. recreational and indigenous sectors), as well as the commercial sector. Under IFM the percentage of the recreational rock lobster catch could be an additional indicator, with a threshold reference value of five per cent of the total catch.
1.4 taking account of uncertainty
The harvest strategy and decision rules developed below incorporate uncertainty by expressing the rules in terms of the probability of the indicators (estimated egg production values) being above or below their reference values. For example, if the estimated egg production were equal to its threshold value this would be equivalent to stating that there is only a 50 per cent probability that the actual egg production is above the threshold value.
Stock assessment reviewers14 have recommended that the decision rules associated with sustainability should be more precautionary by accounting for uncertainty and that there should be a greater than 50 per cent probability that the indicator value is above the egg production threshold value. This has been incorporated into the framework by providing the 75 per cent and 90 per cent probability levels associated with the egg production indicator values over time, as shown in Figures 3, 4 and 5.
11 Harvest rate is the proportion of available (legal) lobsters that are caught each season, e.g. a harvest rate of 0.7 indicates that 70 per cent of the legal lobsters were caught in that season.
12 The report of Western Rock Lobster Stock Assessment and Harvest Strategy Workshop 16 – 20 July 2007 can be found at: http://www.fish.wa.gov.au/docs/op/op050/index.php?0706
13 Scientific Certifications Systems perform the reassessment and annual audits on behalf of the MSC. Their reports on the fishery can be found at: http://www.msc.org/track-a-fishery/certified/south-atlantic-indian-ocean/western-australia-rock-lobster/reassessment-downloads-1 In particular, see the 2006 reassessment and the 2007, 2008 and 2009 annual surveillance reports.
14 See footnote 11.

14 Fisheries Management Paper No.239
1.5 indicators, reference values and Performance
Accepted fisheries management practice is to describe harvest strategies in terms of “indicators”, “reference values” and “performance”.15 The types of indictors and reference points used reflect the level of knowledge of the species, the fishery and the sophistication of the assessment tools being used (empirical data, models, etc). An explanation of each of these terms and their application to the fishery is provided below.
1.5.1 indicators
Indicators measure some aspect of the status of the fished stock such as harvest rate, level of breeding stock, biomass (weight of animals), etc. An indicator may be a direct observation (such as catch per unit effort or catch rate of breeding lobsters) or it may be estimated using a stock assessment model. The value of an indicator may be either an absolute measure, e.g. 10,000 tonnes of catch, or a relative measure such as an index, e.g. an egg production index, which is based on catch rates of breeding lobsters per pot lift.
Single indicator
In Figure 2 the hypothetical target, threshold and limit for a single sustainability indicator – egg production - are illustrated. The solid black line represents the historic egg production values, the horizontal lines the threshold and limit reference values, and the green the target or ‘healthy’ region and the red the ‘high risk’ unsustainable region.
Fisheries Management Paper No. 239
19
Figure 2: A hypothetical example of variation in rock lobster egg production over time with reference to biological sustainability reference regions (adapted from Bray 2004). Two or more Indicators Two or more indicators can provide a more robust way of evaluating the performance of the fishery against multiple objectives concurrently. For the rock lobster fishery the two indicators that are proposed are egg production for the sustainability objective, and a harvest rate targeted at the economic objective of MEY. From the sustainability perspective the fishery will be managed to ensure egg production remains within its target region, i.e. above its threshold value. However, the harvest rate required to achieve the MEY objective is also a key factor in management considerations. Whereas the reference values for egg production are expected to remain static, the reference values for the MEY harvest rate will vary through time due to variations in the levels of future recruitment into the fishery and the cost of fishing and the price received for lobsters.
1.5.2 Reference Values
For harvest strategies to be effective, indicators need to be expressed in terms of quantifiable reference values that are related to the management objectives. These reference values can be a target (where you want to be), threshold (where you review your position), or limit (where you don’t want to be). Reference values for indicators are used to determine the performance of the fishery against its objectives, thereby triggering and guiding management action.
Sustainability indicator – egg production
Time (fishing seasons)
Tracking changes in the
egg production
(B)
70/71 80/81 90/91 00/01
Threshold
Limit
Healthy
Unsustainable
Target Region
Figure 2. A hypothetical example of variation in rock lobster egg production over time with reference to biological sustainability reference regions (adapted from Bray 2004).
Two or more Indicators
Two or more indicators can provide a more robust way of evaluating the performance of the fishery against multiple objectives concurrently. For the rock lobster fishery the two indicators that are proposed are egg production for the sustainability objective, and a harvest rate targeted at the economic objective of MEY. 15 See Commonwealth Fisheries Harvest Strategy Policy: http://www.daff.gov.au/fisheries/domestic/harvest_
strategy_policy
Fisheries Management Paper No.239 15
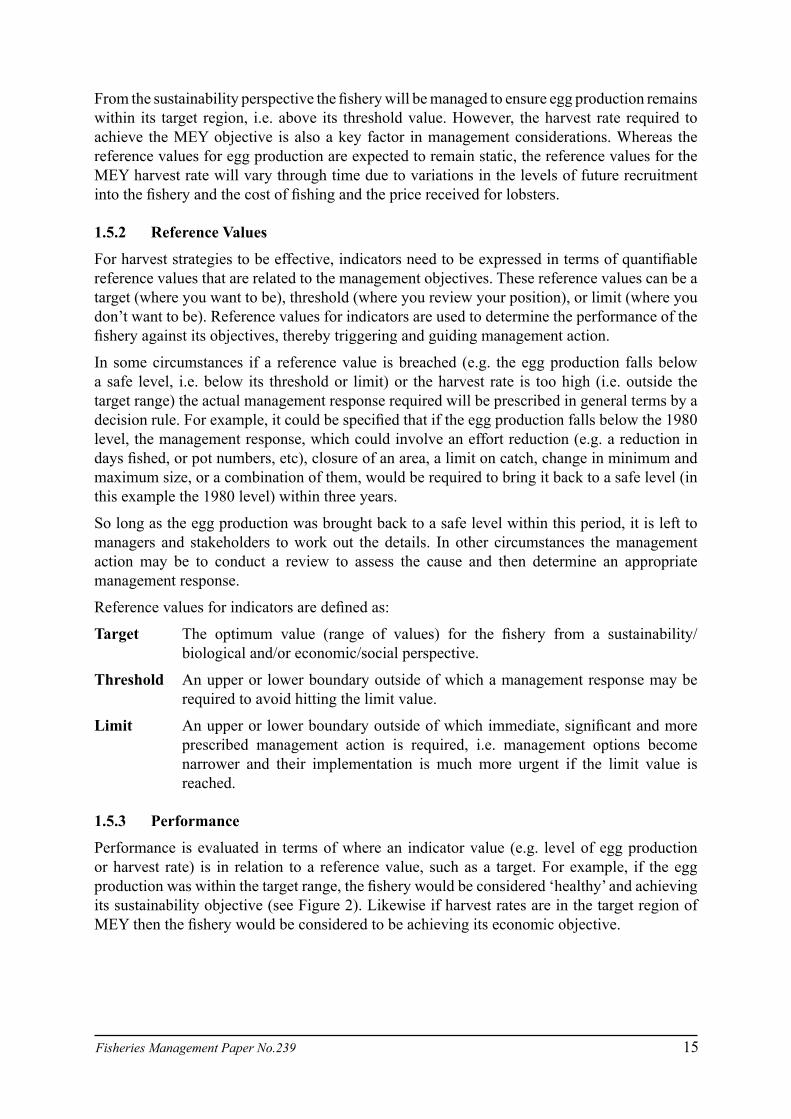
From the sustainability perspective the fishery will be managed to ensure egg production remains within its target region, i.e. above its threshold value. However, the harvest rate required to achieve the MEY objective is also a key factor in management considerations. Whereas the reference values for egg production are expected to remain static, the reference values for the MEY harvest rate will vary through time due to variations in the levels of future recruitment into the fishery and the cost of fishing and the price received for lobsters.
1.5.2 reference values
For harvest strategies to be effective, indicators need to be expressed in terms of quantifiable reference values that are related to the management objectives. These reference values can be a target (where you want to be), threshold (where you review your position), or limit (where you don’t want to be). Reference values for indicators are used to determine the performance of the fishery against its objectives, thereby triggering and guiding management action.
In some circumstances if a reference value is breached (e.g. the egg production falls below a safe level, i.e. below its threshold or limit) or the harvest rate is too high (i.e. outside the target range) the actual management response required will be prescribed in general terms by a decision rule. For example, it could be specified that if the egg production falls below the 1980 level, the management response, which could involve an effort reduction (e.g. a reduction in days fished, or pot numbers, etc), closure of an area, a limit on catch, change in minimum and maximum size, or a combination of them, would be required to bring it back to a safe level (in this example the 1980 level) within three years.
So long as the egg production was brought back to a safe level within this period, it is left to managers and stakeholders to work out the details. In other circumstances the management action may be to conduct a review to assess the cause and then determine an appropriate management response.
Reference values for indicators are defined as:
target The optimum value (range of values) for the fishery from a sustainability/biological and/or economic/social perspective.
threshold An upper or lower boundary outside of which a management response may be required to avoid hitting the limit value.
Limit An upper or lower boundary outside of which immediate, significant and more prescribed management action is required, i.e. management options become narrower and their implementation is much more urgent if the limit value is reached.
1.5.3 Performance
Performance is evaluated in terms of where an indicator value (e.g. level of egg production or harvest rate) is in relation to a reference value, such as a target. For example, if the egg production was within the target range, the fishery would be considered ‘healthy’ and achieving its sustainability objective (see Figure 2). Likewise if harvest rates are in the target region of MEY then the fishery would be considered to be achieving its economic objective.

16 Fisheries Management Paper No.239
2.0 management obJectives
An essential component of the framework is the specification of the management objectives for the fishery, as this enables the selection of the appropriate indicators, performance limits and targets.
Section 3(1) of the Fish Resources Management Act 1994 (FRMA) specifies the objects of the FRMA which are:
to conserve, develop and share the fish resources of the State for the benefit of present and future generations.
Section 3(2) of the FRMA also has a number of specific objects; of particular relevance are objects (b) and (e) which state:
(b) to ensure that the exploitation of fish resources is carried out in a sustainable manner; and
(e) to achieve the optimum economic, social and other benefits from the use of fish resources.
In line with the objects of the FRMA above, the Department of Fisheries proposes two key objectives for use in developing advice on future management arrangements.
2.1 sustainability objective
The purpose of this sustainability objective is to ensure that the egg production (breeding stock) is at a safe level, i.e. above its threshold value, and is likely to remain above this level in the short to medium term with a reasonable level of certainty. This has been expressed more specifically as:
Proposal 1
sustainability objective
Ensure that the egg production in each Zone of the fishery remains above its threshold level (currently the early 1980s level for the coastal zones16), and the probability of still being above this level in five years time is at least 75 per cent.
Comment:
It is proposed that the probability that the egg production will still be above the limit value in five years time is at least 90 per cent.
An alternative set of probabilities that take into account that there is greater uncertainty around the estimates of egg production the longer the time horizon, could be:
• The probability that the egg production is currently and in one and two years time will be above the threshold value is 90 per cent.
• The probability that the egg production in three, four and five years time will be above the threshold value is 75 per cent.
16 The early 1980s level now refers to the average level of breeding stock estimated to have been present in the fishery between 1980, 1981 and 1982. See Figure 1b for the Zones of the fishery.
Fisheries Management Paper No.239 17
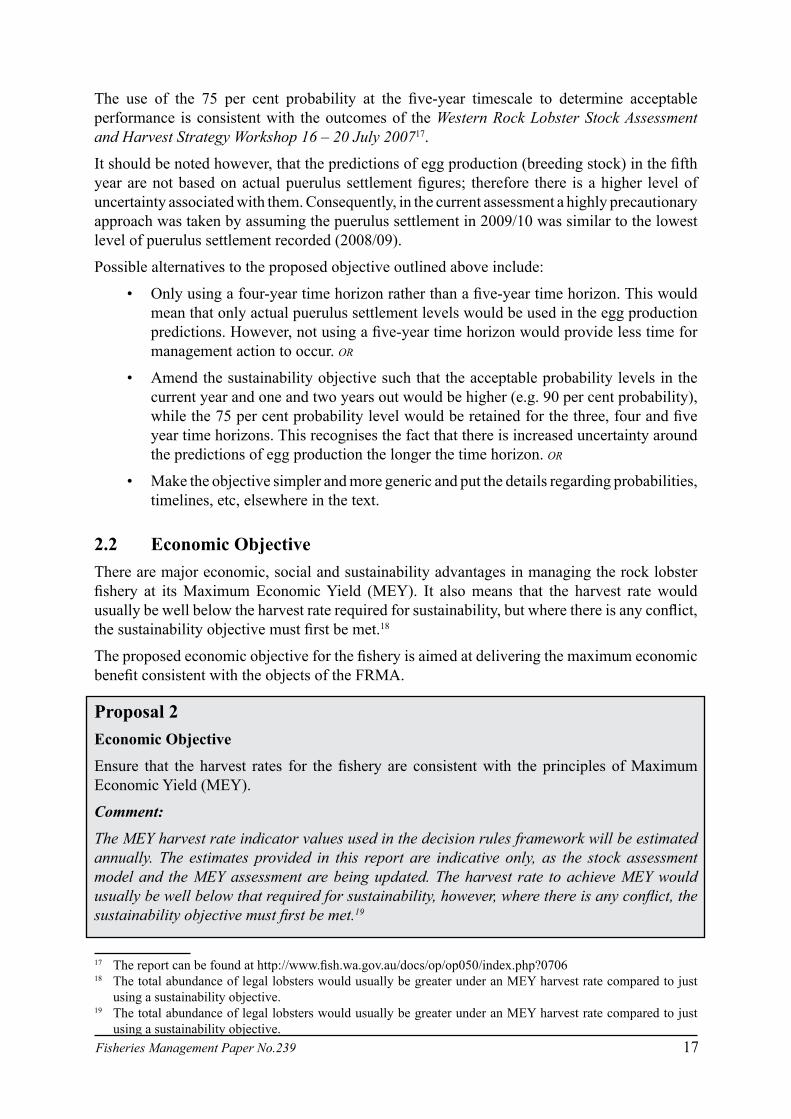
The use of the 75 per cent probability at the five-year timescale to determine acceptable performance is consistent with the outcomes of the Western Rock Lobster Stock Assessment and Harvest Strategy Workshop 16 – 20 July 200717.
It should be noted however, that the predictions of egg production (breeding stock) in the fifth year are not based on actual puerulus settlement figures; therefore there is a higher level of uncertainty associated with them. Consequently, in the current assessment a highly precautionary approach was taken by assuming the puerulus settlement in 2009/10 was similar to the lowest level of puerulus settlement recorded (2008/09).
Possible alternatives to the proposed objective outlined above include:
• Only using a four-year time horizon rather than a five-year time horizon. This would mean that only actual puerulus settlement levels would be used in the egg production predictions. However, not using a five-year time horizon would provide less time for management action to occur. or
• Amend the sustainability objective such that the acceptable probability levels in the current year and one and two years out would be higher (e.g. 90 per cent probability), while the 75 per cent probability level would be retained for the three, four and five year time horizons. This recognises the fact that there is increased uncertainty around the predictions of egg production the longer the time horizon. or
• Make the objective simpler and more generic and put the details regarding probabilities, timelines, etc, elsewhere in the text.
2.2 economic objective
There are major economic, social and sustainability advantages in managing the rock lobster fishery at its Maximum Economic Yield (MEY). It also means that the harvest rate would usually be well below the harvest rate required for sustainability, but where there is any conflict, the sustainability objective must first be met.18
The proposed economic objective for the fishery is aimed at delivering the maximum economic benefit consistent with the objects of the FRMA.
Proposal 2
economic objective
Ensure that the harvest rates for the fishery are consistent with the principles of Maximum Economic Yield (MEY).
Comment:
The MEY harvest rate indicator values used in the decision rules framework will be estimated annually. The estimates provided in this report are indicative only, as the stock assessment model and the MEY assessment are being updated. The harvest rate to achieve MEY would usually be well below that required for sustainability, however, where there is any conflict, the sustainability objective must first be met.19
17 The report can be found at http://www.fish.wa.gov.au/docs/op/op050/index.php?0706 18 The total abundance of legal lobsters would usually be greater under an MEY harvest rate compared to just
using a sustainability objective.19 The total abundance of legal lobsters would usually be greater under an MEY harvest rate compared to just
using a sustainability objective.

18 Fisheries Management Paper No.239
3.0 indicators
This section discusses:
• the particular measures that are available to be used as indicators; and
• the fishery’s performance against the reference values.
Egg production levels (which are based on breeding stock levels) and harvest rates are proposed as the two indicators for the fishery relating to the management objectives.
The egg production indicator is directly related to the sustainability objective, whereas the harvest rate indicator is related to the economic objective.
The fishery will, in most circumstances, be managed to the biological sustainability objective – egg production, but depending on the fishery’s performance (i.e. if the egg production is above the threshold), management would also take into account the economic objective of MEY.
3.1 egg Production measures
This section discusses the strengths and weaknesses of three ways of measuring the breeding stock and hence calculating egg production. It is important to choose the most accurate and robust measure, as it will be used as the basis for deriving the egg production index, which has been chosen as the sustainability indicator representing the breeding capacity of the rock lobster stocks.
3.1.1 Fishery-dependent breeding stock index estimates
Historically the Fishery-Dependent Breeding Stock Index (FDBSI) 20 has been used as the measure of the breeding stock, as it has the longest time series, dating back to the early 1970s. It is an empirical measure estimated from information obtained from an at-sea commercial catch monitoring program conducted by the Department of Fisheries, which requires research staff to go on board commercial vessels and measure a proportion (usually 100 per cent) of the day’s catch.
The commercial monitoring program currently operates from six locations (it started with four locations) for each month that the fishery is open. The breeding stock data are combined into a northern coastal index (Dongara and Jurien) and a southern coastal index (Lancelin and Fremantle). These indices are smoothed using a weighted three-year moving average to enable the underlying trends to be more clearly identified. A great strength of this index is the large number of pots (and hence number of rock lobsters) that are sampled across the entire fishery.
An explanation of the method used to calculate the FDBSI is provided in the Stock Assessment of the West Coast Rock Lobster Fishery (Draft) at:
http://www.fish.wa.gov.au/docs/frr/frr180/index.php?0401 (the report is currently being updated).
20 Breeding Stock Indexes are use to estimate the total egg production in the fishery and the FDBSI provides a relative measure of the breeding stock abundance.

Fisheries Management Paper No.239 19
Some of the main points regarding the use of the FDBSI as an estimate of the breeding stock abundance are:
• A FDBSI has been calculated for the northern region (Dongara/Jurien), southern region (Lancelin/Fremantle) since the early 1970s but is not available for the Abrolhos Islands.
• The FDBSI is:
• standardised by month, depth, location, pot type, swell and moon phase;
• adjusted for fishing efficiency increases;
• based on deep water catch rates; and
• assumes a standard size at maturity.
Future improvements to the calculation of the FDBSI are planned to take account of the changes in the size of sexual maturity over time, and better estimates of increases in fishing efficiency.
3.1.2 Fishery-independent breeding stock index estimates
An alternative relative empirical measure for breeding stock is the Fishery-Independent Breeding Stock Index (FIBSI), so named because information is collected independently from the commercial fishery. The FIBSI is derived from an annual research survey that the Department of Fisheries has been conducting since the early 1990s. The annual index of the breeding stock and the egg production index that is derived using this method is independent of commercial fishing operations and some of the biases associated with it, such as increases in fishing efficiency.
These surveys have been undertaken annually in October/November using standardized fishing gear at specific GPS points in three to six locations between Fremantle and Kalbarri, including the Abrolhos Islands.
The FIBSIs have tended to vary more than the FDBSIs, when viewed on a year-to-year basis. This is because the samples are smaller and it is impossible to take into account all the annual environmental and catchability factors that affect the FIBSI over the period of fishing (e.g. water temperatures, swell, etc.).
An explanation of the method used to calculate the FIBSI is provided in the Stock Assessment of the West Coast Rock Lobster Fishery (Draft) at http://www.fish.wa.gov.au/docs/frr/frr180/index.php?0401 (the report is currently being updated).
3.1.3 model estimates
With the recent development of a new spatial population dynamic stock assessment model (the model) for the fishery it is possible to produce a model-derived measure of breeding stock. The model uses all the available information from the fishery, including a comparison with the FDBSI and FIBSI, to estimate a measure of the breeding stock and the uncertainty associated with it. This measure of breeding stock is based on the whole fishery compared to the specific locations used in the FDBSI and FIBSI and is therefore the preferred measure.21 Hence the model estimate of breeding stock has been chosen to produce the egg production index for the fishery. The model also provides an improved method of estimating egg production for Zone A.
21 See Stock Assessment for the West Coast Rock Lobster Fishery (Draft) at: http://www.fish.wa.gov.au/docs/frr/frr180/index.php?0401 (the report is currently being updated)

20 Fisheries Management Paper No.239
An important additional advantage of using a stock assessment model is that the impact of proposed management changes on the egg production can be evaluated and projected into the future.
Proposal 3
That the egg production values used in the decision rules framework are those estimates derived from the stock assessment model.
Comment:
The empirical data derived from the fishery-dependent (FDBSI) and independent (FIBSI) breeding stock indices will be used as inputs in the stock assessment model (part of the objective function) and hence will be reflected in the model estimates of current egg production.
3.2 harvest rate measures
The choice of harvest rate measure will depend on which rate gives the best measure of economic performance. The harvest rate for this purpose will need to provide a measure of the quantity of animals that are harvested annually by the rock lobster fleet. The harvest rate measure is given as:
Harvest Rate = Catch / (Catch + Residual Legal Biomass22)
Using a biomass of lobsters that can be legally taken provides a better comparison of harvest rates for assessing the economic performance, as it is based on the current management rules (e.g. minimum, maximum sizes, etc). This harvest rate will reflect the proportion of legal-stock available for harvest that remains in the water at the end of the season. The harvest rate is also reflected in catch rates. In the case that a relatively small proportion of the available (legal) stock is taken, i.e. a low harvest rate, catch rates would be higher. High catch rates are generally an important factor contributing to maximising industry profitability.
3.2.1 depletion analysis estimates
An initial measure of harvest rate is available from a depletion analysis, which is described in Stock Assessment of the West Coast Rock Lobster Fishery (draft) http://www.fish.wa.gov.au/docs/frr/frr180/index.php?0401 (the report is currently being updated).
The harvest rate values obtained from this analysis are based on an assessment of the reduction in catch rates in the ‘reds’ fishery (March to June when migration is minimal) with an adjustment made to take into account the ‘whites’ catch.
22 This includes the model derived estimates of the legal animals present at the end of the season – including those above any minimum size and below any maximum size and not in spawning condition.

Fisheries Management Paper No.239 21
3.2.2 model estimates
A number of harvest rate measures can be derived from the stock assessment model. The model provides an estimate of the total biomass23 throughout the fishery; therefore the harvest rate can be estimated from the proportion of the biomass that has been taken over time.
The harvest rate indices derived from the model are preferred to those derived from the depletion analysis, because the model estimate takes into account the management changes that have affected the definition of a legal lobster (e.g. minimum size, maximum size females, mature females) and changes in days fished per week that affect the catch rate comparison between months in the depletion analysis. Also the depletion analysis was only able to calculate harvest rates for the ‘reds’ component of the fishery (March to June, the non-migratory period24) and not for the whole fishing season. In addition the estimates from the depletion analysis are affected by the timing of the February moult and moult of females out of the protection of being setose (i.e. when they moult to non-setose and can be retained in the catch).
A preliminary analysis of harvest rates that would deliver MEY was used to estimate the target harvest rates for each Zone, using the biomass of lobsters that can be legally taken. It is important to note that the MEY target harvest rates will vary through time and by Zone according to prevailing economic circumstances, due to changes in key variables, such as abundance, prices paid for lobsters, operating costs (bait, fuel, labour, etc) and discount rates. The most up to date estimates of MEY harvest rates will be used to set the harvest rate target each Zone of the fishery.
Proposal 4
That the harvest rate values used in the decision rules framework are those estimates derived from the stock assessment model.
23 Legal and non legal lobsters, i.e. undersize, legal size, spawners, tarspots, setose, maximum size, etc.24 The depletion method cannot be used when significant migration occurs, as in November-February.

22 Fisheries Management Paper No.239
4.0 reFerence vaLues
4.1 egg Production
Target, threshold and limit reference values for egg production have been derived from the Sustainability Objective (Proposal 1) of the fishery. It is proposed that the threshold value for egg production be based on the early 1980s level 25 for Zones B and C, as it was considered to be a period of lower exploitation in the fishery, particularly in the deeper water breeding stock areas, that preceded the general take up of major innovations in technology, such as GPS, high definition colour echo sounders and computers.
The threshold value for Zone A has been based on the historic range of egg production as, unlike the coastal Zones (B and C), breeding in Zone A commences below legal size and hence the breeding stock may not be depleted by fishing to the same extent as in the coastal fishery.
The abundance of lobsters in Zone A does not vary to the same extent as in the coastal Zones (as shown by more stable catches), which means the abundance of the breeding stock may also be more stable. It is therefore suggested that maintaining the breeding stock within historic range (i.e. above the low levels of the mid 1980s – 1983/84 to 1986/87, see Figure 3) with a high level of certainty may provide adequate protection for the egg production in Zone A. However, it should be noted that there is currently concern regarding the levels of breeding stock in the northern and southern areas of Zone A and in the Big Bank region.26
A limit reference value of 20 per cent below the threshold value is proposed for Zones B and C, because it is between the threshold value and lowest value recorded for them. The same limit reference value of 20 per cent below the threshold value is also suggested for Zone A.
Proposal 5
that the egg production reference values for Zones b and c (coastal areas north and south of 30°s respectively, see Figure 1b) are:
target range Egg production above the early 1980s level27.
threshold value Egg production at the early 1980s level.
Limit value Egg production 20 per cent below the threshold level.
that the breeding stock reference values for Zone a (Figure 1b) are:
target range Egg production above the level of the mid 1980s28.
threshold value Egg production at the level of the mid 1980s.
Limit value Egg production 20 per cent below the level of the mid 1980s.
Comment:
Your views are sought on whether the proposed egg production levels for the targets, thresholds and limits are appropriate.
25 The early 1980s level refers to the average of 1980, 1981 and 1982.26 See Western Rock Lobster Low Puerulus Settlement Risk Assessment Workshop Held 1 and 2 April 2009 at
http://www.fish.wa.gov.au/docs/op/op071/index.php?0706 27 See footnote 25.28 The mid 1980s level for Zone A refers to the period 1984/84 to 1986/87.

Fisheries Management Paper No.239 23
4.2 harvest rate
Only a reference value for the harvest rate for the target region is provided, as threshold and limit values are not meaningful in terms of the economic status of the fishery. The target range is given as the mean value plus or minus 0.1 (i.e. similar but not equal to ±10 percent) to reflect that there is uncertainty about the value.
It is important to note that the target range in each zone will vary annually according to changes in abundance and economic factors.
Proposal 6
that the harvest rate reference values for each Zone of the fishery are:
target range MEY harvest rate ± 0.1
Comment:
No threshold or limit values are provided for the MEY harvest rate because they are not meaningful in terms of the economic objective.
The MEY harvest rate values will vary annually based on stock size and economic factors, such as the price paid for lobsters, exchange rates, cost of fishing – fuel, bait, crew, finance, etc. Thus, none of these reference values are expected to be static.
The harvest rate to achieve MEY would usually be well below that required for sustainability, however, where there is any conflict, the sustainability objective must first be met.
Your views are sought on the MEY target range.

24 Fisheries Management Paper No.239
5.0 PerFormance
5.1 egg Production
The performance of the egg production for Zones A, B, C of the fishery against the reference points described in Proposal 4 above are illustrated in Figures 3, 4 and 5 below. The figures are based on the out puts from the model version used in 2009.
The model will be peer reviewed by international experts during the first half of 2010 and updated, therefore some of the model outputs are likely to change. Also the model will be refined and improved over time, as will some the inputs used in it, hence the outputs are likely to change in the future.
a Zone Performance
Fisheries Management Paper No. 239
30
5 PERFORMANCE
5.1 Egg Production
The performance of the egg production for Zones A, B, C of the fishery against the reference points described in Proposal 4 above are illustrated in Figures 3, 4 and 5 below. The figures are based on the out puts from the model version used in 2009.
The model will be peer reviewed by international experts during the first half of 2010 and updated, so therefore some of the model outputs are likely to change. Also the model will be refined and improved over time, as will some the inputs used in it, hence the outputs are likely to change in the future. A Zone Performance
Figure 3. Model derived egg production for A Zone from 1975/76 with confidence intervals displayed providing 75 per cent (light grey) and 90 per cent (dark grey) probability levels. The dotted line shows projections 5 years forward based on the management package for 2009/10, the last 3 years of puerulus settlement and assuming the very low settlement of 2008/09 continues.29
29 Model outputs will change from time to time as improvements are made and/or new data is added in future years.

Fisheries Management Paper No.239 25
b Zone Performance
Fisheries Management Paper No. 239
31
B Zone Performance
Figure 4. Model derived egg production for B Zone from 1975/76 with confidence intervals displayed providing 75 per cent (light grey) and 90 per cent (dark grey) probability levels. The dotted line shows projections five years forward, based on the management package for 2009/10, the last three years of puerulus settlement and assuming the very low settlement of 2008/09 continues.30
C Zone Performance
Figure 5. Model derived egg production for C Zone since 1975/76 with confidence intervals displayed providing 75 per cent (light grey) and 90 per cent (dark grey) probability levels. The dotted line shows projections five years forward, based on the
30 As for footnote 29.
Figure 4. Model derived egg production for B Zone from 1975/76 with confidence intervals displayed providing 75 per cent (light grey) and 90 per cent (dark grey) probability levels. The dotted line shows projections five years forward, based on the management package for 2009/10, the last three years of puerulus settlement and assuming the very low settlement of 2008/09 continues.30
c Zone Performance
Fisheries Management Paper No. 239
31
B Zone Performance
Figure 4. Model derived egg production for B Zone from 1975/76 with confidence intervals displayed providing 75 per cent (light grey) and 90 per cent (dark grey) probability levels. The dotted line shows projections five years forward, based on the management package for 2009/10, the last three years of puerulus settlement and assuming the very low settlement of 2008/09 continues.30
C Zone Performance
Figure 5. Model derived egg production for C Zone since 1975/76 with confidence intervals displayed providing 75 per cent (light grey) and 90 per cent (dark grey) probability levels. The dotted line shows projections five years forward, based on the
30 As for footnote 29.
Figure 5. Model derived egg production for C Zone since 1975/76 with confidence intervals displayed providing 75 per cent (light grey) and 90 per cent (dark grey) probability levels. The dotted line shows projections five years forward, based on the management package for 2009/10, the last three years of puerulus settlement and assuming the very low settlement of 2008/09 continues.31
30 As for footnote 29.31 As for footnote 29.

26 Fisheries Management Paper No.239
5.2 harvest rates
The estimates of harvest rates for each Zone of the fishery were unavailable at the time of publication, therefore the diagram below is indicative and is provided to illustrate how the performance of each Zone’s harvest rate would be evaluated against its MEY target. The actual values for each Zone will be available for publication in the finalised document (i.e. at the same time as public comments are incorporated).
The MEY for the fishery will be reviewed annually if there are significant changes in the key factors affecting it, such as the level of recruitment to the fishery, operating costs or the price received for lobster.
Fisheries Management Paper No. 239
32
management package for 2009/10, the last three years of puerulus settlement and assuming the very low settlement of 2008/09 continues.31
5.2 Harvest Rates
The estimates of harvest rates for each Zone of the fishery were unavailable at the time of publication, therefore the diagram below is indicative and is provided to illustrate how the performance of each Zone’s harvest rate would be evaluated against its MEY target. The actual values for each Zone will be available for publication in the finalised document (i.e. at the same time as public comments are incorporated).
The MEY for the fishery will be reviewed annually if there are significant changes in the key factors affecting it, such as the level of recruitment to the fishery, operating costs or the price received for lobster.
Figure 6. Model-derived harvest rate for fishery (illustrative only) showing the harvest rate in 2007/08, estimated harvest rate for 2008/09 based on the effort reductions implemented and the estimated harvest rates for 2009/10 onwards based on the management package for 2009/10. The current MEY target range is based on a preliminary assessment that will be revised in 2010. A separate targe range for Zones A, B and C will also be determined.
31 As for footnote 29.
Figure 6. Model-derived harvest rate for fishery (illustrative only) showing the harvest rate in 2007/08, estimated harvest rate for 2008/09 based on the effort reductions implemented and the estimated harvest rates for 2009/10 onwards based on the management package for 2009/10. The current MEY target range is based on a preliminary assessment that will be revised in 2010. A separate targe range for Zones A, B and C will also be determined.

Fisheries Management Paper No.239 27
6.0 decision ruLes FrameWork
6.1 management guidelines
The management tools that can be used to achieve a desired outcome will depend on a number of factors including the management system in use (e.g. input controls, catch quota, or some other system), timeframes for implementation, compliance issues and economic, social and equity considerations, and they will be subject to consultation with stakeholders. Consequently, the precise management actions required if an indicator (i.e. egg production or harvest rate) reference value (threshold or limit) is breached are not detailed in this paper. However, some guidelines are proposed.
6.2 Proposed guidelines for decision rules
6.2.1 egg production
A critical element of this proposed harvest strategy is that fishery managers and stakeholders will generally be in a position to take management action prior to an indicator (egg production or harvest rate) breaching its reference value (threshold or limit). For example, if puerulus settlement and model outputs predict that the egg production is likely to breach (go below) its threshold value in four or five years time, corrective management action may commence immediately to ensure it does not.
If the egg production indicator value is currently in breach of its threshold or limit value, or will be in the short term (one or two years), it would trigger a more immediate and urgent management response to correct it than if the breach were predicted to occur in four or five years time.
28 Fisheries Management Paper No.239
Proposal 7
In general any stock rebuilding or harvest rate reduction strategy should include the following32:
32 Adapted from: Department of Agriculture, Fisheries & Forestry, 2007, Commonwealth Fisheries Harvest Strategy Policy & Guidelines, Department of Agriculture, Fisheries and Forestry, page 44 http://www.daff.gov.au/fisheries/domestic/harvest_strategy_policy
Proposal 7 egg production
indicator value management response
Greater than 75 per cent probability that it is still greater than the threshold value in five years and greater than 90 per cent probability that it is still greater than the limit value in five years.
No management action is required
Less than 75 per cent probability that it is still greater than the threshold value in five years and/or less than 90 per cent probability that it is still greater than the limit value in five years.
Initiate a review process that will generate recommendations regarding the most effective forms of management response, to be completed within three months.
Implement management measures to ensure the egg production indicator values in the fifth year are greater than the threshold value, with a 75 per cent probability and above the limit value with a 90 per cent probability.
Comments - Discussion is required to determine whether different levels of uncertainty should be applied to trigger management action if the egg production were predicted to go below its indicator value in the short term – one or two years time compared to the longer term – three, four or five years. For example, it could be a requirement that there is:
• a greater than 90 per cent probability that the egg production is currently and in one or two years time will be above the threshold; and
• a greater than 75 per cent probability that the egg production will still be above the threshold in three, four or five years time.
In addition to the above or instead of it, the decision rules may need to include an increased level of urgency to implement management changes if a threshold or limit breach is predicted to occur within one or two years compared to a breach predicted in three, four or five years.
Fisheries Management Paper No.239 29
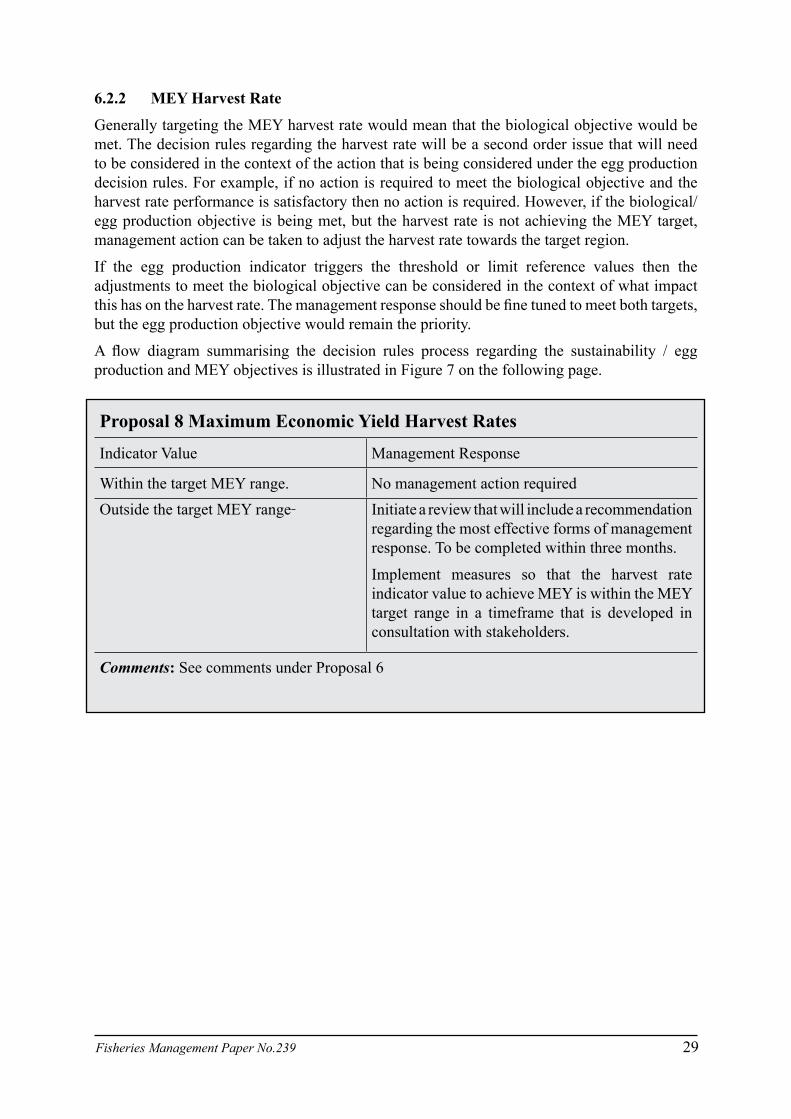
6.2.2 mey harvest rate
Generally targeting the MEY harvest rate would mean that the biological objective would be met. The decision rules regarding the harvest rate will be a second order issue that will need to be considered in the context of the action that is being considered under the egg production decision rules. For example, if no action is required to meet the biological objective and the harvest rate performance is satisfactory then no action is required. However, if the biological/egg production objective is being met, but the harvest rate is not achieving the MEY target, management action can be taken to adjust the harvest rate towards the target region.
If the egg production indicator triggers the threshold or limit reference values then the adjustments to meet the biological objective can be considered in the context of what impact this has on the harvest rate. The management response should be fine tuned to meet both targets, but the egg production objective would remain the priority.
A flow diagram summarising the decision rules process regarding the sustainability / egg production and MEY objectives is illustrated in Figure 7 on the following page.
Proposal 8 maximum economic yield harvest rates
Indicator Value Management Response
Within the target MEY range. No management action required
Outside the target MEY range Initiate a review that will include a recommendation regarding the most effective forms of management response. To be completed within three months.
Implement measures so that the harvest rate indicator value to achieve MEY is within the MEY target range in a timeframe that is developed in consultation with stakeholders.
Comments: See comments under Proposal 6

30 Fisheries Management Paper No.239
Fisheries Management Paper No. 239
36
Figure 7. Flow diagram summarising the Decision Rules process.
Is the biological/egg production objective being met?
NO
Take management action in accordance with egg production decision rules and in consultation with stakeholders.
YES Is the economic objective
being met?
NO
Take management action in accordance
with the MEY harvest rate decision rules and in
consultation with stakeholders.
YES
No action required
Figure 7. Flow diagram summarising the Decision Rules process.

Fisheries Management Paper No.239 31
7.0 Future directions
7.1 bio-economic modelling
An application for funding has been made for a three-year bio-economic project to developed better information on optimising the rock lobster harvest. The outputs of the project will be used in conjunction with the stock assessment model. A summary of the project can be found at Appendix 2.
7.2 stock assessment model improvements
Improvements to the stock assessment model will be made by incorporating:
• Finer spatial analysis of the distribution of the breeding stock, e.g. by one degree blocks (compared to the current much larger Zones – A, B and C) and by depth. This could lead to more detailed management of the breeding stock, e.g. breeding stock targets and thresholds could be set for areas smaller than the Zones of the fishery.
• More detailed information on migration patterns and how they affect the level of breeding stock in particular areas.
• Greater detail on the distribution of fishing effort and increases in fishing efficiency by area and depth.
• Further investigations into areas of uncertainty of estimates and parameters.
7.3 stock and recruitment relationship and environment effects
A number of research projects are currently exploring aspects of the rock lobster stock and recruitment relationship and the influences of environmental factors on the levels of puerulus settlement (Appendix 3). The results of the projects, amongst other things, will enable a review of the appropriateness of the 1980 level of egg production (breeding stock) as the threshold value for the coastal Zones (B and C) and the mid-1980s level of egg production that is currently used as the threshold value for Zone A.
The projects may also provide information on the importance of particular breeding stock areas (e.g. Big Bank, northern Zone A), which could lead to specific breeding stock areas being given greater protection.
7.3 integrated Fisheries management – recreational sector
Under the Department of Fisheries’ Integrated Fisheries Management (IFM) policy, the decision rules framework and the stock assessment model will be updated to include the catch share of the fishery’s other stakeholders (e.g. recreational and indigenous sectors), as well as the commercial sector. Under IFM the percentage of the recreational rock lobster catch could be used as another indicator, with a threshold reference value of five per cent of the total catch33.
33 The current recreational catch is about three per cent of the total catch, however, it varies considerably by location and depth.

32 Fisheries Management Paper No.239
8.0 reFerences
Bowen, BK ,(1994). Long term management strategies for the western rock lobster fishery – Evaluation of management options. Volume 1. Fisheries Management Paper No. 55 (October 1994). Fisheries Department of Western Australia.
Bray, T, 2004, ‘Rock Lobster Decision Rules: Breeding Stock Report 21 September 2004’, Department of Fisheries Publication.
Brown, R (2009). Western Rock Lobster Low Puerulus Settlement Risk Assessment Workshop Held 1 and 2 April 2009 at: http://www.fish.wa.gov.au/docs/op/op071/index.php?0706
Caputi N, Melville-Smith R, de Lestang S, How J, Thomson A, Stephenson P, Wright I, Donohue K, 2008. Stock Assessment for the West Coast Rock Lobster Fishery (Draft). Fisheries Research Report at: http://www.fish.wa.gov.au/docs/frr/frr180/index.php?0401 (the report is currently being updated)
Chubb, C F, 1991, Measurement of spawning stock levels for the western rock lobster, Panulirus cygnus. Revista de Investigaciones Marinas 12: 223-233.
Department of Agriculture, Fisheries & Forestry, 2007, Commonwealth Fisheries Harvest Strategy Policy & Guidelines, Department of Agriculture, Fisheries and Forestry, http://www.daff.gov.au/fisheries/domestic/harvest_strategy_policy
Department of Fisheries 2008, ‘Western Rock Lobster Stock Assessment and Harvest Strategy Workshop: http://www.fish.wa.gov.au/docs/op/op050/index.php?0706.
Marine Stewardship Council, 2006, Western Rock Lobster Fishery, MSC Re-Certification November 2006, Marine Stewardship Council: http://www.msc.org/track-a-fishery/certified/south-atlantic-indian-ocean/western-australia-rock-lobster/reassessment-downloads-1
Melville-Smith, R, de Lestang, S, Thomson, A. (2008). Spatial and temporal changes in egg production in the western rock lobster (Panulirus cygnus) fishery. In press.
Rock Lobster Industry Advisory Committee (1993). Chairman’s Report to the Minister for Fisheries on the Management Recommendations for 1993/94 and 1994/95 Western Rock Lobster Seasons. Fisheries Management Paper No. 55. Fisheries Department of Western Australia.

Fisheries Management Paper No.239 33
9.0 aPPendices
appendix 1 history of regulation of the Western rock Lobster Fishery
The main aims of the regulations that have been introduced into the Western Rock Lobster Fishery have been two-fold. First and most importantly, they have been used to conserve the rock lobster stocks (particularly the breeding stock) and secondly, the limited entry rules introduced in 1963 also protected fisher’s livelihoods by restricting the number of boats (fishers) that could operate in the fishery.34
Some of the major regulations and reductions in fishing effort/exploitation were:
• 1887 – Minimum size, initially a weight and then a carapace length.
• 1899 – Protection of spawners (egg carrying females).
• 1962 – Closed seasons.
• 1963 – March 1963, limits on entry, boats and number of pots involving:
• the number of boats (fishers) was restricted to 836, including 45 freezer boats that were licensed to process at sea; and
• the number of pots was restricted to three per foot (0.33 meter) length of boat, with about 76,000 being in the fishery. However, a fisher could still increase his number of pots by building/purchasing a larger boat.
• 1965 – Pot numbers and boat replacement. Pot numbers were set at 76,623 and boat replacements had to match exactly the number of pots held on the licence.
• 1966 – Escape gaps introduced, one x 51 x 304 mm, increased to one x 54 x 304 mm in 1971 and processing factories required a licence.
• 1973 – Multiple necks and parlour pots banned.
• 1978 – Season shorten by six weeks to 30 June.
• 1979 – Boat replacement policy relaxed to give fishermen greater flexibility when replacing their boats. It allowed between seven and 10 pots per meter of boat length.
• 1984 – Pot dimensions restricted:
• maximum pot volume of 0.257 cubic meters; and
• large wire traps and large batten and beehive pots restricted;
• 1986
• Five per cent pot reduction if a boat were less than six years old when replaced (rule not revoked until 1995).
• Escape gaps increased from one to three/four x 54x304mm.
• Temporary 10 per cent pot reduction for one season, from 76,623 to 68,961.
• 1987-91 – Permanent 10 per cent pot reduction at two per cent per year over five years.
34 The fishery’s management arrangements serve a two-fold purpose, in that biological and fishing effort constraints ensure sustainability of the stock (now enshrined in the Decision Rules Framework) and limited entry protects fishers’ economic interests.
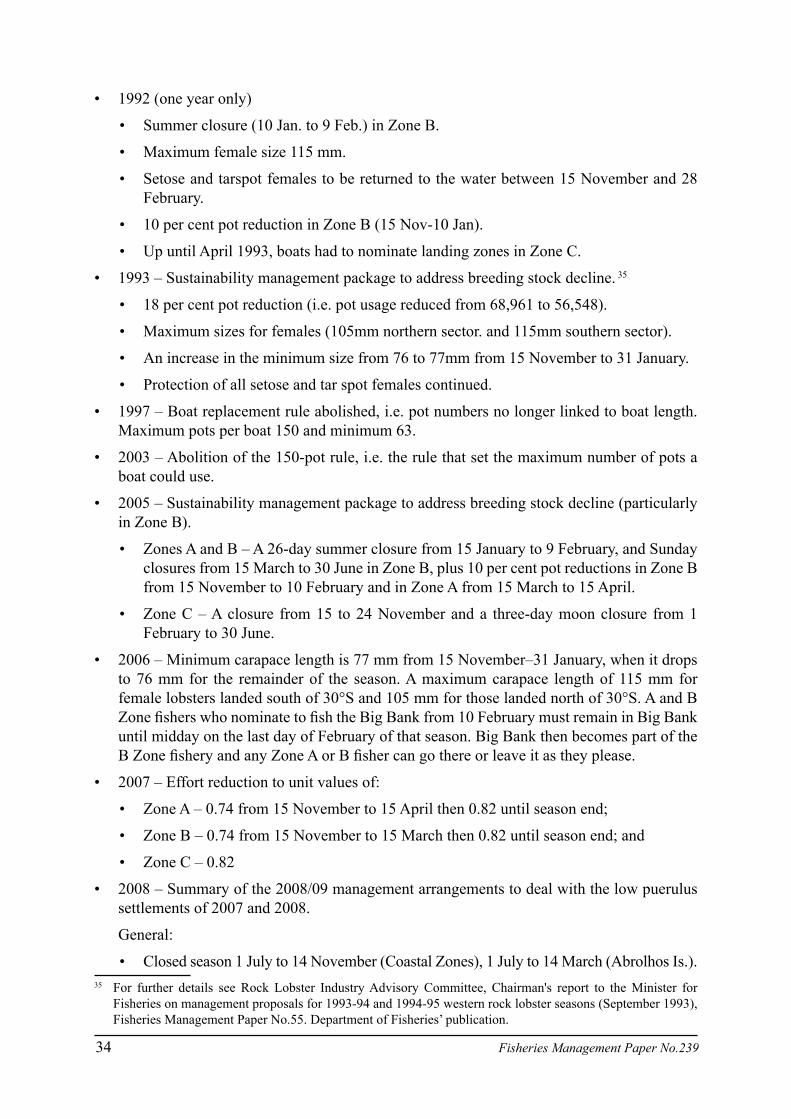
34 Fisheries Management Paper No.239
• 1992 (one year only)
• Summer closure (10 Jan. to 9 Feb.) in Zone B.
• Maximum female size 115 mm.
• Setose and tarspot females to be returned to the water between 15 November and 28 February.
• 10 per cent pot reduction in Zone B (15 Nov-10 Jan).
• Up until April 1993, boats had to nominate landing zones in Zone C.
• 1993 – Sustainability management package to address breeding stock decline. 35
• 18 per cent pot reduction (i.e. pot usage reduced from 68,961 to 56,548).
• Maximum sizes for females (105mm northern sector. and 115mm southern sector).
• An increase in the minimum size from 76 to 77mm from 15 November to 31 January.
• Protection of all setose and tar spot females continued.
• 1997 – Boat replacement rule abolished, i.e. pot numbers no longer linked to boat length. Maximum pots per boat 150 and minimum 63.
• 2003 – Abolition of the 150-pot rule, i.e. the rule that set the maximum number of pots a boat could use.
• 2005 – Sustainability management package to address breeding stock decline (particularly in Zone B).
• Zones A and B – A 26-day summer closure from 15 January to 9 February, and Sunday closures from 15 March to 30 June in Zone B, plus 10 per cent pot reductions in Zone B from 15 November to 10 February and in Zone A from 15 March to 15 April.
• Zone C – A closure from 15 to 24 November and a three-day moon closure from 1 February to 30 June.
• 2006 – Minimum carapace length is 77 mm from 15 November–31 January, when it drops to 76 mm for the remainder of the season. A maximum carapace length of 115 mm for female lobsters landed south of 30°S and 105 mm for those landed north of 30°S. A and B Zone fishers who nominate to fish the Big Bank from 10 February must remain in Big Bank until midday on the last day of February of that season. Big Bank then becomes part of the B Zone fishery and any Zone A or B fisher can go there or leave it as they please.
• 2007 – Effort reduction to unit values of:
• Zone A – 0.74 from 15 November to 15 April then 0.82 until season end;
• Zone B – 0.74 from 15 November to 15 March then 0.82 until season end; and
• Zone C – 0.82
• 2008 – Summary of the 2008/09 management arrangements to deal with the low puerulus settlements of 2007 and 2008.
General:
• Closed season 1 July to 14 November (Coastal Zones), 1 July to 14 March (Abrolhos Is.).35 For further details see Rock Lobster Industry Advisory Committee, Chairman's report to the Minister for
Fisheries on management proposals for 1993-94 and 1994-95 western rock lobster seasons (September 1993), Fisheries Management Paper No.55. Department of Fisheries’ publication.

Fisheries Management Paper No.239 35
• From 1 to 14 March all fishers holding an A concession must remain in B zone waters > 20 fathoms.
• Maximum number of pot entitlements to be used in the fishery: 56 906 pots and licensees can only operate in the zone for which they are licensed.
• Minimum carapace length is 77 mm.
• It is illegal to take females with setose pleopods.
• A maximum carapace length of 115 mm for female lobsters.
• All pots must have at least three escape gaps mm high and 305 mm wide.
• Pots types have maximum size and configuration regulations.
• Pots may be pulled only during specified daylight hours: Summer 15 November to 31 March 0430 to 1930; Winter 1 April to 30 June 0600 to 1800
• To operate in the managed fishery, a licensee must have at least 63 units of pot entitlement.
Specific Effort Reductions for 2008/09
• 15 November - Effort reduction to unit values of:
• Zone A – 0.66
• Zone B – 0.66
• Zone C – 0.74
• Sunday closure for all zones and all season with the exception of the first two weeks in Zone A.
• 30 November - Effort reduction to unit values of:
• Zone A – 0.54
• Zone B – 0.54
• Zone C – 0.62
• 24 February - Closure of Big Bank for the remainder of the season
• 1 March - Effort reduction to unit values of:
• Zone A – 0.42
• Zone A – 0.42
• Zone C – 0.50
• 6 March – Saturday and Monday closures for all zones all season. The Sunday closure implemented for the first two weeks of Zone A was continued all season. Removal of Zone C moon closures.
• 15 March – Maximum size of female lobsters in Zone A and B reduced to 95mm and minimum size in Zone C increased to 77mm.
• 1 May – back to five fishing days per week (Saturday and Sunday closures)
• 2009 – Total catch not to exceed 5,500 tonnes. Details of fishing effort reductions for the whites and reds fisheries and the three Zones, A, B and C, are still being developed and implemented as the 2009/10 season progresses.

36 Fisheries Management Paper No.239
appendix 2 bio-economic modelling Project summary
background
Historically the main focus of the assessment of the western rock lobster fishery has been on the status of the stock to ensure biological sustainability. More recently the economic performance of the fishery has been examined (Cameron-Bird, Julian Morrison FRDC 2007/052) and a comparison of the economic effects of the different management strategies proposed for 2005/06 was undertaken (Thompson and Caputi 2006).
In 2008, a preliminary assessment of the maximum economic yield (MEY) was undertaken by the Department of Fisheries’ Economist to demonstrate that there were alternative management options to optimize profits (Reid 2009). However there is a need for further assessment of the MEY analysis to take into account variability associated with the parameters assumed and alternative management approaches. This includes examination of inter-annual patterns of the fishery (because economic traits of peak catches are different to other periods) and in catch composition effects on price, as stock rebuilding will lead to a greater range of size grades being landed.
This assessment would take into account the outputs from the WAFIC IDU 08/07 project that is updating the financial data collection for the western rock lobster fishery as well as information from the processing sector on prices of rock lobsters under different management arrangements.
This project is part of a larger national project (Dr N Caputi is the Project Investigator) in the Cooperative Research Centres’ (CRC) Future Harvest Theme that has been supported by the CRC and the Fisheries Research and Development Corporation (FRDC). The larger project also includes economic optimization of southern rock lobster and abalone stocks.
The western rock lobster fishery is facing significant economic pressure from the cost-price squeeze as well as reduced catches due to low puerulus settlement and resultant management changes. It is therefore important to undertake a bio-economic assessment of the management strategies to ensure economic optimization of the fishery.
As a result of the low puerulus settlement there have been significant reductions in fishing effort (ca. 50 per cent in 2008/09) that are taking into account the economic aspects of the fishery e.g. MEY assessment and reducing the peak catches in March-April. It is important that an economic assessment is undertaken of these strategies.
objectives
• To estimate the annual catch and effort to achieve optimum (maximum) economic yield
• To evaluate intra-annual market-based management strategies.
• To evaluate the economic effect of current and proposed management changes.
Planned outcomes
• Determination of annual catch and effort to achieve optimum economic yield taking into account net present value.
• Determination of a Target Reference Point for the decision-rule framework to achieve optimum economic yield.
• Assessment of the impact of current (ca. 35 per cent whites and 60 per cent reds) effort reduction implemented in the 2008/09 season and that proposed for the 2009/10 season
• Evaluation of intra-annual market-based management strategies to assess within year economic performance of different management strategies of fishing the whites (December) and reds (March - April) peak catches.

Fisheries Management Paper No.239 37
appendix 3 research Projects - investigating aspects of rock Lobster stock and recruitment and the effects of environmental Factors on Puerulus recruitment
The five projects outlined below were submitted to the Fisheries Research and Development Corporation (FRDC) and were successful in securing funding. The objectives of the projects are to investigate various aspects of stock and recruitment and environmental influencing puerulus recruitment that could be associated with the low puerulus settlements of 2007 - 08 and 2008 - 09.
Project 1 (Frdc 2009/018)
identifying factors affecting the low western rock lobster puerulus settlement in recent years.
Objectives
1. To use a larval advection model and the rock lobster population dynamics model to assess the effect of the spatial distribution of the breeding stock on the puerulus settlement.
2. To assess environmental factors (water temperature, current, wind, productivity, eddies) and breeding stock affecting puerulus settlement.
3. To examine climate change trends of key environmental parameters and their effect on the western rock lobster fishery.
4. Provide industry (Western Rock Lobster Council - WRLC), Rock Lobster Industry Advisory Committee (RLIAC) and Fisheries managers with an evaluation of relative impact of breeding stock and environmental effects on the puerulus settlement and its implications for management in the protection of the breeding stock.
Project 2 (Frdc 2008/087)
evaluating source-sink relationships of the Western rock Lobster Fishery using oceanographic modeling.
Objectives
1. To determine the relative contribution of larval production from different areas to the abundance and spatial distribution of puerulus settlement over 15 years using a larval advection model.
2. Provide industry (WRLC), RLIAC and Fisheries managers with an evaluation of source-sink relationships and its implications for management in the protection of the breeding stock
Project 3 (Frdc 2009)
evaluating the use of novel statistical techniques for determining harvest rates and efficiency increases in the Western rock Lobster Fishery.
The project looks at using change-in-ratio and index removal to further examine fishing efficiency and harvest rates and pulls together some of the best mathematicians in this field, i.e. Professor Norm Hall36, Associate Professor Stewart Frusher37 and Professor John Hoenig38
36 Deputy Director Centre for Fish and Fisheries Research Murdoch University WA http://www.cffr.murdoch.edu.au/academic.html
37 Program Leader Sustainable Fisheries, University of Tasmania http://fcms.its.utas.edu.au/scieng/mrl/pagedetails.asp?lpersonId=3047
38 Professor of Marine Science Virginia Institute of Marine Science USA http://www.vims.edu/fish/faculty/hoenig_j.html.

38 Fisheries Management Paper No.239
Objectives
1. Assess current data sources and their potential for use in estimating harvest rates and efficiency increases in the western rock lobster fishery.
2. Evaluate whether additional sources of information are needed to produce more robust estimates of harvest rate and efficiency increase.
3. Assess whether the estimates of harvest rate and fishing efficiency are reliable and could be used to assist in the management of the western rock lobster fishery.
4. Provide industry (WRLC), RLIAC and fisheries managers with an evaluation of change-in-ratio and index removal techniques for determining harvest rates and efficiency creep.
Project 4 (Frdc 2009)
evaluation of population genetic structure in the western rock lobster
Objectives
• Develop additional new microsatellite markers for western rock lobster.
• Test whether the adult population of western rock lobster is genetically homogeneous throughout its range.
• Test whether the spatial genetic structure in the next generation of recruits (pueruli) matches the spatial genetic structure found in adults. (If so, this suggests spatial structure is due to limited dispersal or local adaptation).
• Estimate effective population size of the western rock lobster and test for severe bottlenecks in population size.
Project 5 (Frdc 2008)
assessing possible environmental causes behind the reduced colonization of puerulus collectors by a wide suite of species.
Objectives
1. Begin monitoring the community composition of marine flora and fauna along the Western Australian coastline during this current poor settlement period.
2. Develop standard methodology for monitoring the spatial and temporal variability in the settlement of marine flora and fauna.
3. Determine what environmental parameters may be linked to the majority of variation in the floral and faunal communities colonizing puerulus collectors, focusing on those relating to puerulus settlement.
4. Identify indicator marine flora and fauna species for monitoring the influences of environmental change on Western Australian marine environment.
5. Detect any known or potential introduced marine pests within the Western Australian environment.
The fishery’s management arrangements serve a two-fold purpose, in that biological and fishing effort constraints ensure sustainability of the stock (now enshrined in the Decision Rules Framework) and limited entry protects fishers’ economic interests.