Embed Size (px)
Citation preview

Commercial Finance
Rick WolfertVice Chairman, Commercial Finance

A Recognized Leader in Commercial Finance
Managed Assets: $39 Billion
Large and loyal customer base
- Over 57,000
2,450 employees- Large direct sales force: ~400
Preeminent brand - 98 years of middle market lending
experience - Superior risk underwriting experience
and skill
Global scope- Operating in over 30 countries
Data as of September 30, 2006.

Broad Portfolio of Scaled Businesses in Attractive Markets
Commercial Finance Group
Commercial Services Business CapitalComm, Media & Entertainment
Commercial Real EstateConstruction
Equipment FinanceEnergy
HealthcareMergers and Acquisitions
Sponsor Finance
Aerospace
Rail
Commercial Aircraft
Business Aircraft
Aerospace and Defense FinanceCommercial Credit
Commercial Services Int’l
Commercial Services Asia
Commercial Services Europe
Trade Finance Transportation Finance Corporate FinanceNet Revenue: $331 Million Net Income: $129 Million ROE: 26%
Net Revenue: $266 Million Net Income: $182 Million ROE: 17%
Net Revenue: $603 Million Net Income: $240 Million ROE: 16%
Net Revenue: $1.2 BillionNet Income: $551MillionROE: 17.9%
Syndicated Loan Group
Data as of or for the nine months ended September 30, 2006.

Clear Traction in Executing the New Strategy
33%Efficiency Ratio
$12.5 BillionVolume
$1.2 BillionNet Revenue
17.9%ROE
0.16%Net Charge-offs
3.23%Net Margin
$39 BillionManaged Assets
$551 MillionNet Income
vs. 20052006
28%
290 bps
220 bps
59%
15%
26 bps
9 bps
22%Challenges
Aggressive market pricing
Liberal credit structures
Accomplishments
Successfully launched customer-centric, market-focused growth strategy
Attracted over 150 top commercial finance professionals
Enhanced state-of-the-artrisk management system
Executed well on new growth initiatives
Data as of or for the nine months ended September 30.

1995-2006: A Dramatically Changed Competitive Landscape
Banks consolidating and moving up-market
Disrupted client relationships
Shifting middle market and industry strategies
Banking Commercial Finance

1995-2006: A Dramatically Changed Competitive Landscape
Banks consolidating and moving up-market
Disrupted client relationships
Shifting middle market and industry strategies
Banking Commercial Finance

Revenue
Where We Compete
Junk B-
$10M
$50M
$1B
$100B+
B+ BB- BBB AAA
Credit Rating
Middle Market~$1.8 Trillion
Finance Companies
Local Banks
Large Banks
Investment Banks
Hedge Funds
Finance CompaniesRegional Banks
Hedge Funds
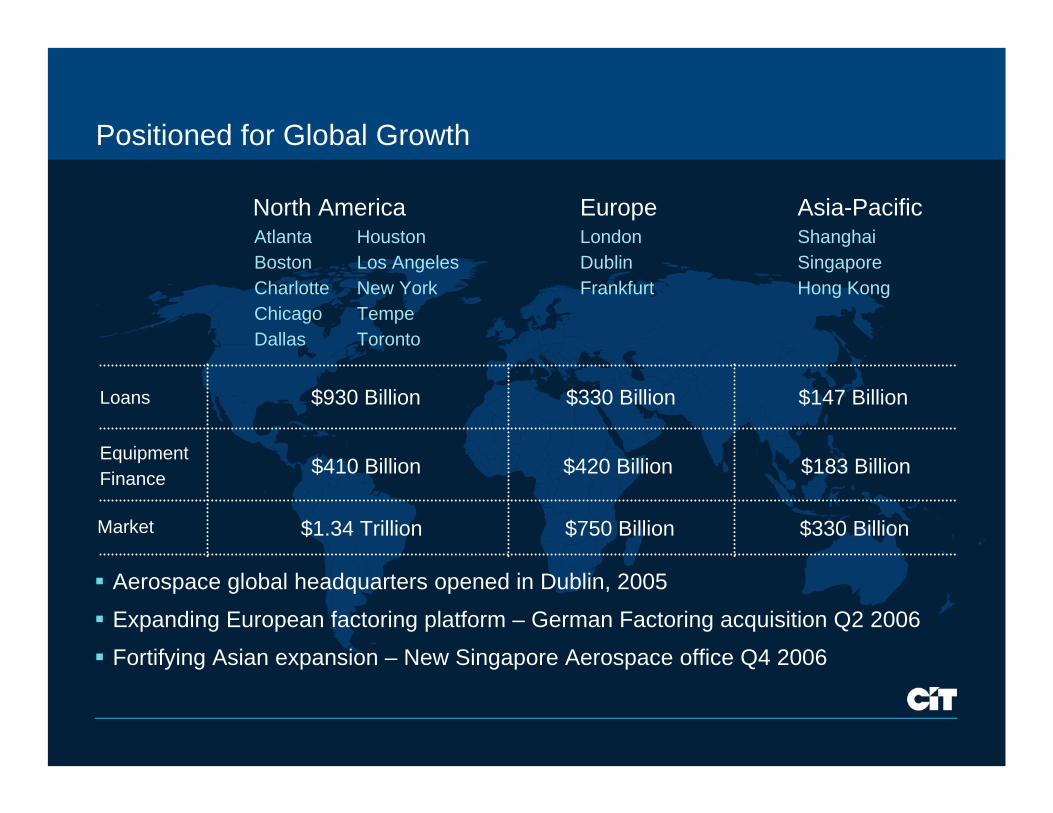
Positioned for Global Growth
Aerospace global headquarters opened in Dublin, 2005
Expanding European factoring platform – German Factoring acquisition Q2 2006
Fortifying Asian expansion – New Singapore Aerospace office Q4 2006
AtlantaBostonCharlotteChicagoDallas
North AmericaShanghaiSingaporeHong Kong
$930 Billion
LondonDublinFrankfurt
Europe
$330 Billion
$420 Billion
Asia-Pacific
$147 Billion
HoustonLos AngelesNew YorkTempeToronto
$410 Billion
Loans
EquipmentFinance
$750 Billion$1.34 TrillionMarket $330 Billion
$183 Billion

Market-Focused Model Driving Organic Growth
Relationship Managers• Industry thought leaders• Consultative approach• Develop / manage CIT relationship• Coordinate execution
Equipment Finance& Leasing
Factoring
Asset Based Lending
Corporate Finance
Structured / Project Finance
M&A Advisory
Commercial Real Estate Advisory & Finance
Products and Services Target Industries
Communications, Media & Entertainment
Construction
Retail
Healthcare
Energy
Aerospace
Rail
Private Equity Sponsors Intermediaries Financial
Institutions
Channel Partners
HedgeFunds

Syndicated Loan Group
SponsorFinance
Capital Markets
Healthcare
Energy
Europe
Sales
EquipmentFinance
CommercialReal Estate
M&AAdvisory
CommercialServices
Canada
Risk
Communications, Media & Entertainment
Business Capital
Construction
Aerospace
Rail
Performance Driven by Strong Talent

2002 2003 2004 2005 2006 (E)
New Strategy is Driving Strong Originations Growth
CAGR: ~40%
CAGR: 6%
Q4
9 months
New Business Volume($ Billions)
8.19.1
8.2
11.412.5
7.8

Cross-Selling Strategy is Working
Tremendous growth in referral activity in 2006
Incentive compensationdrives behaviors
Lowest cost origination lever
2005 20069 mos.
$228
$967
22 72Transactions
Cross-Sell Volume($ Millions)
YTD324%

An Originations Powerhouse
$12.5 Billion Booked YTD
InvestmentVehicles
$9.3 Billion 2007 Initiative$3.2 Billion
CapitalMarkets
SyndicationsBalance Sheet
$61 Billion Proposed YTD

0
500
1,000
1,500
0
500
1,000
1,500
Driving Non-Spread Revenue and Improving Earnings Mix
Revenue Composition($ in Millions)
20029 mos.
20039 mos.
20049 mos.
20059 mos.
20069 mos.
Spread Non-Spread (NSR)
NSR Growth22%

Owned Credit Losses(% of Average Finance Receivables)
Best-in-Class Risk Management
660 person risk team lead by seasoned veterans
Sophisticated systems provide ‘early warning detection’
State-of-the-art risk-adjusted pricing discipline
Risk philosophy driven by diversification and supportedby strong collateral positions
Risk Management Expertise
0.25%0.16%
Risk-Adjusted Margin(% of Average Earning Assets)
20069 mos.
20059 mos.
2.75% 3.11%
20069 mos.
20059 mos.

Model Designed to Deliver Earnings Through All Cycles
Strong Economy
Acquisition Finance
Growth Capital
Mergers and Acquisitions
Real Estate
Construction
Competitors enter,margins decline
Down Cycle
Factoring
Restructuring
DIP Financing
Distressed Debt
Advisory Services
Competitors exit, margins improve

What do Middle Market Customers Really Want?
Understand their business
Stand with them through cycles
Deliver solutions for complex financing needs
Respond quickly and always deliver on commitments

Limited
How We Win in the Middle Market
RelationshipOrientation
StructuringExpertise
Middle Market Advisory Capabilities
Agility
Direct Access toDecision Makers
Broad ProductOffering
Long-Term Commitmentto Middle Market
Deep & Dedicated IndustryFocus / Expertise
Banks FinanceCompanies
HedgeFunds
Limited
Limited
Limited
Limited
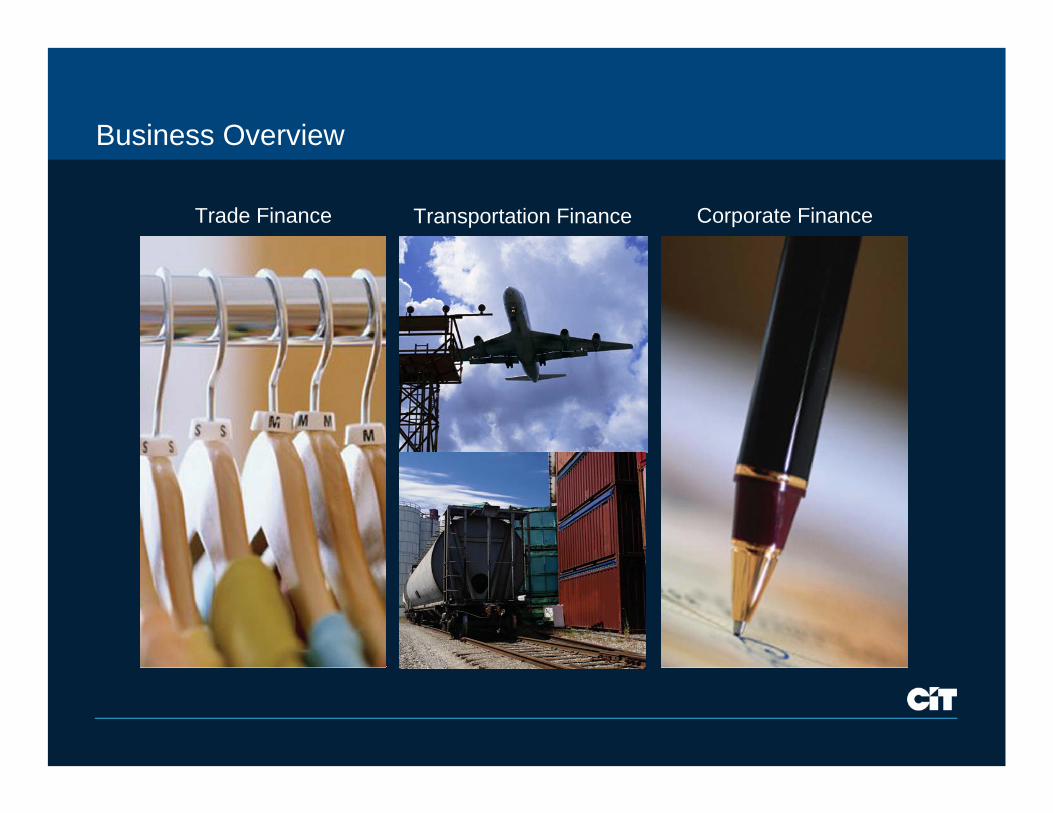
Business Overview
Trade Finance Corporate FinanceTransportation Finance

Trade Finance: Commercial Services
#1 factoring position in the U.S.- ~$45 Billion volume
Average client relationship - Over 10 years
Actively cross-selling insurance, commercial credit and M&A
International expansion- Following our clients to Europe
and Asia
Factoring Volume($ Billions)
27.8 27.5
38.242.3
32.7
2002 2003 2004 2005 20069 mos.
CAGR: 12%

Transportation Finance: Rail
Youngest major fleet in the industry
- Average age of 10 years versus industry average of 19 years
#3 franchise position with over100,000 car fleet
Over 99% utilization rate
Smart bolt-on acquisitions
Attractive pricing on renewals
Favorable railcar delivery positions with manufacturers in 2007 / 2008
Managed Assets ($ Billions)
1.82.4 2.6
3.53.8
2002 2003 2004 2005 20069 mos.
CAGR: 22%

Transportation Finance: Aerospace
#3 franchise position
40 years of industry experience
Over 120 customers
International platform: over 80% of aircraft are outside North America
Modern, fuel efficient fleet
Commercial Aircraft: Over $2 trillion requirement for aircraft financing in the next 20 years
Business Aircraft: $156 billion of aircraft deliveries in the next 10 years
Aerospace and Defense Finance: Supply chain finance
4.2 4.85.5
6.77.1
2002 2003 2004 2005 2006
Managed Assets($ Billions)
9 mos.
CAGR: ~15%

Corporate Finance
6.5 6.7 7.48.7
10.4
2002 2003 2004 2005 20069 mos.
Leveraging industry expertise, specialty lending acumen, balance sheet and capital market capabilities
Focused ‘One CIT’ approachto channel partners
Collaborative deal teams driving organic growth
Advisory services enhance capabilities and fee revenue
Expanding lead generation through Piper Jaffray alliance
New Business Volume($ Billions)
Sponsor-Backed Transactions
2005 2006 9 mos.
Number of Deals 196 262
Lead Deals 15 40
Commitments $4.0 B $7.3 B
Fundings $2.2 B $4.0 B
CAGR: ~30%
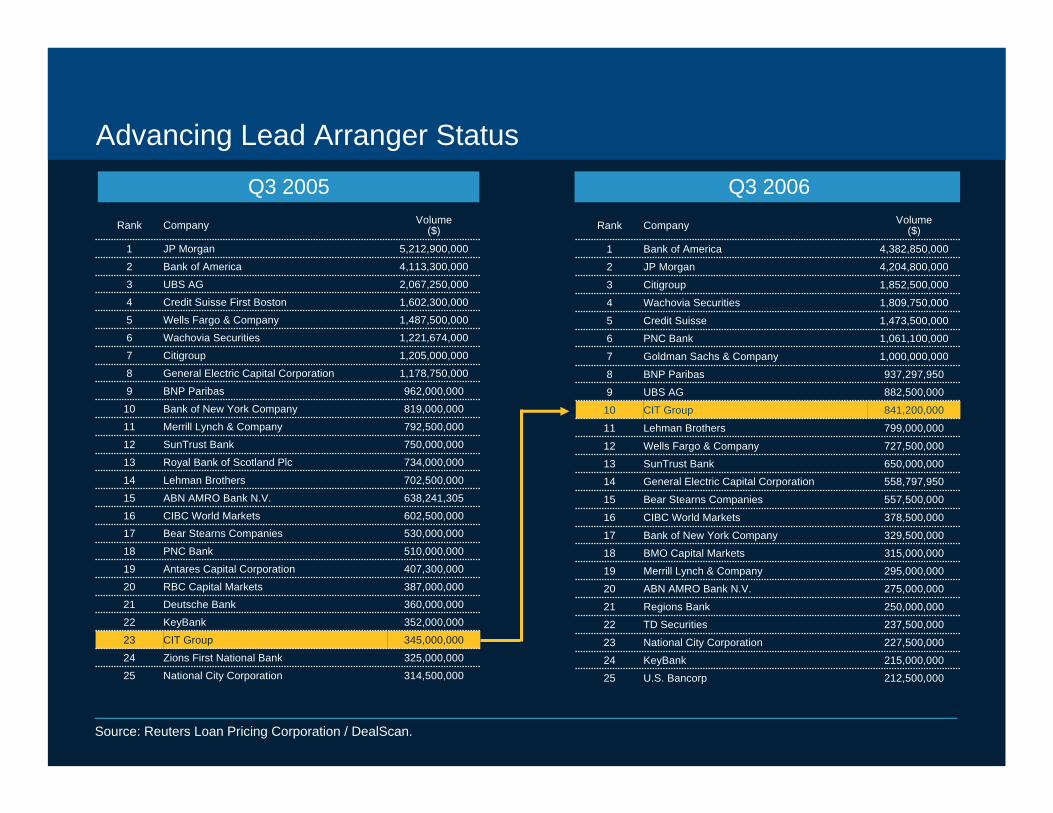
Advancing Lead Arranger Status
Q3 2005
314,500,000National City Corporation25
325,000,000Zions First National Bank24
345,000,000CIT Group23
352,000,000KeyBank22
360,000,000Deutsche Bank21387,000,000RBC Capital Markets20
407,300,000Antares Capital Corporation19
510,000,000PNC Bank18
Volume($)CompanyRank
530,000,000Bear Stearns Companies17602,500,000CIBC World Markets16
638,241,305ABN AMRO Bank N.V.15
702,500,000Lehman Brothers14
734,000,000Royal Bank of Scotland Plc13
750,000,000SunTrust Bank12
792,500,000Merrill Lynch & Company11
819,000,000Bank of New York Company10
962,000,000BNP Paribas9
1,178,750,000General Electric Capital Corporation8
1,205,000,000Citigroup7
1,221,674,000Wachovia Securities6
1,602,300,000Credit Suisse First Boston4
1,487,500,000Wells Fargo & Company5
2,067,250,000UBS AG3
4,113,300,000Bank of America2
5,212,900,000JP Morgan1
Source: Reuters Loan Pricing Corporation / DealScan.
Q3 2006
212,500,000U.S. Bancorp25
215,000,000KeyBank24
227,500,000National City Corporation23
237,500,000TD Securities22
250,000,000Regions Bank21
275,000,000ABN AMRO Bank N.V.20
295,000,000Merrill Lynch & Company19
315,000,000BMO Capital Markets18
Volume($)CompanyRank
329,500,000Bank of New York Company17
378,500,000CIBC World Markets16
557,500,000Bear Stearns Companies15
558,797,950General Electric Capital Corporation14
650,000,000SunTrust Bank13
727,500,000Wells Fargo & Company12
799,000,000Lehman Brothers11
841,200,000CIT Group10
882,500,000UBS AG9
937,297,950BNP Paribas8
1,000,000,000Goldman Sachs & Company7
1,061,100,000PNC Bank6
1,809,750,000Wachovia Securities4
1,473,500,000Credit Suisse5
1,852,500,000Citigroup3
4,204,800,000JP Morgan2
4,382,850,000Bank of America1

New Strategic Initiatives are Growth Engines for the Future
Q1 2005 Q2 2005 Q3 2005 Q4 2005 Q1 2006 Q2 2006 Q3 2006 Q4 2006 2007
Overall Investment vs. Return($ Millions)
Investment phase
Revenue positive
Healthcare
Mergers & Acquisition
Commercial Real Estate
Capital Markets
Global Sponsor
Syndicated Loan
Energy
Aerospace & Defense Finance
International Trade Finance
Commercial Credit
Business Capital Restructuring
StructuredEquipment Finance

New Strategic Initiatives are Growth Engines for the Future
Overall Investment vs. Return($ Millions)
Q1 2005 Q2 2005 Q3 2005 Q4 2005 Q1 2006 Q2 2006 Q3 2006 Q4 2006 2007-50
-30
-10
10
30
50
70
90
110
130
150
Q1 2005 Q2 2005 Q3 2005 Q4 2005 Q1 2006 Q2 2006 Q3 2006
ExpenseRevenue
Net Revenue

Healthcare Vertical Driving Growth
Healthcare as a growth engineLaunched industry vertical in 2005Hired best-in-class teamOrganized sales force around large healthcare sub-segments
2005 Healthcare Financings:~$170 Billion
Managed Assets($ Billions)
Dec 2004 Dec 2005 Sep 2006
0.5
1.5
2.5
Hospitals Dental Physician Practices
Speciality Pharma / Meditech Outpatient
Long Term Care Managed Care
Life Sciences Vendor
31%
5%16%5%
16%
9%
12%6%
CAGR: 144%

Healthcare - Rapid Payback on Investment
0
10
20
30
40
50
60
Q1 2005 Q2 2005 Q3 2005 Q4 2005 Q1 2006 Q2 2006 Q3 20060
20
40
60
80
100
120
140
160
180
Revenues Expenses Efficiency Ratio
Accelerating Productivity
($ Millions) Efficiency Ratio (%)

Building Scale Through Bolt-On Acquisitions
Trade Finance Transportation Finance
Rail Fleet(Railcars)
German Factoring 166
SunTrust 864
Factoring Assets($ Millions)
Corporate Finance
Healthcare Finance Assets($ Millions)
HBCC 515 PLM 5,845
DJ Joseph 2,100
Bombardier 15,000
Acquisitions are a core competencyAccretive from inception
All are tracking at or above plan

Construction: Transformation Success Story
Refocused on core strategy
Restructured the business- $11 million cost take-out
- 106 headcount reduction
Re-deployed sales force
Effective use of capital markets distribution capabilities
The result:- Improved front-end and
operational efficiency
- Sales productivity morethan doubled
- Achieving ROE hurdle rate
$28 MNon-Spread Revenue
$1.2 BVolume
15.1%ROE
27.2%Efficiency Ratio
$32 MNet Income 66%
23%
30%
1,098bps
667bps
20069 mos.
20059 mos.
VS.

Investment Phase in Growth Initiatives is Nearly Complete
Funded 25% by exiting slow-growth / low-return businesses
Rigorous focus on productivity and expense management
Platforms built without incurring goodwill
5%
95%
80%
20% Back-end
Front-end
Majority of investment has been…
Focused on the Front-End
Cost and Revenue Correlated
Fixed
Variable
134
101
(33)
Investment Restructuringsavings
Net Investment
Investment for Growth($ Millions)

Balancing Size of Sales Force with Productivity
275
Sep2005
20%
==++
28
32%
37
59%
12.1
7.6
Sales Force Size* Sales Productivity($ Millions)
Volume*
($ Billions)
Sep2006
20059 mos.
20069 mos.
20059 mos.
20069 mos.
330
* Excludes Trade Finance volume and headcount.

14.4%16.0% 16.8% 16.8% 17.2%
18.5% 18.0%
2,0973,087 2,705
3,5313,065
4,568 4,892
Q1 2005 Q2 2005 Q3 2005 Q4 2005 Q1 2006 Q2 2006 Q3 2006
Delivering Strong Growth and Returns
ProfitabilityDrivers
Record new business volumesStable risk-adjusted marginsIncreasing levels of fee incomeStrong credit quality
Volume ($ Millions) ROE
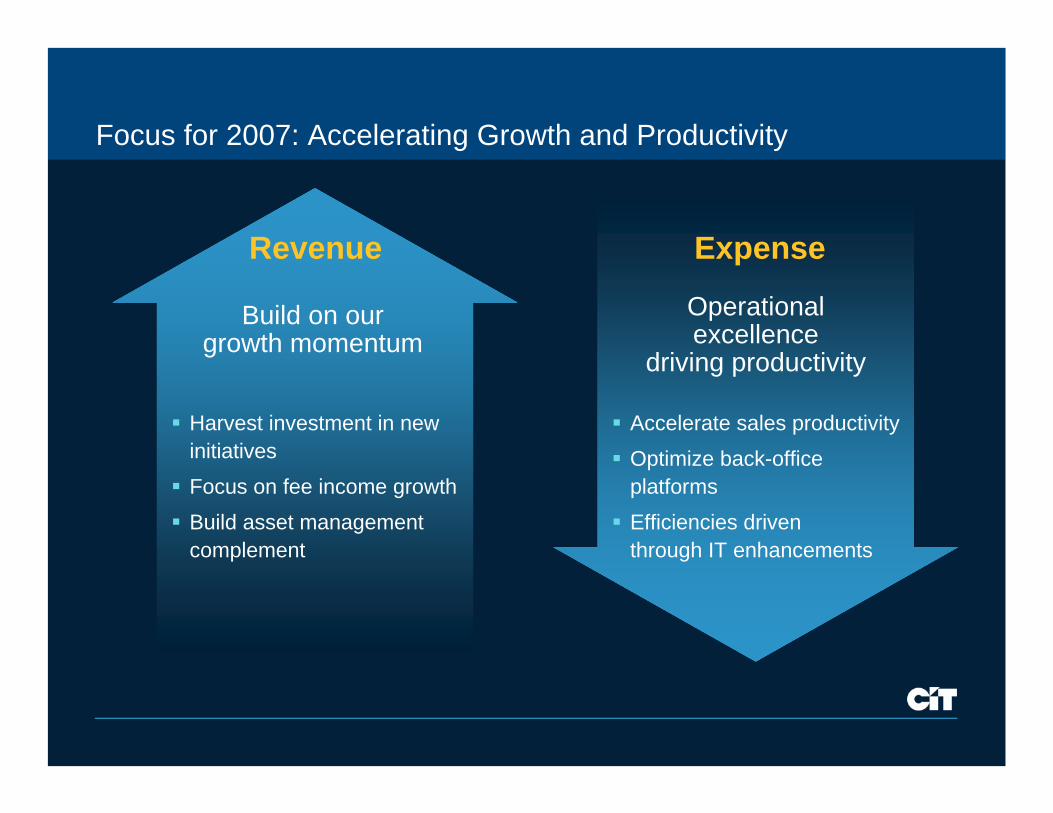
Focus for 2007: Accelerating Growth and Productivity
Harvest investment in new initiatives
Focus on fee income growth
Build asset management complement
Build on our growth momentum
Operationalexcellence
driving productivity
Accelerate sales productivity
Optimize back-office platforms
Efficiencies driventhrough IT enhancements
Revenue Expense

Commercial Finance Panel
Gregg Smith M&A
Jim HudakCommunications, Media & Entertainment
Flint BeseckerHealthcare

Healthcare Team Leads with Trusted Advisor Approach
Top 5 healthcare leaders have over 100 years of industry experience
Applies intellectual capital to drive value for clients
Healthcare is huge market representing 16% of GDP
Added 289 new relationships in past 12 months
Sole Lead Arranger
$55,000,000
Senior Secured Credit Facility
Supporting the Acquisition of Tarrant Dialysis Centers by US Renal
$47,100,000
Senior Secured Credit Facilities
Acquisition Finance
Relationship Case Study
Widely respected middle market private equity firm with long standing healthcare
investment track record
4 Closed lead mandate financings in 20063 Pending commitments due to fund2 Buy-side advisory engagements
CIT Healthcare is preferred source for private equity firm’s activities Sole Lead Arranger

M&A Advisory Team Executes Mandates Across CIT’s Platform
Over 90 opportunities have been reviewed:
have acquired
September 2006
and
Sanus Holdings, LLC
®®
The undersigned initiated the transaction and acted as exclusivefinancial advisor to Arcapita Inc. and Sanus Holdings, LLC
Common Characteristics
A leading distributorof women’s apparel
®®
Exclusive sell-side advisor
PROJECTYELLOW JACKET
In Process
Aerospace & Defense (1)Communication, Media & Entertainment (14)Consumer Products (5)Diversified Industrials (20)
Energy (5)Healthcare (30)Rail (1)Retail & Apparel (15)
Long-term relationships
Leverage CIT’s balance sheet
Deep industry expertise
CIT initiated
Case Studies
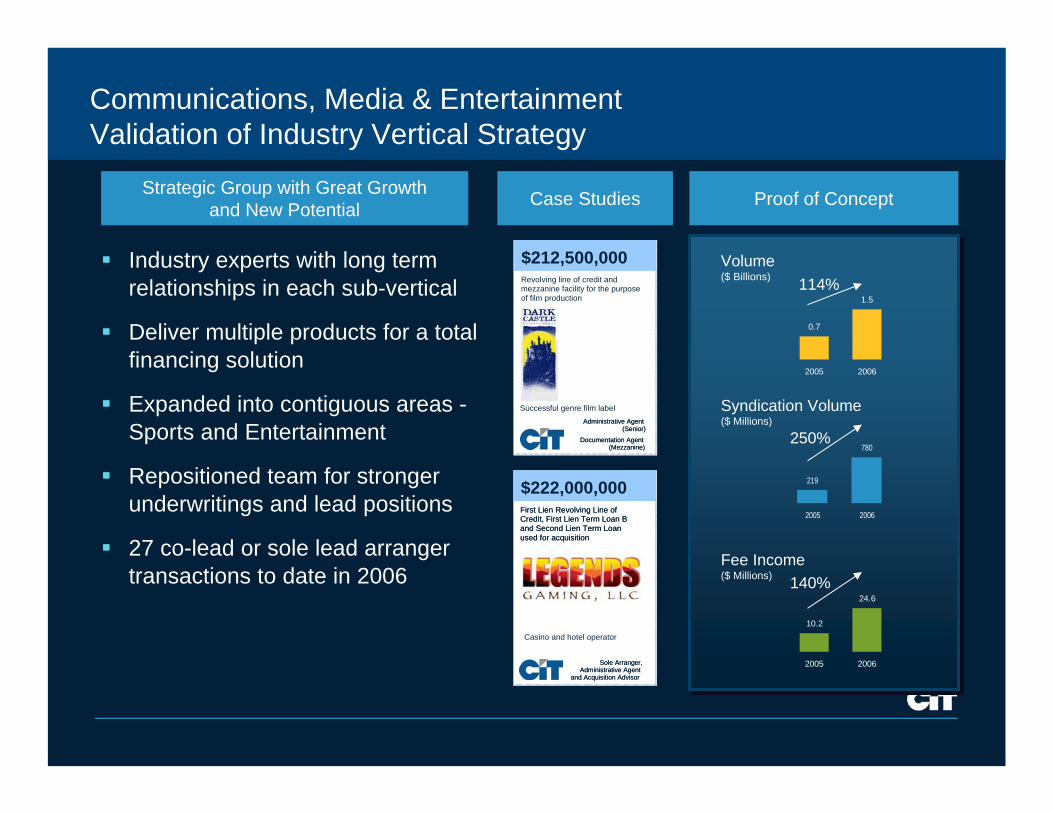
Communications, Media & EntertainmentValidation of Industry Vertical Strategy
Strategic Group with Great Growth and New Potential
Industry experts with long term relationships in each sub-vertical
Deliver multiple products for a total financing solution
Expanded into contiguous areas -Sports and Entertainment
Repositioned team for stronger underwritings and lead positions
27 co-lead or sole lead arranger transactions to date in 2006
Proof of Concept
Sole Arranger, Administrative Agent
and Acquisition Advisor
First Lien Revolving Line of Credit, First Lien Term Loan B and Second Lien Term Loan used for acquisition
Casino and hotel operator
$222,000,000
Sole Arranger, Administrative Agent
and Acquisition Advisor
First Lien Revolving Line of Credit, First Lien Term Loan B and Second Lien Term Loan used for acquisition
First Lien Revolving Line of Credit, First Lien Term Loan B and Second Lien Term Loan used for acquisition
Casino and hotel operator
$222,000,000
Administrative Agent (Senior)
Documentation Agent (Mezzanine)
Revolving line of credit and mezzanine facility for the purpose of film production
Successful genre film label
$212,500,000
Administrative Agent (Senior)
Documentation Agent (Mezzanine)
Revolving line of credit and mezzanine facility for the purpose of film production
Successful genre film label
$212,500,000
219
780
2005 2006
Syndication Volume($ Millions)
250%
10.2
24.6
2005 2006
Fee Income($ Millions) 140%
0.7
1.5
2005 2006
Volume($ Billions) 114%

Commercial Finance
Improved go-to-market synergiesFocus on major growth opportunitiesGreatly enhanced fee income generationEnhanced risk management – domain expertiseScalable modelDeliver consistently through all cycles
Benefits
Market and industry focusedCustomer-centricEnd-to-end solutionsRelationship drivenEnables cross-sellingOriginate and distribute model
The Right Modelat the Right Time
Industry expertise valuedCapital expenditures increasingComplex and growing financing needsFragmented competitive landscapeGlobal scope
Focus on Large and Attractive Markets