Embed Size (px)
Citation preview

Research ArticleVibration Response of Combine Harvester Chassis UndergoingMultisource Excitation Force Distribution
Yu Li Zhong Tang Hui Ren and Yuepeng Zhou
Key Laboratory of Modern Agricultural Equipment and Technology of Ministry of Education Jiangsu UniversityZhenjiang 212013 Jiangsu China
Correspondence should be addressed to Zhong Tang tangzhong2012126com
Received 3 September 2020 Revised 6 December 2020 Accepted 15 January 2021 Published 29 January 2021
Academic Editor Ioannis Kostavelis
Copyright copy 2021 Yu Li et al -is is an open access article distributed under the Creative Commons Attribution License whichpermits unrestricted use distribution and reproduction in any medium provided the original work is properly cited
When a combine harvester is harvesting in field under complicated conditions vibration characteristics of the chassis frame underthe excitation of multiple sources are complex and changeable In order to analyze the vibration characteristics of the chassis frameof the combine harvester under complex working conditions and multisource excitation this paper carried out three-dimensionalmodeling and static calculation of the chassis frame of the combine harvester On this basis the experimental modal analysis wascarried out on the designed chassis frame and finally the vibration response under multiple excitations and complex workingconditions was tested and analyzed in the field Results showed that when the combine harvester was fully loaded the maximumbending moment was at the load-bearing beam under the grain box-emaximum bending moment was 229808Nm and it waslocated at the cross section of the left end of the bearing beam at 161m When the components of the whole machine wereworking the vibration of the chassis frame at the rear right was the most intense -e horizontal vibration of the threshing drumthe reciprocating motion generated by the vibrating screen and the vertical vibration generated by the engine were the mainvibration sources of the combine harvester in the three directions of X Y and Z With the increase of engine speed the excitationcapacity of each working component connected to the engine on the whole machine increased -e results of this paper provideexperimental basis for the research on the vibration characteristics of the chassis frame of the rice combine harvester undermultisource excitation and also provide a reference for the further improvement of the chassis frame of the combine harvester
1 Introduction
With the development of science and technology and thegradual improvement of mechanization rice harvesting hasbasically achieved full mechanization [1] -e crawler ricecombine harvester is a complex large-scale agriculturalharvesting machine that integrates mechanical functionssuch as harvesting threshing separation and sorting [2ndash4]During the field harvesting operation in complex workingconditions the vibration characteristics of the chassis frameunder the excitation of multiple sources are complex andchangeable which will affect the reliability and operationsafety of the whole machine field harvesting [5ndash7] In ad-dition when the combine harvester is working there aregenerally problems such as large vibration of the wholemachine easily damaged parts and low reliability of the
whole machine which seriously affect the harvest efficiencyand the physical and mental health of the driver [8ndash10]
As the main bearing part of the combine harvester thechassis frame is responsible for connecting the working partsand walking devices of the whole machine Whether thedesigned chassis frame can carry the mass of these workingcomponents will directly affect the safety and reliability ofthe whole machine [11] -e optimization method of thechassis frame is mainly aimed at its carrying capacity and itsstatics are simulated and analyzed by software On this basisthe larger and weaker parts are found to be further im-proved Hu and Du took the corn combine harvester as theobject and analyzed the stress distribution and displacementof the chassis frame under the conditions of no load or fullload through finite element software [12] Not only in thefield of agricultural machinery but also in the field of
HindawiMathematical Problems in EngineeringVolume 2021 Article ID 8856094 22 pageshttpsdoiorg10115520218856094
automobiles there is a need to optimize the chassis frameVijaykumar and Patel conducted structural analysis of thechassis frame of the car through finite element software andfurther optimized its quality under the premise of ensuringthe working reliability of the rack thereby improving theworking performance of the vehicle [13] Nagaraju et alcalculated the load of the mobile chassis of a car andconducted a static analysis through ANSYS to check its loadcapacity [14] Tang et al analyzed the structural charac-teristics and bearing capacity of crawler chassis based on thefinite element model and designed a new type of crawlerchassis joystick to improve the stability of the whole machineunder high load -ese are all theoretical verification andanalysis through finite element software [15] Due to theinfluence of different boundary conditions and differentcalculation methods the calculation results are also differentfrom the actual ones
Due to the harsh working conditions of the combineharvester and the multiple components working at the sametime during the field harvesting operation even if the staticdesign requirements are met it is difficult to ensure thestability of the chassis frame during operation When aworking component of the combine harvester resonates withthe chassis frame it will greatly weaken the carrying capacityof the frame causing severe vibration of the chassis frame Asa result it will crack and fracture which has a great impacton the reliability of the whole machine Analysis of theinherent characteristics of the chassis frame of the combineharvester is mainly divided into two types one is the the-oretical modal analysis and the other is the experimentalmodal analysis -eoretical modal analysis uses modalanalysis software to perform simulation calculations whichis simple and convenient but the calculation results aresomewhat different from the actual ones -e test mode iscloser to the actual situation but it needs to be manufac-tured and then the test process is relatively cumbersomeand random Chen et al proposed a method for onlineevaluation of the dynamic performance of the chassis ofheavy dump trucks based on a new stochastic subspaceidentification (SSI) method By reducing the noise andnonstationary content in the vibration signal from the frameaccurate modal characteristics can be obtained to actuallyevaluate the dynamic behavior of the frame [16] Jiang et alanalyzed the modal and static characteristics of rapeseedwindrowers through finite element analysis [17] -e naturalfrequency of the frame was adjusted to avoid resonance anda finite element static analysis was performed on the opti-mized frame According to the simulation results the framestructure of the rape windrower was optimized and theworking reliability of the whole machine was improvedGanesan and Panneerselvam took the heavy vehicle chassisframe as the research object and solved it by aligning thenatural frequency [18] In addition the frequency compo-nent of road excitation was analyzed By placing rein-forcement plates of different shapes around the chassisframe the natural frequency of bending and torsion wasmoved above the excitation frequency of the road so that itavoided the resonance zone and improved its ability to resistbending and torsion As a result stability of the whole
machine was improved In addition to considering the caseof resonance when there are multiple excitation sources onthe chassis frame vibration superposition will occur whichwill increase the vibration of the whole machine and shortenthe working life of the machine -erefore it is also veryimportant to study the vibration characteristics undermultisource excitation
When the combine harvester was working in field dueto the excitation effect of the road surface and the si-multaneous action of multiple working components theentire frame would show significant vibration -e lowreliability of combine harvesters is directly related to theirsevere vibration Relevant data showed that 80 of themechanical structure damage was fatigue damage and 75of the mechanical structure damage was related to vibration[19ndash21] Severe vibration will reduce the reliability of thecombine harvester leading to the chassis frame more proneto fatigue damage and ultimately affect the working effi-ciency of the whole machine [22ndash24] -e combine har-vester as a multifunctional machine has multiple workingcomponents on it which causes the phenomenon ofmultisource excitation Strong and continuous vibrationand simultaneous excitation of multiple working compo-nents is an important cause of fatigue damage to thecombine harvester frame -erefore it is particularly im-portant to study the multisource excitation characteristicsof the combine -e research on multisource excitationproblems is mainly concentrated in the field of vehicles andships and there is very little research on fitting the mul-tisource excitation characteristics of harvesters Fang andZhang took electric vehicles as the research object andconducted numerical analysis and experiments on theirvibration and acoustic behavior [25] -rough the forcedresponse analysis of the finite element mesh of the shell theeffect of various excitations on the NVH performance ofthe electric power transmission system was studied Xieet al studied the vibration response of ships and otherstructures under multipoint complex load excitation [26]Taking the excitation motor installed on the base panel asthe excitation source the vibration source and the basepanel were connected at multiple points through a forcesensor and the vibration response under multipoint ex-citation was simulated and experimentally studied Chenet al took the rice combine harvester as the research object[27] Based on the multisource excitation of the combineharvester the chassis rack and the thresher were assembledinto a complete combine harvesting rack -e vibrationresponse of the frame of the combine under multisourceexcitation was derived and the dynamic model of the frameof the combine with a 7-degree-of-freedom rigid body wasestablished On this basis the simulation analysis of theexcitation parameters and vibration response of the dy-namic model was developed in MATLAB -e above-mentioned research studies on the vibration characteristicsof the system under multiple excitations were carried outunder theoretical conditions For the combine harvestersystem with complex and diverse working conditions andmultiple excitations coexisting the simulated state oftendeviates greatly from the actual one-erefore the research
2 Mathematical Problems in Engineering
on the vibration characteristics of multisource excitationunder actual working conditions is particularly important
-is paper took the crawler rice combine harvester as theresearch object According to the installation position andphysical characteristics of each working component thechassis frame was 3D modeled and statically calculated Onthis basis the experimental modal analysis of the designedcombine harvester chassis frame was carried out to study theresonance of the frame and the excitation source Fur-thermore the field tests were carried out under the premiseof further optimization of the structure and the vibrationcharacteristics of the chassis frame were measured andstudied under multiple working conditions Finally its vi-bration response under multiple working conditions andmultiple excitations was analyzed -is paper systematicallystudies the vibration characteristics of the chassis frame ofthe crawler combine harvester under multisource excitationwhich provided important experimental basis and results forthe vibration characteristics of the chassis frame of the ricecombine harvester under multisource excitation At thesame time it provided reference for the further optimizationand improvement of the chassis frame of the combineharvester
2 Material and Methods
21 Chassis Frame Structure Load and Stress State
211 Overall Stress State of the Chassis Frame -e chassisframe of the combine harvester mainly plays a load-bearingrole and the loads it receives mainly come from 8 aspectsincluding the grain box the cab the engine the fuel tank thecylinder the threshing drum and the accumulator -einstallation position of each working component on thecombine harvester is shown in Figure 1
Taking the components carried on the chassis frame asthe analysis standard the stress situation of each componentof the chassis frame was analyzed First we determine thespecific stress of the beam and then mark the stress portionon the crawler chassis based on the installation position ofeach working component of the combine under the as-sembly of the whole machine Specifically it included thegrain box stress surface the cab stress surface the enginestress surface the fuel tank stress surface the cylinder stresssurface the threshing drum stress surface and the accu-mulator stress surface -e main component parameters areshown in Table 1
We simplify the bearing and load on the chassis frame ofthe combine harvester (among them the welding place wassimplified as a fixed support) and get the beam calculationdiagram After simplification the analyzed beams were allstatically determinate beams including simply supportedbeams overhang beams and cantilever beams [28 29] -eschematic diagram of the actual force application position ofeach component to the chassis frame is shown in Figure 2
According to the balance equation the bearing restraintforce of the statically determinate beam under load wasobtained -erefore the external forces on the beam were allknown quantities and the internal forces on each section can
be further studied -rough the calculations the shear forceFs and bending moment M on each cross section can beobtained [30] -e signs of the shear force and bendingmoment are shown in Figure 3
At the same time the position of the cross section on thebeam was expressed as the abscissa x so the shear force andbending moment on each section can be expressed as afunction of x-e shear force equation and bendingmomentequation of the beam are shown in the following equations
Fs Fs(x) (1)
M M(x) (2)
where Fs andM are the shear force and bending moment of across section of the bearing beam respectively
-e abscissa x parallel to the beam axis represented theposition of the cross section and the ordinate representedthe shear force or bending moment on the correspondingsection Shear graphs and bending moment graphs can bedrawn through which the position of the dangerous sectionand the corresponding value can be clearly seen
212 Analysis of the Main Components Applying Load to theBearing Beam
(1) -e effect of the grain box on the chassis frame isshown in Figure 2 -e cross section of the beam was50times 50mm-e load concentration q 15490 (Nm)can be obtained from the bearing area and full-loadpressure -e no ① beam was divided into threesections according to its stress conditions SectionA-B did not directly bear the load and the uniformlydistributed load was mainly distributed in sectionsB-C -erefore the calculation of the establishmentand bending moment of beam no ① needed to beperformed separately-e stress conditions of beamsno ② and ③ were the same and there were alsodifferent situations of multiend stress -e loadconditions of each beam carrying the grain box areshown in Table 2
(2) -e load of the chassis frame on the cab is shown inFigure 2 and the cross section of the beam was50times 50mm -ere were four beams supporting thecab numbered ④ ⑤ ⑥ and ⑦ -en the no ⑤beam was a statically indeterminate continuousbeam and the no ④ ⑥ and ⑦ beams were stat-ically determined simply supported beams -e loadconcentration q 750 (Nm) can be obtained fromthe load-bearing area and full-load pressure -eload-bearing condition of each beam is shown inTable 2
(3) -e force situation of the engine installation positionis shown in Figure 2 Two beams were mainlystressed on the frame where the engine was installed-e stress location and stress area of the two beamswere the same so only one beam needed to be an-alyzed Its main load-bearing position was in the B-Cand D-E beam From the load-bearing area and full-
Mathematical Problems in Engineering 3
Cab
Cylinder
Thre
shin
g dr
um
Tank
Engine
Accumulator
Grain box
Figure 2 Schematic diagram of the stressed surface on the chassis of the crawler walking chassis
Table 1 Parameters of the main components of the combine harvester
Main components Grain box Cab Engine Fuel tank Cylinder -reshing drum AccumulatorQuality (kg) 1771 265 300 85 3594 1260 50Bearing area (m2) 0056 01760 00264 01350 00142 01585 00154Full-load pressure (MPa) 0309 00150 01040 00617 02480 00779 00319Allowable load (N) 208268 31164 3528 9996 422688 148176 588
Cylinder
Accumulator
Threshing drum
Fuel tank
Cab
Grain box
Figure 1 Schematic diagram of the location of each working component
Fs Fs
(ndash)(+)
FsFs
(a)
(+)M M
(ndash)M M
(b)
Figure 3 Symbol requirements for shear and bending moments in calculations (a) Symbol requirements for shear (b) Symbol re-quirements for bending moments
4 Mathematical Problems in Engineering
load pressure given in Table 1 the load concentrationq 5720 (Nm) can be obtained -e beam crosssection was 40times 60mm-e load-bearing conditionsare shown in Table 2
(4) -ere were four main load-bearing beams of the fueltank and the schematic diagram of its force is shownin Figure 2 From the parameters of the load-bearingarea and the pressure at full load in Table 1 the loadconcentration of the load-bearing beam of the oiltank can be obtained as q 3085Nm and thesimplified calculation diagram is shown inFigure 4(a) Both no⑨ and⑩beams were cantileverbeams and their analysis methods are similar -edifference was that there was still a fixed load onbeam no⑩ so the calculation method of beam no⑩ was slightly different from that of beams no ⑨⑪ and⑫ beams were simply supported beams andtheir analysis methods were the same as before
(5) -e force of the cylinder is shown in Figure 2 -ecross section of the beam was 40times 40mm -erewere two main beams and the position and area ofthe two beams were the same Only a part of eachbeam received a uniform load of 00024m2 From theparameters of the bearing area of the cylinder and thefull-load pressure given in Table 1 the load con-centration q 12400 (Nm) can be obtained -esimplified calculation diagram is shown inFigure 4(b)
(6) -e force of the accumulator was shown in Figure 2-e cross section of the beam was 40times 40mm Itsbearing method was the same as that of the cylinderso only one beam was needed to be analyzed Fromthe parameters of the accumulator bearing area andfull-load pressure given in Table 1 the load
concentration q 7018 (Nm) can be obtained -ecalculation diagram is shown in Figure 4(b)
(7) -ere were four main load-bearing beams of thethreshing drum In addition to this there were twoauxiliary supporting beams -e schematic diagramof the force is shown in Figure 2 No⑭⑯ and⑰beams were simply supported beams all of whichwere subjected to uniformly distributed loads cov-ering the entire beam -eir restraint positions andmethods were the same the difference was that theirsizes were inconsistent beam no ⑮ was a staticallyindeterminate continuous beam which can reducethe maximum bending moment beam no ⑱ wasalso a simply supported beam which was partiallydistributed -e calculation method of the shearforce and bending moment of beam no ⑭ ⑯ and⑰ was the same as the calculation method of thepreviously simply supported beams From the pa-rameters of the load-bearing area of the threshingdrum and the pressure at full load in Table 1 the loadconcentration of the load-bearing beam can be ob-tained as q 3895Nm
22 Design Parameters of the Chassis Frame -e chassisframe is composed of four main beams and five mainlongitudinal beams and auxiliary beams supporting othercomponents It is mainly determined according to thelayout of each assembly of the combine harvester and thequality of each component of the entire combine har-vester -e chassis frame was welded with square andrectangular tubes of different specifications such as30 times 30mm 40 times 40mm and 50 times 50mm Its thicknesshad 4 specifications of 2mm 3mm 4mm and 6mm andwas fixed and reinforced with a connecting plate -e
Table 2 Beams no ①sim⑧ stress situation
Position Beamnumber Type Segmentation Length
(m)Total length
L (m) Pivot Uniform load(Nm)
Grainbox
① Simply supported beam 2 segments (A-B B-C) A-B 151B-C 064 215 2 A C B-C 15490
② Simply supported beam 3 segments (A-B B-C C-D)A-B 045B-C 012C-D 008
065 2 A D B-C 15490
③ Simply supported beam 3 segments (A-B B-C C-D)A-B 045B-C 012C-D 008
065 2 A D B-C 15490
Cab
④ Simply supported beam 1 segment (A-B) A-B 031 031 2 A B A-B 750
⑤ Statically indeterminatecontinuous beam 2 segments (A-B B-C)
A-B0265B-C0335
060 3 A BC
A-B 750B-C 750
⑥ Simply supported beam 1 segment (A-B) A-B 060 060 2 A B A-B 750⑦ Simply supported beam 1 segment (A-B) A-B 073 073 2 A B A-B 750
Engine ⑧ Simply supported beam 5 segments (A-B B-C C-DD-E E-F)
A-B 135B-C 012C-D 023D-E 012E-F 029
211 2 AB B-C 5720D-E 5720
Mathematical Problems in Engineering 5
entire frame was 3807m long 2163m wide and 1036mhigh -e specifications and parameters of each rectan-gular tube in the frame are shown in Table 3
-e material of the main frame pipe material was Q235ordinary carbon structural steel and its material propertiesare shown in Table 4
-ematerial of the entire frame of the combine harvesterwas Q235the elastic modulus E was 196GPa the Poissonrsquosratio μ was 025 the safety factor was 12 and the density ofthe low alloy steel was 7850 kgm3
23 Indoor Test Modal of Chassis Rack
231 Test Mode of the Chassis Frame In order to study theresonance of the chassis frame of the combine harvester andthe excitation source of the whole machine under multi-source excitation the experimental modal test was carriedout on the designed frame -e modal test system is mainlycomposed of an excitation system a data acquisition systemand a modal analysis and processing system -e excitationsystem includes an excitation part and a vibration pickuppart -e excitation part is composed of a set of PCB forcehammer excitation devices and the vibration pickup part iscomposed of several three-way acceleration sensors andseveral data connection lines -e test procedure and testequipment of the chassis frame modal test are shown inFigure 5
According to the existing test conditions the hammerexcitation method was adopted in the modal test in thispaper -e sensors used in the test were PCB piezoelectricthree-way acceleration sensors with a permanent magnetbase which was easy to install and had less additional massto the main frame -e instrument parameters required forthe modal test of the chassis frame of the crawler combineharvester are shown in Table 5
In the modal test of the chassis frame the final resultsunder different constraints may be completely different -eframe of the combine harvester is always in a fixed constraint
state in the actual working conditions At the same time thechassis frame and the vibration sources are connected toeach other as a whole -e constraints added in this modaltest should try to restore the actual constraint state of thechassis frame and the support structure of the chassis framecan better reflect the actual situation -erefore the chassisframe can be placed on the ground for modal test -echassis rack was placed on the ground for testing as shownin Figure 6(a)
In this paper the multipoint excitation and multipointresponse methods are used to select two excitation points fortesting respectively and the reliability of the data is
q = 3085 Nm
q = 3085 Nm
MA
A B
A BXL
F
FRA
FRA FRB
Beam no calculation sketch10
Beam no calculation sketch11
(a)
Cylinder
Accumulator
q = 12400 Nm
L = 045 m
q = 7018 Nm
AFRAFRD
FRCFRA
B C D
A B C
(b)
Figure 4 Calculation diagram of bearing beam (a) Calculation diagram of fuel tank carrying beam (b) Calculation diagram of cylinder andaccumulator bearing beam
Table 3 Specification of the rectangular tube
Specification Wall thickness15lowast 15 06sim2025lowast 25 06sim3040lowast 40 10sim3518lowast 18 06sim2034lowast 34 10sim3550lowast 50 12sim4016lowast 16 06sim2030lowast 30 08sim3048lowast 48 12sim3520lowast 20 06sim2038lowast 38 10sim3560lowast 60 12sim4010lowast 20 06sim2020lowast 40 06sim3030lowast 40 08sim3540lowast 60 08sim4040lowast 100 12sim4050lowast 90 12sim4014lowast 20 06sim2020lowast 50 06sim3030lowast 50 08sim3540lowast 70 10sim4040lowast 120 12sim5050lowast 100 12sim40
6 Mathematical Problems in Engineering
guaranteed through two data acquisition and parameteridentification Generally the location of the excitation pointis selected as a position with greater rigidity on the structurewhich facilitates the transfer of excitation energy and fa-cilitates manual percussion -e measurement points aremainly distributed at the key parts and connection points ofthe chassis frame and the shaft end of each main vibrationsource -e chassis frame model designed in this paper isshown in Figure 6(b) which was needed to be simplified in
the modal test During the test 25 chassis were arranged onthe chassis frame as shown in Figure 6(c)-e distribution ofeach measuring point can reflect the structural character-istics of the chassis frame and two excitation points wereselected on the chassis frame to provide horizontal andvertical excitation forces respectively
During the modal test the two excitation points (hor-izontal and longitudinal) were respectively struck with ahammer to provide excitation force to make the frame
Table 4 Material properties of the combine harvester frame
Density(ρgmiddotcm3)
Elasticmodulus(GPa)
Poissonrsquosratio μ
Yield strengthσs (MPa)
Expansion rateδ ()
Allowable shearstress (τT) (MPa)
Allowable bendingstress (σ minus1) (MPa)
Extrusionstrength σbs
(MPa)
785 196 025 225 24 15sim25 40 120sim150 (staticload)
Hammer Chassis rack Three-way acceleration sensor
DH5902 data acquisition instrument
Curve fitting and modal parameter fitting
Frame natural frequency and mode shape
Objective
Modal analysis andprocessing system
Data collection system
Excitation Measuring toolsIncentive
system
Figure 5 Flow chart of modal test and test equipment
Table 5 Equipment and its parameters required for the modal test
Serialnumber Device name Model Manufacturer Main parameters
1 Exciting hammer 086D05 PCB Sensitivity 10mV1 bf range plusmn5001bf pk2 Nylon hammer head 086D05 086D05 Sensitivity 02374mvN
3 Accelerometer 356A16 PCB Quantity 4 sensitivity 100mVmiddotgminus1 frequency response 03ndash6 kHzrange plusmn50 g pk lateral sensitivity lt5
4 Signal acquisitioninstrument DH5902 DongHua test Quantity 1 number of channels 36 sampling bandwidth 16100 kHz
end scale value plusmn20mvsimplusmn20V5 Computer -inkPad Lenovo mdash
(a) (b)
Incentive point
(c)
Figure 6 Chassis frame modal test (a) Chassis frame modal test scene (b) 3D drawing of chassis frame (c) Modal test model
Mathematical Problems in Engineering 7
generate forced vibration -e vibration response signal ofeach measuring point under the excitation force was col-lected by three-directional acceleration sensors arranged onthe frame After setting the sensor parameters the signal wassampled -e excitation point is hit with a hammer and thefrequency response function pulse force signal and co-herence function of each measuring point were displayed onthe signal acquisition instrument -e validity of the datawas judged by the coherence function frequency responsefunction and pulse force signal at each excitation -emeasured frequency response function can be imported intothe modal analysis software to obtain the inherent propertiesof the frame structure
232 Parameter Identification Process and VerificationMethod of the Frequency Response Curve -e parameteridentification of the frequency response curve is an im-portant step of experimental modal analysis After the fre-quency response function of each measuring point wasmeasured by the sensor a certain parameter identificationmethodmust be used to determine the inherent properties ofthe structure [19]-e operation status of the equipment canbe monitored through modal parameter identification -efrequency domain law relies on frequency response func-tions for modal parameter identification
-is test adopted the frequency domain modal param-eter identification method which was carried out in twosteps-e first step was to use the acceleration sensor of eachmeasuring point to collect the acceleration time-domainsignal transmitted from the excitation point and convert thetime-domain signal into the frequency response of eachmeasuring point function curve the second step performedparameter identification on the obtained frequency responsefunction curve and extracted the modal parameters of thestable structure it contained Common modal parameteridentification methods include the Polylscf method peakextraction method least square method global polynomialfitting method admittance circle method and complexexponential fitting method In this test the Polylscf methodwas used to identify the parameters of the chassis frameWhen the various modes of the chassis frame were obtainedafter parameter identification it was required to verifycorrectness by using MAC criteria -e modal decisioncriterion (MAC) represents the degree of correlation be-tween two sets of modal vectors-e closer the value ofMACis to 1 the more completely correlated are the two sets ofmodal vectors that is the mode shapes are consistent
24 Vibration Test of the Chassis Frame of the CombineHarvester under Multiple Working ConditionsConsidering that there were multiple excitation sources onthe combine harvester even after the analysis and test of thetest modal it was impossible to fully determine the stabilityof the combine harvester when it is installed and working-e excitation of the vibration sources such as the shearingroller longitudinal axial roller engine conveyor trough fanreturn plate and vibrating screen on the combine harvesterare all acting on the frame of the crawler combine harvester
and then transmitted to the whole machine through theframe -erefore the actual whole machine vibration testneeded to be carried out on the designed chassis frame -echassis frame was installed after the static and modal tests onthe combine harvester and the corresponding vibration testwas performed when the whole machine was working -etime-domain comparative analysis of the vibration intensityof the chassis frame of the combine harvester under differentworking conditions and the actual vibration response of thechassis frame under multiple working conditions were an-alyzed to verify its reliability
241 Time-Domain Response Test of the Chassis Frameof the Combine Harvester under Multiple WorkingConditions -e instrument used for the vibration test ofthe chassis frame was still the DH5902 vibration test andanalysis system Considering the accelerometer has a largefrequency response range and high sensitivity it is suit-able for the collection of test signals of the combineharvester [31 32] -erefore the types of sensors usedwere exactly the same used in the modal test Differentfrom the modal test there were differences in the analysismodules used in the test During the test four mainmeasuring points were arranged on the chassis frame ofthe combine harvester which were distributed on the leftfront left rear right front and right rear of the chassisframe -e specific installation method and measurementdirection are shown in Figure 7
-e test was carried out in the test field In actual usethe driver would selectively adjust the throttle or trans-mission path of the combine harvester more or less due toexternal factors such as different grains different roadtopography and different uses -erefore the wholemachine needed to continue to work under the combi-nation of several usage factors and different combinationsdetermine the engine speed so the speed of each com-ponent and the transmission path was different -e vi-bration analysis of the single working condition of thecrawler combine harvester can only partially reflect itsvibration characteristics In order to analyze the reliabilityof the designed chassis frame a total of 4 working con-ditions were analyzed in the static idle load of the wholemachine (only the engine works small throttle) thecomplete machine walks (only the engine works) thestatic idle load of the whole machine (component worksmall throttle) and the complete machine (componentwork) -e vibration data of each working condition areanalyzed and compared and its vibration in the timedomain is tested to analyze its reliability on the wholemachine
242 Vibration Characteristics Test of the Chassis Frameunder Multisource Excitation -e main vibration sourceson the combine harvester include the engine roller fanreturn plate vibrating screen and transmission mechanism-e engine is the main vibration source of the combine -eexcitation to the outside world comes from the periodicthrust generated by the combustion of high-temperature and
8 Mathematical Problems in Engineering
high-pressure gas in the engine and the unbalanced inertialforce of the movement of the crank connecting rodmechanism -is test used a vertical inline 4-cylinder 4-stroke diesel engine -e idling speed was 1500 rmin underthe condition of small throttle the rated speed was 2700 rmin and the ignition order was mainly 2nd order -ecalculation is shown as follows
f n
60times
c
2 (3)
where f is the engine ignition frequency Hz c is thenumber of engine cylinders and n is the engine speed rrpm -e engine rotated at 1500 rmin under idle throttleconditions so the calculated firing frequency was 50 Hzand the engine speed at 2700 rmin under high throttleconditions was 90 Hz that is the operating frequency ofthe engine under the conditions of small throttle andlarge throttle In addition to the engine the gearbox hadtwo speeds input and output -e engine input power tothe gearbox through HST (Hydraulic Smooth Trans-mission) as its input speed which was 3000 rmin and itsfundamental frequency was 50 Hz -e output shaft of thegearbox was connected to the pulley inside the trackTaking into account that the walking speed of thecombine harvester was very low the frequency was lowgenerally 1sim5Hz Besides the remaining excitationsources on the combine harvester also included workingcomponent excitation -e main excitation source pa-rameters are shown in Table 6
During the test excitation of the chassis frame bymultiple working components of the combine harvester wasmainly considered Even after the analysis of test modal itwas impossible to determine whether the chassis frame willresonate when the combine harvester was working -ere-fore it was necessary to test its vibration response whenmultiple components were working at the same time mainlyincluding three working conditions ① -e whole machinewas at no load all components were working and the enginewas in the state of small throttle②-e whole machine wasat no load all components were working and the engine wasin the state of large throttle ③ -e whole machine was
walking in the field all components were working and theengine was in the state of large throttle -e test site was thesame as the chassis frame time-domain vibration test siteand all the test points and sensors and instruments used werethe same
3 Results and Discussion
31 Analysis of the Carrying Capacity of the Chassis Frame-e chassis frame adopted a three-layer structure in whichthe upper frame was mainly used to carry the weight of thecab-e purpose of using the frame structure was to increaseits contact area with the cab so that the force was uniformand the stability of the structure was enhanced -e framecan also be used to place hydraulic oil tanks and arrange thepositions of components reasonably -e middle layer of theframe wasmainly used to support various components of thechassis and the grain box engine etc It is formed by weldingrectangular steel with different thicknesses -e lower framewas connected to the crawler walking system and itsstructure is shown in Figure 2 -e middle layer was the corepart of the entire chassis frame carrying the weight of thecombine harvesterrsquos fuel tank grain box engine cabconveyor trough thresher header and battery -ereforethe horizontal beams in the horizontal direction were mainlyused for supporting and strengthening during design -efront was the load-bearing part of the cab engine headerconveyor trough and part threshing device and the stressconditions were complex -erefore three vertical beamsand three triangular beams were added in the vertical di-rection to strengthen the connection which were welded bya beam connected to the lower frame
311 Grain Box Beam no ① according to the staticbalance equation
FRA + FRC qL (4)
1113944 MA 0 (5)
2 1
34
X direction front and back vibration of the frameY direction left and right vibration of the frameZ direction vertical vibration of the frame
Measuring point 1 rear left of the chassis frameMeasuring point 2 left front of the chassis frameMeasuring point 3 right front of the chassis frameMeasuring point 4 right rear of the chassis frame
1
Figure 7 -e arrangement of the chassis rack test sensors
Mathematical Problems in Engineering 9
We bring the data into the equation to get the reactionforce FRA 14755N and FRC 84381N -e shear forcediagram and bending moment diagram obtained by cal-culation are shown in Figures 8(a) and 8(b)
It can be seen from the curve of the bending momentexperienced by the no① beam that the maximum bendingmoment occurred at x 161m -at is the position wherethe bending failure was most likely to occur when it wasloaded was within the BC section and the bending momentexperienced here was 229808Nm
According to the stress state of beam no ② and ③relevant statics analysis was carried out According to thestatic balance conditions it was mainly divided into threeparts A minus B B minus C andC minus D which were analyzedseparately
Bringing the data into equations (4) and (5)FRA 4004N and FRC 14584N From the static balanceequation the shear diagram and bending moment diagramof beam no ② and ③ can be obtained as shown inFigures 9(a) and 9(b)
It can be drawn from Figure 9 that the maximumbending moment of beam no ② and ③ appeared atx 0476m and the maximum bending moment was1854Nm It can be seen from the abovementioned
calculations that the maximum bending moment of theload-bearing beam of the grain box occurred at beam no①shown in Figure 8 at a distance of 161m from the left endboundary and the maximum bending moment was229808Nm
312 Cab Beam no④ since the load and restraint force onthe beam were symmetrical to the midpoint of the spanaccording to the static balance condition
FRA FRB 12
qL (6)
According to equation (6) FRA FRB 11625 (N)Beam no⑥ and⑦ the stress modes of these two beams
and the position of the fixed support were the same as thoseof beam no④ so the calculation diagrams of the three wereconsistent Due to the different sizes of the three their re-spective bending moments and shear forces were also dif-ferent -e shear force diagram and bending momentdiagram obtained from the shear force equation and bendingmoment equation are shown in Figure 10 Figure 10(a) is theshearing force diagram of the three beams and 10(b) is thebending moment diagram of the three beams It can be seen
Table 6 Main vibration source parameters of the combine harvester
Main excitation sources Rotational speed (rpm) Vibration frequency (Hz)Engine 2700 90Gearbox 3000 5000Countershaft 1425 2375Tangential threshing 680 1133Cutter drive shaft 425 708Longitudinal axial roller speed 760 1267Cross axle driving shaft speed 500 833Fan speed 1550 2583Vibrating screen 430 717Conveyor drive shaft 500 83
Shea
r for
ce (N
)
Length of the beam (m)0 05 1 15 2 25
ndash10000
ndash8000
ndash6000
ndash4000
0
2000
ndash2000
A
x 151y 14755
x 215y ndash8438
y = ndash15490x + 248654
B
C
Section A-B shear curveSection B-C shear curve
(a)
Bend
ing
mom
ent (
Nm
)
Length of the beam (m)0 05 151 2 25
0
500
1000
1500
2000
2500
x 215y 0
x 161y 229808
x 151y 2228
y = 14755x
y = ndash7745x2 + 248654x ndash 176594
Peak
C
A
B
A-B bending moment variation curveB-C bending moment variation curve
(b)
Figure 8 Beam no ① bearing shear and bending moment diagram (a) Beam no ① shear diagram (b) Beam no ① bending momentdiagram
10 Mathematical Problems in Engineering
from Figure 10 that the maximum bending moments ofbeam no④⑥ and⑦ were located at the midpoint of thebeam and the maximum bending moments were 901Nm3375Nm and 4996Nm respectively
Beam no ⑤ the beam was a statically indeterminatecontinuous beam Among them the shear force at the end ofsection A was Fs1 qL1 20625 (N) the shear force at theleft section of point B was Fs2 minus20625 (N) the shear forceat the right section of point B was Fs3 qL2 24375 (N)the shear force at section C was Fs4 minus24375 (N)-e shearforce diagram and bending moment diagram were obtainedas shown in Figures 11(a) and 11(b)
Compared with the statically indeterminate structurethe maximum value of the bending moment can be greatly
reduced It can be seen from Figure 11(b) that the maximumbending moment was 1052Nm Based on the above-mentioned calculations and graphics it can be seen thatamong all the load-bearing beams in the cab the maximumbending moment occurred at the midpoint of beam no ⑦shown in Figure 10(b) and the maximum bending momentwas 4996Nm
313 Engine According to the static balance conditionFRA + FRF qL1 + qL2 1113936 M 0 Substitute data can becalculated as FRA 3464N andFRF 10264N Accordingto the load conditions and calculation results of each sectionthe shearing force diagram and bending moment diagram of
Shea
r for
ce (N
)
Length of the beam (m)0 01 02 04 05 06 0703
ndash1500
ndash1000
ndash500
0
500
A Bx 045y 4004
x 057y ndash1458
C D
y = ndash15490lowastx + 73709
Section A-B shear curveSection B-C shear curveSection C-D shear curve
(a)
Bend
ing
mom
ent (
Nm
)
Length of the beam (m)0 01 02 04 05 06 0703
0
50
100
150
200
A
y = 4004x
x 045y 1802
x 057y 1167
Peakx 0476y 1854
y = ndash7745x2 + 73709x ndash 15684
y = ndash14584x + 94796
B
C
D
A-B bending moment variation curveB-C bending moment variation curveC-D bending moment variation curve
(b)
Figure 9 Beams no② and③ bearing shear and bending moment diagram (a) Beam no② and③ shear diagram (b) Beam no② and③bending moment diagram
Shea
r for
ce (N
)
Length of the beam (m)0 01 02 04 05 06 0703 08
ndash300
ndash200
ndash100
0
100
200
300
y = ndash750x + 11625
y = ndash750x + 225
y = ndash750x + 27375
x 031y ndash1163
x = 06y = ndash225
x = 073y = 27375
Beam no 4 shear curveBeam no 6 shear curveBeam no 7 shear curve
(a)
Bend
ing
mom
ent (
Nm
)
Length of the beam (m)0 01 02 04 05 06 0703 08
0
10
20
30
40
50
60
70
x 0155y 901
x 03y 3375
y = ndash375x2 + 27375x
y = ndash375x2 + 11625x
y = ndash375x2 + 225x
x 0365y 4996
Beam no 4 bending curveBeam no 6 bending curveBeam no 7 bending curve
(b)
Figure 10 Beam no④⑥ and⑦ bearing shear and bendingmoment diagram (a) Beam no④⑥ and⑦ shear diagram (b) Beam no④⑥ and ⑦ bending moment diagram
Mathematical Problems in Engineering 11
the engine bearing beam were drawn -e results are shownin Figure 12 Figures 12(a) and 12(b) are the shear forcediagram and bending moment diagram of beam ⑧respectively
It can be seen from Figure 12 that the maximum bendingmoment of the engine load beam was at x 141m wherethe maximum bending moment was 478128Nm
314 Fuel Tank -ere was a fixed load on beam no⑩ andthe size was F 77125N acting at x 041m From theequilibrium conditions M(A) 107204Nm andF(A) 293075NM (A) was the bending moment at pointA and F(A) was the large shear force at point A -e shearforce and bending moment changes of beam no ⑨ and ⑩are put together for comparative analysis to find the changeof shear bending moment -e results are shown in Fig-ure 13 where (a) and (b) are the shear force diagram andbending moment diagram they were subjected to
It can be seen from Figure 13(b) that the two cantileverbeams had the largest bending moment at the left end thatis the welding point-e bending moments were 755825Nm and 102404Nm respectively
According to the static balance conditionFA FB (12)qL 77125N From this the shear forceand bending moment of beam no⑪ and⑫ can be obtainedas shown in Figure 14 where (a) and (b) are the shear forcediagram and bending moment diagram for themrespectively
Based on the analysis and calculation of all the above-mentioned fuel tank parts it can be seen that the ⑪ beam(cantilever beam) shown in Figure 14(b) was the load-bearing beam with the largest bending moment and themaximum bending moment was 107204Nm In particularthe position of the beam with the largest bending momentwas at the left end welding place where the section was adangerous section
315 Cylinder From the static balance conditionFA + FD qL 1113936 MA 0 -e support force FA 2169Nand FD 3783N can be obtained from this On this basis itcan be obtained that the shear force and bending momentare shown in Figure 15 where (a) and (b) are the shear forcediagram and bending moment diagram respectively
It can be seen from Figure 15 that the maximum bendingmoment of the cylinder load beam occurred at a section of028m from the lower end face and the maximum bendingmoment was 5872Nm
316 Accumulator According to the static balance con-ditions FA 1501 N and FC 9553 N On this basis theshear force and bending moment can be obtained asshown in Figure 16 where (a) and (b) are the shear forcediagram and bending moment diagram they were sub-jected to
It can be known from the bending moment variationcurve in Figure 16(b) that the maximum bending momentoccurs at a distance of 021m from the lower end sectionand the maximum bending moment was 1605Nm
317 Breshing Drum -e calculation method of eachbearing beam of the threshing drum was the same as that ofthe same type of beam before -erefore the bendingmoment and the shear force of all the load-bearing beams ofthe threshing drum are shown in Figure 17 where (a) and(b) are the shear force diagram and bending moment dia-gram of beam no⑭⑯ and⑰ respectively (c) and (d) arethe shear force diagram and bending moment diagram ofbeam no⑮ and (e) and (f ) are the shear force diagram andbending moment diagram of beam no ⑱ respectively
As can be seen from the abovementioned images amongall the bearing beams of the threshing drum beam no ⑯
Shea
r for
ce (N
)
Length of the beam (m)0 01 02 04 05 0603
300
200
100
0
400
ndash300
ndash200
ndash100
A
B C
x 0265y 25875 x 060
y ndash24375
x 0265y ndash19125
y = ndash1500x + 65625
y = ndash1500x + 20625
Section A-B shear curveSection B-C shear curve
(a)
Bend
ing
mom
ent (
Nm
)
Length of the beam (m)0 01 02 04 05 0603
0
ndash5
5
10
15
A B C
x 0265y 0
x 04325y 1052
x 01325y 6583
y = ndash375x2 + 99375x y = ndash375x2 + 324375x ndash 5963
A-B bending moment variation curveB-C bending moment variation curve
(b)
Figure 11 Beam no⑤ beam bearing shear and bending moment diagram (a) Beam no⑤ beam shear diagram (b) Beam no⑤ bendingmoment diagram
12 Mathematical Problems in Engineering
was subjected to the maximum bending moment whichappeared at the midpoint of the beam with 486875Nm
After themechanical analysis and calculation of themainload-bearing beams (mainly shear force and bending mo-ment) it can be known that at full load the maximumbending moment of all load-bearing beams appeared on oneof the load-bearing beams of the grain box and the maxi-mum bending moment was recorded as Mmax From all theabovementioned data Mmax 229808Nm and it was
located at the cross section of beam no① 161m away fromthe left boundary
When the beam was bent by force the bending momentwould change with the position of the section Also ingeneral the maximum normal stress σmax occurred at thesection with the largest bending moment (dangerous sec-tion)-e cross section of the beam was a hollow rectangularsection -e calculation of the bending section coefficient ofthe hollow rectangle is shown in equation (7) and the
Shea
r for
ce (N
)
Length of the beam (m)0 01 02 04 05 06 0703
ndash3000
ndash2000
ndash1000
0
1000
2000
3000
4000
5000
A
B
C
x 041y 16659
x 041y 126485
y = ndash3085x
y = ndash3085x + 293075
y = ndash3085lowastx + 21595
Beam no 9 beam shear curveNo 10 section A-B beam shear curveNo 10 section B-C beam shear curve
(a)
Bend
ing
mom
ent (
Nm
)
ndash1200
ndash1000
ndash800
ndash600
ndash400
ndash200
0CB
A
x 041y ndash12972 Repeating part of
beam 9 and beam 10
y = ndash15425x2 + 21595x ndash 755825
y = ndash15425x2 + 293075x ndash 107204
Length of the beam (m)0 01 02 04 05 06 0703
Beam no 9 bending moment variation curveNo 10 section A-B bending moment variation curveNo 10 section B-C bending moment variation curve
(b)
Figure 13 Beams no⑨ and⑩ bearing shear and bendingmoment diagram (a) Beam no⑨ and⑩ shear diagram (b) Beam no⑨ and⑩bending moment diagram
Shea
r for
ce (N
)
Length of the beam (m)0
y = ndash5720x + 80684
x 147y ndash340
x 135y 3464
x 170y ndash340
x 182y ndash10264
x 211y = ndash5720x + 9384
05 1 2 25
1000
15
0
ndash1000
500
ndash500
1500
Section A-B shear curveSection B-C shear curveSection C-D shear curveSection D-E shear curveSection E-F shear curve
(a)Be
ndin
g m
omen
t (N
m)
x 212x 182
y = 3464x x 17x 135 y 46764
x 147 y 468644
y = ndash2860x2 + 80684x ndash 521235
y = ndash10282x+ 2179784
y = ndash340x + 968444
Peakx 141y 478128
Length of the beam (m)0 05 1 2 2515
0
200
400
600
800
1000
y = ndash2860x2 + 9384x ndash 7296956
A-B bending moment variation curveB-C bending moment variation curveC-D bending moment variation curveD-E bending moment variation curveE-F bending moment variation curve
(b)
Figure 12 Engine position bearing beam shear and bending moment diagram (a) Beam no⑧ shear diagram (b) Beam no ⑧ bendingmoment diagram
Mathematical Problems in Engineering 13
equation for calculating the stress during bending withtransverse force is shown in equation (8) [30]
WZ BH
3minus bh
3
6H (7)
σmax Mmax
WZ
le [σ] (8)
where H is the length of the quadrilateral outside therectangular tube h is the length of the quadrilateral in therectangular tube B is the width of the quadrilateraloutside the rectangular tube and b is the width of thequadrilateral in the rectangular tube it can be calculated
by bringing the data into equations (7) and (8) Wz
231803 (mm3) 232 times 10minus 6 (m3) and σmax 991MPa-e material of the beam is Q235 and the yield strengthof Q235 is 235MPa that is [σ] 235MPa -ereforeσmax 991MPalt [σ] which met the requirements ofQ235
32 TestModal Results andAnalysis -e first 6-order modalfrequencies damping ratios and mode shapes of the testmodes of the chassis frame can be obtained -e calculatedmodal frequency was checked by the Modal JudgmentCriterion (MAC) and the correlation between the modalfrequencies of each order was close to zero indicating that
Shea
r for
ce (N
)
Length of the beam (m)0 01 02 04 0503
ndash400
ndash300
ndash200
ndash100
0
100
200
300A
x 0262y 2619 x 031
y ndash3783
x 045y ndash3783
y = ndash12400x + 34657
B
C D
Section A-B shear curveSection B-C shear curveSection C-D shear curve
(a)
Bend
ing
mom
ent (
Nm
)
0
10
20
30
40
50
60
70
80
x 0262y 5683
y = 2169x
y = ndash6200x2 + 34657x ndash 425593
y = ndash3783x + 170235
A
B C
x 031y 5295
x 045y 0
x 028y 5872
Peak
D
Length of the beam (m)0 01 02 04 0503
Section A-B bending moment variation curveSection B-C bending moment variation curveSection C-D bending moment variation curve
(b)
Figure 15 Diagram of shear force and bending moment of cylinder bearing beam (a) Shear diagram of cylinder load beam (b) Bendingmoment diagram of cylinder load beam
Shea
r for
ce (N
)
Length of the beam (m)0 01 02 04 0503
ndash800
ndash600
ndash400
ndash200
0
200
400
600
800
x 0y 77125
x 05y ndash77125
y = ndash3085x + 77125
No 11 and no 12 beam shear curve
(a)
Bend
ing
mom
ent (
Nm
)
0
20
40
60
80
100
120
y = ndash15425x2 + 77125x
x 025y 96406
Peak
Length of the beam (m)0 01 02 04 0503
Beam no 11 and no 12 beam bending moment curve
(b)
Figure 14 Beams no⑪ and⑫ bearing shear and bendingmoment diagram (a) Beam no⑪ and⑫ shear diagram (b) Beam no⑪ and⑫bending moment diagram
14 Mathematical Problems in Engineering
Shea
r for
ce (N
)
ndash100
ndash50
0
50
100
150
200
Length of the beam (m)0 01 02 04 0503
A
B C
x 035y ndash9553
y = ndash7018x + 1501
x 045y ndash9553
Section A-B shear curveSection B-C shear curve
(a)
Bend
ing
mom
ent (
Nm
)
0
5
10
20
15
A C
B
x 02138y 1605
Peak
x 035y 9553
x 045y 0
y = ndash3509x2 + 15011x
y = ndash9553x + 4299
Length of the beam (m)0 01 02 04 0503
Section A-B bending moment variation curveSection B-C bending moment variation curve
(b)
Figure 16 Shear force and bendingmoment of the accumulator bearing beam (a) Shear diagram of accumulator bearing beam (b) Bendingmoment diagram of accumulator bearing beam
Shea
r for
ce (N
)
ndash2000
ndash1000
0
1000
2000
3000
Length of the beam (m)0 02 04 08 106
y = ndash3895x + 19745
y = ndash3895x + 17255
x 0886y ndash17255
x 0664y 133209
y = ndash3895x + 125419
x 1y 19205
Beam no 14 shear curveBeam no 16 shear curveBeam no 17 shear curve
(a)
Bend
ing
mom
ent (
Nm
)
200
0
400
600
800
1000
y = ndash19475x2 + 19475x y = ndash19475x2 + 17255x
y = ndash19475x2 + 129314
x 0443y 3822
x 05y 486875
x 0332y 2019 x 0664
x 0886
Length of the beam (m)0 02 04 08 106
Beam no 14 bending moment change curveBeam no 16 bending moment change curveBeam no 17 bending moment change curve
(b)
Figure 17 Continued
Mathematical Problems in Engineering 15
the calculated modal parameters were valid the verificationresults and the modal shapes of each order of the chassisframe are shown in Figure 18
-e modal analysis of the crawler-type combined har-vesting chassis frame test is shown in Table 7
It can be seen from the data in Table 7 that the first sixnatural frequencies of the chassis frame were between22ndash53Hz and the vibration modes were mainly bendingtorsion and local modes -e first-order natural frequencyof 2377Hz was close to the double frequency of the lon-gitudinal axial drum rotation frequency of 2534Hz and thefundamental frequency of the fan speed was 2583Hz whichmay produce complex vibration coupling and easily excitethe bending mode of the tank support beam -e fifth-ordernatural frequency of the chassis frame of 4538Hz was close
to the basic frequency of the engine at 45Hz at idle speed andlarge throttle which was easy to excite the bending mode ofthe fuel tank support beam
Considering that the frequency of each vibrationsource would be fluctuated during the field harvestingprocess of the combine harvester the fundamental fre-quency of each vibration source and its multiplier fre-quency cannot be calculated by only a certaininstantaneous speed -erefore it was more accurate andpractical to analyze and study the excitation frequency ofeach vibration source in a certain frequency range It canbe seen from Table 7 that the excitation frequency of eachvibration source on the combine was concentrated in twointerval sections of 20ndash25Hz and 45ndash50Hz -erefore inthese two interval sections the fundamental frequency or
Shea
r for
ce (N
)
ndash5000
ndash4000
ndash3000
ndash2000
ndash1000
1000
2000
3000
5000
4000
0
Length of the beam (m)0 05 1 215
A x 044y 24928
x 044y 24928
x 044y 24928
x 044y 24928
x 044 y 24928
BC
y = ndash7790x + 1092158
y = ndash7790x + 59204y = ndash7790x + 17138
D
Section A-B shear curveSection B-C shear curveSection C-D shear curve
(c)
Bend
ing
mom
ent (
Nm
)
Length of the beam (m)0 05 1 215
100
0
ndash50
50
150
200
250
350
400
300
x 022y 9426
x 076y 19942
x 01402y 2019
y = ndash19475(x ndash 044)(x ndash 108)
y = ndash19475(x ndash 108)(x ndash 1724)y = ndash19475x2 + 8569x
A
B C
D
Section A-B bending moment variation curveSection B-C bending moment variation curveSection C-D bending moment variation curve
(d)
Shea
r for
ce (N
)
Length of the beam (m)0 01 02 0403
ndash50
0
50
100
150
200
A
B
C D
x 0055y 14755
x 0105y ndash472
y = ndash3895x + 361775
Section A-B shear curveSection B-C shear curveSection C-D shear curve
(e)
Bend
ing
mom
ent (
Nm
)
Length of the beam (m)0 005 0350301 015 02 025
ndash8
ndash4
0
4
8
12
16
20
A
B
C
Dx 0055y 812
x 0093y 1093 033
y = ndash472x + 15576
y = ndash19475x2 + 362235x ndash 5933
y = 14755x
Section A-B bending moment variation curveSection B-C bending moment variation curveSection C-D bending moment variation curve
(f )
Figure 17 Shear force and bending moment of each bearing beam of the threshing drum (a) Beams no⑭⑯ and⑰ shear diagram (b)Beam no⑭⑯ and⑰ bendingmoment diagram (c) Beam no⑮ shear diagram (d) Beam no⑮ bendingmoment diagram (e) Beam no⑱ shear diagram (f ) Beam no ⑱ bending moment diagram
16 Mathematical Problems in Engineering
and its multiplier frequency of each vibration source maybe close to each other or even produce frequency couplingfurthermore the vibration of the whole machine couldalso reach a peak in these two frequency sections Inaddition the first 6-order natural frequencies of thechassis frame were within the operating frequency rangeof multiple vibration sources on the combine -ere wasmore overlap between 20ndash25Hz and 40ndash45Hz which maycause complex vibration coupling and resonance As aresult the whole machine vibrated violently during op-eration which can easily cause fatigue damage to keycomponents and greatly reduce the service life of thecombine harvester
33 Vibration of the Chassis Frame of the Combine Harvesterunder Multiple Operating Conditions
331 Time-Domain Vibration Characteristics of the ChassisFrame of the Combine Harvester under Multiple OperatingConditions After the tests the data collected from eachchannel of the sensors was processed by the DH vibrationtest analysis software -e working conditions during theanalysis mainly include the following four conditionsworking condition 1 whole machine static no load (only theengine worked small throttle) working condition 2 wholemachine walking (only the engine working) workingcondition 3 whole machine static no load (componentsworking small throttle) and working condition 4 the wholemachine walking (components working) -e data in alldirections were calculated and counted to obtain the time-domain average of the main vibration acceleration of thechassis frame in three directions-e specific data results areshown in Table 8 and Figure 19
In order to explore the vibration amount of the chassisframe under multiple working conditions considering theexistence of three directions of vibration at the samemeasuring point it was necessary to calculate the total rootmean square acceleration of each measuring point underdifferent working conditions in three directions -e rootmean square acceleration of the total vibration of themeasuring point in the rectangular coordinate system can becalculated by
av
a2x + a
2y + a
2z
3
1113971
(9)
From the vibration acceleration data in Table 8 the rootmean square acceleration of the total amount of vibration ofeach measuring point under various working conditions canbe obtained -e specific data results are shown in Table 9
From the vibration acceleration results of the sensorsin Tables 8 and 9 it can be seen that the vibration ac-celeration of the chassis frame was the smallest underworking condition 1 Under working condition 4 thevibration acceleration of the chassis frame was the largestthat meant that when the whole machine and eachcomponent was working the impact of each workingcomponent on the chassis frame was the largest In thiscondition the vibration of the chassis frame at the right
rear was severe which was the position of the threshingand cleaning working device -e main excitation di-rection at this position was in the Z-direction which wasthe carrying direction of the chassis frame Although thestatics had been checked before the design when thethreshing drum was actually working there would be alarge unbalanced excitation force due to the threshingwork Under the action of persistent unbalanced staggeredexcitation force it would cause the chassis frame toproduce periodic forced vibration here -erefore thesupport frame at this position should be furtherstrengthened to improve the long-term reliability of thechassis frame thereby improving the reliability of theentire machine
332 Vibration Characteristics of Chassis Frame underMultisource Excitation Taking the X-direction vibrationresponse of the front left measurement point of the chassisframe as an example the result of the vibration acceler-ation signal after being transformed by someone is shownin Figure 20 -e specific frequency amplitude of thecombine harvester under three working conditions of thestatic load of the complete machine (components work-ing small throttle) the static load of the complete ma-chine (components working large throttle) and the wholemachine walking (components working) is shown inTables 10sim12 Comparing the frequency of the main vi-bration source parameters of the combine harvester inTable 6 with the data in Table 10 it can be seen that themain frequency of vibration in each direction of themeasurement points was basically the second-order fre-quency doubling of the engine under the condition ofsmall throttle at idle speed and each order octave -evibration amplitude of the chassis frame near the bracketresponsible for carrying the engine was the largest in thelateral direction followed by the vertical direction Itcould be that the engine was installed on the chassis frameat an angle which caused the vertical excitation forcegenerated by the combustion torque of the engine todecompose in the lateral and vertical directions
By analyzing the four response points of the chassisframe it can be seen that the measurement point at theleft rear of the chassis frame had large amplitude at 15 Hzwhich may be the double frequency of the fundamentalfrequency of the driving shaft of the bridge or the driveshaft of the vibrating screen Since the vibrating screenstructure was a crank-slider mechanism when the vi-brating screen drive shaft worked the reciprocatingmotion of the slider would have a periodic impact on theframe resulting in large local amplitude of the chassisframe When the whole machine was moving in the fieldwith all working components working the vibrationamplitude of the chassis frame was the largest As theengine speed increased the excitation capacity of eachworking component connected to the engine on thewhole machine increased resulting in an increase in thefrequency component and amplitude of the measuringpoint on the chassis frame Among them each working
Mathematical Problems in Engineering 17
Table 7 Comparison of modal test and finite element calculation results
Researchobject Order
Modal test resultsDeviation ()Test frequency
(Hz)Damping ratio
() Mode shape
Chassis frame
1 2377 022 Fuel tank support beam bending 132 2891 047 Cab beam bending and torsion combination 283 3541 072 Fuel tank support beam bending 09
4 4244 016 Overall bending and twisting combination of chassisframe 85
5 4538 053 Fuel tank support beam bending 546 5262 058 Left beam bending 36
First-order mode
Second-order modeFourth-order mode
Fifth-order modeSixth-order mode
Third-order mode
MAC verification
Figure 18 Natural frequency and modal shapes of the chassis frame
Table 8 Time-domain comparison of vibration intensity under various working conditions
Measuring pointRoot mean square value of vibration acceleration (ms2)
Working condition 1 Working condition 2 Working condition 3 Working condition 4X Y Z X Y Z X Y Z X Y Z
1 057 074 055 283 215 536 213 389 589 437 496 9362 062 082 087 247 271 423 345 283 403 412 558 5683 084 102 105 206 201 235 350 364 901 459 517 10084 068 079 098 287 323 389 267 917 644 332 997 1225
Condition 1 Condition 2 Condition 3 Condition 41
23
4
15
10
5
0
Acce
lera
tion
(ms
2 )
Working condition
Measurin
g poin
t
Figure 19 Root mean square value of vibration acceleration under various working conditions
18 Mathematical Problems in Engineering
condition showed that the chassis frame had the largestamplitude in the Z-direction (vertical direction) when itwas forced to vibrate which was the loading direction of
the chassis frame relative to each excitation source Inaddition the whole machine had a frequency of 2036120654 Hz that was not available when it was at no load
Table 10 Main frequencies and amplitudes under static no-load conditions (components working small throttle)
Measuringpoint
Peaknumber
X-direction Y-direction Z-direction
Frequency (Hz) Amplitude(mlowast sminus 2)
Frequency(Hz)
Amplitude(mlowast sminus 2)
Frequency(Hz) Amplitude (mlowast sminus 2)
11 4875 0937 4875 1159 2438 09482 2438 0823 9063 1088 5063 04383 9063 0796 24188 0862 725 0390
21 4813 1504 2438 0430 4813 09142 5125 0985 725 0272 2438 08433 2438 0654 9625 0245 5125 0370
31 4875 1318 4875 0468 4875 17942 2438 0546 2438 0378 2438 07923 7313 0490 9063 0264 7313 0399
41 4875 1334 7313 0834 2438 10832 2438 0567 9688 0828 4875 08183 725 0466 2438 0795 19438 0689
Frequency (Hz)
PeakX01 91797 1023
07640706067405340454
4492231251757876172150391
0203040506
Y
00
045
075
105
4 32
5
1
6
15
77734 155469 233203 310938 388672
Acce
lera
tion
(ms
2 )
Figure 20 FFT of the response of the front left measurement point of the chassis frame
Table 9 Root mean square acceleration of the total vibration of each measuring point under each working condition
Measuringpoint
Working condition 1(mlowast sminus 2)
Working condition 2(mlowast sminus 2)
Working condition 3(mlowast sminus 2) Working condition 4 (mlowast sminus 2)
1 063 371 426 6622 078 323 347 5183 097 215 596 7064 083 336 665 932
Mathematical Problems in Engineering 19
and there were many side frequencies near it whichshowed that these two frequencies may be the resonancefrequency of a structure
4 Conclusions
(1) According to the action mode and force of theexisting working parts of combine harvester on thechassis frame it was statically calculated -e resultsshowed that when the combine was fully loaded themaximum bending moment of all the load beamsappeared on one of the load beams of the grain box-e maximum bending moment wasMmax 229808Nm and it was located at a crosssection of the load beam with a distance of 161mfrom the left end boundary In addition stress checkwas carried out on the dangerous position-e stressvalue at this point was the maximum stress point ofthe entire chassis frame and its maximum normalstress σmax 991MPalt [σ] which met the re-quirements of Q235 material indicating that thedesigned chassis had the ability to carry the mainworking components of the entire machine
(2) -e first 6 natural frequencies of the chassis framewere within the working frequency range of multiplevibration sources on the combine harvester andthere was more overlap between the 20ndash25Hz and40ndash45Hz intervals It may cause complex vibrationcoupling and resonance resulting in severe vibrationof the fuselage when the whole machine wasworking Furthermore it would cause fatiguedamage to key components and greatly reduce thelife of the combine harvester
(3) -e vibration of the chassis frame was the smallestwhen the engine was working only When theworking components of the whole machine wereworking the vibration of the chassis frame at the rearright was the most intense Considering the fact thatthere was still alternating excitation force generatedby threshing in the threshing drum during actualwork the support frame at this position should befurther strengthened to improve the reliability of thelong-term operation of the chassis frame therebyimproving the working reliability of the wholemachine
Table 12 Main frequency and amplitude under driving conditions (components working machine walking)
Measuringpoint
Peaknumber
X-direction Y-direction Z-directionFrequency
(Hz)Amplitude(mlowastsminus 2)
Frequency(Hz)
Amplitude(mlowastsminus 2)
Frequency(Hz) Amplitude (mlowastsminus 2)
11 18066 1230 15820 2551 1514 08612 7813 1063 20361 1328 732 08093 9033 0823 17481 0959 20654 0783
21 18066 1214 27197 1082 9033 22572 9082 1168 25732 1025 23291 12433 7813 1035 18115 0873 20557 1087
31 18115 2227 27148 0926 9082 76322 9082 1691 781 0914 18115 39033 781 0751 20410 0712 27197 1262
41 18115 0838 20410 4724 18115 60272 9033 0772 15869 3508 20361 34333 4541 0651 23242 3273 23340 2473
Table 11 Main frequencies and amplitudes under static no-load conditions (components working big throttle)
Measuringpoint
Peaknumber
X-direction Y-direction Z-directionFrequency
(Hz)Amplitude(mlowast sminus 2)
Frequency(Hz)
Amplitude(mlowast sminus 2)
Frequency(Hz) Amplitude (mlowast sminus 2)
11 15 13002 15 1179 813 35702 813 12842 813 8988 290 33103 2438 9832 17125 767 29813 2518
21 9188 1023 9188 2173 688 14972 4492 0764 688 1021 813 11203 3125 0706 18375 0707 9188 0959
31 9188 1399 9188 2087 9188 38162 4625 0626 688 0780 813 07773 688 0556 20 0649 27625 0772
41 9188 2322 9188 2698 17938 25682 688 1159 688 1353 17125 22523 4625 0844 20 0907 16313 2072
20 Mathematical Problems in Engineering
(4) When the whole machine was moving in the fieldand all parts were working the vibration amplitudeof the chassis frame was the largest -e horizontalvibration of the threshing drum the reciprocatingmotion generated by the vibrating screen and thevertical vibration generated by the engine were themain vibration sources of the combine harvester inthe three directions of X Y and Z Besides eachworking condition showed that the chassis frame hadthe largest amplitude in the Z-direction (verticaldirection) when it was forced to vibrate and thisdirection was the loading direction of the chassisframe relative to each excitation source
Data Availability
-e data used to support the findings of this study areavailable from the corresponding author upon request
Conflicts of Interest
-e authors declare that they have no conflicts of interest
Acknowledgments
-is research work was supported by the Natural ScienceFoundation of Jiangsu Province (BK20170553) NationalNatural Science Foundation of China (51705212) JiangsuProvince ldquoSix Talents Peakrdquo High-level Talent Project(GDZB-085) Open Fund of Jiangsu Key Laboratory ofAgricultural Equipment and Intelligent High Technology(JNZ201912) and Jiangsu Province Postgraduate Researchand Innovation Project (KYCX20_3086)
References
[1] A M Parker A Proctor R L Eason and V Jain ldquoEffects ofrice harvest moisture on kernel damage and milled ricesurface free fatty acid levelsrdquo Journal of Food Science vol 72pp 10ndash15 2007
[2] Z Tang Y Li X Li and T Xu ldquoStructural damage modes forrice stalks undergoing threshingrdquo Biosystems Engineeringvol 186 pp 323ndash336 2019
[3] Z Tang M L Wang H T Zhang Y P Zhou and Y LildquoVariation and modal characteristic of tangential threshingcylinder undergoing threshing dynamicsrdquo MathematicalProblems in Engineering vol 2020 Article ID 172389315 pages 2020
[4] Z Tang H T Zhang H Zhang et al ldquoDevelopments ofcrawler steering gearbox for combine harvester straight for-ward and steering in siturdquo International Journal of Agricul-tural and Biological Engineering vol 13 no 1 pp 120ndash1262020
[5] R Prasad Y S Shivay and D Kumar ldquoCurrent statuschallenges and opportunities in rice productionrdquo Rice Pro-duction Worldwide vol 2 pp 1ndash32 2017
[6] Z Tang X Li X Liu H Ren and B Zhang ldquoDynamicbalance method for grading the chain drive double threshingdrum of a combine harvesterrdquo Applied Sciences vol 10 no 3pp 1026ndash1046 2020
[7] Z W Liang Y M Li and L Z Xu ldquoGrain sieve loss fuzzycontrol system in rice combine harvestersrdquo Applied Sciencesvol 9 no 1 2018
[8] P Li and H Xu ldquoBraking efficiency and stability of chassisbraking system of combine harvester the theoretical deri-vation and virtual prototype simulationrdquo MathematicalProblems in Engineering vol 2019 Article ID 671323118 pages 2019
[9] Z Tang X Y Li X D Chen and Y Chen ldquoDesign of negativepressure spiral feeding device for tangential and longitudinalaxial intersection of combine harvesterrdquo Advances in Mate-rials Science and Engineering vol 2019 Article ID 164723012 pages 2019
[10] Z Tang H T Zhang and Y P Zhou ldquoUnbalanced vibrationidentification of tangential threshing cylinder induced by ricethreshing processrdquo Shock and Vibration vol 2018 Article ID4708730 14 pages 2018
[11] C L Li S C Yin X P Jin E R Mao X H Lou andZ H Song ldquoRapid design of powertrain in wheeled combineharvester chassis based on knowledgerdquo Applied Mechanicsand Materials vol 472 pp 516ndash521 2014
[12] D F Hu and Y P Du ldquoStrength analysis of corn combineharvester chassisrdquo Applied Mechanics and Materialsvol 644ndash650 pp 489ndash492 2014
[13] P Vijaykumar and R I Patel ldquoStructural analysis of auto-motive chassis frame and design modification for weightreductionrdquo International Journal of Engineering Research andTechnology vol 1 no 3 2012
[14] N S Nagaraju M V Kumar and U Koteswarao ldquoModelingand analysis of an innova car chassis frame by varying crosssectionrdquo International Journal of Engineering Research andTechnology vol 2 pp 1ndash12 2013
[15] Z Tang H Ren X Li X Liu and B Zhang ldquoStructure designand bearing capacity analysis for crawler chassis of ricecombine harvesterrdquo Complexity vol 2020 Article ID7610767 15 pages 2020
[16] Z Chen T Wang F Gu and R Zhang ldquoCharacterizing thedynamic response of a chassis frame in a heavy-duty dumpvehicle based on an improved stochastic system identifica-tionrdquo Shock and Vibration vol 2015 Article ID 37408315 pages 2015
[17] Y Jiang Y Liao C Qin Z Guan and Q Liao ldquoVibrationanalysis and improvement for frame of 4SY-29 typed rapewindrowerrdquo Transactions of the Chinese Society of Agricul-tural Engineering vol 33 pp 53ndash60 2017
[18] S Ganesan and K Panneerselvam ldquoVibration reduction inconventional vehicles by increasing the stiffness on the chassisframerdquo Journal of Engineering and Applied Science vol 10pp 3384ndash3390 2015
[19] T T Yao and Y Zheng ldquoFinite element analysis of stressdeformation and modal of head cover in axial-flow hydro-turbinerdquo Journal of Drainage and Irrigation Machinery En-gineering vol 38 no 1 pp 39ndash44 2020
[20] A Xue Z G Li Z S Manuela T M Fideline and Y G YangldquoCharacterization of textural failure mechanics of strawberryfruitrdquo Journal of Food Engineering vol 282 Article ID 1100162020
[21] Z N Lai S Yang and P Wu ldquoSpeed-throttling combinedoptimization for high reliability in parallel centrifugal pumpsystemrdquo Journal of Drainage and Irrigation Machinery En-gineering vol 36 pp 1205ndash1210 2018
[22] Z Tang H T Zhang Y P Zhou and Y Li ldquoMutual in-terference and coupling response of multicylinder vibration
Mathematical Problems in Engineering 21
among combine harvester co-framerdquo Shock and Vibrationvol 2019 Article ID 1584391 14 pages 2019
[23] I Maciejewski T Krzyzynski and H Meyer ldquoModeling andvibration control of an active horizontal seat suspension withpneumatic musclesrdquo Journal of Vibration and Control vol 24no 24 pp 5938ndash5950 2018
[24] D Huang S Zhou and G Litak ldquoAnalytical analysis of thevibrational tristable energy harvester with a RL resonantcircuitrdquoNonlinear Dynamics vol 97 no 1 pp 663ndash677 2019
[25] Y Fang and T Zhang ldquoModeling and analysis of electricpowertrain NVH under multi-source dynamic excitationrdquoSAE Technical Paper vol 1 p 2870 2014
[26] Z Y Xie Q D Zhou and Y C Pan ldquoSimulation and tests forvibration of structures under multi-point complex loadsrdquoJournal of Vibration and Shock vol 37 pp 166ndash174 2018
[27] S Chen Y Zhou Z Tang and S Lu ldquoModal vibration re-sponse of rice combine harvester frame under multi-sourceexcitationrdquo Biosystems Engineering vol 194 pp 177ndash1952020
[28] K Lee ldquoLarge deflections of cantilever beams of non-linearelastic material under a combined loadingrdquo InternationalJournal of Non-linear Mechanics vol 37 no 3 pp 439ndash4432002
[29] S A Emam M A Eltaher M E Khater and W S AbdallaldquoPostbuckling and free vibration of multilayer imperfectnanobeams under a pre-stress loadrdquo Applied Sciences vol 8no 11 p 2238 2018
[30] J T Oden and J N ReddyVariational Methods inBeoreticalMechanics Springer-Verlag Berlin Germany 1976
[31] X H Wang Y Li H L Liu K Wang S H Wang andY Wang ldquoInfluence of geometrical parameters of vibrationdamping raft on vibration characteristics of marine centrif-ugal pumprdquo Journal of Drainage and Irrigation MachineryEngineering vol 37 no 11 pp 929ndash935 2019
[32] D Cao S Rakheja and C Y Su ldquoDynamic analyses of heavyvehicle with pitch-interconnected suspensionsrdquo InternationalJournal of Heavy Vehicle Systems vol 15 no 2ndash4 pp 272ndash308 2008
22 Mathematical Problems in Engineering
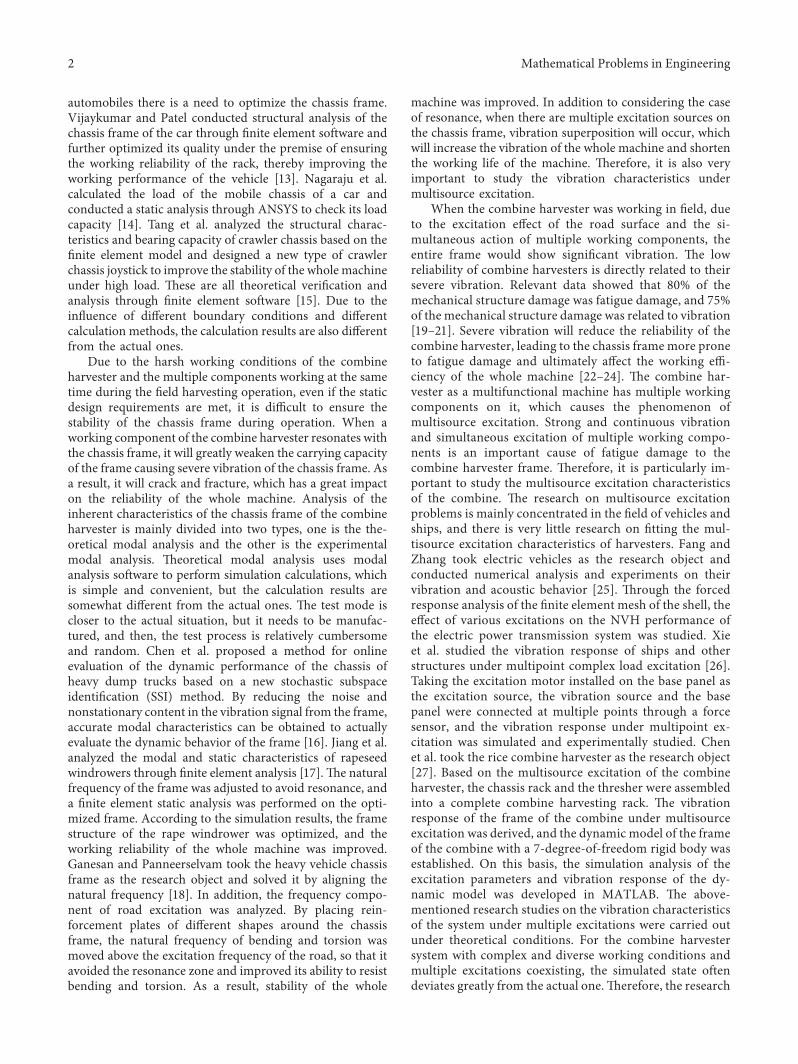

Cab
Cylinder
Thre
shin
g dr
um
Tank
Engine
Accumulator
Grain box
Figure 2 Schematic diagram of the stressed surface on the chassis of the crawler walking chassis
Table 1 Parameters of the main components of the combine harvester
Main components Grain box Cab Engine Fuel tank Cylinder -reshing drum AccumulatorQuality (kg) 1771 265 300 85 3594 1260 50Bearing area (m2) 0056 01760 00264 01350 00142 01585 00154Full-load pressure (MPa) 0309 00150 01040 00617 02480 00779 00319Allowable load (N) 208268 31164 3528 9996 422688 148176 588
Cylinder
Accumulator
Threshing drum
Fuel tank
Cab
Grain box
Figure 1 Schematic diagram of the location of each working component
Fs Fs
(ndash)(+)
FsFs
(a)
(+)M M
(ndash)M M
(b)
Figure 3 Symbol requirements for shear and bending moments in calculations (a) Symbol requirements for shear (b) Symbol re-quirements for bending moments
4 Mathematical Problems in Engineering
load pressure given in Table 1 the load concentrationq 5720 (Nm) can be obtained -e beam crosssection was 40times 60mm-e load-bearing conditionsare shown in Table 2
(4) -ere were four main load-bearing beams of the fueltank and the schematic diagram of its force is shownin Figure 2 From the parameters of the load-bearingarea and the pressure at full load in Table 1 the loadconcentration of the load-bearing beam of the oiltank can be obtained as q 3085Nm and thesimplified calculation diagram is shown inFigure 4(a) Both no⑨ and⑩beams were cantileverbeams and their analysis methods are similar -edifference was that there was still a fixed load onbeam no⑩ so the calculation method of beam no⑩ was slightly different from that of beams no ⑨⑪ and⑫ beams were simply supported beams andtheir analysis methods were the same as before
(5) -e force of the cylinder is shown in Figure 2 -ecross section of the beam was 40times 40mm -erewere two main beams and the position and area ofthe two beams were the same Only a part of eachbeam received a uniform load of 00024m2 From theparameters of the bearing area of the cylinder and thefull-load pressure given in Table 1 the load con-centration q 12400 (Nm) can be obtained -esimplified calculation diagram is shown inFigure 4(b)
(6) -e force of the accumulator was shown in Figure 2-e cross section of the beam was 40times 40mm Itsbearing method was the same as that of the cylinderso only one beam was needed to be analyzed Fromthe parameters of the accumulator bearing area andfull-load pressure given in Table 1 the load
concentration q 7018 (Nm) can be obtained -ecalculation diagram is shown in Figure 4(b)
(7) -ere were four main load-bearing beams of thethreshing drum In addition to this there were twoauxiliary supporting beams -e schematic diagramof the force is shown in Figure 2 No⑭⑯ and⑰beams were simply supported beams all of whichwere subjected to uniformly distributed loads cov-ering the entire beam -eir restraint positions andmethods were the same the difference was that theirsizes were inconsistent beam no ⑮ was a staticallyindeterminate continuous beam which can reducethe maximum bending moment beam no ⑱ wasalso a simply supported beam which was partiallydistributed -e calculation method of the shearforce and bending moment of beam no ⑭ ⑯ and⑰ was the same as the calculation method of thepreviously simply supported beams From the pa-rameters of the load-bearing area of the threshingdrum and the pressure at full load in Table 1 the loadconcentration of the load-bearing beam can be ob-tained as q 3895Nm
22 Design Parameters of the Chassis Frame -e chassisframe is composed of four main beams and five mainlongitudinal beams and auxiliary beams supporting othercomponents It is mainly determined according to thelayout of each assembly of the combine harvester and thequality of each component of the entire combine har-vester -e chassis frame was welded with square andrectangular tubes of different specifications such as30 times 30mm 40 times 40mm and 50 times 50mm Its thicknesshad 4 specifications of 2mm 3mm 4mm and 6mm andwas fixed and reinforced with a connecting plate -e
Table 2 Beams no ①sim⑧ stress situation
Position Beamnumber Type Segmentation Length
(m)Total length
L (m) Pivot Uniform load(Nm)
Grainbox
① Simply supported beam 2 segments (A-B B-C) A-B 151B-C 064 215 2 A C B-C 15490
② Simply supported beam 3 segments (A-B B-C C-D)A-B 045B-C 012C-D 008
065 2 A D B-C 15490
③ Simply supported beam 3 segments (A-B B-C C-D)A-B 045B-C 012C-D 008
065 2 A D B-C 15490
Cab
④ Simply supported beam 1 segment (A-B) A-B 031 031 2 A B A-B 750
⑤ Statically indeterminatecontinuous beam 2 segments (A-B B-C)
A-B0265B-C0335
060 3 A BC
A-B 750B-C 750
⑥ Simply supported beam 1 segment (A-B) A-B 060 060 2 A B A-B 750⑦ Simply supported beam 1 segment (A-B) A-B 073 073 2 A B A-B 750
Engine ⑧ Simply supported beam 5 segments (A-B B-C C-DD-E E-F)
A-B 135B-C 012C-D 023D-E 012E-F 029
211 2 AB B-C 5720D-E 5720
Mathematical Problems in Engineering 5
entire frame was 3807m long 2163m wide and 1036mhigh -e specifications and parameters of each rectan-gular tube in the frame are shown in Table 3
-e material of the main frame pipe material was Q235ordinary carbon structural steel and its material propertiesare shown in Table 4
-ematerial of the entire frame of the combine harvesterwas Q235the elastic modulus E was 196GPa the Poissonrsquosratio μ was 025 the safety factor was 12 and the density ofthe low alloy steel was 7850 kgm3
23 Indoor Test Modal of Chassis Rack
231 Test Mode of the Chassis Frame In order to study theresonance of the chassis frame of the combine harvester andthe excitation source of the whole machine under multi-source excitation the experimental modal test was carriedout on the designed frame -e modal test system is mainlycomposed of an excitation system a data acquisition systemand a modal analysis and processing system -e excitationsystem includes an excitation part and a vibration pickuppart -e excitation part is composed of a set of PCB forcehammer excitation devices and the vibration pickup part iscomposed of several three-way acceleration sensors andseveral data connection lines -e test procedure and testequipment of the chassis frame modal test are shown inFigure 5
According to the existing test conditions the hammerexcitation method was adopted in the modal test in thispaper -e sensors used in the test were PCB piezoelectricthree-way acceleration sensors with a permanent magnetbase which was easy to install and had less additional massto the main frame -e instrument parameters required forthe modal test of the chassis frame of the crawler combineharvester are shown in Table 5
In the modal test of the chassis frame the final resultsunder different constraints may be completely different -eframe of the combine harvester is always in a fixed constraint
state in the actual working conditions At the same time thechassis frame and the vibration sources are connected toeach other as a whole -e constraints added in this modaltest should try to restore the actual constraint state of thechassis frame and the support structure of the chassis framecan better reflect the actual situation -erefore the chassisframe can be placed on the ground for modal test -echassis rack was placed on the ground for testing as shownin Figure 6(a)
In this paper the multipoint excitation and multipointresponse methods are used to select two excitation points fortesting respectively and the reliability of the data is
q = 3085 Nm
q = 3085 Nm
MA
A B
A BXL
F
FRA
FRA FRB
Beam no calculation sketch10
Beam no calculation sketch11
(a)
Cylinder
Accumulator
q = 12400 Nm
L = 045 m
q = 7018 Nm
AFRAFRD
FRCFRA
B C D
A B C
(b)
Figure 4 Calculation diagram of bearing beam (a) Calculation diagram of fuel tank carrying beam (b) Calculation diagram of cylinder andaccumulator bearing beam
Table 3 Specification of the rectangular tube
Specification Wall thickness15lowast 15 06sim2025lowast 25 06sim3040lowast 40 10sim3518lowast 18 06sim2034lowast 34 10sim3550lowast 50 12sim4016lowast 16 06sim2030lowast 30 08sim3048lowast 48 12sim3520lowast 20 06sim2038lowast 38 10sim3560lowast 60 12sim4010lowast 20 06sim2020lowast 40 06sim3030lowast 40 08sim3540lowast 60 08sim4040lowast 100 12sim4050lowast 90 12sim4014lowast 20 06sim2020lowast 50 06sim3030lowast 50 08sim3540lowast 70 10sim4040lowast 120 12sim5050lowast 100 12sim40
6 Mathematical Problems in Engineering
guaranteed through two data acquisition and parameteridentification Generally the location of the excitation pointis selected as a position with greater rigidity on the structurewhich facilitates the transfer of excitation energy and fa-cilitates manual percussion -e measurement points aremainly distributed at the key parts and connection points ofthe chassis frame and the shaft end of each main vibrationsource -e chassis frame model designed in this paper isshown in Figure 6(b) which was needed to be simplified in
the modal test During the test 25 chassis were arranged onthe chassis frame as shown in Figure 6(c)-e distribution ofeach measuring point can reflect the structural character-istics of the chassis frame and two excitation points wereselected on the chassis frame to provide horizontal andvertical excitation forces respectively
During the modal test the two excitation points (hor-izontal and longitudinal) were respectively struck with ahammer to provide excitation force to make the frame
Table 4 Material properties of the combine harvester frame
Density(ρgmiddotcm3)
Elasticmodulus(GPa)
Poissonrsquosratio μ
Yield strengthσs (MPa)
Expansion rateδ ()
Allowable shearstress (τT) (MPa)
Allowable bendingstress (σ minus1) (MPa)
Extrusionstrength σbs
(MPa)
785 196 025 225 24 15sim25 40 120sim150 (staticload)
Hammer Chassis rack Three-way acceleration sensor
DH5902 data acquisition instrument
Curve fitting and modal parameter fitting
Frame natural frequency and mode shape
Objective
Modal analysis andprocessing system
Data collection system
Excitation Measuring toolsIncentive
system
Figure 5 Flow chart of modal test and test equipment
Table 5 Equipment and its parameters required for the modal test
Serialnumber Device name Model Manufacturer Main parameters
1 Exciting hammer 086D05 PCB Sensitivity 10mV1 bf range plusmn5001bf pk2 Nylon hammer head 086D05 086D05 Sensitivity 02374mvN
3 Accelerometer 356A16 PCB Quantity 4 sensitivity 100mVmiddotgminus1 frequency response 03ndash6 kHzrange plusmn50 g pk lateral sensitivity lt5
4 Signal acquisitioninstrument DH5902 DongHua test Quantity 1 number of channels 36 sampling bandwidth 16100 kHz
end scale value plusmn20mvsimplusmn20V5 Computer -inkPad Lenovo mdash
(a) (b)
Incentive point
(c)
Figure 6 Chassis frame modal test (a) Chassis frame modal test scene (b) 3D drawing of chassis frame (c) Modal test model
Mathematical Problems in Engineering 7
generate forced vibration -e vibration response signal ofeach measuring point under the excitation force was col-lected by three-directional acceleration sensors arranged onthe frame After setting the sensor parameters the signal wassampled -e excitation point is hit with a hammer and thefrequency response function pulse force signal and co-herence function of each measuring point were displayed onthe signal acquisition instrument -e validity of the datawas judged by the coherence function frequency responsefunction and pulse force signal at each excitation -emeasured frequency response function can be imported intothe modal analysis software to obtain the inherent propertiesof the frame structure
232 Parameter Identification Process and VerificationMethod of the Frequency Response Curve -e parameteridentification of the frequency response curve is an im-portant step of experimental modal analysis After the fre-quency response function of each measuring point wasmeasured by the sensor a certain parameter identificationmethodmust be used to determine the inherent properties ofthe structure [19]-e operation status of the equipment canbe monitored through modal parameter identification -efrequency domain law relies on frequency response func-tions for modal parameter identification
-is test adopted the frequency domain modal param-eter identification method which was carried out in twosteps-e first step was to use the acceleration sensor of eachmeasuring point to collect the acceleration time-domainsignal transmitted from the excitation point and convert thetime-domain signal into the frequency response of eachmeasuring point function curve the second step performedparameter identification on the obtained frequency responsefunction curve and extracted the modal parameters of thestable structure it contained Common modal parameteridentification methods include the Polylscf method peakextraction method least square method global polynomialfitting method admittance circle method and complexexponential fitting method In this test the Polylscf methodwas used to identify the parameters of the chassis frameWhen the various modes of the chassis frame were obtainedafter parameter identification it was required to verifycorrectness by using MAC criteria -e modal decisioncriterion (MAC) represents the degree of correlation be-tween two sets of modal vectors-e closer the value ofMACis to 1 the more completely correlated are the two sets ofmodal vectors that is the mode shapes are consistent
24 Vibration Test of the Chassis Frame of the CombineHarvester under Multiple Working ConditionsConsidering that there were multiple excitation sources onthe combine harvester even after the analysis and test of thetest modal it was impossible to fully determine the stabilityof the combine harvester when it is installed and working-e excitation of the vibration sources such as the shearingroller longitudinal axial roller engine conveyor trough fanreturn plate and vibrating screen on the combine harvesterare all acting on the frame of the crawler combine harvester
and then transmitted to the whole machine through theframe -erefore the actual whole machine vibration testneeded to be carried out on the designed chassis frame -echassis frame was installed after the static and modal tests onthe combine harvester and the corresponding vibration testwas performed when the whole machine was working -etime-domain comparative analysis of the vibration intensityof the chassis frame of the combine harvester under differentworking conditions and the actual vibration response of thechassis frame under multiple working conditions were an-alyzed to verify its reliability
241 Time-Domain Response Test of the Chassis Frameof the Combine Harvester under Multiple WorkingConditions -e instrument used for the vibration test ofthe chassis frame was still the DH5902 vibration test andanalysis system Considering the accelerometer has a largefrequency response range and high sensitivity it is suit-able for the collection of test signals of the combineharvester [31 32] -erefore the types of sensors usedwere exactly the same used in the modal test Differentfrom the modal test there were differences in the analysismodules used in the test During the test four mainmeasuring points were arranged on the chassis frame ofthe combine harvester which were distributed on the leftfront left rear right front and right rear of the chassisframe -e specific installation method and measurementdirection are shown in Figure 7
-e test was carried out in the test field In actual usethe driver would selectively adjust the throttle or trans-mission path of the combine harvester more or less due toexternal factors such as different grains different roadtopography and different uses -erefore the wholemachine needed to continue to work under the combi-nation of several usage factors and different combinationsdetermine the engine speed so the speed of each com-ponent and the transmission path was different -e vi-bration analysis of the single working condition of thecrawler combine harvester can only partially reflect itsvibration characteristics In order to analyze the reliabilityof the designed chassis frame a total of 4 working con-ditions were analyzed in the static idle load of the wholemachine (only the engine works small throttle) thecomplete machine walks (only the engine works) thestatic idle load of the whole machine (component worksmall throttle) and the complete machine (componentwork) -e vibration data of each working condition areanalyzed and compared and its vibration in the timedomain is tested to analyze its reliability on the wholemachine
242 Vibration Characteristics Test of the Chassis Frameunder Multisource Excitation -e main vibration sourceson the combine harvester include the engine roller fanreturn plate vibrating screen and transmission mechanism-e engine is the main vibration source of the combine -eexcitation to the outside world comes from the periodicthrust generated by the combustion of high-temperature and
8 Mathematical Problems in Engineering
high-pressure gas in the engine and the unbalanced inertialforce of the movement of the crank connecting rodmechanism -is test used a vertical inline 4-cylinder 4-stroke diesel engine -e idling speed was 1500 rmin underthe condition of small throttle the rated speed was 2700 rmin and the ignition order was mainly 2nd order -ecalculation is shown as follows
f n
60times
c
2 (3)
where f is the engine ignition frequency Hz c is thenumber of engine cylinders and n is the engine speed rrpm -e engine rotated at 1500 rmin under idle throttleconditions so the calculated firing frequency was 50 Hzand the engine speed at 2700 rmin under high throttleconditions was 90 Hz that is the operating frequency ofthe engine under the conditions of small throttle andlarge throttle In addition to the engine the gearbox hadtwo speeds input and output -e engine input power tothe gearbox through HST (Hydraulic Smooth Trans-mission) as its input speed which was 3000 rmin and itsfundamental frequency was 50 Hz -e output shaft of thegearbox was connected to the pulley inside the trackTaking into account that the walking speed of thecombine harvester was very low the frequency was lowgenerally 1sim5Hz Besides the remaining excitationsources on the combine harvester also included workingcomponent excitation -e main excitation source pa-rameters are shown in Table 6
During the test excitation of the chassis frame bymultiple working components of the combine harvester wasmainly considered Even after the analysis of test modal itwas impossible to determine whether the chassis frame willresonate when the combine harvester was working -ere-fore it was necessary to test its vibration response whenmultiple components were working at the same time mainlyincluding three working conditions ① -e whole machinewas at no load all components were working and the enginewas in the state of small throttle②-e whole machine wasat no load all components were working and the engine wasin the state of large throttle ③ -e whole machine was
walking in the field all components were working and theengine was in the state of large throttle -e test site was thesame as the chassis frame time-domain vibration test siteand all the test points and sensors and instruments used werethe same
3 Results and Discussion
31 Analysis of the Carrying Capacity of the Chassis Frame-e chassis frame adopted a three-layer structure in whichthe upper frame was mainly used to carry the weight of thecab-e purpose of using the frame structure was to increaseits contact area with the cab so that the force was uniformand the stability of the structure was enhanced -e framecan also be used to place hydraulic oil tanks and arrange thepositions of components reasonably -e middle layer of theframe wasmainly used to support various components of thechassis and the grain box engine etc It is formed by weldingrectangular steel with different thicknesses -e lower framewas connected to the crawler walking system and itsstructure is shown in Figure 2 -e middle layer was the corepart of the entire chassis frame carrying the weight of thecombine harvesterrsquos fuel tank grain box engine cabconveyor trough thresher header and battery -ereforethe horizontal beams in the horizontal direction were mainlyused for supporting and strengthening during design -efront was the load-bearing part of the cab engine headerconveyor trough and part threshing device and the stressconditions were complex -erefore three vertical beamsand three triangular beams were added in the vertical di-rection to strengthen the connection which were welded bya beam connected to the lower frame
311 Grain Box Beam no ① according to the staticbalance equation
FRA + FRC qL (4)
1113944 MA 0 (5)
2 1
34
X direction front and back vibration of the frameY direction left and right vibration of the frameZ direction vertical vibration of the frame
Measuring point 1 rear left of the chassis frameMeasuring point 2 left front of the chassis frameMeasuring point 3 right front of the chassis frameMeasuring point 4 right rear of the chassis frame
1
Figure 7 -e arrangement of the chassis rack test sensors
Mathematical Problems in Engineering 9
We bring the data into the equation to get the reactionforce FRA 14755N and FRC 84381N -e shear forcediagram and bending moment diagram obtained by cal-culation are shown in Figures 8(a) and 8(b)
It can be seen from the curve of the bending momentexperienced by the no① beam that the maximum bendingmoment occurred at x 161m -at is the position wherethe bending failure was most likely to occur when it wasloaded was within the BC section and the bending momentexperienced here was 229808Nm
According to the stress state of beam no ② and ③relevant statics analysis was carried out According to thestatic balance conditions it was mainly divided into threeparts A minus B B minus C andC minus D which were analyzedseparately
Bringing the data into equations (4) and (5)FRA 4004N and FRC 14584N From the static balanceequation the shear diagram and bending moment diagramof beam no ② and ③ can be obtained as shown inFigures 9(a) and 9(b)
It can be drawn from Figure 9 that the maximumbending moment of beam no ② and ③ appeared atx 0476m and the maximum bending moment was1854Nm It can be seen from the abovementioned
calculations that the maximum bending moment of theload-bearing beam of the grain box occurred at beam no①shown in Figure 8 at a distance of 161m from the left endboundary and the maximum bending moment was229808Nm
312 Cab Beam no④ since the load and restraint force onthe beam were symmetrical to the midpoint of the spanaccording to the static balance condition
FRA FRB 12
qL (6)
According to equation (6) FRA FRB 11625 (N)Beam no⑥ and⑦ the stress modes of these two beams
and the position of the fixed support were the same as thoseof beam no④ so the calculation diagrams of the three wereconsistent Due to the different sizes of the three their re-spective bending moments and shear forces were also dif-ferent -e shear force diagram and bending momentdiagram obtained from the shear force equation and bendingmoment equation are shown in Figure 10 Figure 10(a) is theshearing force diagram of the three beams and 10(b) is thebending moment diagram of the three beams It can be seen
Table 6 Main vibration source parameters of the combine harvester
Main excitation sources Rotational speed (rpm) Vibration frequency (Hz)Engine 2700 90Gearbox 3000 5000Countershaft 1425 2375Tangential threshing 680 1133Cutter drive shaft 425 708Longitudinal axial roller speed 760 1267Cross axle driving shaft speed 500 833Fan speed 1550 2583Vibrating screen 430 717Conveyor drive shaft 500 83
Shea
r for
ce (N
)
Length of the beam (m)0 05 1 15 2 25
ndash10000
ndash8000
ndash6000
ndash4000
0
2000
ndash2000
A
x 151y 14755
x 215y ndash8438
y = ndash15490x + 248654
B
C
Section A-B shear curveSection B-C shear curve
(a)
Bend
ing
mom
ent (
Nm
)
Length of the beam (m)0 05 151 2 25
0
500
1000
1500
2000
2500
x 215y 0
x 161y 229808
x 151y 2228
y = 14755x
y = ndash7745x2 + 248654x ndash 176594
Peak
C
A
B
A-B bending moment variation curveB-C bending moment variation curve
(b)
Figure 8 Beam no ① bearing shear and bending moment diagram (a) Beam no ① shear diagram (b) Beam no ① bending momentdiagram
10 Mathematical Problems in Engineering
from Figure 10 that the maximum bending moments ofbeam no④⑥ and⑦ were located at the midpoint of thebeam and the maximum bending moments were 901Nm3375Nm and 4996Nm respectively
Beam no ⑤ the beam was a statically indeterminatecontinuous beam Among them the shear force at the end ofsection A was Fs1 qL1 20625 (N) the shear force at theleft section of point B was Fs2 minus20625 (N) the shear forceat the right section of point B was Fs3 qL2 24375 (N)the shear force at section C was Fs4 minus24375 (N)-e shearforce diagram and bending moment diagram were obtainedas shown in Figures 11(a) and 11(b)
Compared with the statically indeterminate structurethe maximum value of the bending moment can be greatly
reduced It can be seen from Figure 11(b) that the maximumbending moment was 1052Nm Based on the above-mentioned calculations and graphics it can be seen thatamong all the load-bearing beams in the cab the maximumbending moment occurred at the midpoint of beam no ⑦shown in Figure 10(b) and the maximum bending momentwas 4996Nm
313 Engine According to the static balance conditionFRA + FRF qL1 + qL2 1113936 M 0 Substitute data can becalculated as FRA 3464N andFRF 10264N Accordingto the load conditions and calculation results of each sectionthe shearing force diagram and bending moment diagram of
Shea
r for
ce (N
)
Length of the beam (m)0 01 02 04 05 06 0703
ndash1500
ndash1000
ndash500
0
500
A Bx 045y 4004
x 057y ndash1458
C D
y = ndash15490lowastx + 73709
Section A-B shear curveSection B-C shear curveSection C-D shear curve
(a)
Bend
ing
mom
ent (
Nm
)
Length of the beam (m)0 01 02 04 05 06 0703
0
50
100
150
200
A
y = 4004x
x 045y 1802
x 057y 1167
Peakx 0476y 1854
y = ndash7745x2 + 73709x ndash 15684
y = ndash14584x + 94796
B
C
D
A-B bending moment variation curveB-C bending moment variation curveC-D bending moment variation curve
(b)
Figure 9 Beams no② and③ bearing shear and bending moment diagram (a) Beam no② and③ shear diagram (b) Beam no② and③bending moment diagram
Shea
r for
ce (N
)
Length of the beam (m)0 01 02 04 05 06 0703 08
ndash300
ndash200
ndash100
0
100
200
300
y = ndash750x + 11625
y = ndash750x + 225
y = ndash750x + 27375
x 031y ndash1163
x = 06y = ndash225
x = 073y = 27375
Beam no 4 shear curveBeam no 6 shear curveBeam no 7 shear curve
(a)
Bend
ing
mom
ent (
Nm
)
Length of the beam (m)0 01 02 04 05 06 0703 08
0
10
20
30
40
50
60
70
x 0155y 901
x 03y 3375
y = ndash375x2 + 27375x
y = ndash375x2 + 11625x
y = ndash375x2 + 225x
x 0365y 4996
Beam no 4 bending curveBeam no 6 bending curveBeam no 7 bending curve
(b)
Figure 10 Beam no④⑥ and⑦ bearing shear and bendingmoment diagram (a) Beam no④⑥ and⑦ shear diagram (b) Beam no④⑥ and ⑦ bending moment diagram
Mathematical Problems in Engineering 11
the engine bearing beam were drawn -e results are shownin Figure 12 Figures 12(a) and 12(b) are the shear forcediagram and bending moment diagram of beam ⑧respectively
It can be seen from Figure 12 that the maximum bendingmoment of the engine load beam was at x 141m wherethe maximum bending moment was 478128Nm
314 Fuel Tank -ere was a fixed load on beam no⑩ andthe size was F 77125N acting at x 041m From theequilibrium conditions M(A) 107204Nm andF(A) 293075NM (A) was the bending moment at pointA and F(A) was the large shear force at point A -e shearforce and bending moment changes of beam no ⑨ and ⑩are put together for comparative analysis to find the changeof shear bending moment -e results are shown in Fig-ure 13 where (a) and (b) are the shear force diagram andbending moment diagram they were subjected to
It can be seen from Figure 13(b) that the two cantileverbeams had the largest bending moment at the left end thatis the welding point-e bending moments were 755825Nm and 102404Nm respectively
According to the static balance conditionFA FB (12)qL 77125N From this the shear forceand bending moment of beam no⑪ and⑫ can be obtainedas shown in Figure 14 where (a) and (b) are the shear forcediagram and bending moment diagram for themrespectively
Based on the analysis and calculation of all the above-mentioned fuel tank parts it can be seen that the ⑪ beam(cantilever beam) shown in Figure 14(b) was the load-bearing beam with the largest bending moment and themaximum bending moment was 107204Nm In particularthe position of the beam with the largest bending momentwas at the left end welding place where the section was adangerous section
315 Cylinder From the static balance conditionFA + FD qL 1113936 MA 0 -e support force FA 2169Nand FD 3783N can be obtained from this On this basis itcan be obtained that the shear force and bending momentare shown in Figure 15 where (a) and (b) are the shear forcediagram and bending moment diagram respectively
It can be seen from Figure 15 that the maximum bendingmoment of the cylinder load beam occurred at a section of028m from the lower end face and the maximum bendingmoment was 5872Nm
316 Accumulator According to the static balance con-ditions FA 1501 N and FC 9553 N On this basis theshear force and bending moment can be obtained asshown in Figure 16 where (a) and (b) are the shear forcediagram and bending moment diagram they were sub-jected to
It can be known from the bending moment variationcurve in Figure 16(b) that the maximum bending momentoccurs at a distance of 021m from the lower end sectionand the maximum bending moment was 1605Nm
317 Breshing Drum -e calculation method of eachbearing beam of the threshing drum was the same as that ofthe same type of beam before -erefore the bendingmoment and the shear force of all the load-bearing beams ofthe threshing drum are shown in Figure 17 where (a) and(b) are the shear force diagram and bending moment dia-gram of beam no⑭⑯ and⑰ respectively (c) and (d) arethe shear force diagram and bending moment diagram ofbeam no⑮ and (e) and (f ) are the shear force diagram andbending moment diagram of beam no ⑱ respectively
As can be seen from the abovementioned images amongall the bearing beams of the threshing drum beam no ⑯
Shea
r for
ce (N
)
Length of the beam (m)0 01 02 04 05 0603
300
200
100
0
400
ndash300
ndash200
ndash100
A
B C
x 0265y 25875 x 060
y ndash24375
x 0265y ndash19125
y = ndash1500x + 65625
y = ndash1500x + 20625
Section A-B shear curveSection B-C shear curve
(a)
Bend
ing
mom
ent (
Nm
)
Length of the beam (m)0 01 02 04 05 0603
0
ndash5
5
10
15
A B C
x 0265y 0
x 04325y 1052
x 01325y 6583
y = ndash375x2 + 99375x y = ndash375x2 + 324375x ndash 5963
A-B bending moment variation curveB-C bending moment variation curve
(b)
Figure 11 Beam no⑤ beam bearing shear and bending moment diagram (a) Beam no⑤ beam shear diagram (b) Beam no⑤ bendingmoment diagram
12 Mathematical Problems in Engineering
was subjected to the maximum bending moment whichappeared at the midpoint of the beam with 486875Nm
After themechanical analysis and calculation of themainload-bearing beams (mainly shear force and bending mo-ment) it can be known that at full load the maximumbending moment of all load-bearing beams appeared on oneof the load-bearing beams of the grain box and the maxi-mum bending moment was recorded as Mmax From all theabovementioned data Mmax 229808Nm and it was
located at the cross section of beam no① 161m away fromthe left boundary
When the beam was bent by force the bending momentwould change with the position of the section Also ingeneral the maximum normal stress σmax occurred at thesection with the largest bending moment (dangerous sec-tion)-e cross section of the beam was a hollow rectangularsection -e calculation of the bending section coefficient ofthe hollow rectangle is shown in equation (7) and the
Shea
r for
ce (N
)
Length of the beam (m)0 01 02 04 05 06 0703
ndash3000
ndash2000
ndash1000
0
1000
2000
3000
4000
5000
A
B
C
x 041y 16659
x 041y 126485
y = ndash3085x
y = ndash3085x + 293075
y = ndash3085lowastx + 21595
Beam no 9 beam shear curveNo 10 section A-B beam shear curveNo 10 section B-C beam shear curve
(a)
Bend
ing
mom
ent (
Nm
)
ndash1200
ndash1000
ndash800
ndash600
ndash400
ndash200
0CB
A
x 041y ndash12972 Repeating part of
beam 9 and beam 10
y = ndash15425x2 + 21595x ndash 755825
y = ndash15425x2 + 293075x ndash 107204
Length of the beam (m)0 01 02 04 05 06 0703
Beam no 9 bending moment variation curveNo 10 section A-B bending moment variation curveNo 10 section B-C bending moment variation curve
(b)
Figure 13 Beams no⑨ and⑩ bearing shear and bendingmoment diagram (a) Beam no⑨ and⑩ shear diagram (b) Beam no⑨ and⑩bending moment diagram
Shea
r for
ce (N
)
Length of the beam (m)0
y = ndash5720x + 80684
x 147y ndash340
x 135y 3464
x 170y ndash340
x 182y ndash10264
x 211y = ndash5720x + 9384
05 1 2 25
1000
15
0
ndash1000
500
ndash500
1500
Section A-B shear curveSection B-C shear curveSection C-D shear curveSection D-E shear curveSection E-F shear curve
(a)Be
ndin
g m
omen
t (N
m)
x 212x 182
y = 3464x x 17x 135 y 46764
x 147 y 468644
y = ndash2860x2 + 80684x ndash 521235
y = ndash10282x+ 2179784
y = ndash340x + 968444
Peakx 141y 478128
Length of the beam (m)0 05 1 2 2515
0
200
400
600
800
1000
y = ndash2860x2 + 9384x ndash 7296956
A-B bending moment variation curveB-C bending moment variation curveC-D bending moment variation curveD-E bending moment variation curveE-F bending moment variation curve
(b)
Figure 12 Engine position bearing beam shear and bending moment diagram (a) Beam no⑧ shear diagram (b) Beam no ⑧ bendingmoment diagram
Mathematical Problems in Engineering 13
equation for calculating the stress during bending withtransverse force is shown in equation (8) [30]
WZ BH
3minus bh
3
6H (7)
σmax Mmax
WZ
le [σ] (8)
where H is the length of the quadrilateral outside therectangular tube h is the length of the quadrilateral in therectangular tube B is the width of the quadrilateraloutside the rectangular tube and b is the width of thequadrilateral in the rectangular tube it can be calculated
by bringing the data into equations (7) and (8) Wz
231803 (mm3) 232 times 10minus 6 (m3) and σmax 991MPa-e material of the beam is Q235 and the yield strengthof Q235 is 235MPa that is [σ] 235MPa -ereforeσmax 991MPalt [σ] which met the requirements ofQ235
32 TestModal Results andAnalysis -e first 6-order modalfrequencies damping ratios and mode shapes of the testmodes of the chassis frame can be obtained -e calculatedmodal frequency was checked by the Modal JudgmentCriterion (MAC) and the correlation between the modalfrequencies of each order was close to zero indicating that
Shea
r for
ce (N
)
Length of the beam (m)0 01 02 04 0503
ndash400
ndash300
ndash200
ndash100
0
100
200
300A
x 0262y 2619 x 031
y ndash3783
x 045y ndash3783
y = ndash12400x + 34657
B
C D
Section A-B shear curveSection B-C shear curveSection C-D shear curve
(a)
Bend
ing
mom
ent (
Nm
)
0
10
20
30
40
50
60
70
80
x 0262y 5683
y = 2169x
y = ndash6200x2 + 34657x ndash 425593
y = ndash3783x + 170235
A
B C
x 031y 5295
x 045y 0
x 028y 5872
Peak
D
Length of the beam (m)0 01 02 04 0503
Section A-B bending moment variation curveSection B-C bending moment variation curveSection C-D bending moment variation curve
(b)
Figure 15 Diagram of shear force and bending moment of cylinder bearing beam (a) Shear diagram of cylinder load beam (b) Bendingmoment diagram of cylinder load beam
Shea
r for
ce (N
)
Length of the beam (m)0 01 02 04 0503
ndash800
ndash600
ndash400
ndash200
0
200
400
600
800
x 0y 77125
x 05y ndash77125
y = ndash3085x + 77125
No 11 and no 12 beam shear curve
(a)
Bend
ing
mom
ent (
Nm
)
0
20
40
60
80
100
120
y = ndash15425x2 + 77125x
x 025y 96406
Peak
Length of the beam (m)0 01 02 04 0503
Beam no 11 and no 12 beam bending moment curve
(b)
Figure 14 Beams no⑪ and⑫ bearing shear and bendingmoment diagram (a) Beam no⑪ and⑫ shear diagram (b) Beam no⑪ and⑫bending moment diagram
14 Mathematical Problems in Engineering
Shea
r for
ce (N
)
ndash100
ndash50
0
50
100
150
200
Length of the beam (m)0 01 02 04 0503
A
B C
x 035y ndash9553
y = ndash7018x + 1501
x 045y ndash9553
Section A-B shear curveSection B-C shear curve
(a)
Bend
ing
mom
ent (
Nm
)
0
5
10
20
15
A C
B
x 02138y 1605
Peak
x 035y 9553
x 045y 0
y = ndash3509x2 + 15011x
y = ndash9553x + 4299
Length of the beam (m)0 01 02 04 0503
Section A-B bending moment variation curveSection B-C bending moment variation curve
(b)
Figure 16 Shear force and bendingmoment of the accumulator bearing beam (a) Shear diagram of accumulator bearing beam (b) Bendingmoment diagram of accumulator bearing beam
Shea
r for
ce (N
)
ndash2000
ndash1000
0
1000
2000
3000
Length of the beam (m)0 02 04 08 106
y = ndash3895x + 19745
y = ndash3895x + 17255
x 0886y ndash17255
x 0664y 133209
y = ndash3895x + 125419
x 1y 19205
Beam no 14 shear curveBeam no 16 shear curveBeam no 17 shear curve
(a)
Bend
ing
mom
ent (
Nm
)
200
0
400
600
800
1000
y = ndash19475x2 + 19475x y = ndash19475x2 + 17255x
y = ndash19475x2 + 129314
x 0443y 3822
x 05y 486875
x 0332y 2019 x 0664
x 0886
Length of the beam (m)0 02 04 08 106
Beam no 14 bending moment change curveBeam no 16 bending moment change curveBeam no 17 bending moment change curve
(b)
Figure 17 Continued
Mathematical Problems in Engineering 15
the calculated modal parameters were valid the verificationresults and the modal shapes of each order of the chassisframe are shown in Figure 18
-e modal analysis of the crawler-type combined har-vesting chassis frame test is shown in Table 7
It can be seen from the data in Table 7 that the first sixnatural frequencies of the chassis frame were between22ndash53Hz and the vibration modes were mainly bendingtorsion and local modes -e first-order natural frequencyof 2377Hz was close to the double frequency of the lon-gitudinal axial drum rotation frequency of 2534Hz and thefundamental frequency of the fan speed was 2583Hz whichmay produce complex vibration coupling and easily excitethe bending mode of the tank support beam -e fifth-ordernatural frequency of the chassis frame of 4538Hz was close
to the basic frequency of the engine at 45Hz at idle speed andlarge throttle which was easy to excite the bending mode ofthe fuel tank support beam
Considering that the frequency of each vibrationsource would be fluctuated during the field harvestingprocess of the combine harvester the fundamental fre-quency of each vibration source and its multiplier fre-quency cannot be calculated by only a certaininstantaneous speed -erefore it was more accurate andpractical to analyze and study the excitation frequency ofeach vibration source in a certain frequency range It canbe seen from Table 7 that the excitation frequency of eachvibration source on the combine was concentrated in twointerval sections of 20ndash25Hz and 45ndash50Hz -erefore inthese two interval sections the fundamental frequency or
Shea
r for
ce (N
)
ndash5000
ndash4000
ndash3000
ndash2000
ndash1000
1000
2000
3000
5000
4000
0
Length of the beam (m)0 05 1 215
A x 044y 24928
x 044y 24928
x 044y 24928
x 044y 24928
x 044 y 24928
BC
y = ndash7790x + 1092158
y = ndash7790x + 59204y = ndash7790x + 17138
D
Section A-B shear curveSection B-C shear curveSection C-D shear curve
(c)
Bend
ing
mom
ent (
Nm
)
Length of the beam (m)0 05 1 215
100
0
ndash50
50
150
200
250
350
400
300
x 022y 9426
x 076y 19942
x 01402y 2019
y = ndash19475(x ndash 044)(x ndash 108)
y = ndash19475(x ndash 108)(x ndash 1724)y = ndash19475x2 + 8569x
A
B C
D
Section A-B bending moment variation curveSection B-C bending moment variation curveSection C-D bending moment variation curve
(d)
Shea
r for
ce (N
)
Length of the beam (m)0 01 02 0403
ndash50
0
50
100
150
200
A
B
C D
x 0055y 14755
x 0105y ndash472
y = ndash3895x + 361775
Section A-B shear curveSection B-C shear curveSection C-D shear curve
(e)
Bend
ing
mom
ent (
Nm
)
Length of the beam (m)0 005 0350301 015 02 025
ndash8
ndash4
0
4
8
12
16
20
A
B
C
Dx 0055y 812
x 0093y 1093 033
y = ndash472x + 15576
y = ndash19475x2 + 362235x ndash 5933
y = 14755x
Section A-B bending moment variation curveSection B-C bending moment variation curveSection C-D bending moment variation curve
(f )
Figure 17 Shear force and bending moment of each bearing beam of the threshing drum (a) Beams no⑭⑯ and⑰ shear diagram (b)Beam no⑭⑯ and⑰ bendingmoment diagram (c) Beam no⑮ shear diagram (d) Beam no⑮ bendingmoment diagram (e) Beam no⑱ shear diagram (f ) Beam no ⑱ bending moment diagram
16 Mathematical Problems in Engineering
and its multiplier frequency of each vibration source maybe close to each other or even produce frequency couplingfurthermore the vibration of the whole machine couldalso reach a peak in these two frequency sections Inaddition the first 6-order natural frequencies of thechassis frame were within the operating frequency rangeof multiple vibration sources on the combine -ere wasmore overlap between 20ndash25Hz and 40ndash45Hz which maycause complex vibration coupling and resonance As aresult the whole machine vibrated violently during op-eration which can easily cause fatigue damage to keycomponents and greatly reduce the service life of thecombine harvester
33 Vibration of the Chassis Frame of the Combine Harvesterunder Multiple Operating Conditions
331 Time-Domain Vibration Characteristics of the ChassisFrame of the Combine Harvester under Multiple OperatingConditions After the tests the data collected from eachchannel of the sensors was processed by the DH vibrationtest analysis software -e working conditions during theanalysis mainly include the following four conditionsworking condition 1 whole machine static no load (only theengine worked small throttle) working condition 2 wholemachine walking (only the engine working) workingcondition 3 whole machine static no load (componentsworking small throttle) and working condition 4 the wholemachine walking (components working) -e data in alldirections were calculated and counted to obtain the time-domain average of the main vibration acceleration of thechassis frame in three directions-e specific data results areshown in Table 8 and Figure 19
In order to explore the vibration amount of the chassisframe under multiple working conditions considering theexistence of three directions of vibration at the samemeasuring point it was necessary to calculate the total rootmean square acceleration of each measuring point underdifferent working conditions in three directions -e rootmean square acceleration of the total vibration of themeasuring point in the rectangular coordinate system can becalculated by
av
a2x + a
2y + a
2z
3
1113971
(9)
From the vibration acceleration data in Table 8 the rootmean square acceleration of the total amount of vibration ofeach measuring point under various working conditions canbe obtained -e specific data results are shown in Table 9
From the vibration acceleration results of the sensorsin Tables 8 and 9 it can be seen that the vibration ac-celeration of the chassis frame was the smallest underworking condition 1 Under working condition 4 thevibration acceleration of the chassis frame was the largestthat meant that when the whole machine and eachcomponent was working the impact of each workingcomponent on the chassis frame was the largest In thiscondition the vibration of the chassis frame at the right
rear was severe which was the position of the threshingand cleaning working device -e main excitation di-rection at this position was in the Z-direction which wasthe carrying direction of the chassis frame Although thestatics had been checked before the design when thethreshing drum was actually working there would be alarge unbalanced excitation force due to the threshingwork Under the action of persistent unbalanced staggeredexcitation force it would cause the chassis frame toproduce periodic forced vibration here -erefore thesupport frame at this position should be furtherstrengthened to improve the long-term reliability of thechassis frame thereby improving the reliability of theentire machine
332 Vibration Characteristics of Chassis Frame underMultisource Excitation Taking the X-direction vibrationresponse of the front left measurement point of the chassisframe as an example the result of the vibration acceler-ation signal after being transformed by someone is shownin Figure 20 -e specific frequency amplitude of thecombine harvester under three working conditions of thestatic load of the complete machine (components work-ing small throttle) the static load of the complete ma-chine (components working large throttle) and the wholemachine walking (components working) is shown inTables 10sim12 Comparing the frequency of the main vi-bration source parameters of the combine harvester inTable 6 with the data in Table 10 it can be seen that themain frequency of vibration in each direction of themeasurement points was basically the second-order fre-quency doubling of the engine under the condition ofsmall throttle at idle speed and each order octave -evibration amplitude of the chassis frame near the bracketresponsible for carrying the engine was the largest in thelateral direction followed by the vertical direction Itcould be that the engine was installed on the chassis frameat an angle which caused the vertical excitation forcegenerated by the combustion torque of the engine todecompose in the lateral and vertical directions
By analyzing the four response points of the chassisframe it can be seen that the measurement point at theleft rear of the chassis frame had large amplitude at 15 Hzwhich may be the double frequency of the fundamentalfrequency of the driving shaft of the bridge or the driveshaft of the vibrating screen Since the vibrating screenstructure was a crank-slider mechanism when the vi-brating screen drive shaft worked the reciprocatingmotion of the slider would have a periodic impact on theframe resulting in large local amplitude of the chassisframe When the whole machine was moving in the fieldwith all working components working the vibrationamplitude of the chassis frame was the largest As theengine speed increased the excitation capacity of eachworking component connected to the engine on thewhole machine increased resulting in an increase in thefrequency component and amplitude of the measuringpoint on the chassis frame Among them each working
Mathematical Problems in Engineering 17
Table 7 Comparison of modal test and finite element calculation results
Researchobject Order
Modal test resultsDeviation ()Test frequency
(Hz)Damping ratio
() Mode shape
Chassis frame
1 2377 022 Fuel tank support beam bending 132 2891 047 Cab beam bending and torsion combination 283 3541 072 Fuel tank support beam bending 09
4 4244 016 Overall bending and twisting combination of chassisframe 85
5 4538 053 Fuel tank support beam bending 546 5262 058 Left beam bending 36
First-order mode
Second-order modeFourth-order mode
Fifth-order modeSixth-order mode
Third-order mode
MAC verification
Figure 18 Natural frequency and modal shapes of the chassis frame
Table 8 Time-domain comparison of vibration intensity under various working conditions
Measuring pointRoot mean square value of vibration acceleration (ms2)
Working condition 1 Working condition 2 Working condition 3 Working condition 4X Y Z X Y Z X Y Z X Y Z
1 057 074 055 283 215 536 213 389 589 437 496 9362 062 082 087 247 271 423 345 283 403 412 558 5683 084 102 105 206 201 235 350 364 901 459 517 10084 068 079 098 287 323 389 267 917 644 332 997 1225
Condition 1 Condition 2 Condition 3 Condition 41
23
4
15
10
5
0
Acce
lera
tion
(ms
2 )
Working condition
Measurin
g poin
t
Figure 19 Root mean square value of vibration acceleration under various working conditions
18 Mathematical Problems in Engineering
condition showed that the chassis frame had the largestamplitude in the Z-direction (vertical direction) when itwas forced to vibrate which was the loading direction of
the chassis frame relative to each excitation source Inaddition the whole machine had a frequency of 2036120654 Hz that was not available when it was at no load
Table 10 Main frequencies and amplitudes under static no-load conditions (components working small throttle)
Measuringpoint
Peaknumber
X-direction Y-direction Z-direction
Frequency (Hz) Amplitude(mlowast sminus 2)
Frequency(Hz)
Amplitude(mlowast sminus 2)
Frequency(Hz) Amplitude (mlowast sminus 2)
11 4875 0937 4875 1159 2438 09482 2438 0823 9063 1088 5063 04383 9063 0796 24188 0862 725 0390
21 4813 1504 2438 0430 4813 09142 5125 0985 725 0272 2438 08433 2438 0654 9625 0245 5125 0370
31 4875 1318 4875 0468 4875 17942 2438 0546 2438 0378 2438 07923 7313 0490 9063 0264 7313 0399
41 4875 1334 7313 0834 2438 10832 2438 0567 9688 0828 4875 08183 725 0466 2438 0795 19438 0689
Frequency (Hz)
PeakX01 91797 1023
07640706067405340454
4492231251757876172150391
0203040506
Y
00
045
075
105
4 32
5
1
6
15
77734 155469 233203 310938 388672
Acce
lera
tion
(ms
2 )
Figure 20 FFT of the response of the front left measurement point of the chassis frame
Table 9 Root mean square acceleration of the total vibration of each measuring point under each working condition
Measuringpoint
Working condition 1(mlowast sminus 2)
Working condition 2(mlowast sminus 2)
Working condition 3(mlowast sminus 2) Working condition 4 (mlowast sminus 2)
1 063 371 426 6622 078 323 347 5183 097 215 596 7064 083 336 665 932
Mathematical Problems in Engineering 19
and there were many side frequencies near it whichshowed that these two frequencies may be the resonancefrequency of a structure
4 Conclusions
(1) According to the action mode and force of theexisting working parts of combine harvester on thechassis frame it was statically calculated -e resultsshowed that when the combine was fully loaded themaximum bending moment of all the load beamsappeared on one of the load beams of the grain box-e maximum bending moment wasMmax 229808Nm and it was located at a crosssection of the load beam with a distance of 161mfrom the left end boundary In addition stress checkwas carried out on the dangerous position-e stressvalue at this point was the maximum stress point ofthe entire chassis frame and its maximum normalstress σmax 991MPalt [σ] which met the re-quirements of Q235 material indicating that thedesigned chassis had the ability to carry the mainworking components of the entire machine
(2) -e first 6 natural frequencies of the chassis framewere within the working frequency range of multiplevibration sources on the combine harvester andthere was more overlap between the 20ndash25Hz and40ndash45Hz intervals It may cause complex vibrationcoupling and resonance resulting in severe vibrationof the fuselage when the whole machine wasworking Furthermore it would cause fatiguedamage to key components and greatly reduce thelife of the combine harvester
(3) -e vibration of the chassis frame was the smallestwhen the engine was working only When theworking components of the whole machine wereworking the vibration of the chassis frame at the rearright was the most intense Considering the fact thatthere was still alternating excitation force generatedby threshing in the threshing drum during actualwork the support frame at this position should befurther strengthened to improve the reliability of thelong-term operation of the chassis frame therebyimproving the working reliability of the wholemachine
Table 12 Main frequency and amplitude under driving conditions (components working machine walking)
Measuringpoint
Peaknumber
X-direction Y-direction Z-directionFrequency
(Hz)Amplitude(mlowastsminus 2)
Frequency(Hz)
Amplitude(mlowastsminus 2)
Frequency(Hz) Amplitude (mlowastsminus 2)
11 18066 1230 15820 2551 1514 08612 7813 1063 20361 1328 732 08093 9033 0823 17481 0959 20654 0783
21 18066 1214 27197 1082 9033 22572 9082 1168 25732 1025 23291 12433 7813 1035 18115 0873 20557 1087
31 18115 2227 27148 0926 9082 76322 9082 1691 781 0914 18115 39033 781 0751 20410 0712 27197 1262
41 18115 0838 20410 4724 18115 60272 9033 0772 15869 3508 20361 34333 4541 0651 23242 3273 23340 2473
Table 11 Main frequencies and amplitudes under static no-load conditions (components working big throttle)
Measuringpoint
Peaknumber
X-direction Y-direction Z-directionFrequency
(Hz)Amplitude(mlowast sminus 2)
Frequency(Hz)
Amplitude(mlowast sminus 2)
Frequency(Hz) Amplitude (mlowast sminus 2)
11 15 13002 15 1179 813 35702 813 12842 813 8988 290 33103 2438 9832 17125 767 29813 2518
21 9188 1023 9188 2173 688 14972 4492 0764 688 1021 813 11203 3125 0706 18375 0707 9188 0959
31 9188 1399 9188 2087 9188 38162 4625 0626 688 0780 813 07773 688 0556 20 0649 27625 0772
41 9188 2322 9188 2698 17938 25682 688 1159 688 1353 17125 22523 4625 0844 20 0907 16313 2072
20 Mathematical Problems in Engineering
(4) When the whole machine was moving in the fieldand all parts were working the vibration amplitudeof the chassis frame was the largest -e horizontalvibration of the threshing drum the reciprocatingmotion generated by the vibrating screen and thevertical vibration generated by the engine were themain vibration sources of the combine harvester inthe three directions of X Y and Z Besides eachworking condition showed that the chassis frame hadthe largest amplitude in the Z-direction (verticaldirection) when it was forced to vibrate and thisdirection was the loading direction of the chassisframe relative to each excitation source
Data Availability
-e data used to support the findings of this study areavailable from the corresponding author upon request
Conflicts of Interest
-e authors declare that they have no conflicts of interest
Acknowledgments
-is research work was supported by the Natural ScienceFoundation of Jiangsu Province (BK20170553) NationalNatural Science Foundation of China (51705212) JiangsuProvince ldquoSix Talents Peakrdquo High-level Talent Project(GDZB-085) Open Fund of Jiangsu Key Laboratory ofAgricultural Equipment and Intelligent High Technology(JNZ201912) and Jiangsu Province Postgraduate Researchand Innovation Project (KYCX20_3086)
References
[1] A M Parker A Proctor R L Eason and V Jain ldquoEffects ofrice harvest moisture on kernel damage and milled ricesurface free fatty acid levelsrdquo Journal of Food Science vol 72pp 10ndash15 2007
[2] Z Tang Y Li X Li and T Xu ldquoStructural damage modes forrice stalks undergoing threshingrdquo Biosystems Engineeringvol 186 pp 323ndash336 2019
[3] Z Tang M L Wang H T Zhang Y P Zhou and Y LildquoVariation and modal characteristic of tangential threshingcylinder undergoing threshing dynamicsrdquo MathematicalProblems in Engineering vol 2020 Article ID 172389315 pages 2020
[4] Z Tang H T Zhang H Zhang et al ldquoDevelopments ofcrawler steering gearbox for combine harvester straight for-ward and steering in siturdquo International Journal of Agricul-tural and Biological Engineering vol 13 no 1 pp 120ndash1262020
[5] R Prasad Y S Shivay and D Kumar ldquoCurrent statuschallenges and opportunities in rice productionrdquo Rice Pro-duction Worldwide vol 2 pp 1ndash32 2017
[6] Z Tang X Li X Liu H Ren and B Zhang ldquoDynamicbalance method for grading the chain drive double threshingdrum of a combine harvesterrdquo Applied Sciences vol 10 no 3pp 1026ndash1046 2020
[7] Z W Liang Y M Li and L Z Xu ldquoGrain sieve loss fuzzycontrol system in rice combine harvestersrdquo Applied Sciencesvol 9 no 1 2018
[8] P Li and H Xu ldquoBraking efficiency and stability of chassisbraking system of combine harvester the theoretical deri-vation and virtual prototype simulationrdquo MathematicalProblems in Engineering vol 2019 Article ID 671323118 pages 2019
[9] Z Tang X Y Li X D Chen and Y Chen ldquoDesign of negativepressure spiral feeding device for tangential and longitudinalaxial intersection of combine harvesterrdquo Advances in Mate-rials Science and Engineering vol 2019 Article ID 164723012 pages 2019
[10] Z Tang H T Zhang and Y P Zhou ldquoUnbalanced vibrationidentification of tangential threshing cylinder induced by ricethreshing processrdquo Shock and Vibration vol 2018 Article ID4708730 14 pages 2018
[11] C L Li S C Yin X P Jin E R Mao X H Lou andZ H Song ldquoRapid design of powertrain in wheeled combineharvester chassis based on knowledgerdquo Applied Mechanicsand Materials vol 472 pp 516ndash521 2014
[12] D F Hu and Y P Du ldquoStrength analysis of corn combineharvester chassisrdquo Applied Mechanics and Materialsvol 644ndash650 pp 489ndash492 2014
[13] P Vijaykumar and R I Patel ldquoStructural analysis of auto-motive chassis frame and design modification for weightreductionrdquo International Journal of Engineering Research andTechnology vol 1 no 3 2012
[14] N S Nagaraju M V Kumar and U Koteswarao ldquoModelingand analysis of an innova car chassis frame by varying crosssectionrdquo International Journal of Engineering Research andTechnology vol 2 pp 1ndash12 2013
[15] Z Tang H Ren X Li X Liu and B Zhang ldquoStructure designand bearing capacity analysis for crawler chassis of ricecombine harvesterrdquo Complexity vol 2020 Article ID7610767 15 pages 2020
[16] Z Chen T Wang F Gu and R Zhang ldquoCharacterizing thedynamic response of a chassis frame in a heavy-duty dumpvehicle based on an improved stochastic system identifica-tionrdquo Shock and Vibration vol 2015 Article ID 37408315 pages 2015
[17] Y Jiang Y Liao C Qin Z Guan and Q Liao ldquoVibrationanalysis and improvement for frame of 4SY-29 typed rapewindrowerrdquo Transactions of the Chinese Society of Agricul-tural Engineering vol 33 pp 53ndash60 2017
[18] S Ganesan and K Panneerselvam ldquoVibration reduction inconventional vehicles by increasing the stiffness on the chassisframerdquo Journal of Engineering and Applied Science vol 10pp 3384ndash3390 2015
[19] T T Yao and Y Zheng ldquoFinite element analysis of stressdeformation and modal of head cover in axial-flow hydro-turbinerdquo Journal of Drainage and Irrigation Machinery En-gineering vol 38 no 1 pp 39ndash44 2020
[20] A Xue Z G Li Z S Manuela T M Fideline and Y G YangldquoCharacterization of textural failure mechanics of strawberryfruitrdquo Journal of Food Engineering vol 282 Article ID 1100162020
[21] Z N Lai S Yang and P Wu ldquoSpeed-throttling combinedoptimization for high reliability in parallel centrifugal pumpsystemrdquo Journal of Drainage and Irrigation Machinery En-gineering vol 36 pp 1205ndash1210 2018
[22] Z Tang H T Zhang Y P Zhou and Y Li ldquoMutual in-terference and coupling response of multicylinder vibration
Mathematical Problems in Engineering 21
among combine harvester co-framerdquo Shock and Vibrationvol 2019 Article ID 1584391 14 pages 2019
[23] I Maciejewski T Krzyzynski and H Meyer ldquoModeling andvibration control of an active horizontal seat suspension withpneumatic musclesrdquo Journal of Vibration and Control vol 24no 24 pp 5938ndash5950 2018
[24] D Huang S Zhou and G Litak ldquoAnalytical analysis of thevibrational tristable energy harvester with a RL resonantcircuitrdquoNonlinear Dynamics vol 97 no 1 pp 663ndash677 2019
[25] Y Fang and T Zhang ldquoModeling and analysis of electricpowertrain NVH under multi-source dynamic excitationrdquoSAE Technical Paper vol 1 p 2870 2014
[26] Z Y Xie Q D Zhou and Y C Pan ldquoSimulation and tests forvibration of structures under multi-point complex loadsrdquoJournal of Vibration and Shock vol 37 pp 166ndash174 2018
[27] S Chen Y Zhou Z Tang and S Lu ldquoModal vibration re-sponse of rice combine harvester frame under multi-sourceexcitationrdquo Biosystems Engineering vol 194 pp 177ndash1952020
[28] K Lee ldquoLarge deflections of cantilever beams of non-linearelastic material under a combined loadingrdquo InternationalJournal of Non-linear Mechanics vol 37 no 3 pp 439ndash4432002
[29] S A Emam M A Eltaher M E Khater and W S AbdallaldquoPostbuckling and free vibration of multilayer imperfectnanobeams under a pre-stress loadrdquo Applied Sciences vol 8no 11 p 2238 2018
[30] J T Oden and J N ReddyVariational Methods inBeoreticalMechanics Springer-Verlag Berlin Germany 1976
[31] X H Wang Y Li H L Liu K Wang S H Wang andY Wang ldquoInfluence of geometrical parameters of vibrationdamping raft on vibration characteristics of marine centrif-ugal pumprdquo Journal of Drainage and Irrigation MachineryEngineering vol 37 no 11 pp 929ndash935 2019
[32] D Cao S Rakheja and C Y Su ldquoDynamic analyses of heavyvehicle with pitch-interconnected suspensionsrdquo InternationalJournal of Heavy Vehicle Systems vol 15 no 2ndash4 pp 272ndash308 2008
22 Mathematical Problems in Engineering

Shea
r for
ce (N
)
ndash100
ndash50
0
50
100
150
200
Length of the beam (m)0 01 02 04 0503
A
B C
x 035y ndash9553
y = ndash7018x + 1501
x 045y ndash9553
Section A-B shear curveSection B-C shear curve
(a)
Bend
ing
mom
ent (
Nm
)
0
5
10
20
15
A C
B
x 02138y 1605
Peak
x 035y 9553
x 045y 0
y = ndash3509x2 + 15011x
y = ndash9553x + 4299
Length of the beam (m)0 01 02 04 0503
Section A-B bending moment variation curveSection B-C bending moment variation curve
(b)
Figure 16 Shear force and bendingmoment of the accumulator bearing beam (a) Shear diagram of accumulator bearing beam (b) Bendingmoment diagram of accumulator bearing beam
Shea
r for
ce (N
)
ndash2000
ndash1000
0
1000
2000
3000
Length of the beam (m)0 02 04 08 106
y = ndash3895x + 19745
y = ndash3895x + 17255
x 0886y ndash17255
x 0664y 133209
y = ndash3895x + 125419
x 1y 19205
Beam no 14 shear curveBeam no 16 shear curveBeam no 17 shear curve
(a)
Bend
ing
mom
ent (
Nm
)
200
0
400
600
800
1000
y = ndash19475x2 + 19475x y = ndash19475x2 + 17255x
y = ndash19475x2 + 129314
x 0443y 3822
x 05y 486875
x 0332y 2019 x 0664
x 0886
Length of the beam (m)0 02 04 08 106
Beam no 14 bending moment change curveBeam no 16 bending moment change curveBeam no 17 bending moment change curve
(b)
Figure 17 Continued
Mathematical Problems in Engineering 15
the calculated modal parameters were valid the verificationresults and the modal shapes of each order of the chassisframe are shown in Figure 18
-e modal analysis of the crawler-type combined har-vesting chassis frame test is shown in Table 7
It can be seen from the data in Table 7 that the first sixnatural frequencies of the chassis frame were between22ndash53Hz and the vibration modes were mainly bendingtorsion and local modes -e first-order natural frequencyof 2377Hz was close to the double frequency of the lon-gitudinal axial drum rotation frequency of 2534Hz and thefundamental frequency of the fan speed was 2583Hz whichmay produce complex vibration coupling and easily excitethe bending mode of the tank support beam -e fifth-ordernatural frequency of the chassis frame of 4538Hz was close
to the basic frequency of the engine at 45Hz at idle speed andlarge throttle which was easy to excite the bending mode ofthe fuel tank support beam
Considering that the frequency of each vibrationsource would be fluctuated during the field harvestingprocess of the combine harvester the fundamental fre-quency of each vibration source and its multiplier fre-quency cannot be calculated by only a certaininstantaneous speed -erefore it was more accurate andpractical to analyze and study the excitation frequency ofeach vibration source in a certain frequency range It canbe seen from Table 7 that the excitation frequency of eachvibration source on the combine was concentrated in twointerval sections of 20ndash25Hz and 45ndash50Hz -erefore inthese two interval sections the fundamental frequency or
Shea
r for
ce (N
)
ndash5000
ndash4000
ndash3000
ndash2000
ndash1000
1000
2000
3000
5000
4000
0
Length of the beam (m)0 05 1 215
A x 044y 24928
x 044y 24928
x 044y 24928
x 044y 24928
x 044 y 24928
BC
y = ndash7790x + 1092158
y = ndash7790x + 59204y = ndash7790x + 17138
D
Section A-B shear curveSection B-C shear curveSection C-D shear curve
(c)
Bend
ing
mom
ent (
Nm
)
Length of the beam (m)0 05 1 215
100
0
ndash50
50
150
200
250
350
400
300
x 022y 9426
x 076y 19942
x 01402y 2019
y = ndash19475(x ndash 044)(x ndash 108)
y = ndash19475(x ndash 108)(x ndash 1724)y = ndash19475x2 + 8569x
A
B C
D
Section A-B bending moment variation curveSection B-C bending moment variation curveSection C-D bending moment variation curve
(d)
Shea
r for
ce (N
)
Length of the beam (m)0 01 02 0403
ndash50
0
50
100
150
200
A
B
C D
x 0055y 14755
x 0105y ndash472
y = ndash3895x + 361775
Section A-B shear curveSection B-C shear curveSection C-D shear curve
(e)
Bend
ing
mom
ent (
Nm
)
Length of the beam (m)0 005 0350301 015 02 025
ndash8
ndash4
0
4
8
12
16
20
A
B
C
Dx 0055y 812
x 0093y 1093 033
y = ndash472x + 15576
y = ndash19475x2 + 362235x ndash 5933
y = 14755x
Section A-B bending moment variation curveSection B-C bending moment variation curveSection C-D bending moment variation curve
(f )
Figure 17 Shear force and bending moment of each bearing beam of the threshing drum (a) Beams no⑭⑯ and⑰ shear diagram (b)Beam no⑭⑯ and⑰ bendingmoment diagram (c) Beam no⑮ shear diagram (d) Beam no⑮ bendingmoment diagram (e) Beam no⑱ shear diagram (f ) Beam no ⑱ bending moment diagram
16 Mathematical Problems in Engineering
and its multiplier frequency of each vibration source maybe close to each other or even produce frequency couplingfurthermore the vibration of the whole machine couldalso reach a peak in these two frequency sections Inaddition the first 6-order natural frequencies of thechassis frame were within the operating frequency rangeof multiple vibration sources on the combine -ere wasmore overlap between 20ndash25Hz and 40ndash45Hz which maycause complex vibration coupling and resonance As aresult the whole machine vibrated violently during op-eration which can easily cause fatigue damage to keycomponents and greatly reduce the service life of thecombine harvester
33 Vibration of the Chassis Frame of the Combine Harvesterunder Multiple Operating Conditions
331 Time-Domain Vibration Characteristics of the ChassisFrame of the Combine Harvester under Multiple OperatingConditions After the tests the data collected from eachchannel of the sensors was processed by the DH vibrationtest analysis software -e working conditions during theanalysis mainly include the following four conditionsworking condition 1 whole machine static no load (only theengine worked small throttle) working condition 2 wholemachine walking (only the engine working) workingcondition 3 whole machine static no load (componentsworking small throttle) and working condition 4 the wholemachine walking (components working) -e data in alldirections were calculated and counted to obtain the time-domain average of the main vibration acceleration of thechassis frame in three directions-e specific data results areshown in Table 8 and Figure 19
In order to explore the vibration amount of the chassisframe under multiple working conditions considering theexistence of three directions of vibration at the samemeasuring point it was necessary to calculate the total rootmean square acceleration of each measuring point underdifferent working conditions in three directions -e rootmean square acceleration of the total vibration of themeasuring point in the rectangular coordinate system can becalculated by
av
a2x + a
2y + a
2z
3
1113971
(9)
From the vibration acceleration data in Table 8 the rootmean square acceleration of the total amount of vibration ofeach measuring point under various working conditions canbe obtained -e specific data results are shown in Table 9
From the vibration acceleration results of the sensorsin Tables 8 and 9 it can be seen that the vibration ac-celeration of the chassis frame was the smallest underworking condition 1 Under working condition 4 thevibration acceleration of the chassis frame was the largestthat meant that when the whole machine and eachcomponent was working the impact of each workingcomponent on the chassis frame was the largest In thiscondition the vibration of the chassis frame at the right
rear was severe which was the position of the threshingand cleaning working device -e main excitation di-rection at this position was in the Z-direction which wasthe carrying direction of the chassis frame Although thestatics had been checked before the design when thethreshing drum was actually working there would be alarge unbalanced excitation force due to the threshingwork Under the action of persistent unbalanced staggeredexcitation force it would cause the chassis frame toproduce periodic forced vibration here -erefore thesupport frame at this position should be furtherstrengthened to improve the long-term reliability of thechassis frame thereby improving the reliability of theentire machine
332 Vibration Characteristics of Chassis Frame underMultisource Excitation Taking the X-direction vibrationresponse of the front left measurement point of the chassisframe as an example the result of the vibration acceler-ation signal after being transformed by someone is shownin Figure 20 -e specific frequency amplitude of thecombine harvester under three working conditions of thestatic load of the complete machine (components work-ing small throttle) the static load of the complete ma-chine (components working large throttle) and the wholemachine walking (components working) is shown inTables 10sim12 Comparing the frequency of the main vi-bration source parameters of the combine harvester inTable 6 with the data in Table 10 it can be seen that themain frequency of vibration in each direction of themeasurement points was basically the second-order fre-quency doubling of the engine under the condition ofsmall throttle at idle speed and each order octave -evibration amplitude of the chassis frame near the bracketresponsible for carrying the engine was the largest in thelateral direction followed by the vertical direction Itcould be that the engine was installed on the chassis frameat an angle which caused the vertical excitation forcegenerated by the combustion torque of the engine todecompose in the lateral and vertical directions
By analyzing the four response points of the chassisframe it can be seen that the measurement point at theleft rear of the chassis frame had large amplitude at 15 Hzwhich may be the double frequency of the fundamentalfrequency of the driving shaft of the bridge or the driveshaft of the vibrating screen Since the vibrating screenstructure was a crank-slider mechanism when the vi-brating screen drive shaft worked the reciprocatingmotion of the slider would have a periodic impact on theframe resulting in large local amplitude of the chassisframe When the whole machine was moving in the fieldwith all working components working the vibrationamplitude of the chassis frame was the largest As theengine speed increased the excitation capacity of eachworking component connected to the engine on thewhole machine increased resulting in an increase in thefrequency component and amplitude of the measuringpoint on the chassis frame Among them each working
Mathematical Problems in Engineering 17
Table 7 Comparison of modal test and finite element calculation results
Researchobject Order
Modal test resultsDeviation ()Test frequency
(Hz)Damping ratio
() Mode shape
Chassis frame
1 2377 022 Fuel tank support beam bending 132 2891 047 Cab beam bending and torsion combination 283 3541 072 Fuel tank support beam bending 09
4 4244 016 Overall bending and twisting combination of chassisframe 85
5 4538 053 Fuel tank support beam bending 546 5262 058 Left beam bending 36
First-order mode
Second-order modeFourth-order mode
Fifth-order modeSixth-order mode
Third-order mode
MAC verification
Figure 18 Natural frequency and modal shapes of the chassis frame
Table 8 Time-domain comparison of vibration intensity under various working conditions
Measuring pointRoot mean square value of vibration acceleration (ms2)
Working condition 1 Working condition 2 Working condition 3 Working condition 4X Y Z X Y Z X Y Z X Y Z
1 057 074 055 283 215 536 213 389 589 437 496 9362 062 082 087 247 271 423 345 283 403 412 558 5683 084 102 105 206 201 235 350 364 901 459 517 10084 068 079 098 287 323 389 267 917 644 332 997 1225
Condition 1 Condition 2 Condition 3 Condition 41
23
4
15
10
5
0
Acce
lera
tion
(ms
2 )
Working condition
Measurin
g poin
t
Figure 19 Root mean square value of vibration acceleration under various working conditions
18 Mathematical Problems in Engineering
condition showed that the chassis frame had the largestamplitude in the Z-direction (vertical direction) when itwas forced to vibrate which was the loading direction of
the chassis frame relative to each excitation source Inaddition the whole machine had a frequency of 2036120654 Hz that was not available when it was at no load
Table 10 Main frequencies and amplitudes under static no-load conditions (components working small throttle)
Measuringpoint
Peaknumber
X-direction Y-direction Z-direction
Frequency (Hz) Amplitude(mlowast sminus 2)
Frequency(Hz)
Amplitude(mlowast sminus 2)
Frequency(Hz) Amplitude (mlowast sminus 2)
11 4875 0937 4875 1159 2438 09482 2438 0823 9063 1088 5063 04383 9063 0796 24188 0862 725 0390
21 4813 1504 2438 0430 4813 09142 5125 0985 725 0272 2438 08433 2438 0654 9625 0245 5125 0370
31 4875 1318 4875 0468 4875 17942 2438 0546 2438 0378 2438 07923 7313 0490 9063 0264 7313 0399
41 4875 1334 7313 0834 2438 10832 2438 0567 9688 0828 4875 08183 725 0466 2438 0795 19438 0689
Frequency (Hz)
PeakX01 91797 1023
07640706067405340454
4492231251757876172150391
0203040506
Y
00
045
075
105
4 32
5
1
6
15
77734 155469 233203 310938 388672
Acce
lera
tion
(ms
2 )
Figure 20 FFT of the response of the front left measurement point of the chassis frame
Table 9 Root mean square acceleration of the total vibration of each measuring point under each working condition
Measuringpoint
Working condition 1(mlowast sminus 2)
Working condition 2(mlowast sminus 2)
Working condition 3(mlowast sminus 2) Working condition 4 (mlowast sminus 2)
1 063 371 426 6622 078 323 347 5183 097 215 596 7064 083 336 665 932
Mathematical Problems in Engineering 19
and there were many side frequencies near it whichshowed that these two frequencies may be the resonancefrequency of a structure
4 Conclusions
(1) According to the action mode and force of theexisting working parts of combine harvester on thechassis frame it was statically calculated -e resultsshowed that when the combine was fully loaded themaximum bending moment of all the load beamsappeared on one of the load beams of the grain box-e maximum bending moment wasMmax 229808Nm and it was located at a crosssection of the load beam with a distance of 161mfrom the left end boundary In addition stress checkwas carried out on the dangerous position-e stressvalue at this point was the maximum stress point ofthe entire chassis frame and its maximum normalstress σmax 991MPalt [σ] which met the re-quirements of Q235 material indicating that thedesigned chassis had the ability to carry the mainworking components of the entire machine
(2) -e first 6 natural frequencies of the chassis framewere within the working frequency range of multiplevibration sources on the combine harvester andthere was more overlap between the 20ndash25Hz and40ndash45Hz intervals It may cause complex vibrationcoupling and resonance resulting in severe vibrationof the fuselage when the whole machine wasworking Furthermore it would cause fatiguedamage to key components and greatly reduce thelife of the combine harvester
(3) -e vibration of the chassis frame was the smallestwhen the engine was working only When theworking components of the whole machine wereworking the vibration of the chassis frame at the rearright was the most intense Considering the fact thatthere was still alternating excitation force generatedby threshing in the threshing drum during actualwork the support frame at this position should befurther strengthened to improve the reliability of thelong-term operation of the chassis frame therebyimproving the working reliability of the wholemachine
Table 12 Main frequency and amplitude under driving conditions (components working machine walking)
Measuringpoint
Peaknumber
X-direction Y-direction Z-directionFrequency
(Hz)Amplitude(mlowastsminus 2)
Frequency(Hz)
Amplitude(mlowastsminus 2)
Frequency(Hz) Amplitude (mlowastsminus 2)
11 18066 1230 15820 2551 1514 08612 7813 1063 20361 1328 732 08093 9033 0823 17481 0959 20654 0783
21 18066 1214 27197 1082 9033 22572 9082 1168 25732 1025 23291 12433 7813 1035 18115 0873 20557 1087
31 18115 2227 27148 0926 9082 76322 9082 1691 781 0914 18115 39033 781 0751 20410 0712 27197 1262
41 18115 0838 20410 4724 18115 60272 9033 0772 15869 3508 20361 34333 4541 0651 23242 3273 23340 2473
Table 11 Main frequencies and amplitudes under static no-load conditions (components working big throttle)
Measuringpoint
Peaknumber
X-direction Y-direction Z-directionFrequency
(Hz)Amplitude(mlowast sminus 2)
Frequency(Hz)
Amplitude(mlowast sminus 2)
Frequency(Hz) Amplitude (mlowast sminus 2)
11 15 13002 15 1179 813 35702 813 12842 813 8988 290 33103 2438 9832 17125 767 29813 2518
21 9188 1023 9188 2173 688 14972 4492 0764 688 1021 813 11203 3125 0706 18375 0707 9188 0959
31 9188 1399 9188 2087 9188 38162 4625 0626 688 0780 813 07773 688 0556 20 0649 27625 0772
41 9188 2322 9188 2698 17938 25682 688 1159 688 1353 17125 22523 4625 0844 20 0907 16313 2072
20 Mathematical Problems in Engineering
(4) When the whole machine was moving in the fieldand all parts were working the vibration amplitudeof the chassis frame was the largest -e horizontalvibration of the threshing drum the reciprocatingmotion generated by the vibrating screen and thevertical vibration generated by the engine were themain vibration sources of the combine harvester inthe three directions of X Y and Z Besides eachworking condition showed that the chassis frame hadthe largest amplitude in the Z-direction (verticaldirection) when it was forced to vibrate and thisdirection was the loading direction of the chassisframe relative to each excitation source
Data Availability
-e data used to support the findings of this study areavailable from the corresponding author upon request
Conflicts of Interest
-e authors declare that they have no conflicts of interest
Acknowledgments
-is research work was supported by the Natural ScienceFoundation of Jiangsu Province (BK20170553) NationalNatural Science Foundation of China (51705212) JiangsuProvince ldquoSix Talents Peakrdquo High-level Talent Project(GDZB-085) Open Fund of Jiangsu Key Laboratory ofAgricultural Equipment and Intelligent High Technology(JNZ201912) and Jiangsu Province Postgraduate Researchand Innovation Project (KYCX20_3086)
References
[1] A M Parker A Proctor R L Eason and V Jain ldquoEffects ofrice harvest moisture on kernel damage and milled ricesurface free fatty acid levelsrdquo Journal of Food Science vol 72pp 10ndash15 2007
[2] Z Tang Y Li X Li and T Xu ldquoStructural damage modes forrice stalks undergoing threshingrdquo Biosystems Engineeringvol 186 pp 323ndash336 2019
[3] Z Tang M L Wang H T Zhang Y P Zhou and Y LildquoVariation and modal characteristic of tangential threshingcylinder undergoing threshing dynamicsrdquo MathematicalProblems in Engineering vol 2020 Article ID 172389315 pages 2020
[4] Z Tang H T Zhang H Zhang et al ldquoDevelopments ofcrawler steering gearbox for combine harvester straight for-ward and steering in siturdquo International Journal of Agricul-tural and Biological Engineering vol 13 no 1 pp 120ndash1262020
[5] R Prasad Y S Shivay and D Kumar ldquoCurrent statuschallenges and opportunities in rice productionrdquo Rice Pro-duction Worldwide vol 2 pp 1ndash32 2017
[6] Z Tang X Li X Liu H Ren and B Zhang ldquoDynamicbalance method for grading the chain drive double threshingdrum of a combine harvesterrdquo Applied Sciences vol 10 no 3pp 1026ndash1046 2020
[7] Z W Liang Y M Li and L Z Xu ldquoGrain sieve loss fuzzycontrol system in rice combine harvestersrdquo Applied Sciencesvol 9 no 1 2018
[8] P Li and H Xu ldquoBraking efficiency and stability of chassisbraking system of combine harvester the theoretical deri-vation and virtual prototype simulationrdquo MathematicalProblems in Engineering vol 2019 Article ID 671323118 pages 2019
[9] Z Tang X Y Li X D Chen and Y Chen ldquoDesign of negativepressure spiral feeding device for tangential and longitudinalaxial intersection of combine harvesterrdquo Advances in Mate-rials Science and Engineering vol 2019 Article ID 164723012 pages 2019
[10] Z Tang H T Zhang and Y P Zhou ldquoUnbalanced vibrationidentification of tangential threshing cylinder induced by ricethreshing processrdquo Shock and Vibration vol 2018 Article ID4708730 14 pages 2018
[11] C L Li S C Yin X P Jin E R Mao X H Lou andZ H Song ldquoRapid design of powertrain in wheeled combineharvester chassis based on knowledgerdquo Applied Mechanicsand Materials vol 472 pp 516ndash521 2014
[12] D F Hu and Y P Du ldquoStrength analysis of corn combineharvester chassisrdquo Applied Mechanics and Materialsvol 644ndash650 pp 489ndash492 2014
[13] P Vijaykumar and R I Patel ldquoStructural analysis of auto-motive chassis frame and design modification for weightreductionrdquo International Journal of Engineering Research andTechnology vol 1 no 3 2012
[14] N S Nagaraju M V Kumar and U Koteswarao ldquoModelingand analysis of an innova car chassis frame by varying crosssectionrdquo International Journal of Engineering Research andTechnology vol 2 pp 1ndash12 2013
[15] Z Tang H Ren X Li X Liu and B Zhang ldquoStructure designand bearing capacity analysis for crawler chassis of ricecombine harvesterrdquo Complexity vol 2020 Article ID7610767 15 pages 2020
[16] Z Chen T Wang F Gu and R Zhang ldquoCharacterizing thedynamic response of a chassis frame in a heavy-duty dumpvehicle based on an improved stochastic system identifica-tionrdquo Shock and Vibration vol 2015 Article ID 37408315 pages 2015
[17] Y Jiang Y Liao C Qin Z Guan and Q Liao ldquoVibrationanalysis and improvement for frame of 4SY-29 typed rapewindrowerrdquo Transactions of the Chinese Society of Agricul-tural Engineering vol 33 pp 53ndash60 2017
[18] S Ganesan and K Panneerselvam ldquoVibration reduction inconventional vehicles by increasing the stiffness on the chassisframerdquo Journal of Engineering and Applied Science vol 10pp 3384ndash3390 2015
[19] T T Yao and Y Zheng ldquoFinite element analysis of stressdeformation and modal of head cover in axial-flow hydro-turbinerdquo Journal of Drainage and Irrigation Machinery En-gineering vol 38 no 1 pp 39ndash44 2020
[20] A Xue Z G Li Z S Manuela T M Fideline and Y G YangldquoCharacterization of textural failure mechanics of strawberryfruitrdquo Journal of Food Engineering vol 282 Article ID 1100162020
[21] Z N Lai S Yang and P Wu ldquoSpeed-throttling combinedoptimization for high reliability in parallel centrifugal pumpsystemrdquo Journal of Drainage and Irrigation Machinery En-gineering vol 36 pp 1205ndash1210 2018
[22] Z Tang H T Zhang Y P Zhou and Y Li ldquoMutual in-terference and coupling response of multicylinder vibration
Mathematical Problems in Engineering 21
among combine harvester co-framerdquo Shock and Vibrationvol 2019 Article ID 1584391 14 pages 2019
[23] I Maciejewski T Krzyzynski and H Meyer ldquoModeling andvibration control of an active horizontal seat suspension withpneumatic musclesrdquo Journal of Vibration and Control vol 24no 24 pp 5938ndash5950 2018
[24] D Huang S Zhou and G Litak ldquoAnalytical analysis of thevibrational tristable energy harvester with a RL resonantcircuitrdquoNonlinear Dynamics vol 97 no 1 pp 663ndash677 2019
[25] Y Fang and T Zhang ldquoModeling and analysis of electricpowertrain NVH under multi-source dynamic excitationrdquoSAE Technical Paper vol 1 p 2870 2014
[26] Z Y Xie Q D Zhou and Y C Pan ldquoSimulation and tests forvibration of structures under multi-point complex loadsrdquoJournal of Vibration and Shock vol 37 pp 166ndash174 2018
[27] S Chen Y Zhou Z Tang and S Lu ldquoModal vibration re-sponse of rice combine harvester frame under multi-sourceexcitationrdquo Biosystems Engineering vol 194 pp 177ndash1952020
[28] K Lee ldquoLarge deflections of cantilever beams of non-linearelastic material under a combined loadingrdquo InternationalJournal of Non-linear Mechanics vol 37 no 3 pp 439ndash4432002
[29] S A Emam M A Eltaher M E Khater and W S AbdallaldquoPostbuckling and free vibration of multilayer imperfectnanobeams under a pre-stress loadrdquo Applied Sciences vol 8no 11 p 2238 2018
[30] J T Oden and J N ReddyVariational Methods inBeoreticalMechanics Springer-Verlag Berlin Germany 1976
[31] X H Wang Y Li H L Liu K Wang S H Wang andY Wang ldquoInfluence of geometrical parameters of vibrationdamping raft on vibration characteristics of marine centrif-ugal pumprdquo Journal of Drainage and Irrigation MachineryEngineering vol 37 no 11 pp 929ndash935 2019
[32] D Cao S Rakheja and C Y Su ldquoDynamic analyses of heavyvehicle with pitch-interconnected suspensionsrdquo InternationalJournal of Heavy Vehicle Systems vol 15 no 2ndash4 pp 272ndash308 2008
22 Mathematical Problems in Engineering