Embed Size (px)
Citation preview

Jennifer Brooks Hutchinson
Senior Counsel
280 Melrose Street, Providence, RI 02907 T: [email protected] www.nationalgrid.com
December 19, 2016
VIA HAND DELIVERY & ELECTRONIC MAIL Luly E. Massaro, Commission Clerk Rhode Island Public Utilities Commission 89 Jefferson Boulevard Warwick, RI 02888 RE: Docket 4676-Proposed National Grid Proposal to Bid Capacity of Customer-Owned DG Facilities into the Forward Capacity Market Responses to Division Data Requests – Set 1 Dear Ms. Massaro:
On behalf of National Grid,1 I have enclosed the Company’s responses to the first set of data requests issued by the Rhode Island Division of Public Utilities and Carriers in the above-referenced docket.
Thank you for your attention to this matter. If you have any questions, please contact
me at 401-784-7288. Very truly yours,
Jennifer Brooks Hutchinson
Enclosures cc: Docket 4676 Service List
Leo Wold, Esq. Jon Hagopian, Esq. Steve Scialabba, Division
1 The Narragansett Electric Company d/b/a National Grid (National Grid or Company).
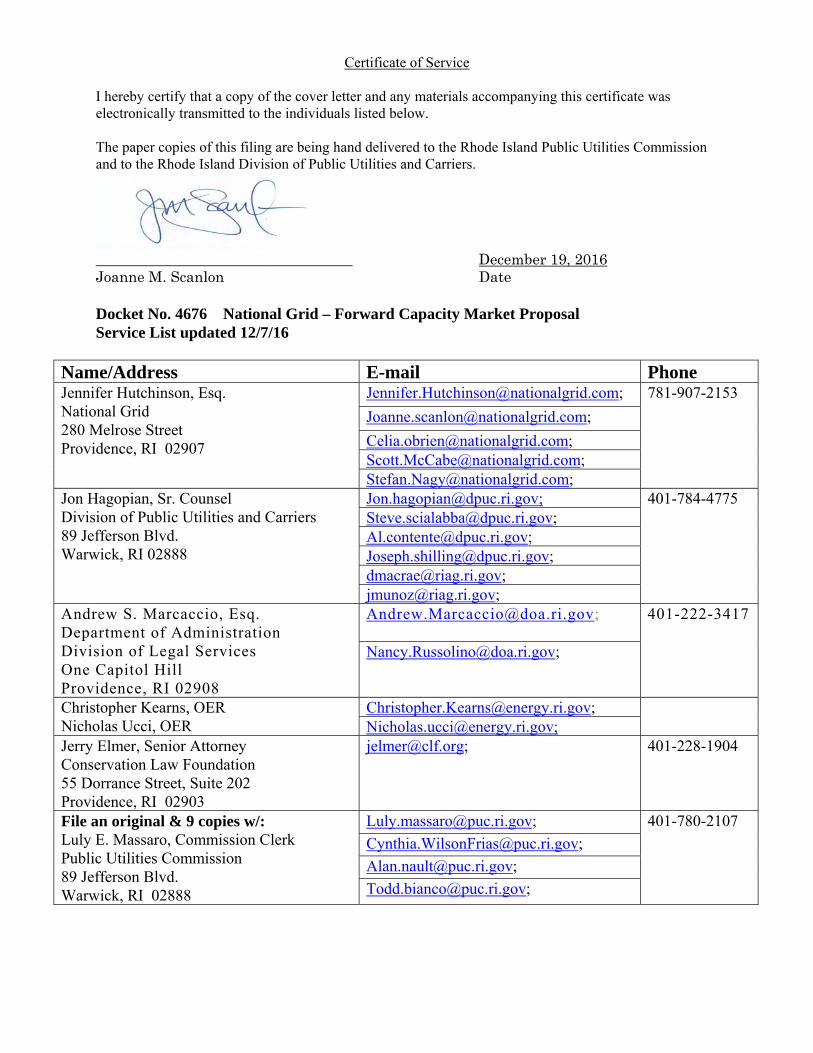
Certificate of Service I hereby certify that a copy of the cover letter and any materials accompanying this certificate was electronically transmitted to the individuals listed below. The paper copies of this filing are being hand delivered to the Rhode Island Public Utilities Commission and to the Rhode Island Division of Public Utilities and Carriers.
___________________________________ December 19, 2016 Joanne M. Scanlon Date Docket No. 4676 National Grid – Forward Capacity Market Proposal Service List updated 12/7/16
Name/Address E-mail Phone Jennifer Hutchinson, Esq. National Grid 280 Melrose Street Providence, RI 02907
[email protected]; 781-907-2153 [email protected];
[email protected]; [email protected]; [email protected];
Jon Hagopian, Sr. Counsel Division of Public Utilities and Carriers 89 Jefferson Blvd. Warwick, RI 02888
[email protected]; 401-784-4775 [email protected]; [email protected]; [email protected]; [email protected]; [email protected];
Andrew S. Marcaccio, Esq. Department of Administration Division of Legal Services One Capitol Hill Providence, RI 02908
401-222-3417
Christopher Kearns, OER Nicholas Ucci, OER
[email protected]; [email protected];
Jerry Elmer, Senior Attorney Conservation Law Foundation 55 Dorrance Street, Suite 202 Providence, RI 02903
401-228-1904
File an original & 9 copies w/: Luly E. Massaro, Commission Clerk Public Utilities Commission 89 Jefferson Blvd. Warwick, RI 02888
[email protected]; 401-780-2107 [email protected];

The Narragansett Electric Company d/b/a National Grid
RIPUC Docket No. 4676 In Re: Proposal to Bid Capacity of Customer-Owned DG Facilities
Into Forward Capacity Market Responses to the Division’s First Set of Data Requests
Issued on December 6, 2016
Prepared by or under the supervision of: Stefan Nagy
Division 1-1
Request: Could the company have sought to monetize the capacity associated with the REG and DGSC programs prior to the current filing? Please explain why or why not. If the company could have sought monetize this capacity previous to the current filing but did not, please explain why the company did not do so. Response: The facilities associated with the Renewable Energy (RE) Growth program will not begin to become commercially operational until 2017. Although facilities can be bid into the market before they become commercially operational under the ISO-NE rules for the Forward Capacity Market (FCM), the Company’s initial strategy is to qualify DG Facilities in the FCM only after they are commercially operational in accordance with Section 7.b.3 of the RE Growth tariff. As such, the Company did not previously seek to monetize the capacity associated with the RE Growth program. The Company could have sought to monetize the capacity associated with the Distributed Generation Standard Contracts (DGSC) program in past Forward Capacity Auctions, but chose not to for a couple of reasons. First, as noted on page 11, line 17 of the Company’s pre-filed testimony, the FCM was in a state of flux prior to May 2014 and auction prices, with some notable exceptions, were relatively low, never reaching above $4.50 per kW-month. The interim FCM rule changes were finalized on May 30, 2014, and, under current market conditions, FCM prices have significantly increased. Second, the Company has gained experience with the market through its qualification of capacity associated with energy efficiency both in Rhode Island and in Massachusetts and with solar facilities in Massachusetts. Based on this experience, and since the FCM rule changes were finalized on May 30, 2014, the Company has conducted internal analysis to evaluate the benefits, risks and administrative requirements of bidding these facilities into the FCM. The Company determined that bidding the capacity of DG Facilities into the FCM, with its proposed FCM Proposal in place, is likely to be beneficial for customers.

The Narragansett Electric Company d/b/a National Grid
RIPUC Docket No. 4676 In Re: Proposal to Bid Capacity of Customer-Owned DG Facilities
Into Forward Capacity Market Responses to the Division’s First Set of Data Requests
Issued on December 6, 2016
Prepared by or under the supervision of: Corinne M. DiDomenico and Stefan Nagy
Division 1-2
Request:
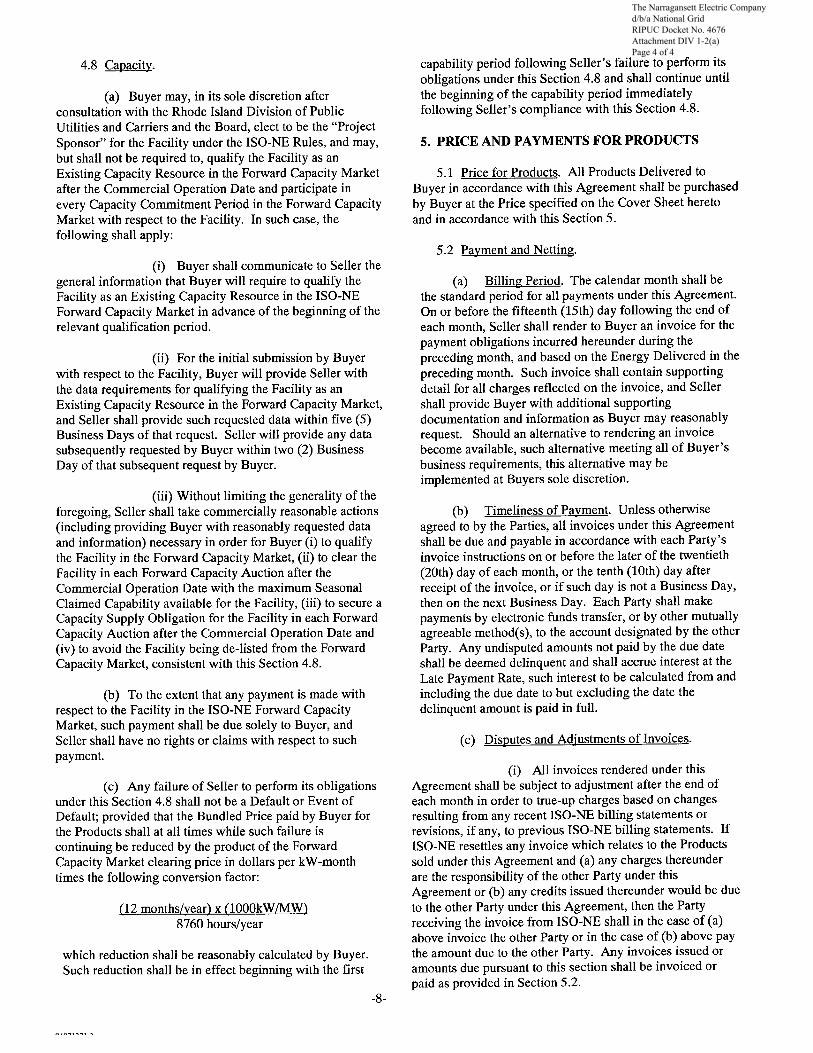
Please describe what contractual rights the company has to acquire capacity from and manage the operation of the REG and DGSC facilities that the company plans to use in this program. Provide copies of relevant documentation. Response: Please refer to Attachment DIV 1-2(a), the Distributed Generation Standard Contract Power Purchase Agreements (DG Agreements). Under section 4.8 of the DG Agreements, the Company may qualify the project and participate in the Forward Capacity Market with respect to the project, provided that, for projects that qualify as “Small Distributed Generation Facilities” (solar projects not larger than 500 kW, wind projects not larger than 1.5 MW and other projects not larger than 1 MW), the Company must first consult with the Division of Public Utilities and Carriers and Board before doing so.1 Section 4.8 also enables the Company to serve as the “Project Sponsor” for the project and manage its participation in the FCM. As noted in Attachment DIV 1-2(b), Sheets 7 and 8 of the Renewable Energy Growth Program for Non-Residential Customers Tariff, RIPUC No. 2152-B, the Company may qualify the DG project in the Forward Capacity Market, as determined by the Company, in consultation with the Division.2 Additionally, as requested by the Company or the ISO-NE, the Applicant will provide all necessary information as well as follow all requirements for all applicable market rules needed to set up the necessary capacity resource.
1 The Company’s initial bidding portfolio does include DGSC solar facilities less than 500kW. The Company intends to consult with the Division and Board pursuant to Section 4.8 once the PUC has ruled on the Company’s FCM Proposal, and prior to qualifying such facilities and participating in the FCM. 2 The Company did meet with the Division prior to this filing to discuss the Company’s FCM Proposal. The Company intends to consult the Division pursuant to Section 7.b.(3) once the PUC has ruled on the Company’s FCM Proposal.

The Narragansett Electric Company d/b/a National Grid RIPUC Docket No. 4676 Attachment DIV 1-2(a) Page 1 of 4

The Narragansett Electric Company d/b/a National Grid RIPUC Docket No. 4676 Attachment DIV 1-2(a) Page 2 of 4

The Narragansett Electric Company d/b/a National Grid RIPUC Docket No. 4676 Attachment DIV 1-2(a) Page 3 of 4
The Narragansett Electric Company d/b/a National Grid RIPUC Docket No. 4676 Attachment DIV 1-2(a) Page 4 of 4

RIPUC No. 2152-B
Sheet 7
THE NARRAGANSETT ELECTRIC COMPANY
RENEWABLE ENERGY GROWTH PROGRAM FOR NON-RESIDENTIAL CUSTOMERS
required remote communication for measuring and reporting the output of the DG Project as
well as any existing service meter. An Applicant may elect to supply the meter and
associated equipment provided that it conforms to the Company’s metering standards and the
Rhode Island Division of Public Utilities and Carriers (“Division”) Rules for Prescribing
Standards for Electric Utilities, as may be amended from time to time. At the request of the
Applicant, the Company will provide the required interval meter and associated equipment,
subject to the Company having such equipment available and the Applicant reimbursing the
Company for its cost.
c. The Company must be provided with adequate access to read the meter(s), and to install,
repair, maintain and replace the meter(s), if applicable.
7. Energy, Capacity, Renewable Energy Certificates and Other Environmental Attributes
a. Prior to receiving compensation pursuant to Section 8 of this Tariff, an Applicant, at its own
cost, must obtain Commission certification of a DG Project as an Eligible Renewable Energy
Resource pursuant to the Commission’s Rules and Regulations Governing the
Implementation of a Renewable Energy Standard. In addition, the Applicant is required to
cooperate with the Company to qualify the DG Project under the renewable portfolio
standard or similar law and/or regulation of New York, Massachusetts, and/or one or more
New England states and/or any federal renewable energy standard.
b. For the term specified in the applicable Tariff supplement, the Company shall have the
irrevocable rights and title to the following products produced by the DG Project: (1) RECs;
(2) energy; and (3) any other environmental attributes or market products associated with the
sale of energy or energy services produced by the DG Project, provided, however, that it
shall be the Company’s choice to acquire the capacity of the DG Project at any time after it is
awarded a Certificate of Eligibility by the Commission or the Company pursuant to the
Rules. Environmental attributes shall include any and all generation attributes or energy
services established by regional, state, federal, or international law, rule, regulation or
competitive market or business method that are attributable, now or in the future, to the
output produced by the DG Project during the term of service specified on the applicable
Tariff supplement.
(1) RECs: RECs must be delivered to the Company’s appropriate NEPOOL-GIS
account. This will be accomplished through registration of the DG Project with
the NEPOOL-GIS. If requested by the Company, Applicant will provide
approvals or assignments, as necessary, to facilitate the DG Project’s
participation in asset aggregation or other model of asset registration and
reporting.
Small-Scale Solar Projects shall provide all necessary information to, and
cooperate with, the Company to enable the Company to obtain the appropriate
RIPUC Docket No. 4676 Attachment DIV 1-2(b) Page 1 of 2

RIPUC No. 2152-B
Sheet 8
THE NARRAGANSETT ELECTRIC COMPANY
RENEWABLE ENERGY GROWTH PROGRAM FOR NON-RESIDENTIAL CUSTOMERS
asset identification for reporting generation to the NEPOOL-GIS for the
creation of RECs and direct all RECs from the DG Project to the Company’s
appropriate NEPOOL-GIS account. The Applicant will provide approvals or
assignments, including, but not limited to, completing the Renewable Energy
Certificate Assignment and Aggregation Form, to facilitate the DG Project’s
participation in asset aggregation or other model of asset registration and
reporting.
(2) Energy: Except for Small-Scale Solar Projects, energy must be delivered to the
Company in the Company’s ISO–NE load zone at the delivery node associated
with the DG Project. As requested by the Company or the ISO-NE, Applicant
will provide all necessary information as well as follow all requirements for all
applicable market rules needed to set up the necessary generation asset.
(3) Capacity: The Company may qualify the DG Project as an Existing Capacity
Resource in the Forward Capacity Market (FCM) after the Commercial
Operation Date to participate in the FCM, as determined by the Company, in
consultation with the Division. As requested by the Company or the ISO-NE,
Applicant will provide all necessary information as well as follow all
requirements for all applicable market rules needed to set up the necessary
capacity asset Applicants are required to take commercially reasonable actions
to maximize performance against any FCM Capacity Supply Obligations.
8. Performance-Based Incentive Payment
a. Eligibility
Upon receipt of a Certificate of Eligibility, the Applicant is entitled to the Performance-Based
Incentive Payment for the term specified in the applicable Tariff supplement, provided that the
Applicant has complied with all other requirements of this Tariff and the Solicitation and Enrollment
Process Rules.
As a condition for receiving monthly payments pursuant to Section 9c, the Applicant must
provide confirmation of the following: 1) the Company’s written authority to interconnect to its electric
distribution system and Applicant’s payment of all amounts due; 2) Commission certification of the DG
Project as an Eligible Renewable Energy Resource; 3) registration of the DG Project with the ISO-NE
and NEPOOL GIS; and 4) except for small-scale and medium-scale solar, the Output Certification.
Small-Scale Solar Projects can demonstrate completion of items 2 and 3 by the completion of the
Renewable Energy Certificate Assignment and Aggregation Form. If an Applicant or Customer is no
longer in good standing with regard to payment plans or agreements, if applicable, and other obligations
to the Company (including but not limited to meeting all obligations under an interconnection service
agreement), the Company may withhold payments under this Tariff. In addition, the Customer must
RIPUC Docket No. 4676 Attachment DIV 1-2(b) Page 2 of 2

The Narragansett Electric Company d/b/a National Grid
RIPUC Docket No. 4676 In Re: Proposal to Bid Capacity of Customer-Owned DG Facilities
Into Forward Capacity Market Responses to the Division’s First Set of Data Requests
Issued on December 6, 2016
Prepared by or under the supervision of: Stefan Nagy
Division 1-3
Request: Regarding page 10, line 5 company’s pre-filed testimony, please provide the basis for the $36.9 million figure. Include all assumptions, workpapers, and calculations in a live Excel spreadsheet with all formulas intact. Response: The $36.9 million figure referenced on page 10, line 5, of the Company’s pre-filed testimony represented the Company’s then estimate of the cumulative Net FCM Proceeds that will accrue as a result of the Company’s execution of its FCM Proposal. The Company has revised this figure as a result of revisions to the projected capacity portfolio and the associated administrative costs, as discussed in the Company’s responses to Division 1-19 and 1-25. Therefore, the Company’s revised estimate of the cumulative Net FCM Proceeds is $25.9 million. Please refer to Attachments DIV 1-3(a), DIV 1-3(b), DIV 1-3(c), and DIV 1-3(d) for the Company’s detailed analysis of the benefits and risks associated with its FCM Proposal. Attachment DIV 1-3(a) provides a step-by-step outline of the process and methodology for the Company’s analysis, which is presented in the live Excel spreadsheets in Attachments DIV 1-3(b), DIV 1-3(c), and DIV 1-3(d). The capacity forecast, analysis, and estimates presented in Attachment DIV 1-3(d) have been updated to reflect the revisions outlined in the Company’s responses to Division 1-19 and Division 1-25. The calculation of the Company’s revised estimate of the cumulative Net FCM proceeds of $25.9 million is presented in cell C42 of tab “4.1 Cash Flow Total Portfolio” in Attachment DIV 1-3(d). This represents the sum of the annual Net FCM Proceeds between 2017 and 2040 of the total portfolio of solar DG Facilities associated with the RE Growth and DGSC programs. The calculation of the annual Net FCM Proceeds1 is comprised of the sum of the annual FCM base payments resulting from participation in the Forward Capacity Auction2, the annual FCM base
1 The calculation of the annual Net FCM Proceeds is presented in Column U of tab “4.1 Cash Flow Total Portfolio” in Attachment DIV 1-3(d). 2 The annual base payments from participation in the Forward Capacity Auction are presented in Column N of tab “4.1 Cash Flow Total Portfolio” in Attachment DIV 1-3(d). The solar DG facilities will have Capacity Supply Obligations for the months of June, July, August, and September. The capacity prices (which are in $/kW-month) listed in Column H of tab “4.1 Cash Flow Total Portfolio” are multiplied by 4,000 to convert to $/MW-year and then multiplied by the MWs of Capacity Supply Obligation to obtain the annual base payment.

The Narragansett Electric Company d/b/a National Grid
RIPUC Docket No. 4676 In Re: Proposal to Bid Capacity of Customer-Owned DG Facilities
Into Forward Capacity Market Responses to the Division’s First Set of Data Requests
Issued on December 6, 2016
Prepared by or under the supervision of: Stefan Nagy
Division 1-3, page 2 payments resulting from participation in the Annual Reconfiguration Auction3 (if applicable), and the estimated Performance Incentive Payments4, under the Base Case assumptions that are detailed in footnote 21 on page 24 of the Company’s pre-filed testimony.
3 The monthly base payments from participation in the Reconfiguration Auction are presented in Column O of tab “4.1 Cash Flow Total Portfolio” in Attachment DIV 1-3(d). The same logic is applied to convert the Reconfiguration Auction prices in Column M of tab “4.1 Cash Flow Total Portfolio” to annual payments, as is detailed in footnote 3 above for the annual base payments resulting from participation in the Forward Capacity Auction. 4 The estimated annual Performance Incentive payments resulting from participation in the Forward Capacity Auction are presented in Column P of tab “4.1 Cash Flow Total Portfolio” in Attachment DIV 1-3(d).
The Narragansett Electric Company d/b/a National Grid
RIPUC Docket No. 4676 In Re: Proposal to Bid Capacity of Customer-Owned DG Facilities
Into Forward Capacity Market Responses to the Division’s First Set of Data Requests
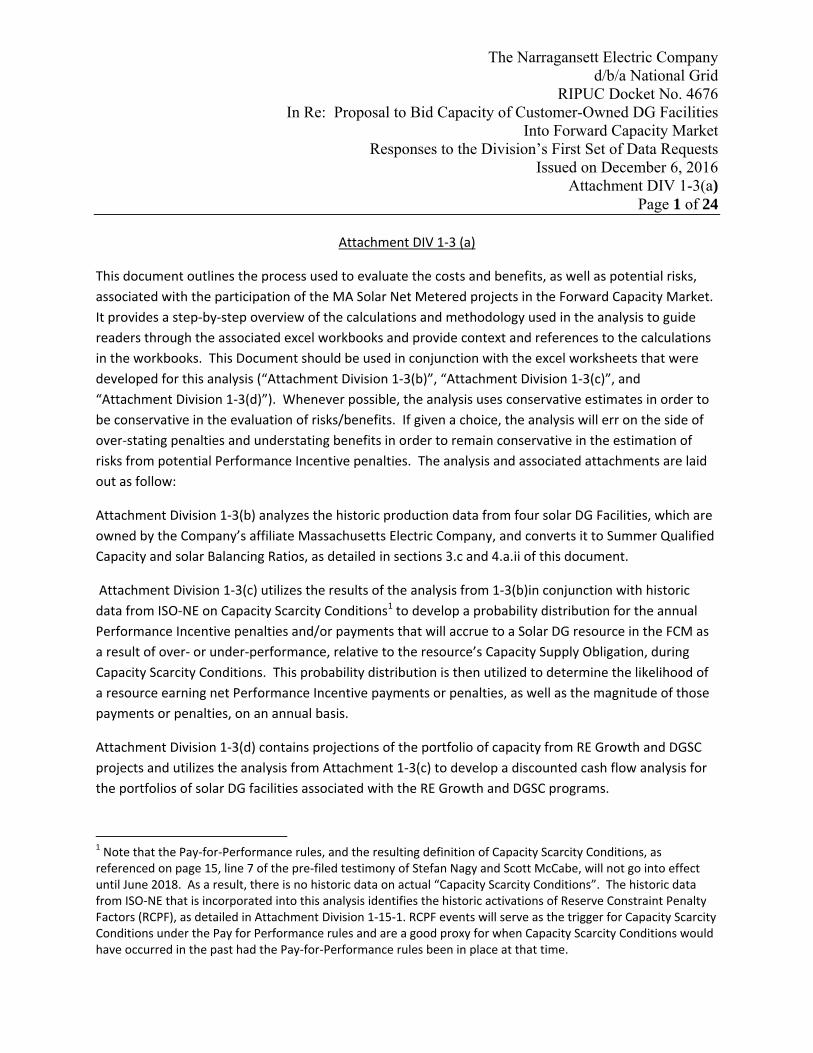
Issued on December 6, 2016 Attachment DIV 1-3(a)
Page 1 of 24
Attachment DIV 1-3 (a)
This document outlines the process used to evaluate the costs and benefits, as well as potential risks, associated with the participation of the MA Solar Net Metered projects in the Forward Capacity Market. It provides a step-by-step overview of the calculations and methodology used in the analysis to guide readers through the associated excel workbooks and provide context and references to the calculations in the workbooks. This Document should be used in conjunction with the excel worksheets that were developed for this analysis (“Attachment Division 1-3(b)”, “Attachment Division 1-3(c)”, and “Attachment Division 1-3(d)”). Whenever possible, the analysis uses conservative estimates in order to be conservative in the evaluation of risks/benefits. If given a choice, the analysis will err on the side of over-stating penalties and understating benefits in order to remain conservative in the estimation of risks from potential Performance Incentive penalties. The analysis and associated attachments are laid out as follow:
Attachment Division 1-3(b) analyzes the historic production data from four solar DG Facilities, which are owned by the Company’s affiliate Massachusetts Electric Company, and converts it to Summer Qualified Capacity and solar Balancing Ratios, as detailed in sections 3.c and 4.a.ii of this document.
Attachment Division 1-3(c) utilizes the results of the analysis from 1-3(b)in conjunction with historic data from ISO-NE on Capacity Scarcity Conditions1 to develop a probability distribution for the annual Performance Incentive penalties and/or payments that will accrue to a Solar DG resource in the FCM as a result of over- or under-performance, relative to the resource’s Capacity Supply Obligation, during Capacity Scarcity Conditions. This probability distribution is then utilized to determine the likelihood of a resource earning net Performance Incentive payments or penalties, as well as the magnitude of those payments or penalties, on an annual basis.
Attachment Division 1-3(d) contains projections of the portfolio of capacity from RE Growth and DGSC projects and utilizes the analysis from Attachment 1-3(c) to develop a discounted cash flow analysis for the portfolios of solar DG facilities associated with the RE Growth and DGSC programs.
1 Note that the Pay-for-Performance rules, and the resulting definition of Capacity Scarcity Conditions, as referenced on page 15, line 7 of the pre-filed testimony of Stefan Nagy and Scott McCabe, will not go into effect until June 2018. As a result, there is no historic data on actual “Capacity Scarcity Conditions”. The historic data from ISO-NE that is incorporated into this analysis identifies the historic activations of Reserve Constraint Penalty Factors (RCPF), as detailed in Attachment Division 1-15-1. RCPF events will serve as the trigger for Capacity Scarcity Conditions under the Pay for Performance rules and are a good proxy for when Capacity Scarcity Conditions would have occurred in the past had the Pay-for-Performance rules been in place at that time.

The Narragansett Electric Company d/b/a National Grid
RIPUC Docket No. 4676 In Re: Proposal to Bid Capacity of Customer-Owned DG Facilities
Into Forward Capacity Market Responses to the Division’s First Set of Data Requests
Issued on December 6, 2016 Attachment DIV 1-3(a)
Page 2 of 24 Section 1 of this document provides background details on the performance requirements and payment calculations under the FCM Pay for Performance rules. Section 2 outlines the analysis of the historic production data from the four solar DG facilities that are used in this analysis. Section 3 and Section 4 of this document outline the analysis to develop a probability distribution of Performance Incentive payments and/or penalties to a Solar DG resource under the Pay for Performance Rules. Section 5 of this document outlines the cash flow analysis for the Company’s portfolio of Solar DG facilities in the FCM under its FCM Proposal.
1. Background on Pay for Performance Rules a. Under the Pay for Performance rules in the FCM, any resource with a Capacity Supply
Obligation is required to perform during “Capacity Scarcity Conditions”. b. The required level of performance during a Scarcity Condition is determined based on
the resource’s Capacity Supply Obligation, scaled by “System Balancing Ratio”, which is defined as the ratio of the total real time system load (System Load) to the Installed Capacity Requirement (ICR).
i. System Balancing Ratio = (System Load)/(ICR) ii. Required Performance = (CSO)*(System BR)
c. Resources receive a “Performance Incentive” based on their actual performance during the Scarcity Condition as compared to their required performance.
i. Solar Balancing Ratio = (MW Performance)/(MW Capacity Supply Obligation) ii. Payoff = [(Actual Performance MW) – (Required Performance MW)]*(Scarcity
Condition Duration hours)*(Payment Rate $/MWh) 1. This equation may also be written as: Payoff =[(Solar Balancing Ratio)-
(System Balancing Ratio)]*(Capacity Supply Obligation MWs)*(Scarcity Condition Duration hours)*(Payment Rate $/MWh)
2. If actual performance is greater than the required performance, this will yield a positive Performance Incentive Payment.
3. If actual performance is less than the required performance, this will yield a negative Performance Incentive Penalty.
4. If actual performance exactly equals the required performance, there will be no Performance Incentive payment or penalty.
d. If a resource has no Capacity Supply Obligation, the required performance is 0 MW at all times, but the resource may still earn a Performance Incentive payment for performing during Scarcity Conditions.

The Narragansett Electric Company d/b/a National Grid
RIPUC Docket No. 4676 In Re: Proposal to Bid Capacity of Customer-Owned DG Facilities
Into Forward Capacity Market Responses to the Division’s First Set of Data Requests
Issued on December 6, 2016 Attachment DIV 1-3(a)
Page 3 of 24
i. Payoff = (Actual Performance MW)*(Scarcity Condition Duration Hours)*(Payment Rate $/MWh)
e. Solar resources in this analysis will be qualified as Summer-Only resources i. The resources will only have a CSO during the summer months of June, July,
August. And September and will have no CSO during all other months 1. During Summer months, the resources will be required to perform and
receive Performance Incentive payments/penalties as described in 1.c.i. 2. During winter months, the resources will not have a CSO and will not be
required to perform, but may receive Performance Incentive payments as described in 1.d.i.
2. Evaluate Solar Performance a. Calculate the average monthly solar performance for four company-owned solar sites to
generate a proxy solar site using file “Attachment Division 1-3(b)”. i. Take monthly average of EPO data (raw production data) for each site
1. See rows 1 – 66 in tab “Monthly Performance Summary” ii. Take combined average of all four sites to get monthly performance for proxy
solar site 1. See rows 72 – 84 in tab “Monthly Performance Summary”
b. Calculate Summer Qualified Capacity2 values for each site, as well as the proxy site (See Tab “Summary” in file “Attachment Division 1-3(b)”).
i. This is the average seasonal performance during the hours of 14:00-18:00 in the months of June, July, August, and September
1. Note: performance is scaled by a factor of 4 because performance data is reported in 15 minute intervals and the unit is kWh
ii. Determines the size of Capacity Supply Obligation a solar resource may take on c. Calculate average monthly Solar Balancing Ratios for the four company-owned sites and
the proxy site. i. Take the ratio of the average monthly performance and the capacity supply
obligation for each site in each 15-minute interval.
2 As detailed in Division 1-10, ISO-NE determines summer qualified capacity for intermittent settlement-only resources based on the median of the net output of that resource during the summer reliability hours (hours ending 1400 through 1800). This analysis used a calculation of summer qualified capacity based on the mean production of each resource during the summer reliability hours for added conservatism, since this resulted in a lower qualified capacity value for the resources analyzed.

The Narragansett Electric Company d/b/a National Grid
RIPUC Docket No. 4676 In Re: Proposal to Bid Capacity of Customer-Owned DG Facilities
Into Forward Capacity Market Responses to the Division’s First Set of Data Requests
Issued on December 6, 2016 Attachment DIV 1-3(a)
Page 4 of 24
ii. See Rows 1- 74 in Tab “2. Monthly Balancing Ratios” in file “Attachment Division 1-3(b)”.
1. Solar Balancing Ratio = (MW Performance)/(MW Capacity Supply Obligation)
iii. Monthly Balancing Ratios also reported in “4.Monthly Solar BR” tab of “Attachment Division 1-3(c)”.
3. Map ISO-NE historic RCPF data from 1-minute interval format to 15-minute interval format a. This enables a direct comparison to historic 15-minute interval solar performance data
presented in Attachment Division 1-3(b). b. Map RCPF data from “2. Detail_sys_sim_jan10_apr14” tab to “3. System Scarcity
Condition BR” tab of file “Attachment Division 1-3(c)” i. The data mapped in this process is the system balancing ratio (BR) at each 15
minute interval of all RCPF events and will represent the system balancing ratio for Capacity Scarcity Conditions that would have occurred in the past.
1. System Balancing Ratios mapped from Column U in tab “2.Deyail_sys_sim_Jan10_apr14” into rows 2 - 1582 in tab “3. System Scarcity Condition BR”
ii. Scarcity Condition durations are rounded to nearest 15-minute interval. 4. Calculate seasonal frequency and distribution of On- and Off-Peak Scarcity Conditions and the
associated Performance Incentive payoffs under the Pay-for-Performance rules. a. Define Summer and Winter Seasons
i. Determined based on ISO-NE designation of seasons for intermittent resources 1. Summer season defined to be June – September 2. Winter season defined to be January – May and October – December
ii. Calculate the average Seasonal Solar Balancing Ratios3 for each 15-minute interval (See rows 79-81 in “4. Monthly Solar Balancing Ratios” Tab in file “Attachment Division 1-3(c)”).
1. Take the average monthly Solar Balancing Ratios for the months in each season.
a. Summer: Average of June – September monthly Solar Balancing Ratios.
3 Seasonal Balancing Ratios, as defined in this analysis, are the average solar Balancing Ratios (MW Performance/MW Capacity Supply Obligation) during the summer and winter seasons, respectively.

The Narragansett Electric Company d/b/a National Grid
RIPUC Docket No. 4676 In Re: Proposal to Bid Capacity of Customer-Owned DG Facilities
Into Forward Capacity Market Responses to the Division’s First Set of Data Requests
Issued on December 6, 2016 Attachment DIV 1-3(a)
Page 5 of 24
b. Winter: Average of January – May, October – December hourly monthly balancing ratios.
b. Determine On/Off-Peak Hours for Summer/Winter seasons See rows 85-93 in “4. Monthly Solar BR” Tab in file “Attachment Division 1-3(c)”)
i. On-peak hours4 defined (for purposes of this analysis) as the hours in which the seasonal Solar Balancing Ratio is greater than the average System Balancing Ratio.
1. Average system balancing ratio calculated by: a. Take the maximum balancing ratio that occurred in each hour
across the 4-year period of the RCPF event data set. i. For example, if there were multiple Scarcity Conditions
which occurred during hour ending 12:00, take the maximum Balancing Ratio of all of those events as the Balancing Ratio for hour ending 12:00
ii. See rows 3-7 in tab “5. On_Off Peak Performance” in file “Attachment Division 1-3(c)”.
b. Take the average of the max balancing ratio for all hours in which a Scarcity Condition occurred (exclude all hours in which no Scarcity Conditions occurred across the data period)
i. Ex: If there were Scarcity Conditions which occurred during the hours 12:00 – 15:00 and 16:00 – 17:00, and none during the other hours, take the average of the maximum BR during the hours 12:00 – 15:00 and 16:00 – 17:00 and exclude all other hours from the calculation
ii. See rows 10 – 19 in tab “5. On_Off Peak Performance” in file “Attachment Division 1-3(c)”.
2. Determine hours in which the average Seasonal Solar Balancing Ratio is greater than the average System Balancing Ratio for both Summer and Winter seasons.
a. This represents the hours in which the performance of the solar resource is greater than the required performance, thus resulting in a positive Performance Incentive Payment.
4 Note that the On-peak hours, as defined in this analysis, are different than the ISO-NE Summer Reliability Hours that are referenced in Division 1-10. The On-peak and Off-peak hours in this analysis define the period in which a solar resource is expected to be performing at or above

The Narragansett Electric Company d/b/a National Grid
RIPUC Docket No. 4676 In Re: Proposal to Bid Capacity of Customer-Owned DG Facilities
Into Forward Capacity Market Responses to the Division’s First Set of Data Requests
Issued on December 6, 2016 Attachment DIV 1-3(a)
Page 6 of 24
b. See cells AL83 through BR84 in tab “4. Monthly Solar BR” in “Attachment Division 1-3(c)”.
ii. Determine off-peak hours as all hours in which the Seasonal Solar Balancing Ratio is less than the average System Balancing Ratio.
1. Off-peak hours are all hours other than the on-peak hours determined in Section 3.b.i.
c. Determine average on- and off-peak solar balancing ratio i. See rows 85 – 93 in tab “4. Monthly Solar BR” in file “Attachment Division 1-
3(c)” ii. Calculate average solar BR during on-peak hours for summer and winter seasons
1. Summer: On-peak period from Hour Ending 8:45 – 16:45 2. Winter: On-peak period from Hour Ending 9:45 – 14:30
iii. Calculate average solar BR during off-peak hours for summer and winter seasons
1. Summer: Off-peak period from Hour Ending 0:15 – 8:30, 17:00 – 24:00 2. Winter: off-peak period from Hour Ending 0:15 – 9:30, 14:45 – 24:00
d. Determine the distribution of Summer/Winter On/Off-peak scarcity hours i. Calculate the sum of all system balancing ratios for each time interval for the
Summer and Winter seasons of each year (see rows 1613 – 1624 in tab “3. System Scarcity Condition BR” in “Attachment Division 1-3(c)”).
1. Define a new unit, the Balancing Ratio Hour (BRH) a. A BRH is defined as the product of the applicable System
Balancing Ratio or Solar Balancing Ratio, and the duration of the associated scarcity condition for that balancing ratio
i. One BRH represents a one-hour Scarcity Condition at a System Balancing Ratio or Solar Balancing Ratio of 1.0
ii. Ex: A Scarcity Condition with a Balancing Ratio of 1.0 which lasts for one hour and a Balancing Ratio of 0.5 which lasts for 2 hours would result in a total of 2 BRH
1. Total BRH = (1.0 BR)*(1 hrs)+(0.5 BR)*(2 hrs)= 2 BRH
b. This will allow Scarcity Condition durations to be counted in a common unit that is scaled for the magnitude of the applicable System Balancing Ratio or Solar Balancing Ratio, and will enable

The Narragansett Electric Company d/b/a National Grid
RIPUC Docket No. 4676 In Re: Proposal to Bid Capacity of Customer-Owned DG Facilities
Into Forward Capacity Market Responses to the Division’s First Set of Data Requests
Issued on December 6, 2016 Attachment DIV 1-3(a)
Page 7 of 24
a calculation of the distribution of net Performance Incentive payments/penalties that can be expected in a given year
2. Ex: For Summer 2010, to get the total BRH for the hour ending 12:00, take the sum of the balancing ratios for all Scarcity Conditions occurring during hour ending 12:00 for all days in the summer 2010 months
3. The aim is to get a distribution of the total Balancing Ratio Hours for each season/year in order to run a statistical simulation of the net difference in Solar Balancing Ratio Hours and System Balancing Ratio Hours
ii. Calculate the number of hours of on- and off-peak Scarcity Conditions that occur in each season after normalizing for differences in the magnitude of the Balancing Ratios during each event.
1. Define a new unit, the “balancing-ratio normalized scarcity hour” a. A “balancing ratio-normalized scarcity hour” (BRNH) is defined
in this analysis as the equivalent of one Scarcity Condition hour at the average on- and off-peak Seasonal Balancing Ratios
i. By normalizing the Scarcity Condition hours to account for variation in the magnitude of the associated Balancing Ratios, the Scarcity Condition hours be can be modeled as independently distributed homogenous events
ii. This allows Scarcity Condition to be treated consistently when used, along with solar balancing ratios, in the calculation of Performance Incentive payoffs
iii. The “balancing ratio normalized scarcity hours” represent the total Scarcity Condition hours that occur at a constant system balancing ratio
2. Take the sum of all BRH totals for each on/off-peak 15-minute interval for the summer season of each year
a. This will give the total of all BRHs for all scarcity conditions that occur in on- and off-peak periods for summer season each year
b. This will enable a calculation of the total hours of scarcity conditions in each year, normalized for the magnitude of the balancing ratio during the scarcity condition

The Narragansett Electric Company d/b/a National Grid
RIPUC Docket No. 4676 In Re: Proposal to Bid Capacity of Customer-Owned DG Facilities
Into Forward Capacity Market Responses to the Division’s First Set of Data Requests
Issued on December 6, 2016 Attachment DIV 1-3(a)
Page 8 of 24
c. See Rows 1614-1617 in tab “3.System Scarcity Condition BR” in file “Attachment Division 1-3(c)”
i. This shows the sum of the Balancing Ratios in each 15-minute interval of the summer seasons for each year
d. See Columns D and H in Rows 1646 – 1649 in Tab “3. System Scarcity Condition BR” in file “Attachment Division 1-3(c)”
i. These are the total On/Off-peak BRHs in the summer season of each year
ii. The sum of the balancing ratios is divided by four to convert from 15-minute intervals to hourly values
e. Note that only summer season BRHs are considered because the resources is qualified as a “Summer-Only” resource and has no Capacity Supply Obligation during the winter season. Thus, for the purpose of Performance Incentive payments, the system balancing ratio does not matter during winter months.
3. Calculate the Minimum off-peak balancing ratios for the Summer and Winter seasons
a. Take the minimum of the hourly system balancing ratios that occur during the off-peak periods for both seasons (See rows 16 – 19 in tab “5. On_Off Peak Performance” in file “Attachment Division 1-3(c)”)
b. This will be used to convert the total annual Off-peak BRHs to BRNHs in each year
i. The minimum system balancing ratio is used for off-peak calculations in order to provide a conservative revenue forecast which errs on the side of overstating the frequency of off-peak Scarcity Conditions (which result in PI penalties during off-peak periods) rather than understating it
1. A smaller System Balancing Ratio assumption will result in a larger number of Balancing Ratio Normalized Hours, and thus is a conservative estimate

The Narragansett Electric Company d/b/a National Grid
RIPUC Docket No. 4676 In Re: Proposal to Bid Capacity of Customer-Owned DG Facilities
Into Forward Capacity Market Responses to the Division’s First Set of Data Requests
Issued on December 6, 2016 Attachment DIV 1-3(a)
Page 9 of 24
4. Calculate the average of the maximum seasonal on/off-peak balancing ratios (See rows 10 – 13 in tab “5. On_Off peak Performance” in file “Attachment Division 1-3(c)”
a. Take the maximum balancing ratio for each time interval of the day for all days in the sample population
b. This will be used to convert the total annual On-peak BRHs to “system Balancing Ratio normalized scarcity hours” in each year
i. The average of the maximum balancing ratio is used for On-Peak events to provide a conservative forecast which errs on the side of understating the frequency of on-peak Scarcity Condition (which result in PI payments during On-Peak periods) rather than overstating it
5. Calculate the Summer Scarcity Condition hours, normalized for system balancing ratios
a. On-peak Scarcity Condition hour calculation i. Calculate the BRNHs for each 15-minute interval
1. The Summer Peak BRNHs are calculated for each 15-minute interval so that payoffs can be calculated in each 15-minute interval to be more precise.
a. Since On-Peak payoffs are based on the difference between solar balancing ratios and system balancing ratios, hourly payoffs are calculated to take account of the variation in magnitude of the solar balancing ratios (which vary with the time of day).
b. This will be used in conjunction with the 15-minute interval distribution of summer Solar Balancing Ratios to calculate hourly payoffs for the On-Peak summer season
2. See rows 1621 – 1624 in tab “3. System Scarcity Condition BR” in file “Attachment Division 1-

The Narragansett Electric Company d/b/a National Grid
RIPUC Docket No. 4676 In Re: Proposal to Bid Capacity of Customer-Owned DG Facilities
Into Forward Capacity Market Responses to the Division’s First Set of Data Requests
Issued on December 6, 2016 Attachment DIV 1-3(a)
Page 10 of 24
3(c)3” for the calculation of the Summer on-peak BRNHs
a. To calculate the BRNHs, divide the sum of the summer on-peak Balancing Ratios (in rows 1613-1617 of tab “3. System Scarcity Condition BR” in file “Attachment Division 1-3(c)”) by the average of the maximum on-peak balancing ratios, as detailed in Section 4.d.ii.4 of this document.
i. This value is then divided by 4 to convert from the sum of 15-minute interval balancing ratios to BRNHs, which are an hourly value.
b. Off-peak BRNH calculation i. Divide the total summer off-peak BRHs for each year by
the minimum off-peak system balancing ratio. 1. This yields a total of the “balancing ratio
normalized scarcity hours”, which represents the number of Scarcity Condition hours that occurred at a constant system balancing ratio for the summer Off-peak hours.
ii. See column E for Rows 1646-1649 of tab “3. System Scarcity Condition BR” in file “Attachment Division 1-3(c)”
iii. Calculate the average payoff for the Summer on- and off-peak Scarcity Condition hours
1. Note: As mentioned above, there is no Capacity Supply Obligation during the winter season. As such, there is no exposure to PI penalties from under/non-performance during Scarcity Condition in the winter season. There have also been no Scarcity Condition during winter months during the hours that are defined as “on-peak. As a result, winter Scarcity Condition are treated as having no value and no penalties, and do not need to be modeled.

The Narragansett Electric Company d/b/a National Grid
RIPUC Docket No. 4676 In Re: Proposal to Bid Capacity of Customer-Owned DG Facilities
Into Forward Capacity Market Responses to the Division’s First Set of Data Requests
Issued on December 6, 2016 Attachment DIV 1-3(a)
Page 11 of 24
2. Calculate the “payoff” for summer on- and off-peak Scarcity Conditions a. The “payoff” represents the average MWh of Performance
Incentive payments/penalties (Performance Incentive payments/penalties are assessed on a $/Mwh basis) that will result, per MW of CSO, from an on/off-peak Scarcity Condition during the summer
b. The payoff is defined, for both on and off-peak Scarcity Conditions, as the difference between the applicable solar BR and the system balancing ratio
i. Payoff (MWh per MW CSO) = [(Solar BR) – (System BR)]*(Scarcity Condition Duration)
ii. This represents the MWh of over or under-performance that will occur during a Scarcity Condition for each MW of CSO
iii. One Payoff-MWh represents one hour in which a resource with a 1 MW Capacity Supply Obligation earns a performance incentive payment or penaly at the performance incentive payment rate ($/MWh)
c. On-peak payoff i. The Solar Balancing Ratio is assumed to be the average
solar balancing ratio in the summer season for each hour of the day
1. See Row 1628 in tab “3. System Scarcity Condition BR” in file “Attachment Division 1-3(c)”
ii. The System Balancing Ratio is assumed to be the average of the maximum summer on-peak system Balancing Ratios
1. See Columns AL through BR of Row 1632 in tab “3. System Scarcity Condition BR” in file “Attachment Division 1-3(c)”
2. This is the same assumption for the system balancing ratio that is used in the calculation of the Summer On-peak BRNHs

The Narragansett Electric Company d/b/a National Grid
RIPUC Docket No. 4676 In Re: Proposal to Bid Capacity of Customer-Owned DG Facilities
Into Forward Capacity Market Responses to the Division’s First Set of Data Requests
Issued on December 6, 2016 Attachment DIV 1-3(a)
Page 12 of 24
a. The average of the maximum System Balancing Ratio in each hour is used over other representations of the System Balancing Ratio in an effort to be conservative. This will result in a lower payout during Summer On-Peak hours, thus resulting in a conservative estimate of Performance Incentive payments.
iii. The Summer On-Peak hourly payoff is calculated for each 15-minute interval
1. Payoff-Hours = [(Solar Balancing Ratio) – (System Balancing Ratio)]*(BRNHs)
a. See Rows 1638 – 1642 in tab “3. System Scarcity Condition BR” in file “Attachment Division 1-3(c)”
b. Note: 1 Payoff-hour represents one hour in which a resource earns a performance incentive payment or penalty, at the Performance Incentive Payment Rate ($/MWh). The payoff MWhs will be the product of the resource’s Capacity Supply Obligation MWs and the Payoff-hours.
c. Note: The Balancing Ratio Normalized Scarcity Hours represent the number of scarcity condition hours that occur at a standard balancing ratio. As a result this is appropriate variable to use to represent the number of hours in each season that Performance Incentive payments are received in the payoff calculation.
iv. Annual On-Peak Payoff totals calculated for each year 1. Sum of Hourly On-peak Payoff in each year

The Narragansett Electric Company d/b/a National Grid
RIPUC Docket No. 4676 In Re: Proposal to Bid Capacity of Customer-Owned DG Facilities
Into Forward Capacity Market Responses to the Division’s First Set of Data Requests
Issued on December 6, 2016 Attachment DIV 1-3(a)
Page 13 of 24
2. See column E of Rows 1654 – 1657 in tab “3. System Scarcity Condition BR” in file “Attachment Division 1-3(c)”
v. Average On-peak Payoff calculated as average payoff across the summer on-peak period for all years
1. The Average On-peak Payoff represents that average MWh
2. This is the payoff used to define the on-peak random variable that will be modeled in the coming sections
3. See cell E1658 in tab “3. System Scarcity Condition BR” in file “Attachment Division 1-3(c)”
d. Off-peak payoff multiplier i. The off-peak hours represent hours in which the solar
BR is less than the system BR. The solar resource will not be performing during a majority of these hours (nighttime hours). As a result, the Solar BR is assumed to be zero in these hours for the purpose of the payoff calculation.
1. Note that this is a conservative assumption and will maximize the magnitude of the Performance Incentive penalties that are calculated in each
ii. System balancing ratio assumed to be the average summer off-peak system BR
1. See cell B12 in tab “6. Summary Stats” in file “Attachment Division 1-3(c)”
iii. The payoff multiplier will be applied to the number of Summer Off-peak scarcity hours in a given year to convert from system BR normalized scarcity hours to payoff-hours
1. This will eventually be used to calculate Performance Incentive payments/penalties

The Narragansett Electric Company d/b/a National Grid
RIPUC Docket No. 4676 In Re: Proposal to Bid Capacity of Customer-Owned DG Facilities
Into Forward Capacity Market Responses to the Division’s First Set of Data Requests
Issued on December 6, 2016 Attachment DIV 1-3(a)
Page 14 of 24
2. See cell B18 in tab “6. Summary Stats” in file “Attachment Division 1-3(c)”
iv. Create random variables representing the frequency/payoff of summer on/off-peak Scarcity Condition in a given year
1. Create two random variables which represent the number of on-peak summer and off-peak summer Payoff Hours in a given year, to be paid at the Performance Incentive Rate
a. Define a “Payoff Hour” as one hour of performance paid at the Performance Incentive Payment Rate.
i. A resource with a Capacity Supply Obligation of 1 MW that is exposed to 1 Payoff Hour would receive a payment that is calculated as follows:
1. Payment = (1 Payoff Hour)*(1 MW)*(Payment Rate $/MWh) = 1*(Payment Rate)
b. See tab “7. Random Variables” in file “Attachment Division 1-3(c)”.
c. The random variables are assumed to have a Poisson distribution
i. The assumption of a Poisson distributed random variable is valid because the following characteristics apply:
1. The random variable represents the number of events that occur in a specified time interval (number of Scarcity Condition hours in a summer)
2. The events are assumed to be independent (the occurrence of one Scarcity Condition does not affect the probability of or time until the next event)
3. The number of Scarcity Condition hours is bounded below by zero
ii. The Poisson random variables are distributed such that 1. X ~ Pois(λ) 2. X = number of Scarcity Condition hours in one
year

The Narragansett Electric Company d/b/a National Grid
RIPUC Docket No. 4676 In Re: Proposal to Bid Capacity of Customer-Owned DG Facilities
Into Forward Capacity Market Responses to the Division’s First Set of Data Requests
Issued on December 6, 2016 Attachment DIV 1-3(a)
Page 15 of 24
3. λ = Expected value of Scarcity Condition hours d. For the Off-Peak random variable, apply the “payoff multiplier”
to the random variable representing the Summer Off-peak BRNHs to obtain a random variable representing Payoff Hours
i. The payoff multiplier is only used for the Off-Peak random variable, as the On-Peak random variable already accounts for the payoff (see section 4.d.iii.2.c above)
ii. See column D of rows 4-6 in tab “7. Random Variables” in file “Attachment Division 1-3(c)”
e. Take the sum of the random variables representing on/off-peak Payoff Hours to get the total annual Payout Hours
i. This “Payoff Hour Random Variable” represents the number of “Payoff Hours” in a given year that will be paid at the Performance Incentive Payment Rate
1. A “Payoff Hour” value of “1” would be equivalent to one hour of performance paid at the Performance Incentive Payment Rate
2. A positive value indicates that there will be a positive payment for the associated number of MWh’s
3. A negative value indicates that there will be a negative penalty for the associated number of MWh’s
ii. See cell D7 of tab “7. Random Variabls” in file “Attachment Division 1-3(c)”
v. Run Monte-Carlo Simulation with 10,000 trials to obtain distribution of the random variable representing total summer Payoff Hours in a year
1. See Tab “8. Monte Carlo Sim” in file “Attachment Division 1-3(c)” for simulation results
2. See summary of results in rows 9-12 in tab “7. Random Variables” in file “Division 1-3(c)”
a. The mean value represents the expected value of the number of “Payoff Hours”

The Narragansett Electric Company d/b/a National Grid
RIPUC Docket No. 4676 In Re: Proposal to Bid Capacity of Customer-Owned DG Facilities
Into Forward Capacity Market Responses to the Division’s First Set of Data Requests
Issued on December 6, 2016 Attachment DIV 1-3(a)
Page 16 of 24
b. The 99% Lower Confidence Bound represents the lower bound of the number of Payoff Hours that would occur 1% of the time (99% of the time the Performance Hours will be higher than this value)
i. This is determined by taking the value in the histogram of the Monte Carlo simulation for which the frequency that the simulation value is less than or equal to this value is 1%
1. See Columns H through L for rows 4-25 on tab “8. Monte Carlo Sim” in file “Attachment Division 1-3(c)”
2. Summing the frequency of values less than or equal to -2 (99% lower confidence bound) yields a frequency of 1%
c. The 99% Upper Confidence Bound represents the upper bound of the number of Payoff Hours that would occur 1% of the time (99% of the time the Performance Hours will be less than this value)
i. This is determined by taking the value in the histogram of the Monte Carlo simulation for which the frequency that the simulation value is greater than or equal to this value is 1%
1. See Columns H through L for rows 4-25 on tab “8. Monte Carlo Sim” in file “Attachment Division 1-3(c)”
2. Summing the frequency of values greater than or equal to -2 (99% upper confidence bound) yields a frequency of 1%
5. Calculate projected cash flow a. Develop a forecast of qualified capacity
i. Projected solar capacity development based on the historic and targeted enrollment schedule of solar DG facilities associated with the RE Growth and DGSC programs
1. Forecast filtered for criteria that only solar projects with a nameplate capacity greater than 250 kW DC will be qualified, as referenced on

The Narragansett Electric Company d/b/a National Grid
RIPUC Docket No. 4676 In Re: Proposal to Bid Capacity of Customer-Owned DG Facilities
Into Forward Capacity Market Responses to the Division’s First Set of Data Requests
Issued on December 6, 2016 Attachment DIV 1-3(a)
Page 17 of 24
page 13, line 10 of the pre-filed testimony of Stefan Nagy and Scott McCabe.
a. See tab “2. Forecast Capacity” in Attachment Division 1-3(d) for the forecast of solar DG capacity from the RE Growth and DG SC programs.
2. The following assumptions are made about the capacity forecast a. The RE Growth program will develop solar DG facilities in
accordance with the program enrollment targets outlined in rows 35-40 of tab “2. Forecast Capacity” of Attachment Division 1-3(d).
b. Enrolled solar capacity stops growing after 2019 and installed solar capacity stops growing after 2021
c. DGSC projects that will be developed have constructed or contracted, as detailed in Attachment Division 1-4-1.
d. Solar DG facilities have a useful life of 25 years e. Summer Qualified Capacity is equal to 35% of nameplate
capacity 3. Installed/qualified capacity is forecasted out through 2046 (useful life of
installations through 2021) ii. Apply conversion factor Capacity forecast to convert projected installed capacity
to projected Summer Qualified Capacity through 2036 (See columns F, H, and J of tab “2. Forecast Capacity
iii. Projects are assumed to be qualified only after completed 1. The following timeline applies:
a. Year 1: Project is installed and becomes commercially operational.
b. Year 2: Project is qualified in June for participation in the Forward Capacity Auction in Year 3.
c. Year 3: Project is bid into the Forward Capacity Auction to acquire a Capacity Supply Obligation for delivery in year 6. Project is also bid into the Annual Reconfiguration Auction in March to acquire a Capacity Supply Obligation for delivery in June of Year 3.

The Narragansett Electric Company d/b/a National Grid
RIPUC Docket No. 4676 In Re: Proposal to Bid Capacity of Customer-Owned DG Facilities
Into Forward Capacity Market Responses to the Division’s First Set of Data Requests
Issued on December 6, 2016 Attachment DIV 1-3(a)
Page 18 of 24
d. Year 4: Project is bid into the Annual Reconfiguration Auction in March to acquire a Capacity Supply Obligation for delivery in June of Year 4.
e. Year 5: Project is bid into the Annual Reconfiguration Auction in March to acquire a Capacity Supply Obligation for delivery in June of Year 5.
f. Year 6: Project delivered to meet Capacity Supply Obligation from participation in the Forward Capacity Auction in Year 3.
g. Ex: Project installed in 2016 would be qualified in 2017, bid into the Forward Capacity Auction in 2018 and delivered in June, 2021. Additionally, the resource would take on obligations through the reconfiguration auctions beginning in 2018
i. See Cells C5, E5, F10, G10, and L7 in tab “4.1 Cash Flow Total Portfolio” of Attachment Division 1-3(d).
1. The calculation methodology in tabs “4.2 Cash Flow RE Growth” and “4.3 Cash Flow DGSC” is identical to those in tab “4.1 Cash Flow Total Portfolio”, with the exception of the portfolio size (MW of capacity) and administrative costs.
2. Capacity Supply Obligation (from FCA) set equal to summer qualified capacity
a. See Column G of tab “4.1 Cash Flow Total Portfolio” of Attachment Division 1-3(d) for the projected portfolio Capacity Supply Obligation from solar DG facilities associated with the RE Growth and DGSC programs.
3. Capacity Supply Obligations from Reconfiguration Auction are set equal to cumulative summer qualified capacity (from three years forward), less the incremental capacity supply obligation taken in the FCA in that year
a. Ex: Reconfiguration Auction Capacity Supply Obligation in 2018 set equal to the cumulative qualified capacity in 2021, less the incremental capacity supply obligation taken in 2018
b. This functions to monetize all qualified capacity and removes capacity from being counted in the Reconfiguration Auction once it has an obligation from the Forward Capacity Auction

The Narragansett Electric Company d/b/a National Grid
RIPUC Docket No. 4676 In Re: Proposal to Bid Capacity of Customer-Owned DG Facilities
Into Forward Capacity Market Responses to the Division’s First Set of Data Requests
Issued on December 6, 2016 Attachment DIV 1-3(a)
Page 19 of 24
c. See column L in tab “4.1 cash Flow Small Portfolio” iv. Projected FCA price set at $11.640/kW-month
1. This represents the Net Cost of New Entry (Net CONE) for FCA-11, as referenced on page 25, line 2 of the pre-filed testimony of Stefan Nagy and Scott McCabe.
2. See column H in Tab “4.1 Cash Flow Total Portfolio” in file “Attachment Division 1-3(d)”
v. Projected Reconfiguration Auction price taken as the average Annual Reconfiguration Auction clearing price, through the ARA1 auction for Commitment Period 2018-2109, of $3.628/kW-month.
1. See column L in Tab “4.1 Cash Flow Total Portfolio” in “Attachment Division 1-3(d)”
vi. Performance Incentive Payment Projections 1. Performance Incentive payment projections are based on the
distribution of Scarcity Condition “Payoff Hours” based on the Monte Carlo simulation conducted in Attachment Division 1-3(c) (See section 4.d.v above)
2. Base case Performance Incentive Projection a. Represents the expected value of PI payments, as referenced on
page 24, line 1 of the pre-filed testimony of Stefan Nagy and Scott McCabe, and illustrated in Schedule NG-4.
i. See “Expected Value ($/MW-year)” in row 10 of tab “1. Summary Stats” of “Attachment Division 1-3(d)”
b. Calculated based on the mean Scarcity Condition Payoff Hours from the Monte-Carlo Simulation
i. Performance Incentives are calculated as: 1. PI = (Payoff Hours)*(Payment Rate)*(MW CSO)
ii. See rows 14-17 of tab “1. Summary Stats” of Attachment Division 1-3(d).
c. See annual revenue calculation in column P of Tab “4.1. Cash Flow Total” in file “Attachment Division 1-3(d)”
i. The Capacity Supply Obligation in this equation represents the sum of the Capacity Supply Obligation from the Forward Capacity Auction (see column G of tab “4.1. Cash Flow Total”) and from the Annual

The Narragansett Electric Company d/b/a National Grid
RIPUC Docket No. 4676 In Re: Proposal to Bid Capacity of Customer-Owned DG Facilities
Into Forward Capacity Market Responses to the Division’s First Set of Data Requests
Issued on December 6, 2016 Attachment DIV 1-3(a)
Page 20 of 24
Reconfiguration Auction (see column L of tab “4.1. Cash Flow Total”).
3. Lower Bound Scenario a. See “99% Confidence - Lower Bound ($/MW-year)” in row 11 of
tab “1. Summary Stats” of file “Division 1-3(d)” b. This scenario represents the lower bound of the 99% confidence
interval from the Monte Carlo Simulation i. 99% of the time, the annual net performance incentives
will be greater than the lower bound scenario and 1% of the time the annual performance incentives will be less than or equal to the lower bound scenario
ii. Determined by the distribution of Scarcity Condition hours (See cell P5 of tab “8. MonteCarlo Sim” in Attachment Division 1-3(c) and cell B16 of Tab “1. Summary Stats” in Attachment Division 1.3.(d)).
1. Note that the Monte Carlo simulation presented in Attachment Division 1-3(c) yielded a value of approximately -2 for the 99% confidence interval lower bound. This value was manually adjusted to -3 for the cash flow analysis in Attachment Division 1-3(d) in order to account for the potential of a more extreme downside risk in the sensitivity analysis.
c. Performance Incentives are calculated as: i. Performance Incentive = (Payoff Hours)*(Performance
Incentive Payment Rate)*(MW CSO) d. See annual revenue calculation in column Q of Tab “4.1. Cash
Flow Total Portfolio” in Attachment Division 1-3(d) 4. Upper Bound Scenario (See “99% Confidence - Upper Bound ($/MW-
year)” in row 12 of tab “Summary Stats” of Attachment Division 1-3(d) a. This scenario represents the upper bound of the 99%
confidence interval i. 99% of the time, the annual net performance incentives
will be less than the upper bound scenario and 1% of
The Narragansett Electric Company d/b/a National Grid
RIPUC Docket No. 4676 In Re: Proposal to Bid Capacity of Customer-Owned DG Facilities
Into Forward Capacity Market Responses to the Division’s First Set of Data Requests
Issued on December 6, 2016 Attachment DIV 1-3(a)
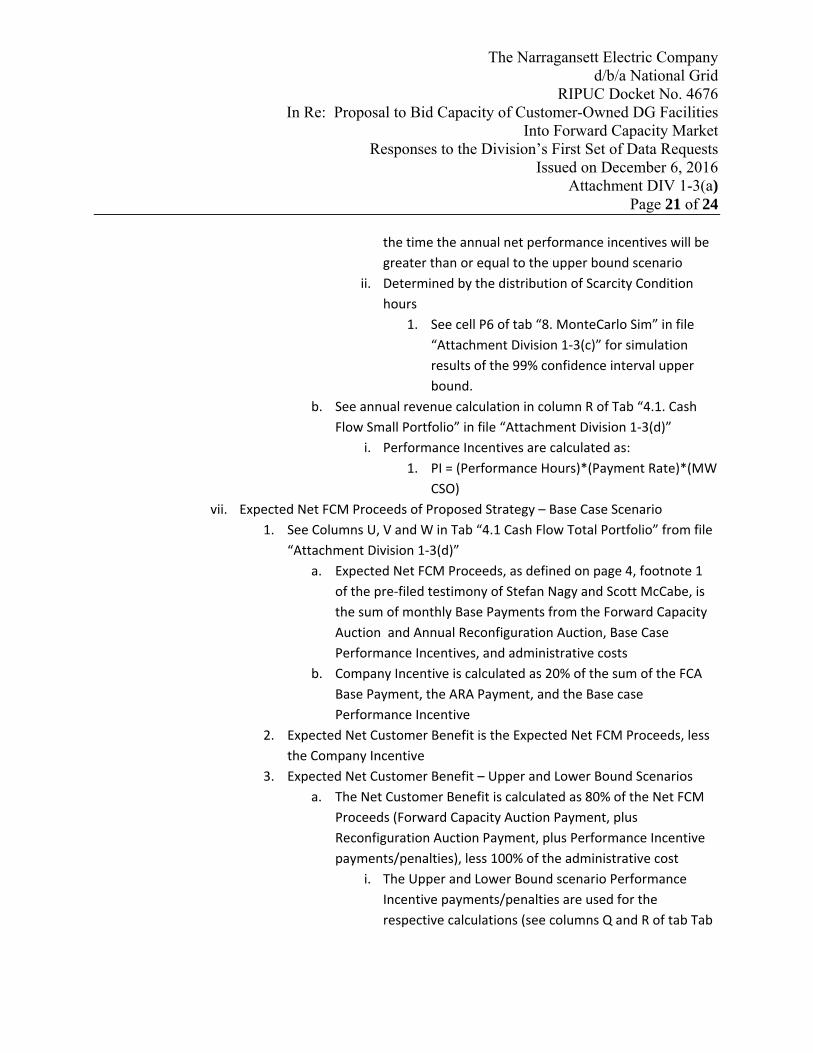
Page 21 of 24
the time the annual net performance incentives will be greater than or equal to the upper bound scenario
ii. Determined by the distribution of Scarcity Condition hours
1. See cell P6 of tab “8. MonteCarlo Sim” in file “Attachment Division 1-3(c)” for simulation results of the 99% confidence interval upper bound.
b. See annual revenue calculation in column R of Tab “4.1. Cash Flow Small Portfolio” in file “Attachment Division 1-3(d)”
i. Performance Incentives are calculated as: 1. PI = (Performance Hours)*(Payment Rate)*(MW
CSO) vii. Expected Net FCM Proceeds of Proposed Strategy – Base Case Scenario
1. See Columns U, V and W in Tab “4.1 Cash Flow Total Portfolio” from file “Attachment Division 1-3(d)”
a. Expected Net FCM Proceeds, as defined on page 4, footnote 1 of the pre-filed testimony of Stefan Nagy and Scott McCabe, is the sum of monthly Base Payments from the Forward Capacity Auction and Annual Reconfiguration Auction, Base Case Performance Incentives, and administrative costs
b. Company Incentive is calculated as 20% of the sum of the FCA Base Payment, the ARA Payment, and the Base case Performance Incentive
2. Expected Net Customer Benefit is the Expected Net FCM Proceeds, less the Company Incentive
3. Expected Net Customer Benefit – Upper and Lower Bound Scenarios a. The Net Customer Benefit is calculated as 80% of the Net FCM
Proceeds (Forward Capacity Auction Payment, plus Reconfiguration Auction Payment, plus Performance Incentive payments/penalties), less 100% of the administrative cost
i. The Upper and Lower Bound scenario Performance Incentive payments/penalties are used for the respective calculations (see columns Q and R of tab Tab

The Narragansett Electric Company d/b/a National Grid
RIPUC Docket No. 4676 In Re: Proposal to Bid Capacity of Customer-Owned DG Facilities
Into Forward Capacity Market Responses to the Division’s First Set of Data Requests
Issued on December 6, 2016 Attachment DIV 1-3(a)
Page 22 of 24
“4.1. Cash Flow Total Portfolio” of “Attachment Division 1-3(d)”)
ii. The Forward Capacity Auction payment is the base FCA payment (see column N of tab Tab “4.1. Cash Flow Total Portfolio” of “Attachment Division 1-3(d)”)
b. See Columns X and Y in Tab “4.1. Cash Flow Total Portfolio” of “Attachment Division 1-3(d)” for the calculation of the Expected Net Customer Benefit for the Upper and Lower Bound Scenarios.
viii. Sensitivity Case Expected Revenue 1. A sensitivity case was developed using an assumption of a relatively low
Forward Capacity Auction price of $3.99/kW-month, as detailed on page 25, line 9 of the pre-filed testimony of Stefan Nagy and Scott McCabe.
a. This calculation follows the same logic as the “Expected Net Customer Benefit”, only using the lower FCA price
b. There are also Sensitivity Case - Upper and Lower Bound Scenarios using the Upper and Lower Bound Performance Incentive payments, combined with the sensitivity case Forward Capacity Auction price
c. See Columns Z, AA, and AB in tab “4.1. Cash Flow Small Portfolio” of Attachment Division 1-3(d).
ix. Revenue calculations for RE Growth and DGSC program portfolios 1. The revenue calculations for the RE Growth and DGSC programs,
respectively, follow the same logic and apply the same formulas as the calculations that are outlined above for the Total Portfolio in tab “4.1 Cash Flow Portfolio” of Attachment Division 1-3(d).
2. The portfolio MWs in the cash flow analysis for the RE Growth and the DGSC portfolios are based on the respective program enrollment schedules that are laid out for each program in tab “2. Forecast Capacity” in Attachment Division 1-3(d).
3. The administrative costs of the total portfolio are allocated to the RE Growth and DGSC portfolios based on the respective proportion of the total portfolio MWs that each program contributes in each year.

The Narragansett Electric Company d/b/a National Grid
RIPUC Docket No. 4676 In Re: Proposal to Bid Capacity of Customer-Owned DG Facilities
Into Forward Capacity Market Responses to the Division’s First Set of Data Requests
Issued on December 6, 2016 Attachment DIV 1-3(a)
Page 23 of 24
4. For the detailed calculation of the RE Growth and DGSC portfolio cash flows, see tabs “4.2 Cash Flow RE Growth” and “4.3 Cash Flow DGSC” of attachment Division 1-3(d).
a. See column T in tabs “4.2 Cash Flow RE Growth” and “4.3 Cash Flow DGC” for the administrative cost allocation calculations.
x. No CSO option 1. A second strategy, the Alternative Market Participation strategy, was
also modeled. Under this strategy, which is detailed on page 15 line 9 of the pre-filed testimony of Stefan Nagy and Scott McCabe, the resources are not bid into the FCM (so no Capacity Supply Obligation is acquired), but performance is reported for the purpose of obtaining Performance Incentive payments
i. PI payments are based on the average solar performance during historic scarcity conditions. An average $/kW-month value is calculated by:
1. Take the average solar performance during Scarcity Condition and convert to $ of Performance Incentive payments at the initial payment rate of $2000/MWh
a. See rows 2-1584 in tab “9. Detailed PI Payment – No CSO” in Attachment Division 1-3(c))
2. Average Performance incentive payment per day is converted to an average payment rate in $/kW-month of CSO
a. Payments in tab “9. Detailed PI Payment – No CSO” in Attachment Division 1-3(c)) are based on the average performance of the 4 solar sites that were modeled for this analysis
b. The average payment per day is converted to $/month and divided by the average qualified capacity kW of the four solar sites that were modeled

The Narragansett Electric Company d/b/a National Grid
RIPUC Docket No. 4676 In Re: Proposal to Bid Capacity of Customer-Owned DG Facilities
Into Forward Capacity Market Responses to the Division’s First Set of Data Requests
Issued on December 6, 2016 Attachment DIV 1-3(a)
Page 24 of 24
to give a payment rate in $/kW-month per kW of qualified capacity
c. Performance Incentive Payment rate $/kW-month = (Avg. daily scarcity performance MWh)*[(365 days/year)/(12 months/year)]*(Payment Rate $/MWh)/(Summer Capacity kW)
d. See Rows 1586 – 1595 in tab “Detailed PI Payment – No CSO” in file “Attachment Division 1-3(c)”)
ii. See Columns S and AC in tab “4.1 Cash Flow Small Portfolio” in file “Attachment Division 1-3(d)” for calculation of performance incentive payments
1. Performance Incentive $/kW-month in column S are scaled up to grow over time as the Performance Incentive payment rate increases
a. The initial payment rate was calculated assuming the starting Performance Incentive Payment rate of $2000/MWh.
b. As the Performance Incentive Payment Rate increases, the payment rate calculation is scaled by the ratio of the new Performance Incentive Payment rate to the initial rate of $2000/MWh
i. Ex: Initial Performance Incentive Payment Rate = $2000/MWh, Performance Incentive Payment Rate in 2024 = $5455/MWh
ii. Payment Rate scaling factor in 2024 = ($5455/MWh)/($2000/MWh)
b. For summary results of the cash flow analysis, please refer to rows 40-48 in columns B-F of tab “4.1 Cash Flow Total Portfolio” in Attachment Division 1-3(d).

The Narragansett Electric Company d/b/a National Grid
RIPUC Docket No. 4676 In Re: Proposal to Bid Capacity of Customer-Owned DG Facilities
Into Forward Capacity Market Responses to the Division’s First Set of Data Requests
Issued on December 6, 2016
Prepared by or under the supervision of: Corinne M. DiDomenico
Division 1-4
Request: Please provide a list of all facilities for which the company will seek to monetize capacity. For each such facility please provide the following information
a. the name of the facility b. it’s location c. it’s owner d. it’s date of commercial operation e. it’s nameplate capacity f. it’s ISO New England asset ID g. an explanation of how facility is metered or is the functional equivalent of a stand-
alone generator. Response: Please refer to Attachment DIV 1-4 for a list of the DG Standard Contracts Program facilities for which the Company will seek to monetize capacity. In addition, the Company plans to qualify and bid non-residential solar facilities with a nameplate capacity of at least 250 KW that are participating in the Renewable Energy Growth Program. The Company used the Renewable Energy Growth Program enrollment targets as estimates in its November 21, 2016 Proposal to Bid Capacity of Customer-Owned DG Facilities into the Forward Capacity Market. Please refer to the Company’s response to Division 1-19 for a discussion of the assumptions underlying the estimates of the capacity portfolio for DG Facilities associated with the RE Growth Program. Please also refer to Tab 2 of Attachment DIV 1-3(d) for the underlying data supporting these projections.

DG Standard Contracts Program Facilities For Which The Company Will Seek to Monetize Capacity
Facility Name Location Owner
Commercial Operation Date
(Actual for Historical; Estimated for Future)
Nameplate Capacity
(MW)
ISO New England Asset
ID
Facility Meter/Generator Explanation
28 Jacome Way Middletown, RIACP Land, LLC
7/18/2013 0.5 43527Stand-alone generator with
bi-directional meters
Plain Meeting House Power West Greenwich, RI Con Edison Development, Inc 7/19/2013 2 43512Stand-alone generator with
bi-directional meters
Forbes Street Solar East Providence, RI Forbes Street Solar, LLC 12/20/2013 3.71 43762Stand-alone generator with
bi-directional meters
West Davisville Solar North Kingstown, RI
Assignee:WR-TGC Solar Generation VI LLC
Assignor: Nexamp Capital, LLC
12/6/2013 2.34 43716Stand-alone generator with
bi-directional meters
Comtram Cable Plant Cumberland, RI Altus Power Funds RI I, LLC 9/30/2013 0.499 43586Stand-alone generator with
bi-directional meters
CCI New England 500kW Portsmouth, RI CoxCom, LLC 10/25/2013 0.498 43607Stand-alone generator with
bi-directional meters
100 Dupont Solar Providence, RI
Assignee:Altus Power America, LLC
Assignor:Soltas Energy Corporation
3/25/2014 1.5 44003Stand-alone generator with
bi-directional meters
0 Martin Solar Cumberland, RI
Assignee:Altus Power America, LLC
Assignor:Soltas Energy Corporation
3/27/2014 0.5 44005Stand-alone generator with
bi-directional meters
225 Dupont Solar Providence, RI
Assignee:Altus Power America, LLC
Assignor:Soltas Energy Corporation
3/25/2014 0.3 44004Stand-alone generator with
bi-directional meters
35 Martin Solar Cumberland, RI
Assignee:Altus Power America, LLC
Assignor:Soltas Energy Corporation
3/27/2014 0.5 44006Stand-alone generator with
bi-directional meters
All American Foods Solar North Kingstown, RI
Assignee:All American Solar LLC
Assignor:All American Foods, Inc.
10/24/2014 0.331 46721Stand-alone generator with
bi-directional meters
Brickle Group Solar Project North Smithfield, RI NextSun Energy North Smithfield, LLC 12/4/2014 1.084 46911Stand-alone generator with
bi-directional meters
The Narragansett Electric Company d/b/a National Grid RIPUC Docket No. 4676 Attachment DIV 1-4 Page 1 of 2

Facility Name Location Owner
Commercial Operation Date
(Actual for Historical; Estimated for Future)
Nameplate Capacity
(MW)
ISO New England Asset
ID
Facility Meter/Generator Explanation
Gannon & Scott Solar Cranston, RI Golden Ale Realty, LLC 4/29/2014 0.406 44010Stand-alone generator with
bi-directional meters
Johnston Solar I Johnston, RI Johnston Solar I, LLC 8/3/2015 1.7 47357Stand-alone generator with
bi-directional meters
Nexamp 76 Stilson Rd Richmond, RIName Change:
Nexamp Richmond Solar, LLC toRichmond Solar, LLC
2/28/2015 0.498 47020Stand-alone generator with
bi-directional meters
North Kingstown Solar 1720 Davisville Rd North Kingstown, RI North Kingstown Solar 1, LLC 10/20/2015 0.5 47487Stand-alone generator with
bi-directional meters
Foster Solar - 23 Theodore Foster Drive Foster, RI Foster Solar, LLC 9/8/2016 1.25 48774Stand-alone generator with
bi-directional meters
Wilco 260 South County Trail Exeter, RI WILCO Development, LLC 8/11/2016 1.246 48664Stand-alone generator with
bi-directional meters
Brookside Equestrian Center - 90 Tifft Rd North Smithfield, RI
Assignee: WGL Energy Systems, Inc.fka Washington Gas Energy Systems, Inc.
Assignor: Brandywick, LLC
10/19/2016 1.246 48899Stand-alone generator with
bi-directional meters
Nippawus Solar, LLC North Kingstown, RI Nippawus Solar, LLC 6/17/2017 1.25 Not ApplicableStand-alone generator with
bi-directional meters
Smart Technologies Energy North Smithfield, RI Smart Technologies Energy 6/30/2017 1.043 Not ApplicableStand-alone generator with
bi-directional meters
Note: The Company has made a correction to the projected portfolio size of the solar DG facilities associated with the DG Standard Contracts Program. The original portfolio projection, which was incorporated in the Company’s pre-filed testimony, had erroneously included two solar DG facilities that have a nameplate capacity of 181 kW and 182 kW, respectively. This resulted in the projected portfolio size being adjusted from the initial estimate of 23.264 MW to the revised estimate of 22.901 MW.
The Narragansett Electric Company d/b/a National Grid RIPUC Docket No. 4676 Attachment DIV 1-4 Page 2 of 2

The Narragansett Electric Company d/b/a National Grid
RIPUC Docket No. 4676 In Re: Proposal to Bid Capacity of Customer-Owned DG Facilities
Into Forward Capacity Market Responses to the Division’s First Set of Data Requests
Issued on December 6, 2016
Prepared by or under the supervision of: Stefan Nagy
Division 1-5
Request: Have any of the facilities for which the Company will seek to monetize capacity been qualified to receive or have received capacity revenues from ISO New England previously? If so, please identify the facility and the approximate dates of such qualification and / or revenues received. Response: None of the facilities for which the Company will seek to monetize capacity have been previously qualified to receive capacity revenues from ISO-NE. As referenced in response to Division 1-1 and Division 1-2, the Company has the exclusive right to monetize the capacity of facilities associated with the RE Growth and DGSC programs, and has not previously qualified any of these projects in the FCM.

The Narragansett Electric Company d/b/a National Grid
RIPUC Docket No. 4676 In Re: Proposal to Bid Capacity of Customer-Owned DG Facilities
Into Forward Capacity Market Responses to the Division’s First Set of Data Requests
Issued on December 6, 2016
Prepared by or under the supervision of: Stefan Nagy
Division 1-6
Request: Has the company ever qualified any resource to participate in ISO New England’s capacity market? If so, please identify the resource and provide the approximate date of the qualification. Response: The Company has qualified resources in all Forward Capacity Auctions since the inception of the FCM. The Company has previously qualified Energy Efficiency1, Combined Heat and Power2, and hydropower3 resources in the FCM. Please refer to page 1 of Attachment 1-6 for a detailed list of resources that the Company has qualified to participate in the FCM. The Company’s affiliate, Massachusetts Electric Company, has also qualified Energy Efficiency and Combined Heat and Power resources in every auction since the inception of the FCM. In addition, Massachusetts Electric Company has also qualified solar DG4 resources. Page 2 of Attachment DIV 1-6 shows the Massachusetts Electric Company resources that have qualified in the FCM.
1 The Energy Efficiency resources that the Company has qualified in the FCM are comprised of measures funded through the Company’s annual Energy Efficiency Program Plans. 2 The Combined Heat and Power resources that the Company has qualified in the FCM are comprised of distributed Combined Heat and Power projects that have received funding through the Company’s annual Energy Efficiency Program Plans. 3 The hydropower facility, Thundermist Hydropower, receives service as a Qualifying Facility, as defined in 16 U.S.C. §796(18)(A) and 18 CFR 292.203. 4 The solar DG resources qualified in the FCM are owned by the Company’s affiliate, Massachusetts Electric Company.

The Narragansett Electric Companyd/b/a National Grid
Docket No. 4676Attachment DIV 1-6
Page 1 of 2
Resource Name Project Name Technology Qualification Type*Initial
Qualification DateForward Capacity
Auction (FCA)
ngrid_ri_fca1_eeodr Energy Efficiency New Resource Jun-2006 FCA-1ngrid_ri_fca2_eeodr Energy Efficiency Incremental Increase Jun-2007 FCA-2ngrid_ri_fca3_eeodr Energy Efficiency Incremental Increase Jun-2008 FCA-3ngrid_ri_fca4_eeodr Energy Efficiency Incremental Increase Jun-2009 FCA-4ngrid_ri_fca5_eeodr Energy Efficiency Incremental Increase Jun-2010 FCA-5ngrid_ri_fca6_eeodr Energy Efficiency Incremental Increase Jun-2011 FCA-6ngrid_ri_fca7_eeodr Energy Efficiency Incremental Increase Jun-2012 FCA-7ngrid_ri_fca8_eeodr Energy Efficiency Incremental Increase Jun-2013 FCA-8ngrid_ri_fca9_eeodr Energy Efficiency Incremental Increase Jun-2014 FCA-9ngrid_ri_fca10_eeodr Energy Efficiency Incremental Increase Jun-2015 FCA-10ngrid_ri_fca11_eeodr Energy Efficiency Incremental Increase Jun-2016 FCA-11
Thundermist Hydropower Thundermist Hydropower Hydropower New Resource Jun-2011 FCA-6RI CHP FCA8 Combined Heat and Power New Resource Jun-2014 FCA-8ri_chp_fca11 Combined Heat and Power Incremental Increase Jun-2016 FCA-11
ngrid_ri_fca1_eeodr
RI CHP
Narragansett Electric Company FCM Resource Qualification Summary (2006-2016)
* New Resources represent capacity resources that have never previously been qualified in the FCM. Incremental Increases represent an incremental increase to the qualified capacity of a resource that previously qualified in the FCM as a New Resource. For Energy Efficiency and Combined Heat and Power resources, multiple facilities may be aggregated within a single resource. As such, new projects are qualified in the FCM as incremental increases to an existing capacity resource, if one exists.

The Narragansett Electric Companyd/b/a National Grid
Docket No. 4676Attachment DIV 1-6
Page 2 of 2
Resource Name Project Name Technology Qualification Type*Initial
Qualification DateForward Capacity
Auction (FCA)
ngrid_nema_fca1_eeodr Energy Efficiency New Resource Jun-2006 FCA-1ngrid_nema_fca2_eeodr Energy Efficiency Incremental Increase Jun-2007 FCA-2ngrid_nema_fca3_eeodr Energy Efficiency Incremental Increase Jun-2008 FCA-3ngrid_nema_fca4_eeodr Energy Efficiency Incremental Increase Jun-2009 FCA-4ngrid_nema_fca5_eeodr Energy Efficiency Incremental Increase Jun-2010 FCA-5ngrid_nema_fca6_eeodr Energy Efficiency Incremental Increase Jun-2011 FCA-6ngrid_nema_fca7_eeodr Energy Efficiency Incremental Increase Jun-2012 FCA-7ngrid_nema_fca8_eeodr Energy Efficiency Incremental Increase Jun-2013 FCA-8ngrid_nema_fca9_eeodr Energy Efficiency Incremental Increase Jun-2014 FCA-9ngrid_nema_fca10_eeodr Energy Efficiency Incremental Increase Jun-2015 FCA-10ngrid_nema_fca11_eeodr Energy Efficiency Incremental Increase Jun-2016 FCA-11ngrid_sema_fca1_eeodr Energy Efficiency New Resource Jun-2006 FCA-1ngrid_sema_fca2_eeodr Energy Efficiency Incremental Increase Jun-2007 FCA-2ngrid_sema_fca3_eeodr Energy Efficiency Incremental Increase Jun-2008 FCA-3ngrid_sema_fca4_eeodr Energy Efficiency Incremental Increase Jun-2009 FCA-4ngrid_sema_fca5_eeodr Energy Efficiency Incremental Increase Jun-2010 FCA-5ngrid_sema_fca6_eeodr Energy Efficiency Incremental Increase Jun-2011 FCA-6ngrid_sema_fca7_eeodr Energy Efficiency Incremental Increase Jun-2012 FCA-7ngrid_sema_fca8_eeodr Energy Efficiency Incremental Increase Jun-2013 FCA-8ngrid_sema_fca9_eeodr Energy Efficiency Incremental Increase Jun-2014 FCA-9ngrid_sema_fca10_eeodr Energy Efficiency Incremental Increase Jun-2015 FCA-10ngrid_sema_fca11_eeodr Energy Efficiency Incremental Increase Jun-2016 FCA-11ngrid_wcma_fca1_eeodr Energy Efficiency New Resource Jun-2006 FCA-1ngrid_wcma_fca2_eeodr Energy Efficiency Incremental Increase Jun-2007 FCA-2ngrid_wcma_fca3_eeodr Energy Efficiency Incremental Increase Jun-2008 FCA-3ngrid_wcma_fca4_eeodr Energy Efficiency Incremental Increase Jun-2009 FCA-4ngrid_wcma_fca5_eeodr Energy Efficiency Incremental Increase Jun-2010 FCA-5ngrid_wcma_fca6_eeodr Energy Efficiency Incremental Increase Jun-2011 FCA-6ngrid_wcma_fca7_eeodr Energy Efficiency Incremental Increase Jun-2012 FCA-7ngrid_wcma_fca8_eeodr Energy Efficiency Incremental Increase Jun-2013 FCA-8ngrid_wcma_fca9_eeodr Energy Efficiency Incremental Increase Jun-2014 FCA-9ngrid_wcma_fca10_eeodr Energy Efficiency Incremental Increase Jun-2015 FCA-10ngrid_wcma_fca11_eeodr Energy Efficiency Incremental Increase Jun-2016 FCA-11
Hilldale Ave Haverhill PV NGrid PV Haverhill Solar New Resource Jun-2009 FCA 4Main Street Whitinsville PV NGrid PV Whitinsville Solar New Resource Jun-2009 FCA 4Railroad Street Revere PV NGrid PV Revere Solar New Resource Jun-2009 FCA 4Rover Street Everett PV NGrid PV Everett Solar New Resource Jun-2009 FCA 4Victory Road Dorchester PV NGrid PV Dorchester Solar New Resource Jun-2009 FCA 4
WCMA CHP FCA8 Combined Heat and Power New Resource Jun-2013 FCA-8WCMA CHP FCA9 Combined Heat and Power Incremental Increase Jun-2014 FCA-9NEMA CHP FCA9 Combined Heat and Power New Resource Jun-2014 FCA-9NEMA CHP FCA10 Combined Heat and Power Incremental Increase Jun-2015 FCA-10
Ngrid_SEMA_CHP SEMA CHP FCA10 Combined Heat and Power New Resource Jun-2015 FCA-1017 Kelly Rd Sturbridge PV NGrid PV Sturbridge Solar New Resource Jun-2015 FCA-1024 Boutilier Rd Leicester PV NGrid PV Leicester Solar New Resource Jun-2015 FCA-1029 Oxford Rd Charlton PV NGrid PV Charlton Solar New Resource Jun-2015 FCA-1040 Auburn Rd Millbury PV NGrid PV Millbury Solar New Resource Jun-2015 FCA-1090 River Rd Sturbridge PV NGrid PV Sturbridge 2 Solar New Resource Jun-2015 FCA-10Carpenter Hill Rd Charlton PV NGrid PV Charlton 2 Solar New Resource Jun-2015 FCA-10Groton Road Shirley PV NGrid PV Shirley Solar New Resource Jun-2015 FCA-10Blossom Rd 1 Fall River PV NGrid PV Fall River 1 Solar New Resource Jun-2016 FCA-11Blossom Rd 2 Fall River PV NGrid PV Fall River 2 Solar New Resource Jun-2016 FCA-11RichardsonAve Attleboro PV 2 NGrid Attleboro PV Solar New Resource Jun-2016 FCA-11Frank Mossberg Dr Attleboro PVNGrid Attleboro PV2 Solar New Resource Jun-2016 FCA-11Groton School Rd Ayer PV 2 NGrid Ayer PV Solar New Resource Jun-2016 FCA-11Groveland St Abington PV NGrid PV Abington Solar New Resource Jun-2016 FCA-11Old Upton Rd Grafton PV 2 NGrid Grafton PV Solar New Resource Jun-2016 FCA-11Stafford St Leicester PV 2 NGrid PV Leicester Solar New Resource Jun-2016 FCA-11
* New Resources represent capacity resources that have never previously been qualified in the FCM. Incremental Increases represent an incremental increase to the qualified capacity of a resource that previously qualified in the FCM as a New Resource. For Energy Efficiency and Combined Heat and Power resources, multiple facilities may be aggregated within a single resource. As such, new projects are qualified in the FCM as incremental increases to an existing capacity resource, if one exists.
NEMA CHP
Massachusetts Electric Company FCM Resource Qualification Summary (2006-2016)
ngrid_nema_fca1_eeodr
ngrid_sema_fca1_eeodr
ngrid_wcma_fca1_eeodr
WCMA CHP

The Narragansett Electric Company d/b/a National Grid
RIPUC Docket No. 4676 In Re: Proposal to Bid Capacity of Customer-Owned DG Facilities
Into Forward Capacity Market Responses to the Division’s First Set of Data Requests
Issued on December 6, 2016
Prepared by or under the supervision of: Stefan Nagy
Division 1-7
Request: Is the company aware of the resource requirements for participating in ISO-NE’s Forward Capacity Market? For example, a resource that obtains a capacity obligation is obligated to offer in the energy market. Therefore; the company needs to have the infrastructure in place to do so. Please identify all the requirements, explain how the company plans to meet them, and provide estimates of the cost of fulfilling these requirements. Response: The Company is familiar with all requirements for participating in the FCM and outlined the major requirements on page 18, lines 1-4 of the Company’s pre-filed testimony. As Lead Market Participant for the resources in the FCM, the Company would submit: (1) resource qualification materials;1 (2) Renewable Technology Resource elections;2 (3) Forward Capacity Auction bids; (4) Reconfiguration Auction bids, if applicable; (5) Delist bids, if applicable; (6) quarterly critical path schedule updates; (7) monthly performance data; and (8) seasonal audit requests. The Company’s initial bidding strategy, as outlined in the response to Division 1-10, is to qualify solar DG Facilities as Intermittent Settlement Only Resources in the FCM and acquire a Capacity Supply Obligation for those resources. Under ISO-NE’s current market rules, Intermittent
1 Resource qualification for new capacity resources requires the submission of two information packages to ISO-NE, which includes: (1) the New Capacity Show of Interest Form; and (2) the New Capacity Qualification Package. The New Capacity Show of Interest Form requires the submission of initial project initial project information to ISO-NE. The New Capacity Qualification Package requires the submission of, among other things, detailed project information, critical path schedule, proposed level of qualified capacity, and proposed offer prices for the Forward Capacity Auction. The New Capacity Show of Interest Form and the New Capacity Qualification Package are described in detail in Section III.13.1.1.2. of the ISO New England Inc. Transmission, Markets, and Services tariff at https://www.iso-ne.com/participate/rules-procedures/tariff. 2 A capacity resource qualifies as a Renewable Technology Resource, as defined in detail in Section III.13.1.1.1.7 of the ISO New England Inc. Transmission, Markets, and Services tariff, if it qualifies as a renewable energy resource under a state-mandated renewable portfolio standard in New England and receives revenue through a state- or federally-regulated rate. Resources that qualify as Renewable Technology Resources must elect this designation upon receipt of notification of qualification for the Forward Capacity Auction. Resources that are designated as Renewable Technology Resources are exempt from ISO-NE’s the New Resource Offer Floor Price and may submit offers in the Forward Capacity Auction as price-takers, at a price of $0.00/kW-month. In lieu of the Renewable Technology Resource exemption, solar resources would be required to offer in the Forward Capacity Auction at the auction starting price, effectively eliminate any chance of those resources clearing in the auction to receive a Capacity Supply Obligation.
The Narragansett Electric Company d/b/a National Grid
RIPUC Docket No. 4676 In Re: Proposal to Bid Capacity of Customer-Owned DG Facilities
Into Forward Capacity Market Responses to the Division’s First Set of Data Requests
Issued on December 6, 2016
Prepared by or under the supervision of: Stefan Nagy
Division 1-7, page 2 Settlement Only Resources3 have no obligation, and in fact are not permitted, to submit energy supply offers4 in the Day-Ahead Energy Market or Real-Time Energy Market. The Company, as evidenced by its successful participation in all prior Forward Capacity Auctions with a variety of resource types, has the expertise and infrastructure in place to meet all of the requirements associated with participation in the FCM. The Company noted on page 27, line 8 of the Company’s pre-filed testimony that it has estimated that managing the Company’s initial FCM portfolio would require one to two incremental full-time equivalent (FTEs) resources, either employees or contractors, at an aggregate cost of between $138,390 and $276,780 per year. At this time the Company does not anticipate a need for incremental infrastructure or start-up administrative costs. However, as noted on page 28, line 17 of the Company’s pre-filed testimony, should the Company incur any start-up or other infrastructure costs as a result of the Company’s participation in the FCM, the Company will include such costs in the Recovery and Reconciliation Factors for the RE Growth and DGSC programs. In the event that ISO-NE’s market rules change to create additional requirements for future participation in the FCM, the Company will re-evaluate its market participation strategy and update it accordingly. To the extent that future market rule changes create the need for additional infrastructure or resources and, as a result, create additional administrative expenses, the Company will evaluate such changes and the level of costs to implement them, and if cost-effective to do so, will make the changes, incur the costs, and include such costs in the Recovery and Reconciliation Factors for the RE Growth and DGSC programs.
3 Intermittent Settlement Only Resources are resources whose production and availability are intermittent, as a result of the characteristics of the fuel source (i.e., solar), and are not centrally dispatched and monitored by ISO-NE in real time. 4 Please refer to Section III.13.6.1.4. of the ISO New England Inc. Transmission, Markets, and Services tariff for a detailed description of requirements for Intermittent Settlement-Only Resources regarding energy market supply offers.

The Narragansett Electric Company d/b/a National Grid
RIPUC Docket No. 4676 In Re: Proposal to Bid Capacity of Customer-Owned DG Facilities
Into Forward Capacity Market Responses to the Division’s First Set of Data Requests
Issued on December 6, 2016
Prepared by or under the supervision of: Stefan Nagy
Division 1-8
Request: Please explain in detail how the company plans to meet any Financial Assurance obligations required by the ISO for the participation of these assets to the Forward Capacity Market. Provide estimates of the cost of fulfilling these obligations. Response: The Company posts collateral with ISO-NE each year in the form of a Letter of Credit on behalf of The Narragansett Electric Company, which covers any financial assurance requirements that the Company may have as a result of its participation in the ISO-NE markets. Additionally, the Company’s initial strategy, as outlined in the Company’s response to Division 1-10, will be to qualify DG Facilities in the FCM only once they are Commercially Operational. In this case, the Company expects that it will be able to have the FCM resources deemed commercially operational prior to or shortly after ISO-NE’s financial assurance deadlines, limiting the Company’s financial assurance associated with these DG Facilities in the FCM. As a result, the Company does not anticipate that there will be any incremental cost of fulfilling its financial assurance obligations to ISO-NE as a result of its participation in the FCM with the DG Facilities associated with the RE Growth and DGSC programs. However, to the extent that there is a cost from fulfilling the Financial Assurance requirements associated with the implementation of the Company’s FCM Proposal, the Company will include such costs in the Recovery and Reconciliation Factors for the RE Growth and DGSC programs.

The Narragansett Electric Company d/b/a National Grid
RIPUC Docket No. 4676 In Re: Proposal to Bid Capacity of Customer-Owned DG Facilities
Into Forward Capacity Market Responses to the Division’s First Set of Data Requests
Issued on December 6, 2016
Prepared by or under the supervision of: Stefan Nagy
Division 1-9
Request: Does the company plan to offer only existing resources, or will it also offer resources under development? If the latter, please explain how will the company mitigate any risks related to facilities failing to meet their Critical Path Schedule timeline? Response: The Company’s initial strategy, which is referenced on page 19, line 11 of the Company’s pre-filed testimony, is to qualify DG Facilities in the FCM only after they are commercially operational. This strategy is intended to eliminate the risk that proposed resources may not meet critical path schedule deadlines and/or never become commercially operational.

The Narragansett Electric Company d/b/a National Grid
RIPUC Docket No. 4676 In Re: Proposal to Bid Capacity of Customer-Owned DG Facilities
Into Forward Capacity Market Responses to the Division’s First Set of Data Requests
Issued on December 6, 2016
Prepared by or under the supervision of: Stefan Nagy
Division 1-10
Request: Regarding page 23, line 19, please provide the company’s FCM bidding strategy. Response: The Company’s initial FCM participation strategy, which is outlined on page 14, line 14, of the Company’s pre-filed testimony, is to bid the capacity of non-residential solar DG Facilities, which have an AC nameplate capacity of at least 250 kW, into the FCM and assume a Capacity Supply Obligation for those facilities. Each solar DG Facility will be qualified as a Summer-Only Intermittent Settlement-Only Resource. As defined in Section III.13.1.2.2.2.1. of the ISO New England Inc. Transmission, Markets, and Services tariff (“ISO-NE Tariff”), ISO-NE determines the Summer Qualified Capacity1 for existing Intermittent Settlement-Only Resources based upon the median of the net output of the resource in the Summer Intermittent Reliability Hours2 of the five most recent summer periods. ISO-NE will qualify new Intermittent Power Resources at the level proposed by the project sponsor, subject to a review by ISO-NE pursuant to Section III.13.1.1.2.4 of the ISO-NE Tariff. If a new or existing Intermittent Settlement-Only Resource is not yet commercially operational and has no historic summer production data available, ISO-NE will use the measured site-specific data (such as solar irradiance data) and projected production data submitted in the New Resource Qualification Package3 to verify the proposed level of qualification for the resource. The Company’s initial strategy will seek to qualify each resource at the level of capacity determined by ISO-NE’s default qualification methodology for existing Intermittent Settlement-Only Resources. The Company will conduct a review of the projected and available historic production data for each resource that it seeks to qualify in the FCM. In the event that the Company’s analysis determines that a facility cannot consistently deliver at or above its default qualified capacity value due to systemic outages or underperformance, the Company may request a lower qualified capacity value or withhold the facility from bidding in the FCM until further analysis shows that it can consistently deliver capacity to meet a Capacity Supply Obligation.
1 Summer Qualified Capacity refers to the amount of capacity that a resource in the FCM may bid in the Forward Capacity Auction for the months of June, July, August, and September, as determined by ISO-NE. 2 The Summer Reliability Hours for an Intermittent Settlement-Only Resource are defined in section III.13.1.2.2.2.1(c). of the ISO-NE Tariff as the hours ending 1400 through 1800 in each day of the months June through September. 3 The requirements of the New Resource Qualification Package are outlined in the Company’s response to Division 1-7.

The Narragansett Electric Company d/b/a National Grid
RIPUC Docket No. 4676 In Re: Proposal to Bid Capacity of Customer-Owned DG Facilities
Into Forward Capacity Market Responses to the Division’s First Set of Data Requests
Issued on December 6, 2016
Prepared by or under the supervision of: Stefan Nagy
Division 1-10, page 2 The Company’s initial strategy will seek to offer4 the capacity of DG Facilities in the Forward Capacity Auctions at a price that would result in a positive Net Customer Benefit, as detailed in the Company’s response to Division 1-12. The Company estimates that a price of $1.042/kW-month represents the Company’s revenue requirement for participation in the FCM due to estimated ongoing administrative costs and Performance Incentive payments, and would achieve, on average, a positive Net Customer Benefit. The Company intends to submit an election to designate solar DG Facilities as Renewable Technology Resources, as referenced in the Company’s response to Division 1-7, in order to enable solar resources to offer into the Forward Capacity Auction at a price below the auction starting price.5 The Company’s FCM Proposal, as referenced on page 14, line 1, of the Company’s pre-filed testimony, represents the Company’s initial bidding strategy and is not intended to limit the manner in which it may choose to participate in the FCM with DG Facilities, including technologies other than solar. The Company will periodically evaluate its bidding strategy and will make adjustments to the strategy as necessary.
4 An “offer price” in the FCM represents the minimum price for which a resource would accept a Capacity Supply Obligation, and is set based on submitting a De-List bid at that price, as outlined in the Company’s response to Division 1-22. If the auction price clears at a price above the minimum offer price, the resource will receive a Capacity Supply Obligation at that higher auction clearing price. If the auction clears at a price below the minimum offer price, the resource will be removed from the auction and will not receive a Capacity Supply Obligation. 5 The lowest historic Forward Capacity Auction clearing price was $2.951/kW-month. As stated in the Company’s pre-filed testimony at page 11, the clearing price for FCA 10 was set at $7.03/kW-month. As such, the Company expects that offering into the Forward Capacity Auction at a lower price will effectively offer DG Facilities into the auction as price-takers.

The Narragansett Electric Company d/b/a National Grid
RIPUC Docket No. 4676 In Re: Proposal to Bid Capacity of Customer-Owned DG Facilities
Into Forward Capacity Market Responses to the Division’s First Set of Data Requests
Issued on December 6, 2016
Prepared by or under the supervision of: Stefan Nagy
Division 1-11
Request: Please explain how the company will determine the level of capacity for which a Capacity Supply Obligation will be sought for each resource or facility contemplated under this program. Response: The Company’s initial strategy, as outlined in the Company’s response to Division 1-10, will seek to qualify each resource at the level of capacity determined by ISO-NE’s default qualification methodology for existing Intermittent Settlement-Only Resources, which sets the level of capacity based upon the median of the net output of that resource in the Summer Intermittent Reliability Hours. The Company will conduct a review of the projected and historic production data for each resource that it seeks to qualify in the FCM. In the event that the Company’s analysis determines that a facility cannot consistently deliver at or above its default qualified capacity value due to systemic outages or underperformance, the Company may request a lower qualified capacity value or withhold the facility from bidding into the FCM until further analysis shows that it can consistently deliver capacity to meet a Capacity Supply Obligation.

The Narragansett Electric Company d/b/a National Grid
RIPUC Docket No. 4676 In Re: Proposal to Bid Capacity of Customer-Owned DG Facilities
Into Forward Capacity Market Responses to the Division’s First Set of Data Requests
Issued on December 6, 2016
Prepared by or under the supervision of: Stefan Nagy
Division 1-12
Request: How will the offer price to the Forward Capacity Auction be determined for these resources? Please provide all the assumptions used to develop the price. Response: The Company’s initial strategy, as outlined in the Company’s response to Division 1-10, will seek to offer resources in the Forward Capacity Auction at a price of $1.042/kW-month.1 The offer price is based on the FCM net revenue requirement resulting from the ongoing administrative costs and sets the offer price such that the FCM base payments, which result from acquiring a Capacity Supply Obligation, will cover the estimated ongoing administrative costs and Performance Incentive payments. At this offer price, it is expected that resources with a Capacity Supply Obligation will result in a Net Customer Benefit that is positive once the portfolio has reached a steady state, as defined in footnote 11 on page 16 of the Company’s pre-filed testimony. The calculation of the Company’s offer price is detailed in rows 52-58 on tab “4.1 Cash Flow Total Portfolio” of Attachment DIV 1-3(d) and sets the minimum offer price such that the expected Net Customer Benefit is equal to zero, as outlined in equations (1), (2), and (3) as follows: (1) Net Customer Benefit = 0.8 x (Net FCM Proceeds) – (Admin cost) Where: (2) Net FCM Proceeds = (FCM Base Payment) + (Performance Incentive) - (other ISO-NE
fees/expenses) (3) FCM Base Payment = (MW Capacity Supply Obligation) x (Forward Capacity Auction
price($/kW-month)) x (1000 kW/MW) x (4 month Capacity Supply Obligation)
1 An “offer price” in the FCM represents the minimum price for which a resource would accept a Capacity Supply Obligation, and is set based on submitting a De-List bid at that price, as detailed in the Company’s response to Division 1-22. If the auction clears at a price above the minimum offer price, the resource will receive a Capacity Supply Obligation at that higher auction clearing price. If the auction clears at a price below the minimum offer price, the resource will be removed from the auction and will not receive a Capacity Supply Obligation.

The Narragansett Electric Company d/b/a National Grid
RIPUC Docket No. 4676 In Re: Proposal to Bid Capacity of Customer-Owned DG Facilities
Into Forward Capacity Market Responses to the Division’s First Set of Data Requests
Issued on December 6, 2016
Prepared by or under the supervision of: Stefan Nagy
Division 1-12, page 2 The Company’s FCM proposal outlines the Company’s initial bidding strategy and is not intended to limit the manner in which it may choose to participate in the FCM with DG Facilities, including technologies other than solar. The Company will periodically evaluate its bidding strategy, including the Company’s initial offer price outlined above, and will make adjustments to the strategy as necessary.
The Narragansett Electric Company d/b/a National Grid
RIPUC Docket No. 4676 In Re: Proposal to Bid Capacity of Customer-Owned DG Facilities
Into Forward Capacity Market Responses to the Division’s First Set of Data Requests
Issued on December 6, 2016
Prepared by or under the supervision of: Stefan Nagy
Division 1-13
Request: Regarding page 13, line 9 of the company’s pre-filed testimony, please provide the basis for the 35% figure shown. Response: The Company has analyzed the average generating capacity of four FCM qualified solar facilities owned by the Company’s affiliate Massachusetts Electric Company (see Attachment DIV 1-3(b)), and has determined that applying an estimated 35% capacity factor to a facility’s nameplate capacity is a simplifying assumption that the Company can use to assess the facility’s qualified capacity. The Company’s detailed analysis of the historic production data is presented in Attachment DIV 1-3(a) and Attachment DIV 1-3(b).1 The actual qualified capacity values for individual resources may vary and the assumption that solar DG Facilities will qualify at 35% of the nameplate AC capacity is a simplifying assumption that was made for the Company’s initial analysis of its projected capacity portfolio. The level at which the Company will propose to qualify DG Facilities in the FCM will be based on each facility’s projected or historic production data, as outlined in the Company’s response to Division 1-11. As such, there may be facilities that the Company proposes to qualify at capacity values that are larger or smaller than the estimated 35% of the facilities’ nameplate capacity values.
1 As referenced in the Company’s response to Division 1-10, solar DG Facilities will be qualified in the FCM as Summer-Only Intermittent Settlement-Only Resources and the Summer Qualified Capacity of Intermittent Settlement-Only Resources will be based on the median production of the resource during Summer Reliability Hours.

The Narragansett Electric Company d/b/a National Grid
RIPUC Docket No. 4676 In Re: Proposal to Bid Capacity of Customer-Owned DG Facilities
Into Forward Capacity Market Responses to the Division’s First Set of Data Requests
Issued on December 6, 2016
Prepared by or under the supervision of: Stefan Nagy
Division 1-14
Request:
Regarding page 16, line 16 of the company’s pre-filed testimony, please provide the basis and all supporting documentation for the 1.5% probability figure shown. Response: The Company has estimated that, after mitigating certain risks and assuming careful management of the FCM portfolio, once the portfolio has reached a steady state, there is less than a 1.5% probability of realizing negative Net FCM Proceeds,1 as a result of Performance Incentive penalties, on annual basis. This estimate is based on the results of the Company’s simulations of the annual Performance Incentive payments or penalties that would result from the participation of solar DG Facilities in the FCM. The Company’s calculation of the 1.5% probability is based on a calculation of the threshold number of Payoff Hours2 that would result in negative Net FCM Proceeds. The probability of this threshold number of Payoff Hours occurring in a given year was determined based on the probability distribution of annual Payoff Hours that was generated through the Company’s Monte Carlo simulations.3 The Company’s analysis estimated that this probability is between 0.20% and 1.11%. This probability range was simplified in the Company’s testimony to state that this probability is estimated to be less than 1.5%.
1 Please note that the Company’s analysis of the probability of realizing Net FCM Proceeds assumes a capacity price of $3.399/kW-month, which is modeled in the Company’s Sensitivity Case, as outlined on page 25 of the Company’s pre-filed testimony. 2 A Payoff Hour represents a combination of the number of hours in which Capacity Scarcity Conditions occur, the Balancing Ratio during those events, and the performance of solar facilities during those events, and is used in the Company’s Monte Carlo modeling to determine the amount of performance incentive payments or penalties that a resource will receive. A Payoff Hour, as defined in Section 4.d.iv.1.a. of Attachment DIV 1-3(a), is calculated as one hour of performance at a resource’s Capacity Supply Obligation, paid at the Performance Incentive Payment rate ($/MWh). For example, a resource with a 1 MW Capacity Supply Obligation in a year with one Payoff Hour and a Payment rate of $2,000/MWh, would receive a payment based on the following equation : Payment = (1MW)*(1 Hour)*($2000/MWh) = $2,000. Note that a positive value for Payoff Hours represents a Performance Incentive Payment, while a negative value represents a Performance Incentive Penalty. 3 A Monte Carlo simulation, as referenced in the Company’s pre-filed testimony at page 25, is a statistical simulation technique that uses repeated sampling of a random variable to obtain a distribution of numerical results. The Company used this technique to estimate the revenue and risk exposure associated with the Pay for Performance structure.

The Narragansett Electric Company d/b/a National Grid
RIPUC Docket No. 4676 In Re: Proposal to Bid Capacity of Customer-Owned DG Facilities
Into Forward Capacity Market Responses to the Division’s First Set of Data Requests
Issued on December 6, 2016
Prepared by or under the supervision of: Stefan Nagy
Division 1-14, page 2 Please refer to tab 8 of the Excel file of Attachment DIV 1-3(c) for the results of the Company’s Monte Carlo simulation. Please refer to rows 22-27 on tab 1 of the Excel file of Attachment DIV 1-3(d) for the calculation of the threshold number of Payoff Hours and the associated probability. For a detailed outline of the methodology behind the Company’s analysis in Attachment DIV 1-3(c) and Attachment DIV 1-3(d), please refer to Attachment DIV 1-3(a).

The Narragansett Electric Company d/b/a National Grid
RIPUC Docket No. 4676 In Re: Proposal to Bid Capacity of Customer-Owned DG Facilities
Into Forward Capacity Market Responses to the Division’s First Set of Data Requests
Issued on December 6, 2016
Prepared by or under the supervision of: Stefan Nagy
Division 1-15
Request:
Regarding page 17, lines 1-2 of the companies pre-filed testimony, please provide the basis for the statement scarcity conditions have historically occurred in the summer. Also provide any information in the company’s possession that show when all scarcity conditions occurred in the last five years. Response: The Company’s statement on page 17 of the Company’s pre-filed testimony was meant not to imply that Capacity Scarcity Conditions only occur during the summer months. Rather, it was meant to convey that when Scarcity Conditions occur during the summer months,1 they typically occur during daytime hours in which solar would be producing energy. The Company’s analysis of the occurrence of Capacity Scarcity Conditions, and the resulting Performance Incentive payments or penalties that would accrue to a solar resource that has a Capacity Supply Obligation in the FCM, was based on historic data from a simulation study that ISO-NE has published on the occurrence of Reserve Constraint Penalty Factor2 (RCPF) events in the time period spanning January 2010 through April 2014, as described in Section C on page 4 of Attachment DIV 1-15(a). During this time period, the simulation showed that approximately 51% of the RCPF events occurred during the summer months and that all of the events that occurred during the summer months occurred between hours ending 1100 and 1800. The Company’s analysis of the occurrence of Capacity Scarcity Conditions, and the resulting Performance Incentive payments or penalties that would accrue to solar resources is outlined in detail in Attachment DIV 1-3(a) and presented in Attachments DIV 1-3(b), DIV 1-3(c), and DIV 1-3(d). The data set that ISO-NE published on the occurrence of RCPF events is outlined in Attachment DIV 1-15(a) and presented in Attachment DIV 1-15(b). The portion of the data presented in Attachment DIV 1-15 (b) that was used in the Company’s analysis is also presented
1 Please note that, as outlined in Division 1-10, solar DG Facilities will qualify in the FCM as Summer-Only Intermittent Settlement-Only resources that only have Capacity Supply Obligations during the months of June, July, August, and September. 2 The Pay-for-Performance rules, and the resulting definition of Capacity Scarcity Conditions, as referenced on page 15, line 7 of the Company’s pre-filed testimony will not go into effect until June 2018. As a result, there is no historic data on actual “Capacity Scarcity Conditions.” The historic data from ISO-NE that is incorporated into this analysis identifies the historic activations of Reserve Constraint Penalty Factors, as detailed in Attachment Division 1-15(a). RCPF events will serve as the trigger for Capacity Scarcity Conditions under the Pay for Performance rules and are a good proxy for when Capacity Scarcity Conditions would have occurred in the past had the Pay-for-Performance rules been in place at that time.

The Narragansett Electric Company d/b/a National Grid
RIPUC Docket No. 4676 In Re: Proposal to Bid Capacity of Customer-Owned DG Facilities
Into Forward Capacity Market Responses to the Division’s First Set of Data Requests
Issued on December 6, 2016
Prepared by or under the supervision of: Stefan Nagy
Division 1-15, page 2 on pages 1 and 2 of Attachment DIV 1-3(c). ISO-NE has also published a data set for the RCPF Events that occurred in the period spanning May, 2015 through September, 2016, and is presented in Attachment DIV 1-15(c).

memo
ISO New England Inc.
One Sullivan Road, Holyoke, MA 01040-2841
www.iso-ne.com T 413 535 4000
To: NEPOOL Market Participants
From: Market Development
Date: May 16, 2014 (updated on May 21 to correct typo in table 4, page7)
Subject: Operating Reserve Deficiency Information – Historical Data – Updated
In March 2013, as part of the FCM Performance Incentives subject at the NEPOOL Market
Committee, the ISO provided historical data from 2007 to 2012 on real-time reserve deficiencies
indicated by the ISO’s dispatch and pricing system.
Recently a number of market participants have contacted the Internal Market Monitor (“IMM”)
requesting that the historical data be updated. These requests were made in the context of assessing the
impact of the ISO’s FCM Pay for Performance proposal on the formulation their De-list Bids or New
Supply Offers in the FCM. In response to participant requests, this memorandum, and an
accompanying data file, provides updated data through April 2014.
This memorandum offers a high-level summary of the main information contained in the data, and
provides some key statistics on reserve deficiencies. The final portion of this memo offers guidance on
using the Excel data file for participants interested in conducting additional analyses. The Excel-format
data file contains detailed event-level information on real-time activations of reserve constraint penalty
factors and related system conditions from 2007 to the present.
Summary Information and Statistics
This section presents summary statistics on the following conditions:
The number of hours per year the ISO has experienced activations of Reserve Constraint
Penalty Factors (RCPF) historically, under both current and prior RCPF values;
When RCPF activation events have occurred, by time of day and by season;
Duration of RCPF activation events, under current RCPF values;
Values of the system balancing ratio during these events. This statistic is germane to the
ISO’s FCM Performance Incentives proposal.
First, some essential background on reserve requirements that may help interpret the data.
The Narragansett Electric Company d/b/a National Grid RIPUC Docket No. 4676 Attachment DIV 1-15(a) Page 1 of 8
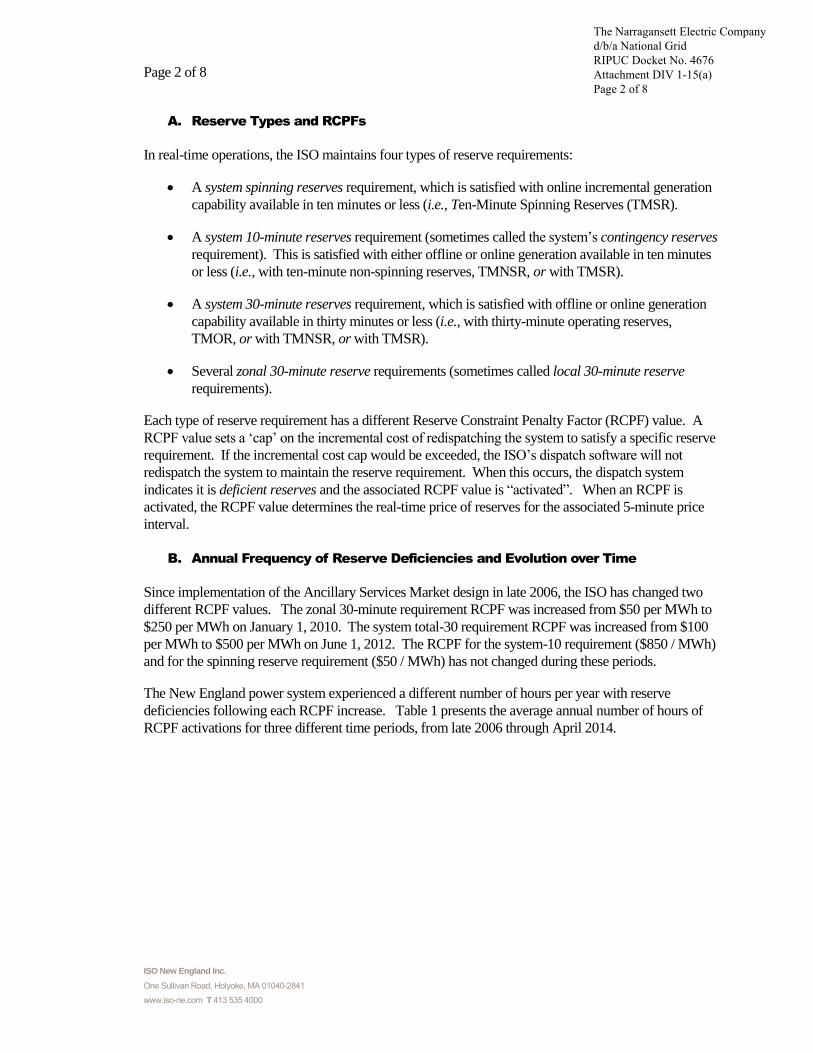
Page 2 of 8
ISO New England Inc.
One Sullivan Road, Holyoke, MA 01040-2841
www.iso-ne.com T 413 535 4000
A. Reserve Types and RCPFs
In real-time operations, the ISO maintains four types of reserve requirements:
A system spinning reserves requirement, which is satisfied with online incremental generation
capability available in ten minutes or less (i.e., Ten-Minute Spinning Reserves (TMSR).
A system 10-minute reserves requirement (sometimes called the system’s contingency reserves
requirement). This is satisfied with either offline or online generation available in ten minutes
or less (i.e., with ten-minute non-spinning reserves, TMNSR, or with TMSR).
A system 30-minute reserves requirement, which is satisfied with offline or online generation
capability available in thirty minutes or less (i.e., with thirty-minute operating reserves,
TMOR, or with TMNSR, or with TMSR).
Several zonal 30-minute reserve requirements (sometimes called local 30-minute reserve
requirements).
Each type of reserve requirement has a different Reserve Constraint Penalty Factor (RCPF) value. A
RCPF value sets a ‘cap’ on the incremental cost of redispatching the system to satisfy a specific reserve
requirement. If the incremental cost cap would be exceeded, the ISO’s dispatch software will not
redispatch the system to maintain the reserve requirement. When this occurs, the dispatch system
indicates it is deficient reserves and the associated RCPF value is “activated”. When an RCPF is
activated, the RCPF value determines the real-time price of reserves for the associated 5-minute price
interval.
B. Annual Frequency of Reserve Deficiencies and Evolution over Time
Since implementation of the Ancillary Services Market design in late 2006, the ISO has changed two
different RCPF values. The zonal 30-minute requirement RCPF was increased from $50 per MWh to
$250 per MWh on January 1, 2010. The system total-30 requirement RCPF was increased from $100
per MWh to $500 per MWh on June 1, 2012. The RCPF for the system-10 requirement ($850 / MWh)
and for the spinning reserve requirement ($50 / MWh) has not changed during these periods.
The New England power system experienced a different number of hours per year with reserve
deficiencies following each RCPF increase. Table 1 presents the average annual number of hours of
RCPF activations for three different time periods, from late 2006 through April 2014.
The Narragansett Electric Company d/b/a National Grid RIPUC Docket No. 4676 Attachment DIV 1-15(a) Page 2 of 8

Page 3 of 8
ISO New England Inc.
One Sullivan Road, Holyoke, MA 01040-2841
www.iso-ne.com T 413 535 4000
Observe that there are two numbers in each entry in Table 1:
The first number is the total hours per year during which either the system-10 or the system-30
RCPF was activated. For example, the value of 6.0 in the first row means there were 6.0 hours
(as an annual average) during the Oct. 2006 to Dec 2009 period in which the RCPF was
activated for either system-10 or system-30 reserves. The third row in Table 1 shows this
condition occurred 12.8 hours (on an annualized basis) since June 2012.
The second number in each entry is the total hours per year (again on an average annual basis)
during which a zonal RCPF was activated but the system-10 and system-30 RCPFs were not
activated. That is, the second number represents the duration of ‘zonal-only’ RCPF
activations annually. For example, the number 18.7 in the first row of Table 1 indicates there
were, on average, 18.7 hours per year with a ‘zonal-only’ RCPF activation prior to January
2010. The third row of the table shows that after June 2012, this condition occurred only 0.1
hours (again, on an annualized basis).
Simulation Study Results. To provide a sense of the prevalence of reserve constraint activations that
would have occurred if the current RCPF values had been in place for several years, the ISO performed
a simulation study. Specifically, the ISO undertook a simulation study to examine how many RCPF
activations would have occurred if current RCPF values had been in place from January 2010 through
May 2012. This simulation was conducted using the ISO’s actual production-level unit dispatch
system, by re-running the real-time dispatch that would have occurred (approximately every 5 minutes)
during reserve deficiency periods. In Table 1, the first set of numbers in the second row show the
actual hours of reserve deficiencies during this time period; the second set of numbers, appearing with
‘starred’ entries (in the second row and last column of Table 1), show the simulation study results.
These results show that under current RCPF values, the frequency of system-level reserve deficiency
conditions would have been low during the Jan. 2010 to May 2012 period (at 3.5 hours, on an annual
basis). The last row in Table 1 shows the results from combining the actual and simulation study
Table 1. Average Annual RCPF Activations, in Hours. Values are system, local.
RCPF values in effect for 30-minute reserves
Time Period $100 System,
$50 Zonal $100 System, $250 Zonal
$500 System, $250 Zonal
Oct. 2006 to Dec. 2009 (38 months) 6.0, 18.7
Jan. 2010 to May 2012 (29 months) 17.7, 0.5 3.5, 0.5 **
June 2012 to Apr. 2014 (23 months) 12.8, 0.1
Jan. 2010 to Apr. 2014 (52 months) 7.6, 0.3 **
Notes: System is total-10 or total-30. Zonal is ‘zonal only’, i.e, when a zonal RCPF is active but the system RCPFs are not. Data are actual historical values except starred (**) values that are based on simulation study results (see text).
The Narragansett Electric Company d/b/a National Grid RIPUC Docket No. 4676 Attachment DIV 1-15(a) Page 3 of 8

Page 4 of 8
ISO New England Inc.
One Sullivan Road, Holyoke, MA 01040-2841
www.iso-ne.com T 413 535 4000
results with current RCPF values, and yields an annual average over the full 2010 – April 2014 period
of 7.6 hours of RCPF activations (system-level).
Taken together, the actual and simulated data for the 2010 – April 2014 period using current RCPF
values may provide the most relevant guide to assessing the prevalence and patterns of reserve
deficiencies under current system conditions. We provide additional statistics based on these results
further below.
C. Detailed Results for 2010 – April 2014 With Today’s RCPF Values
Figure 1 (next page) presents a visual representation of when RCPF activations occur. This figure
covers slightly more than a four-year span, from 2010 through 2012, and depicts the RCPF activation
results obtained under today’s RCPF values. To do so, Figure 1 shows the ISO’s simulation study
results for the Jan. 2010 to May 2012 period, and actual operating results from June 2012 to April 2014.
These simulation study results are also provided, at the event-level, in the accompanying Excel data
file.
The Narragansett Electric Company d/b/a National Grid RIPUC Docket No. 4676 Attachment DIV 1-15(a) Page 4 of 8

Page 5 of 8
ISO New England Inc.
One Sullivan Road, Holyoke, MA 01040-2841
www.iso-ne.com T 413 535 4000
Figure 1. RCPF Activations, 2010 to April 2014, by date and time of day, for current RCPF values. Data based on simulation study results for Jan. 2010 – May 2012 and actual operating outcomes June 2012 – April 2014.
1 2 3 4 5 6 7 8 9 10 11 12 13 14 15 16 17 18 19 20 21 22 23 24
Hour of Day
AMFJDNOSAJJMAMFJDNOSAJJMAMFJDNOSAJJMAMFJDNOSAJJMAMFJ
2014
2013
2012
2011
2010
System 10
System 30
Zonal 30
The Narragansett Electric Company d/b/a National Grid RIPUC Docket No. 4676 Attachment DIV 1-15(a) Page 5 of 8

Page 6 of 8
ISO New England Inc.
One Sullivan Road, Holyoke, MA 01040-2841
www.iso-ne.com T 413 535 4000
In Figure 1, each solid horizontal bar shows a period of time when one or more RCPFs were activated,
keyed by color. The horizontal axis shows the hour of day, vertical axis the date. For example, the
blue horizontal bar corresponding to July 22, 2011 shows the system-30 RCPF was activated shortly
after noon (Hour Ending 13), and remained active for approximately 4 hours until shortly after 4 pm
(Hour Ending 17).
Figure 1 reveals several facts about reserve deficiencies during this three-year period. These are:
1. Reserve deficiencies were most prevalent during the ‘peak’ hours of noon to 6 pm. Based
on the data in Figure 1, the table below shows the total amount of time (in hours) that system-
10 or system-30 RCPFs were activated during this 52-month period:
Table 2. RCPF Activations by Time of Day, 2010 – April 2014.
Time (hours) Percent
Peak Hours (HE12 to HE18) 22.5 68 %
Other than Peak Hours 10.5 32 %
All Hours 33.1 100 %
Annually, slightly more than two-thirds (68%) of the total time the system-10 or system-30
RCPFs were activated occurred during the hours of noon to 6pm.
2. Reserve deficiencies were more prevalent during June through September than other
months year. Based on the data in Figure 1, the table below shows the total amount of time (in
hours) that system-10 or system-30 RCPFs were activated during this three year period:
Annually, approximately one-half (51%) of the total time the system-10 or system-30 RCPFs
were activated occurred during the summer months of June through September.
3. The duration of RCPF activation events varied. Based on the data in Figure 1, the
following table shows how the cumulative duration of all system-10 or system-30 RCPF
activations during this three-year period (9.6 hours) breaks down into events of various
durations:
Table 3. RCPF Activations by Season, 2010 – April 2014.
Time (hours) Percent
June through September 17.0 51 %
October through May 16.1 49 %
Totals 33.1 100 %
The Narragansett Electric Company d/b/a National Grid RIPUC Docket No. 4676 Attachment DIV 1-15(a) Page 6 of 8

Page 7 of 8
ISO New England Inc.
One Sullivan Road, Holyoke, MA 01040-2841
www.iso-ne.com T 413 535 4000
Table 4. Total RCPF Activation Time by Event Duration, 2010 – April 2014.
Event Duration Total Time (hours) Percent
Less than 30 minutes 10.6 32 %
30 to 60 minutes 8.5 26 %
60 minutes or more 14 42 %
Totals 33.1 100 %
The first row indicates that, of the 33.1 hours of RCPF activations shown in Figure 1, a total of
10.6 hours (or 32%) occured during events that had durations of less than 30 minutes. A total
of 8.5 hours (26%) occured during events lasting between 30 and 60 minutes, and 14 hours
(42%) occurred during events lasting 60 minutes or more.
The summary information in these tables points to a general observation about reserve deficiencies.
Many RCPF activations arose quickly and were resolved within an hour. However, other reserve
deficiencies were sustained events when total system capacity was insufficient to meet load and reserve
requirements for hours at a time. These longer events tended to be precipitated by a confluence of
factors, including: High load conditions, day-ahead forecasts are lower than real-time load, reductions
in unit maximum generation capability occurring after the DA market and RAA processes (termed
‘EcoMax reductions from Day-Ahead’ in the detailed data file), and generation contingences occurring
in real-time. The detailed event data in the accompanying Excel file provides quantitative information
on these factors for each reserve deficiency from 2007 to present.
Balancing Ratio Values
The ISO’s FCM Pay-for-Performance proposal indexes payments for performance during reserve
deficiency conditions, in part, to a proportion of each resource’s Capacity Supply Obligation (CSO).
The proportion is determined by a statistic called the balancing ratio, which measures load plus reserve
requirements relative to total CSO obligations.
In the attached Excel data file, we have provided the system-level balancing ratio for all events during
which the system-10 or system-30 RCPF was activated. The table below summarizes this information,
using the (simulated and actual) RCPF activation results for the 2010 – April 2014 period obtained
under current RCPF values (that is, for all events represented in Figure 1). On an annual average basis,
the (duration-weighted) balancing ratio for system-level RCPF activation events in these data is 0.76.
Table 5. Balancing Ratio Values during RCPF Activations, 2010 – April 2014, Under Current RCPF Values.
Minimum Average Maximum
0.33 0.76 0.99
The Narragansett Electric Company d/b/a National Grid RIPUC Docket No. 4676 Attachment DIV 1-15(a) Page 7 of 8

Page 8 of 8
ISO New England Inc.
One Sullivan Road, Holyoke, MA 01040-2841
www.iso-ne.com T 413 535 4000
Using the Detailed RCPF Activation Event Data in the Excel File
The Excel data file accompanying this memo contains more detailed information on RCPF activations
from 2007 to present.
Organization. The data are organized into a series of tabs. Each tab corresponds to a specific time
period during which the RCPF values where constant; these time periods effectively correspond to the
rows shown in Table 1 of this memo. In addition, RCPF activations of system-level RCPFs (system-
10 or system-30) are shown on different tabs from RCPF Activation of zonal RCPFs.
Most tabs show RCPF activations organized by events; an event may run from only a few minutes to
several hours. A final set of tabs, prefaced by ‘Interval_’, provides further detail at the 5-minute
(approximately) frequency for all events.
Information. In general, for each RCPF activation event, the data contain information on:
The event date, start, and end times;
The activated RCPF type (i.e., NEMA zonal-30, system-10, etc), and RCPF value;
The average and maximum magnitude of the reserve deficiency, in MW, during the event;
The reserve requirement during the event, in MW;
System load during the event;
Various statistics for calculating the (system-level) balancing ratio;
Any OP-4 actions associated with the event;
The MW of any contingency losses occurring during or prior to the event;
The load forecast error from day-ahead during the event;
The ISO’s expected capacity margin during the RAA process;
Total external interchange difference between real-time and day-ahead; and
Total generation capability reductions from day-ahead prior to the event.
The README tab in the Excel data file provides additional information and precise definitions for all
of the fields contained in the data set.
We hope this information proves useful to market participants.
Contact Information
If you have any specific questions in relation to this data please contact Customer Support at the ISO
through Ask ISO, by calling (413) 540-4220 or by email at [email protected].
If you have any questions with regard to the formulation of de-list bids or new supply offers under the
ISO’s Pay for Performance proposals please email the IMM at [email protected].
The Narragansett Electric Company d/b/a National Grid RIPUC Docket No. 4676 Attachment DIV 1-15(a) Page 8 of 8

The Narragansett Electric Company d/b/a National Grid
RIPUC Docket No. 4676 In Re: Proposal to Bid Capacity of Customer-Owned DG Facilities
Into Forward Capacity Market Responses to the Division’s First Set of Data Requests
Issued on December 6, 2016
Prepared by or under the supervision of: Stefan Nagy
Division 1-16
Request:
Regarding page 16, line 7-8, please provide the basis for the 95% and 5% figures shown. Response: Please refer to Attachment DIV 1-3(d) for a detailed analysis of the cash flow resulting from the Company’s FCM Proposal. The Company’s estimate of FCM base payments, Performance Incentive payments, and Net FCM Proceeds (under the Base Case assumptions referenced in footnote 21 on page 24 of the Company’s pre-filed testimony) are detailed in Columns N, P, and U, respectively, in tab “4.1 Cash Flow Total Portfolio” of Attachment DIV 1-3(d). Once the portfolio reaches a steady state1 in 2026, the Company’s estimate of FCM base payments is $1.69 million, representing approximately 94.4% of the estimated Net FCM Proceeds of $1.79 million, while the estimated Performance Incentive payments of $100,000 account for the remaining 5.6% of the estimated Net FCM Proceeds.
1 Steady state, as defined in footnote 11 on page 16 of the Company’s pre-filed testimony, refers to a state in which all of the DG Facilities in the Company’s initial FCM portfolio have become commercially operational and active in the FCM, such that the projected growth of the Company’s capacity, and the associated Net FCM Proceeds, has plateaued.

The Narragansett Electric Company d/b/a National Grid
RIPUC Docket No. 4676 In Re: Proposal to Bid Capacity of Customer-Owned DG Facilities
Into Forward Capacity Market Responses to the Division’s First Set of Data Requests
Issued on December 6, 2016
Prepared by or under the supervision of: Stefan Nagy
Division 1-17
Request:
On page 20, line 14, it states that qualified resources may participate in reconfiguration auctions for an earlier commitment period. Could the company use resources qualified after February 1, 2017 to obtain capacity revenues for commitment periods prior to June 1, 2019? If not, please explain why not. If so, please explain whether the company has included such potential revenue in the economic evaluation of its proposal. Response: Resources that are qualified for participation in the Forward Capacity Auction may participate in Annual Reconfiguration Auctions to obtain a Capacity Supply Obligation for an earlier Commitment Period. The analysis presented in the Company’s FCM Proposal includes estimates of the revenue resulting from the participation of DG Facilities in the Annual Reconfiguration Auctions as well as the Forward Capacity Auction. Section 5.a.iii. of Attachment DIV 1-3(a) outlines the following timeline, which is assumed for projects in the Company’s cash flow analysis in Attachment DIV 1-3(d): Year 1: The resource is installed and becomes commercially operational. Year 2: The resource is qualified in June for participation in the Forward Capacity Auction in
Year 3. Year 3: The resource is bid into the Forward Capacity Auction to acquire a Capacity Supply
Obligation for delivery in year 6. The resource is also bid into the Annual Reconfiguration Auction in March to acquire a Capacity Supply Obligation for delivery in June of Year 3.
Year 4: The resource is bid into the Annual Reconfiguration Auction in March to acquire a Capacity Supply Obligation for delivery in June of Year 4.
Year 5: The resource is bid into the Annual Reconfiguration Auction in March to acquire a Capacity Supply Obligation for delivery in June of Year 5.
Year 6: The resource delivered to meet Capacity Supply Obligation from participation in the Forward Capacity Auction in Year 3.
For example, a resource that is commercially operational in 2016 may be qualified in June 2017 for participation in FCA-12 in February 2018. The resource may acquire a Capacity Supply Obligation in FCA-12 for the Commitment Period spanning June 1, 2021 – May 31, 2022. The resource may also participate in Annual and Monthly Reconfiguration Auctions to acquire Capacity Supply Obligations in the 2018-2019, 2019-2020, and 2020-2021 Commitment Periods.

The Narragansett Electric Company d/b/a National Grid
RIPUC Docket No. 4676 In Re: Proposal to Bid Capacity of Customer-Owned DG Facilities
Into Forward Capacity Market Responses to the Division’s First Set of Data Requests
Issued on December 6, 2016
Prepared by or under the supervision of: Scott M. McCabe
Division 1-18
Request:
Regarding page 22 of the companies pre-filed testimony, please provide the basis for the $13.0 million and $2.5 million figures shown. Response: In the Company’s Pre-Filed Testimony, Page 22, the $13 million of costs that are referenced are the total estimated above-market costs under the Long Term Contracting for Renewable Energy Recovery program for calendar year 2016. These costs were presented in two semi-annual filings. They are as follows:
1) Long Term Contracting for Renewable Energy Recovery Factor Filing for the Period January 2016 through June 2016, Docket No. 4587, Attachment 1, Page 1 of 4, Line (1), Above Market Cost for the period January 2016 through June 2016 - $4,292,349.
2) Long Term Contracting for Renewable Energy Recovery Factor Filing for the Period July 2016 through December 2016, Docket No. 4587, Attachment 1, Page 1 of 4, Line (1), Above Market Cost for the period July 2016 through December 2016 - $8,728,478.
The sum of estimated LTCRER above-market costs for calendar year 2016 is the total of these two amounts, or $13,020,827.
In the Company’s Pre-Filed Testimony, Page 22, the $2.5 million of costs that is referenced is the total Estimated RE Growth costs for the Program Year ending March 2017 that were approved in the 2016 Renewable Energy (RE) Growth Program Factor Filing, Docket No. 4246. The referenced $2.5 million can be found in Schedule NG-2, Page 1 of 4, Line (7). The referenced pages from the relevant filings have been provided as Attachment DIV 1-18.

The Narragansett Electric Companyd/b/a National Grid
RIPUC Docket No. 4587Attachment 1
Page 1 of 4
(1) Above Market Cost for the period January 2016 through June 2016 $4,292,349
(2) Forecasted kWh Deliveries - January 2016 through June 2016 3,653,714,748
(3) Recovery Factor for Estimated Above Market Cost $0.00117
(4) Adjustment for Uncollectibles 1.25%
(5) Proposed LTC Recovery Factor for the period January 1, 2016 through June 30, 2016 $0.00118
(6) Currently Effective LTC Recovery Reconciliation Factor $0.00113
(7) Total Proposed LTC Recovery Factor $0.00231
(8) Current LTC Recovery Factor $0.00230
(9) Increase in LTC Recovery Factor $0.00001
Line Descriptions:(1) per page 4, column (c), Line (26)(2) per Company forecast(3) Line (1) ÷ Line (2), truncated after five decimal places(4) uncollectible percentage approved in RIPUC Docket No. 4323(5) Line (3) x [1 + Line (4)], truncated to five decimal places(6) per RIPUC Docket No. 4554, Schedule JAL-17, page 1, line (8)(7) Line (5) + Line (6)(8) per tariff(9) Line (7) - Line (8)
Long-Term Contracting for Renewable Energy RecoveryFactor Calculation
For the Period January 2016 through June 2016
The Narragansett Electric Company d/b/a National Grid RIPUC Docket No. 4676 Attachment DIV 1-18 Page 1 of 3

The Narragansett Electric Companyd/b/a National Grid
RIPUC Docket No. 4587Attachment 1
Page 1 of 4
(1) Above Market Cost for the period July 2016 through December 2016 $8,728,478
(2) Forecasted kWh Deliveries - July 2016 through December 2016 3,974,279,506
(3) Recovery Factor for Estimated Above Market Cost $0.00219
(4) Adjustment for Uncollectibles 1.25%
(5) Proposed LTC Recovery Factor for the period July 1, 2016 through December 31, 2016 $0.00221
(6) Currently Effective LTC Recovery Reconciliation Factor $0.00116
(7) Total Proposed LTC Recovery Factor $0.00337
(8) Current LTC Recovery Factor $0.00234
(9) Increase in LTC Recovery Factor $0.00103
Line Descriptions:(1) per page 4, column (c), Line (26)(2) per Company forecast(3) Line (1) ÷ Line (2), truncated after five decimal places(4) uncollectible percentage approved in RIPUC Docket No. 4323(5) Line (3) x [1 + Line (4)], truncated to five decimal places(6) per RIPUC Docket No. 4599, Schedule ASC-18, page 1, line (8)(7) Line (5) + Line (6)(8) Summary of Delivery Rates, RIPUC No. 2095(9) Line (7) - Line (8)
Long-Term Contracting for Renewable Energy RecoveryFactor Calculation
For the Period July 2016 through December 2016
The Narragansett Electric Company d/b/a National Grid RIPUC Docket No. 4676 Attachment DIV 1-18 Page 2 of 3

The Narragansett Electric Companyd/b/a National Grid
RIPUC Docket ____RE Growth Factor Filing
Schedule NG-2Page 1 of 4
Renewable Energy Growth ProgramSummary of Annual Net Costs
for the Program Year Ending March 31, 2017
(1) Estmated Performance-Based Incentive Payments $1,821,337
(2) less: Value of Market Products $176,723
(3) Net Cost $1,644,614
(4) Estimated Administrative Cost $798,477
(5) Revenue Requirement - Meter Investment $3,663
(6) Estimated Remuneration $31,873
(7) Total Estimated RE Growth Cost $2,478,628
(1) Page 3, Section 1, Line (7)(2) Page 3, Section 2, Line (10)(3) Line (1) - Line (2) (4) Page 4, Line (5)(5) Schedule NG-4B, Sum of Pg. 1, Line (27), Column (b), and Page 2, Line (27), Column (a)(6) Line (1) x 1.75%(7) Line (3) + Line (4) + Line (5) + Line (6)
The Narragansett Electric Company d/b/a National Grid RIPUC Docket No. 4676 Attachment DIV 1-18 Page 3 of 3

The Narragansett Electric Company d/b/a National Grid
RIPUC Docket No. 4676 In Re: Proposal to Bid Capacity of Customer-Owned DG Facilities
Into Forward Capacity Market Responses to the Division’s First Set of Data Requests
Issued on December 6, 2016
Prepared by or under the supervision of: Stefan Nagy
Division 1-19
Request:
Please provide the underlying data for schedules NG-2 and NG-3 and live Excel spreadsheets with all formulas intact. Include all assumptions made and details for individual project to the maximum extent available. Response: The Company’s forecast of the capacity associated with the DGSC program is based on the specific list of facilities that are enrolled in the DGSC program that are greater than 250 kW, as detailed in Attachment DIV 1-4. The Company’s projection of enrollments in the RE Growth Program is based on the annual enrollment targets that are currently approved for each technology type and project scale (i.e. commercial scale, large scale). The Company’s projections assume that the annual enrollment targets will remain constant in 2017 and 2018 and that the enrollment target in 2019 will consist of the remainder of the 160 MW target that is currently approved for the RE Growth program pursuant to Chapter 26.6 of Title 39 of the Rhode Island General Laws. The Company’s projections assume that in each year the allocation amongst technology types and project scales will remain consistent with the currently approved targets, and that any portion of the 40 MW target for the DGSC program that is not met through the DGSC program will be added to the RE Growth target for 2019. The Company’s analysis also assumes that DG Facilities that are enrolled in the RE Growth program will complete construction within two years of enrollment in the program. The Company has revised its projections of the capacity portfolio associated with the DGSC and RE Growth programs. As noted in Attachment DIV 1-4, the DGSC portfolio has been updated to remove two projects that were included in the original portfolio projection, but are smaller than the Company’s threshold of a minimum nameplate capacity rating of 250 kW. The Company’s capacity forecast has also been revised to account for changes to the list of facilities that are enrolled in the DGSC program since the Company conducted its initial analysis prior to submitting its November 21, 2016 filing. In addition, the Company has updated the underlying assumption of the lifetime1 of the solar facilities associated with the RE Growth and DGSC programs, and has revised its capacity forecast accordingly. 1 The Company’s initial analysis had made a standard assumption that solar DG facilities had a lifetime of 25 years. The Company has corrected this assumption to align with the 20-year tariff term of the RE Growth tariff and the 15-year contract term of the Company’s Distributed Generation Standard Contracts.
The Narragansett Electric Company d/b/a National Grid
RIPUC Docket No. 4676 In Re: Proposal to Bid Capacity of Customer-Owned DG Facilities
Into Forward Capacity Market Responses to the Division’s First Set of Data Requests
Issued on December 6, 2016
Prepared by or under the supervision of: Stefan Nagy
Division 1-19, page 2 The Company has revised Schedules NG-2 and NG-3 from its original filing to account for the revisions noted above, which are attached to this response as Attachments DIV 1-19(a) and 1-19(b), respectively. Please also refer to Attachment DIV 1-3(d) for the underlying data and live Excel files that correspond to Schedules NG-2-Revised and NG-3-Revised.

*Pro
ject
ed In
stal
led
Cap
acity
repr
esen
ts th
e A
C n
amep
late
cap
acity
of t
he D
G fa
cilit
ies
in th
e C
ompa
ny's
initi
al F
CM
por
tfolio
that
are
larg
er th
an 2
50kW
.
020406080100
120 20
1520
2020
2520
3020
3520
40
Installed Capacity (MW)
Year
Sche
dule
NG
-2 -R
evis
ed
Proj
ecte
d In
talle
d Ca
paci
ty
Tota
l Por
tfol
io
RE G
row
th
DGSC
The Narragansett Electric Company d/b/a National Grid RIPUC Docket No. 4676 Attachment DIV 1-19(a) Page 1 of 1

*Pro
ject
ed Q
ualif
ied
Capa
city
for s
olar
faci
litie
s is b
ased
on
the
proj
ecte
d pe
ak su
mm
er p
rodu
ctio
n an
d is
assu
med
to b
e 35
% o
f the
inst
alle
d na
mep
late
cap
acity
0510152025303540
2015
2020
2025
2030
2035
2040
Qualified Capacity (MW)
Year
Sche
dule
NG-
3 -R
evis
ed
Proj
ecte
d Q
ualif
ied
Capa
city
Tota
l Por
tfol
io
RE G
row
th
DGSC
The Narragansett Electric Company d/b/a National Grid RIPUC Docket No. 4676 Attachment DIV 1-19(b) Page 1 of 1

The Narragansett Electric Company d/b/a National Grid
RIPUC Docket No. 4676 In Re: Proposal to Bid Capacity of Customer-Owned DG Facilities
Into Forward Capacity Market Responses to the Division’s First Set of Data Requests
Issued on December 6, 2016
Prepared by or under the supervision of: Stefan Nagy
Division 1-20
Request: Regarding page 23 of the company’s pre-filed testimony, please provide the underlying data for the following figures shown. Include all assumptions made in details on individual project to the maximum extent available.
a. $10.9 million b. $22.1 million c. $50,000 d. $430,000
Response:
a. The $10.9 million figure referenced on page 23 of the Company’s pre-filed testimony, and part (a) of this data request, represented the Company’s then estimate of the net present value of the Net Customer Benefit1 that would result from the Company’s execution of its FCM Proposal. The Company has revised this figure as a result of the revisions to the projected capacity portfolio and the associated administrative costs, as discussed in the Company’s responses to Division 1-19 and 1-25. The Company’s revised estimate of the cumulative net present value of the Net Customer Benefit is $9.1 million.
b. The $22.1 million figure referenced on page 23 of the Company’s pre-filed testimony,
and part (b) of this data request, represented the Company’s then estimate of the nominal value of the Net Customer Benefit that would result from the Company’s execution of its FCM Proposal. The Company has revised this figure as a result of the revisions to the projected capacity portfolio and the associated administrative costs, as discussed in the Company’s responses to Division 1-19 and 1-25. The Company’s revised estimate of the cumulative net present value of the Net Customer Benefit is $16.8 million.
1 The Net Customer Benefit, as defined on page 23 of the Company’s pre-filed testimony, consists of two components: (1) the Customer Share of Net FCM Proceeds, which is 80 percent of the Net FCM Proceeds, and (2) incremental administrative costs incurred as a result of the Company performing the tasks required to qualify, bid, and monitor participation of DG Facilities in the FCM.

The Narragansett Electric Company d/b/a National Grid
RIPUC Docket No. 4676 In Re: Proposal to Bid Capacity of Customer-Owned DG Facilities
Into Forward Capacity Market Responses to the Division’s First Set of Data Requests
Issued on December 6, 2016
Prepared by or under the supervision of: Stefan Nagy
Division 1-20, page 2
c. The $50,000 figure referenced on page 23 of the Company’s pre-filed testimony, and part (c) of this data request, represented the Company’s then estimate of the annual Net Customer Benefit under the Alternative Market Participation Option. The Company has revised this estimate as a result of a revision to the administrative cost assumptions2 for the Alternative Market Participation Option. The Company’s revised estimate of the annual Net Customer Benefit under the Alternative Market Participation Option is $100,000.
d. Similarly, the Company’s $430,000 figure referenced on page 23 of the Company’s
pre-filed testimony, and part (d) of this data request, which represents the cumulative net present value of the estimated Net Customer Benefit under the Alternative Market Participation Option, has been revised as a result of the updated administrative cost assumption discussed in part (c) of this data request. The Company’s revised estimate of the cumulative net present value of the Net Customer Benefit under the Alternative Market Participation Option is $750,000.
e. Please refer to Section 5 of Attachment DIV 1-3(a) for a detailed outline of the
methodology of the Company’s cash flow analysis and refer to rows 40-48 in tab “4.1 Cash Flow Total Portfolio” of 1-3(d) for the underlying data and calculations of the figures referenced above and revised in this data request.
2 The Company’s initial estimate of the proceeds associated with the Alternative Market Participation option had assumed a fixed annual administrative cost, which was assumed to be smaller than the cost associated with the Company’s proposed strategy to due to the reduced level of management and monitoring required for participation in the FCM under the Alternative Market Participation option. The Company has revised this estimate to represent cost that is based on the number of projects in the Company’s projected capacity portfolio, similar to the Company’s estimates of the administrative costs that are presented in Schedule NG-8-Revised, which is provided as Attachment DIV-25. The Company’s revised estimate of the administrative costs associated with the Alternative Market Participation Option represents 40% of the administrative costs assumed for the Company’s proposed strategy and is based upon the labor costs associated with completing the asset registrations and monthly performance reporting tasks that would be required under the Alternative Market Participation Option.

The Narragansett Electric Company d/b/a National Grid
RIPUC Docket No. 4676 In Re: Proposal to Bid Capacity of Customer-Owned DG Facilities
Into Forward Capacity Market Responses to the Division’s First Set of Data Requests
Issued on December 6, 2016
Prepared by or under the supervision of: Stefan Nagy
Division 1-21
Request:
Regarding page 24 of the company’s pre-filed testimony, please provide the underlying data for schedules NG-4, NG-5, NG-6, and NG-7 and live Excel spreadsheets with all formulas intact. Include all models used and assumptions made in details on individual project to the maximum extent available. Response: The Company has made revisions to the underlying data for Schedules NG-4, NG-5, NG-6, and NG-7 due to the changes noted in its responses to Division 1-19, Division 1-20, and Division 1-25. Please refer to Attachments DIV 1-21(a), DIV 1-21(b), DIV 1-21(c), and DIV 1-21(d), for copies of Schedules NG-4-Revised, NG-5-Revised, NG-6-Revised, and NG-7-Revised, respectively. Please refer to Attachment DIV 1-3(d) for the underlying data and live Excel copies of Schedules NG-4-Revised, NG-5-Revised, NG-6-Revised, and NG-7-Revised.

-$20
0,00
0$0
$200
,000
$400
,000
$600
,000
$800
,000
$1,0
00,0
00
$1,2
00,0
00
$1,4
00,0
00
2015
2020
2025
2030
2035
2040
Net Customer Benefit
Year
Sche
dule
NG-
4 -R
evis
ed
Proj
ecte
d N
et C
usto
mer
Ben
efit
–Ba
se C
ase
Tota
l Por
tfol
io
RE G
row
th
DGSC
The Narragansett Electric Company d/b/a National Grid RIPUC Docket No. 4676 Attachment DIV 1-21(a) Page 1 of 1

-$20
0,00
0$0
$200
,000
$400
,000
$600
,000
$800
,000
$1,0
00,0
00
$1,2
00,0
00
$1,4
00,0
00
2015
2020
2025
2030
2035
2040
Net Customer Benefit
Year
Sche
dule
NG-
5 -R
evis
ed
Proj
ecte
d N
et C
usto
mer
Ben
efit
–Ba
se C
ase
v. N
o Ca
paci
ty S
uppl
y O
blig
atio
n
Tota
l Por
tfol
io
Expe
cted
Rev
enue
- N
o CS
O
The Narragansett Electric Company d/b/a National Grid RIPUC Docket No. 4676 Attachment DIV 1-21(b) Page 1 of 1
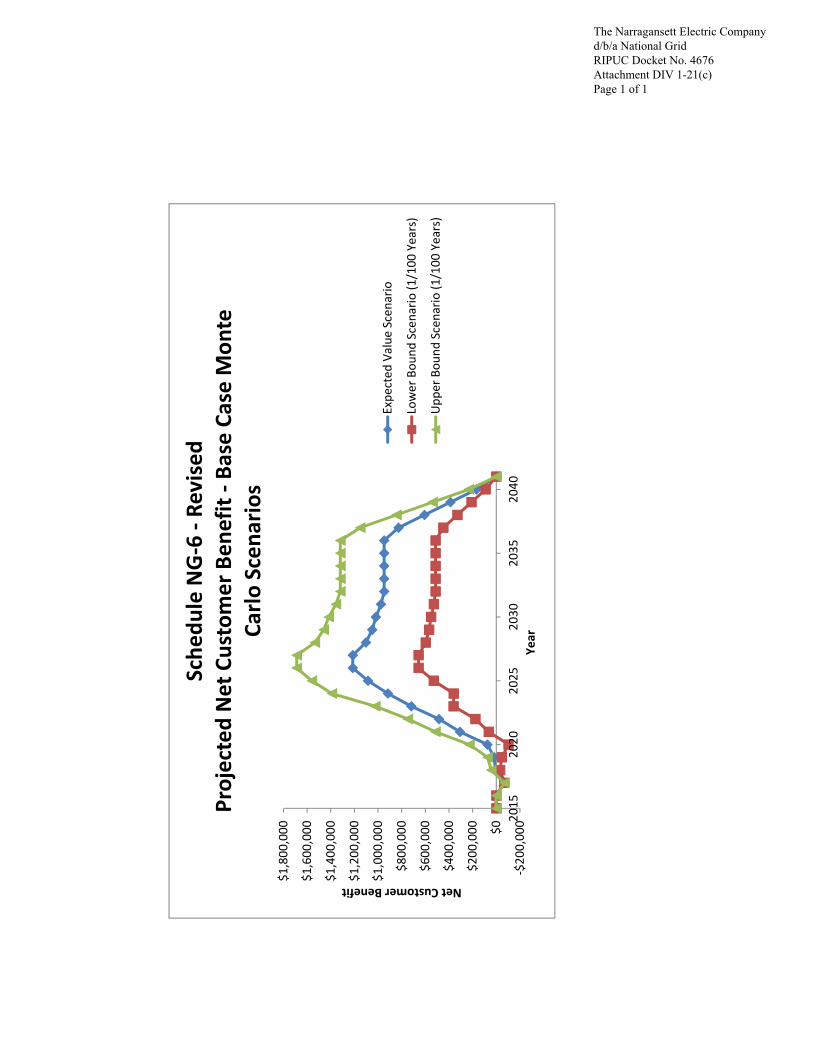
-$20
0,00
0$0
$200
,000
$400
,000
$600
,000
$800
,000
$1,0
00,0
00
$1,2
00,0
00
$1,4
00,0
00
$1,6
00,0
00
$1,8
00,0
00
2015
2020
2025
2030
2035
2040
Net Customer Benefit
Year
Sche
dule
NG-
6 -R
evis
ed
Proj
ecte
d N
et C
usto
mer
Ben
efit
-Bas
e Ca
se M
onte
Carlo
Sce
nario
s
Expe
cted
Val
ue S
cena
rio
Low
er B
ound
Sce
nario
(1/1
00 Y
ears
)
Upp
er B
ound
Sce
nario
(1/1
00 Y
ears
)
The Narragansett Electric Company d/b/a National Grid RIPUC Docket No. 4676 Attachment DIV 1-21(c) Page 1 of 1

-$40
0,00
0
-$20
0,00
0$0
$200
,000
$400
,000
$600
,000
$800
,000
2015
2020
2025
2030
2035
2040
Net Customer Benefit
Year
Sche
dule
NG
-7 -
Revi
sed
Proj
ecte
d N
et C
usto
mer
Ben
efit
-Sen
sitiv
ity C
ase
Mon
teCa
rlo S
cena
rios
Expe
cted
Val
ue S
cena
rio
Low
er B
ound
Sce
nario
(1/1
00 Y
ears
)
Upp
er B
ound
Sce
nario
(1/1
00 Y
ears
)
The Narragansett Electric Company d/b/a National Grid RIPUC Docket No. 4676 Attachment DIV 1-21(d) Page 1 of 1

The Narragansett Electric Company d/b/a National Grid
RIPUC Docket No. 4676 In Re: Proposal to Bid Capacity of Customer-Owned DG Facilities
Into Forward Capacity Market Responses to the Division’s First Set of Data Requests
Issued on December 6, 2016
Prepared by or under the supervision of: Stefan Nagy
Division 1-22
Request:
Regarding page 26 of the company’s pre-filed testimony, please provide a mathematical example of how the company could delist facilities and the impact on the economic analyses provided. Response: Resources in the FCM are qualified as either New Capacity Resources or Existing Capacity Resources. A resource that has never cleared in a previous Forward Capacity Auction is considered New Capacity Resource and must go through the qualification process for New Capacity Resources that is outlined in the Company’s response to Division 1-7. Once a resource has successfully cleared in a Forward Capacity Auction, it is treated as an Existing Capacity Resource in all future periods. ISO-NE automatically qualifies and enters Existing Capacity Resources as price-takers in the Forward Capacity Auction, unless the resource submits a De-List bid.1 The result of a De-List bid is that if the auction price falls below the De-List price, the resource will not receive a Capacity Supply Obligation in the relevant Commitment Period. A De-List bid may remove a resource from one2 Forward Capacity Auction or from all future3 Forward Capacity Auctions. If a resource is successfully de-listed, it will not receive any FCM base payments and will not be exposed to any performance incentive penalties in the period for which it does not have a Capacity Supply Obligation. The resource would default to the Alternative Market Participation option in this period and would still be able to receive Performance Incentive payments, as outlined for the Alternative Market Participation Option in footnote 10 on page 16 of the Company’s pre-filed testimony.
1 A De-List Bid is a bid from an Existing Capacity Resource to be removed from the Forward Capacity Auction if the auction price falls below the level specified in the De-List Bid. If the price falls below the specified price, the Existing Capacity Resource will be removed from the Forward Capacity Auction and will not receive a Capacity Supply Obligation for the relevant Commitment Period. Please refer to Section III.13.2.5.2. of the ISO-NE Tariff for detailed information on De-List Bids. 2 This is the result of a Static De-List Bid or a Dynamic De-List Bid, as specified in Section III.13.2.5.2. of the ISO-NE Tariff for detailed information on De-List Bids. 3 This is the result of a Permanent De-List Bid, as specified in Section III.13.2.5.2. of the ISO-NE Tariff for detailed information on De-List Bids.

The Narragansett Electric Company d/b/a National Grid
RIPUC Docket No. 4676 In Re: Proposal to Bid Capacity of Customer-Owned DG Facilities
Into Forward Capacity Market Responses to the Division’s First Set of Data Requests
Issued on December 6, 2016
Prepared by or under the supervision of: Stefan Nagy
Division 1-22, page 2 For example, if a resource is bid into and clears as a New Resource in Forward Capacity Auction 12, it will receive a Capacity Supply Obligation for the period that spans June 1, 2021 – May 31, 2022. If the resource then submits a Static De-List Bid in FCA-13 and is successfully de-listed from the Auction, the resource will not receive a Capacity Supply Obligation in the Commitment Period spanning June 1, 2022 – May 31, 2023. In the period spanning June 1, 2021 – May 31, 2022, the resource would be expected to receive Net FCM Proceeds as estimated for a resource with a Capacity Supply Obligation. In the Period spanning June 1, 2022 – May 31, 2023, the resource would be expected to earn Net FCM Proceeds as estimated for a resource under the Alternative Market Participation Option. The calculation of the Net FCM Proceeds for each of these scenarios is detailed in the Company’s analysis in Attachment DIV 1-3(d). If, in the above example, if the Company’s analysis showed that a Capacity Supply Obligation in future periods was expected to result in a negative Net Customer Benefit, as referenced on Page 26, line 1, of the Company’s pre-filed testimony, de-listing the facility would mitigate the risks associated with that resource in the FCA-13 Commitment Period. However, the resource would have already acquired a Capacity Supply Obligation in FCA-12. In order to fully mitigate the risks associated with the Capacity Supply Obligation in the FCA-12 Commitment Period, the resource could shed its Capacity Supply Obligation by submitting a demand bid in an Annual Reconfiguration Auction for this period, as outlined on Page 20, line 1 of the Company’s pre-filed testimony. The net financial impact of shedding the Capacity Supply Obligation in the Annual Reconfiguration Auction is outlined in footnote 14 on page 20 of the Company’s pre-filed testimony.

The Narragansett Electric Company d/b/a National Grid
RIPUC Docket No. 4676 In Re: Proposal to Bid Capacity of Customer-Owned DG Facilities
Into Forward Capacity Market Responses to the Division’s First Set of Data Requests
Issued on December 6, 2016
Prepared by or under the supervision of: Stefan Nagy
Division 1-23
Request:
Regarding page 26, line 1 of the company’s pre-filed testimony, how long will the company wait until the negative Net Customer Benefit conditions reverse? Response: As part of the Company’s strategy, it has not identified a specific period of time that it would wait for the negative Net Customer Benefit conditions1 to reverse before it would remove facilities from the market through participation in Reconfiguration Auctions or de-list the facilities in future Forward Capacity Auctions. The Company will monitor individual facilities and analyze market conditions on an ongoing basis and make adjustments to its portfolio and strategy as necessary. In the event that an individual facility is flagged for underperforming relative to its Capacity Supply Obligation, the Company will evaluate, as outlined on page 19, line 18 of the Company’s pre-filed testimony, to determine if the facility is expected to continue to underperform relative to its Capacity Supply Obligation. If a facility is expected to continue to underperform relative to its Capacity Supply Obligation, the Company may: (1) de-list the facility from future Forward Capacity Auctions and/or (2) remove the facility from the current Commitment Period by submitting a demand bid on behalf of the resource in an Annual or Monthly Reconfiguration Auction. If a facility is removed from the market through de-listing or participation in an Annual or Monthly Reconfiguration Auction, the Company will continue to evaluate its performance to determine if and when it should be entered back into the market to receive a Capacity Supply Obligation. This is intended to limit the risk associated with the under-performance of individual facilities. In the event that the Company’s overall portfolio realizes a negative Net Customer Benefit, the Company’s ongoing analysis of its strategy would consider the market conditions that led to the negative Net Customer Benefit. In the event that the Company’s analysis determines that unfavorable market conditions are expected to persist and continue to result in negative Net Customer Benefits, the Company will remove its portfolio of DG Facilities from the FCM through de-listing the facilities in future Forward Capacity Auctions and/or removing the facilities from current the Commitment Period through participation in Annual or Monthly Reconfiguration Auctions. The Company has not identified a specific time period to wait before 1 The negative Net Customer Benefit conditions, which are referenced on page 26, line 1 of the Company’s pre-filed testimony, may occur in the scenario where there are an unusually high amount of Performance Incentive Penalties and are modeled in the lower-bound scenario of the sensitivity case presented in Attachment NG-7.

The Narragansett Electric Company d/b/a National Grid
RIPUC Docket No. 4676 In Re: Proposal to Bid Capacity of Customer-Owned DG Facilities
Into Forward Capacity Market Responses to the Division’s First Set of Data Requests
Issued on December 6, 2016
Prepared by or under the supervision of: Stefan Nagy
Division 1-23, page 2 taking these actions, as the decision to remove facilities from the FCM would be dependent on the specific market and system conditions that led to a negative Net Customer Benefit in that particular time period.

The Narragansett Electric Company d/b/a National Grid
RIPUC Docket No. 4676 In Re: Proposal to Bid Capacity of Customer-Owned DG Facilities
Into Forward Capacity Market Responses to the Division’s First Set of Data Requests
Issued on December 6, 2016
Prepared by or under the supervision of: Stefan Nagy
Division 1-24
Request: Page 27 of the company’s pre-filed testimony states that the resources to administer this program could be either employees or contract. If employees are to be used, do these employees already exist on the company’s payroll or will there be new hires? If these employees are already on the company’s payroll, please describe how the cost of these employees is currently recovered. If contractors are to be used, please describe how these contractors will be selected. Response: The Company would require incremental resources to implement its FCM Proposal. To the extent that the Company uses employees to implement its FCM Proposal, it would require the addition of new hires. To the extent that contractors are used to implement the Company’s FCM Proposal, the Company would select these contractors through its normal contractor hiring process for non-permanent employees. In addition, it is possible the Company would use the services of a vendor to help qualify projects in the near term, to expedite the process of entering them into the upcoming FCA-12.

The Narragansett Electric Company d/b/a National Grid
RIPUC Docket No. 4676 In Re: Proposal to Bid Capacity of Customer-Owned DG Facilities
Into Forward Capacity Market Responses to the Division’s First Set of Data Requests
Issued on December 6, 2016
Prepared by or under the supervision of: Stefan Nagy
Division 1-25
Request:
Regarding schedule NG-8,
a. please provide an electronic copy of this schedule and Excel spreadsheet with all formulas intact.
b. Please provide the basis for the assumption of 20 qualification hours per project c. please provide the basis for the assumption 30 monitoring hours per project d. please provide the basis for the FTE costs assumed e. please explain how the mix of commercial scale project and large-scale project were
determined for each case. f. please explain why in some years the total labor how this exceeds the labor hours from
the FTEs assumed. (For example in case 1, 2019 shows 2354 labor hours but only one FTE which would provide 1960 labor hours.)
g. Please explain why there are monitoring hours in 2017 and 2018 when the commitment period does not commence until June 1, 2019.
Response:
a. Please refer to tab “3. Admin Cost” of Attachment DIV 1-3(d) for a live Excel spreadsheet copy of Schedule NG-8, which has been revised to reflect the revisions outlined in the Company’s response to Division 1-19 and the revision noted below in part (f) of this question. Please refer to Attachment DIV 1-25 for a copy of Schedule NG-8-Revised.
b. The assumption of 20 qualification hours per project is based on the Company’s experience qualifying solar DG Facilities that are owned by the Company’s affiliate, Massachusetts Electric Company for participation in FCA-10 and FCA-11. Please refer to the Company’s response to Division 1-7 for a detailed description of the qualification requirements for New Capacity Resources.
c. The assumption of 30 monitoring hours per project is based on the Company’s estimate of the annual ongoing tasks associated with managing the Company’s portfolio of DG Facilities in the FCM, and are informed by the Company’s prior experience in managing Energy Efficiency, Combined Heat and Power, and solar DG resources in the FCM. The “monitoring” hours refer to all ongoing management tasks, other than the one-time tasks associated with qualification of resources in the Forward Capacity Auction. These tasks

The Narragansett Electric Company d/b/a National Grid
RIPUC Docket No. 4676 In Re: Proposal to Bid Capacity of Customer-Owned DG Facilities
Into Forward Capacity Market Responses to the Division’s First Set of Data Requests
Issued on December 6, 2016
Prepared by or under the supervision of: Stefan Nagy
Division 1-25, page 2 include, but are not limited to, resource performance monitoring,1 as well as the submission of Reconfiguration Auction bids, if applicable, De-List bids, if applicable, quarterly critical path schedule updates, monthly performance data submissions, seasonal audit requests.
d. The annual FTE cost assumption is outlined in footnote 25 on page 27 of the Company’s pre-filed testimony, and is based on a general assumption of the annual base salary of an incremental employee of National Grid USA Service Company and the burdening of that salary by 72.99% to account for Service Company labor overheads, excluding Pension & Pension Benefits Other than Pension.
e. The allocation of capacity between Commercial and Large Scale projects was determined based on the Company’s projection of the capacity portfolio associated with the RE Growth program, as outlined in the Company’s response to Division 1-19. The estimated numbers of projects of each scale were based on varying assumptions of the average project size in Cases 1, 2 and 3 in Schedule NG-8. Case 1 assumed that projects were sized in the middle of the size range for Commercial and Large Scale projects. Case 2 assumed that projects were sized at the minimum project size for Commercial and Large Scale facilities, representing an estimate of the upper bound of the number of Commercial and Large Scale facilities that would be included in the Company’s initial FCM portfolio. Case 3 uses the same project size assumptions as Case 1, but also assumes that the Company is able to qualify Medium Scale facilities, which are smaller than 250 kW, for participation in the Forward Capacity Auction.
f. The Company’s initial estimates of the incremental FTE’s were rounded to simplify the labor assumptions and provide estimates of the incremental FTE’s in whole integer values. This resulted, in some cases, in the estimated labor hours exceeding the associated number of estimated FTE’s. The Company has revised its estimate to allow for the estimation of partial FTE’s and has included this update in Schedule NG-8-Revised, which is provided as Attachment DIV 1-25. The live Excel file of Schedule NG-Revised is provided as Attachment DIV 1-3(d).
g. The Company’s estimate of “monitoring” hours, as outlined in the Company’s response to part (d) of this data request, refer to all ongoing management tasks and are not limited to performance monitoring tasks. Once a facility is qualified in the FCM, there will be additional tasks required to manage the participation of that facility in the FCM, such as participation in the Forward Capacity Auction, Reconfiguration Auctions, and the submission of quarterly critical path schedule updates, monthly performance data submissions, and seasonal audit requests. Additionally, as outlined in the Company’s
1 The tasks associated with the Company’s ongoing performance monitoring are detailed on page 19, line 14 of the Company’s pre-filed testimony.

The Narragansett Electric Company d/b/a National Grid
RIPUC Docket No. 4676 In Re: Proposal to Bid Capacity of Customer-Owned DG Facilities
Into Forward Capacity Market Responses to the Division’s First Set of Data Requests
Issued on December 6, 2016
Prepared by or under the supervision of: Stefan Nagy
Division 1-25, page 3 response to Division 1-17, the Company’s initial FCM strategy will seek to participate in the Annual Reconfiguration Auction to acquire Capacity Supply Obligations for the interim commitment periods and will seek to begin delivering capacity to meet Capacity Supply Obligations in 2018. The Company’s strategy will also seek to monitor facilities beginning immediately after they are qualified for participation in the Forward Capacity Auction so that, should any issues arise prior to the start the facilities’ Capacity Supply Obligations, the Company can respond appropriately to mitigate the risks of Performance Incentive penalties.

Schedule NG-8 - Revised - Estimated Ongoing Administrative Costs
Administrative Cost Estimate - Calculation of FTEs required to impliment proposed participation in FCM
Qualification Labor Hours (Hours/Project) 20Monitoring Labor Hours (Annual Hours/Project) 30Annual Administrative Cost per Fully-Burdened FTE ($/FTE) $138,390
Case 1* - Median Project Size / Min Project Size = 250 kW
Commercial Scale (251-999 kW) 0.625Large Scale (1,000 - 5,000 kW) 2.5
YearIncremental Projects
Cumulative Projects
Qualification Labor Hours
Monitoring Labor Hours
Total Labor Hours
Annual FTE Labor Hours
Estimated Number FTEs
Annual Administrative Cost
2017 19 19 380.0 570.0 950.0 1960 0.5 $67,0772018 12 31 232.0 918.0 1150.0 1960 0.6 $81,1982019 17 48 344.0 1434.0 1778.0 1960 0.9 $125,5402020 17 65 344.0 1950.0 2294.0 1960 1.2 $161,9732021 17 82 344.0 2466.0 2810.0 1960 1.4 $198,4062022 13 95 261.5 2858.3 3119.9 1960 1.6 $220,284
*Note that the administrative costs in Case 1 are used in the estimates of the Net Customer Benefit
Assumed Average Project Size (MW)
The Narragansett Electric Company d/b/a National Grid RIPUC Docket No. 4676 Attachment DIV 1-25 Page 1 of 2

Case 2 - Small Project Size / Min Project Size = 250 kW
Commercial Scale (251-999 kW) 0.251Large Scale (1,000 - 5,000 kW) 1
YearIncremental Projects
Cumulative Projects
Qualification Labor Hours
Monitoring Labor Hours
Total Labor Hours
Annual FTE Labor Hours
Estimated Number FTEs
Annual Administrative Cost
2017 19 19 380.0 570.0 950.0 1960 0.5 $67,0772018 26 45 518.6 1347.8 1866.4 1960 1.0 $131,7822019 43 88 857.5 2634.0 3491.5 1960 1.8 $246,5232020 43 131 857.5 3920.2 4777.6 1960 2.4 $337,3362021 43 174 857.5 5206.4 6063.8 1960 3.1 $428,1492022 33 206 651.9 6184.3 6836.2 1960 3.5 $482,683
Case 3 - Median Project Size / Min Project Size = 25 kW
Medium Scale (25-250 kW) 0.15Commercial Scale (251-999 kW) 0.625Large Scale (1,000 - 5,000 kW) 2.5
YearIncremental Projects
Cumulative Projects
Qualification Labor Hours
Monitoring Labor Hours
Total Labor Hours
Annual FTE Labor Hours
Estimated Number FTEs
Annual Administrative Cost
2017 19 19 380.0 570.0 950.0 1960 0.5 $67,0772018 38 57 765.3 1718.0 2483.3 1960 1.3 $175,3412019 51 108 1010.7 3234.0 4244.7 1960 2.2 $299,7042020 51 158 1010.7 4750.0 5760.7 1960 2.9 $406,7442021 51 209 1010.7 6266.0 7276.7 1960 3.7 $513,7852022 38 247 768.4 7418.6 8187.0 1960 4.2 $578,062
Assumed Average Project Size (MW)
Assumed Average Project Size (MW)
The Narragansett Electric Company d/b/a National Grid RIPUC Docket No. 4676 Attachment DIV 1-25 Page 2 of 2

The Narragansett Electric Company d/b/a National Grid
RIPUC Docket No. 4676 In Re: Proposal to Bid Capacity of Customer-Owned DG Facilities
Into Forward Capacity Market Responses to the Division’s First Set of Data Requests
Issued on December 6, 2016
Prepared by or under the supervision of: Stefan Nagy
Division 1-26
Request:
Regarding page 28 of the company’s pre-filed testimony, please provide the basis for the $1.2 million figure and the $250,000 figure shown. Response: Please refer to rows 40-43 in tab “4.1 Cash Flow Total Portfolio” of Attachment DIV 1-3(d) for a detailed calculation of the figures referenced on page 28 of the Company’s pre-filed testimony. These figures represent the Company’s estimate of the total Net FCM Proceeds and the Company’s incentive, under the 20% sharing proposed in its FCM Proposal, in the years 2017-2021. The Company has revised the $250,000 figure as a result of revisions to the projected capacity portfolio, as discussed in the Company’s response to Division 1-19. The revised amount is $240,000 as shown in Attachment DIV 1-3(d).

The Narragansett Electric Company d/b/a National Grid
RIPUC Docket No. 4676 In Re: Proposal to Bid Capacity of Customer-Owned DG Facilities
Into Forward Capacity Market Responses to the Division’s First Set of Data Requests
Issued on December 6, 2016
Prepared by or under the supervision of: Scott M. McCabe
Division 1-27
Request:
Please explain how any incentive or penalty payment that accrues to the company under its sharing proposal will be treated for ratemaking purposes. Response: The Company proposes to aggregate all ISO-NE transactions (payments received, including any incentives), fees, charges, or penalties associated with its participation in the forward capacity market (FCM), to arrive at a Net FCM Proceeds amount, as defined in the Company’s proposed revisions to the tariffs submitted in this proceeding. The Company is proposing to share Net FCM Proceeds with customers, with 80 percent of Net FCM Proceeds credited to or, in the case of negative Net FCM Proceeds, recovered from customers, and 20 percent retained by the Company. The Company’s 20 percent share would not be included in any reconciliation filing for the RE Growth Program or the Distributed Generation Standard Contracts program, nor would the Company’s 20 percent share be included in a general rate case as a cost or as revenue.

The Narragansett Electric Company d/b/a National Grid
RIPUC Docket No. 4676 In Re: Proposal to Bid Capacity of Customer-Owned DG Facilities
Into Forward Capacity Market Responses to the Division’s First Set of Data Requests
Issued on December 6, 2016
Prepared by or under the supervision of: Scott M. McCabe
Division 1-28
Request:
Please confirm that under the company’s proposal, the company’s administrative costs will not be subject to the sharing mechanism, and that 100% of these costs will be borne by customers. Response: The Company’s proposal is that all incremental administrative costs incurred as a result of participating in the Forward Capacity Market (FCM) on behalf of qualified Distributed Generation Standard Contracts (DGSC) and Renewable Energy (RE) Growth customers will not be subject to the sharing mechanism, but instead will be recovered from customers through the operation of the tariff provisions for the DGSC and RE Growth programs.

The Narragansett Electric Company d/b/a National Grid
RIPUC Docket No. 4676 In Re: Proposal to Bid Capacity of Customer-Owned DG Facilities
Into Forward Capacity Market Responses to the Division’s First Set of Data Requests
Issued on December 6, 2016
Prepared by or under the supervision of: Ian Springsteel
Division 1-29
Request:
Did the company consider any other sharing arrangements besides the one proposed? If so, please describe those arrangements and explain why they were not selected. Response: Yes, the Company did consider both higher and lower sharing percentages, as well as different sharing of the downside risks of Performance Incentive Penalties. This included lower and higher sharing levels, and a range of penalty sharing from 0% up to the Company taking 100% of the downside risk. After considering these options, the Company determined that the symmetrical sharing of upside and downside risks and rewards, balanced with the 20% sharing of Net Market Proceeds that is commensurate with the skills and level of effort required to effectively control the risks associated with the proposed market activities, was the most appropriate arrangement to propose.

The Narragansett Electric Company d/b/a National Grid
RIPUC Docket No. 4676 In Re: Proposal to Bid Capacity of Customer-Owned DG Facilities
Into Forward Capacity Market Responses to the Division’s First Set of Data Requests
Issued on December 6, 2016
Prepared by or under the supervision of: Ian Springsteel
Division 1-30
Request:
If this program requested by the company is approved, will that approval have any impact on the prices paid to existing of future REG and / or DGSC facilities? If so, please describe in detail. Response: No, the prices paid to the system owners under those programs are set by either contract under the Distributed Generation Standard Contracts program, or by tariff rates approved by the Public Utilities Commission under the Renewable Energy Growth program. These payment prices would not be affected by the participation of the systems in the ISO-NE Forward Capacity Market.