Embed Size (px)
Citation preview
VG424 Insect Pest Management in Vegetable Crops Grown in the Dry Tropics of North Queensland
John Brown Queensland Horticulture Institute

VG424
This report is published by the Horticultural Research and Development Corporation to pass on information concerning horticultural research and development undertaken for the vegetable industry.
The research contained in mis report was funded by the Horticultural Research and Development Corporation with the financial assistance of the Queensland Fruit and Vegetable Growers Association.
All expressions of opinion are not to be regarded as expressing the opinion of the Horticultural Research and Development Corporation or any authority of the Australian Government.
The Corporation and the Australian Government accept no responsibility for any of the opinions or the accuracy of the information contained in this report and readers should rely upon their own enquiries in making decisions concerning their own interests.
Cover price: $22.00 (GST Inclusive) HRDC ISBN 0 7341 0108 2
Published and distributed by: Horticultural Research & Development Corporation Level 6 7 Merriwa Street Gordon NSW 2072 Telephone: (02) 9418 2200 Fax: (02) 9418 1352 E-Mail: [email protected]
©Copyright 2000
6~
HRDIC
HORTICULTURAL RESEARCH & DEVELOPMENT CORPORATION
Partnership in horticulture

Project Number VG424
Insect Pest Management in Vegetable Crops
Grown in the Dry Tropics of North Queensland
John Brown
Queensland Horticulture Institute
Queensland Department of Primary Industries
Project Number VG 424

This publication is the final report for HRDC, Insect Pest Management in Vegetable Crops Grown in the Dry Tropics of North Queensland.
John Brown Department of Primary Industries P O Box 591 Ayr Q 4807.
Telephone: 07 47830401 Facsimile: 07 47833193 Email: [email protected]
The financial support of the following organisations is gratefully acknowledged:
Queensland Fruit and Vegetable Growers Horticultural Research and Development Corporation Queensland Department of Primary Industries
Any recommendations contained in this publication do not necessarily represent current HRDC policy. No person should act on the basis of the contents of this publication, whether as to matters of fact or opinion or other content, without first obtaining specific, independent professional advice in respect of the matters set out in this publication.

Table of Contents Page 1
Industry Summary
Technical Summary
3
4
1. Introduction l . l List of Figures
1.2 List of Tables
2. Trials 1994 2.1 Trials 1 and 2
2.11 Introduction 2.12 Materials and Methods 2.13 Results 2.14 Discussion
2.2 Trial 3 2.21 Introduction 2.22 Materials and Methods 2.23 Results 2.24 Discussion
2.3 Trial 4 2.31 Introduction 2.32 Materials and Methods 2.33 Results 2.34 Discussion
3. Trials 1995 3.1 Trial 5
3.11 Introduction 3.12 Materials and Methods 3.13 Results 3.14 Discussion
3.2 Trial 6 3.21 Introduction 3.22 Materials and Methods 3.23 Results 3.24 Discussion
3.3 Trial 7 3.31 Introduction 3.32 Materials and Methods 3.33 Results 3.34 Discussion
6 8
11
13 13 14 20
22 22 22 26
27 27 28 31
32 32 32 35
36 36 36 39
40 40 40 46
1

4. Trials 1996 4.1 Trials 8 and 9
5.
4.11 Introduction 47 4.12 Materials and Methods 47 4.13 Results 47 4.14 Discussion 50
4.2 Trial 10a and 10b 4.21 Introduction 51 4.22 Materials and Methods 51 4.23 Results 52 4.24 Discussion 54
55 55 56 59
61 61 61 66
67 67 67 71
73 73 73 73
6. 74 74 75
7. Discussion 114
8. Technology Transfer 115
9. Recommendations 115
10. Acknowledgments 116
11. References 116
Trials 1997 5.1 Trial 11
5.11 Introduction 5.12 Materials and Methods 5.13 Results 5.14 Discussion
5.2 Trial 12 5.21 Introduction 5.22 Materials and Methods 5.23 Results 5.24 Discussion
5.3 Trial 13 5.31 Introduction 5.32 Materials and Methods 5.33 Results 5.34 Discussion
5.4 Trial 13a 5.41 Introduction 5.42 Materials and Methods 5.43 Results 5.44 Discussion
Population Monitoring 6.1 Introduction 6.2 Materials and Methods 6.3 Results
2

INDUSTRY SUMMARY
This project looked at some of the control options available in managing the insect pests Heliothis, Cucumber Moth and Aphids in vegetable crops, mainly capsicum and Cucurbits, grown in the Dry Tropics of North Queensland.
Some of the results from the study showed that populations of Aphids could be managed with a reduction and in some cases nil insecticide usage. This was achieved by the natural occurrence of beneficial insects. These beneficial insect populations built up at the same time as the aphid populations and they reduced the aphid populations to very low levels throughout the cropping period in a short time. Applications of insecticides reduced the beneficial insect populations as well as the aphids. The dominant beneficial insect was the beetles from the family Coccinellidae (Ladybird beetles). In some years the aphid parasite (family Aphelinidae) was the dominant factor in reducing the populations and in one year 1996 the Hover flies (family Syrphidae) were the main predators.
The use of silver reflective mulch was shown to be effective in delaying aphid populations from increase and from the trapping records the highest number of flying adults were collected in May.
Populations of Heliothis were lower in capsicum crops that had not been sprayed and the seasonal pattern of moth flights indicated that there were large differences between the years though the highest numbers for H. armigera occurred around the July / August period. H. punctigera populations first appeared in the August / September period but in 1996 they were present all year. These differences reflect the extent of damage or need for changes in control measures each year. Vegetable crops grown in the Burdekin, which is surrounded by large areas of sugarcane, had lower populations of Heliothis than the more intensely farmed vegetable areas. Parasitism levels in the eggs of heliothis reached 80% and a number of wasp species were recorded
Control of Cucumber Moth by insecticides was achieved with a wide range of pesticides. Development of this insect from larvae to adult takes 46 days at 20°C, 30 days at 25°C and 19 days at 30°C.
The results from this study are a continuation in the development of sustainable EPM-based management systems for some of the insect pests of capsicum and cucurbit crops grown in the Dry Tropics.
3

TECHNICAL SUMMARY
Replicated trials were undertaken to evaluate a number of control options that could be used to manage Heicoverpa armigera and H. punctigera , Diaphania indica and Myzus persicae in Capsicum and some Cucurbit crops. These studies were undertaken between 1994 and 1997. A study on the development of Diaphania indica from larvae to adults of was also completed.
Four trials were completed during 1994 investigating the efficacy of insecticides for Heliothis and Aphids. The first trial evaluated the insecticides Imidacloprid, Methamidophos, Pirimicarb, Endosulfan a biological pesticide (Bt) and a vegetable oil (Synertrol) in a combination of ways. The results showed that these pesticides reduced the aphid populations but the presence of aphid parasites contributed to this decline. The insecticide Imidacloprid had more effect on the beneficial insect populations than Pirimicarb. Trial 3 evaluated the oil sprays Synertrol (a vegetable oil), Paramount (a mineral oil) and a plant growth regulator (Envy) for the control of Aphids. Again the influence of aphid parasites on aphid numbers contributed to the population decline. Oil applications had no effect on parasite numbers. Trial 2 evaluated insecticide applications at predetermined population levels of aphids before applications of insecticides were to be applied. Only one treatment "nil population of aphid" was treated and this treatment (Imidacloprid) did not control the aphid populations to a level any lower or higher than the effect that the aphid parasite had on them. Trial 4 evaluated Pirimicarb, Dimethoate and Acephate in combination with vegetable and mineral oils and Imidacloprid with vegetable oil in reducing virus disease transmitted by aphids on fruit production from a crop of Zucchini. There were no differences between the treatments but the incidence of disease increased as the crop matured.
Heliothis populations remained low in these trials and no differences between the treatments could be established. Trapping records show that the population levels were low this year compared to other years.
Three trials were completed in 1995. Two of these trials (5 and 7) were demonstration blocks to show the value of different coloured mulch on disease control and the third (trial 6) to evaluate the effect of Methamidophos on beneficial insect populations. The aphid counts showed that the silver mulch had lower populations and that the number of fruit harvested from the silver mulch treatments also yielded more fruit. All the mulch treatments produced fruit earlier than the bare soil treatment and the total number of squash fruit harvested was lowest in the black mulch treatment. Populations of aphids did not develop in trial 6 during the insecticide treatment application periods. This trial was then left unsprayed to measure the effect of beneficial insects on the aphid populations as they developed. The ladybird and lacewing populations developed and reduced the aphid populations.
Four trials were undertaken during 1996. Two of these were to evaluate if control of aphids in capsicum crops could be achieved without insecticides. This was achieved but the dominant beneficial insect was hover flies. The other two trials (10a and 10b) were to evaluate control of heliothis. Trial 10a evaluated Endosulfan, Methamidophos, Methomyl, Mevinphos, Sulprofos, an experimental insecticide code
4

303 and a biological pesticide MVP. Trial 10b evaluated the softer insecticides Bt and MVP with and without Endosulfan and MVP plus Pirimicarb. The results were not conclusive in these trials as populations of both aphids and heliothis were very low. It did show that the experimental insecticide 303 did not control heliothis.
Trials undertaken in 1997 included; trial 11 evaluating the insecticides Methamidophos, Imidacloprid, MVP plus Synertrol and Pirimicarb for the control of both aphids and heliothis. The results showed that MVP plus Synertrol did not control aphid populations. Trials 12 and 13 to evaluate control of aphid populations at different population levels. Again these trials showed that aphid populations can be controlled by beneficial insects, mainly ladybird beetles. Trial 13a evaluated Deltamethrin, Methomyl, Endosulfan, MVP and Imidacloprid for the control of Cucumber Moth. All of these insecticides reduced the populations.
Regular trapping of adult heliothis moths using pheromone traps had been undertaken in the years 1994 till 1997. This had been completed in a number of areas within the vegetable production areas. The number of moths trapped varied each year but the peak trapping periods occurred around August for H. armigera and September for H. punctigera. Populations of//, armigera were high in 1995 and 1997 and populations of//, punctigera were present throughout the year 1997. Normally this species only occurs in the later part of the year. Parasitism levels in Heliothis eggs were made which showed levels up to 80% parasitism in 1996. Adults of aphids and thrips flying were trapped using yellow water traps. These showed that aphids begin to move in May of each year and that thrip populations can reach high levels throughout the year.
The life cycle development of Cucumber Moth can be completed in an average of 46 days at 20°C, 30 days at 25° C and 19 days at 30°C.
5

1. INTRODUCTION
The vegetable industry comprising capsicum, cucumber, squash and zucchini return approximately $ 25m to the Dry Tropics district each year. (Source: DPI economist). These industries, based in the Dry Tropics, produce the major proportion of these crops in Queensland with the main growing season being through the winter months.
The insect pests associated with these crops can cause considerable damage. The main insect pests in these crops are Heliothis, Aphids and Cucumber Moth. Heliothis cause direct loss of vegetative and fruiting stages of the plants by chewing. These insects are very well adapted to our cropping systems and are one of the most serious pests in our crops. A paper by Zalucki et. al. (1986) gives an account of what we know of this pest in Australia.
Aphids, which transmit virus diseases in cucurbits, also produce honeydew on all of the crops, which downgrades the fruit. A number of studies have looked at anti-feedants, insecticides and alarm pheromones. A study, Pickett et.al. (1992), concluded that a closer interaction in the studies of sensory, chemical and behavioural techniques should be undertaken to investigate aspects of aphid chemical ecology involving olfactory cues. Rogue of disease plants is not an option in reducing virus disease as virus diseases can have an incubation period between 2 to 21 days.
Cucumber Moth feed on the vegetative growth and fruit of cucurbits. Very few studies have been undertaken on this pest and little is known of its biology or ecology.
In developing management systems for these pests a number of approaches were made. These included the monitor the insect populations throughout the year. This would give an indication of when the pests are present and their most abundant periods. Knowing this could assist with developing control strategies as shown by Qureshi et al 1993 with pink bollworm larvae in cotton. In monitoring Heliothis populations, pheromone traps were established throughout the districts. . The pheromones were placed in funnel traps as recommended by AgriSense. Aphid populations were determined by monitoring the number of adults collected in yellow pan traps. Similar traps had been used to monitor the activity of virus vector aphids on cucumbers, Basky and Nasser (1989).
Most management systems involved controlling the pests by insecticides. These controls had been developed for the insect pests in the different crops over many years. Kay and Brown (1990) showed that effective control of aphids could be achieved with insecticides. Many papers have been written on the control of Heliothis with insecticides in many crops. These controls have evaluated individual insecticides, rotation of different chemical groups and the use of certain insecticides during selected periods. These strategies have been employed to manage resistance development in the insect. Evaluation of the soft insecticides (biologicals) has also been tested over many years. Improvements in the use of these types of pesticides are ongoing and an example is that by Monsour and Teakle (1995). They showed better field persistence with a novel Bt for the control of Heliothis.
Other approaches for the control of these insects have been developed. Pinese (1987) showed the value of reflective mulch and oil, Adams (1991) showed the advantages of
6

using oils in keeping mosaic virus disease at bay. Other studies have looked at understanding the insect pest behaviour. Reuter et.al. (1993), looked at modifying the feeding behaviour of green peach aphid, Sewell et.al (1990) the relationship between Coccinellids and aphids in the spread of virus disease.
Biological control of these insect pests has been discussed or trialed on a number of occasions. Daane et.al (1993) evaluated control of leafhoppers with releases of lacewings (a predator of aphids), Bai and Smith (1993) the effect of host availability and survival of Trichogramma and Seymour et.al (1994) the use of Trichogramma as a biocontrol agent against Heliothis.
This project was developed as part of the ongoing program to develop Integrated Pest Management systems in vegetable crops. Previous studies have identified insecticide controls that were effective, but over time the effectiveness of these in controlling the insects has become less acceptable and in some instances they failed to control the insect. The development of insect pest controls, incorporating IPM systems is being sought, not only by the growers and the consumers but it is being seen to have important environmental advantages.
7
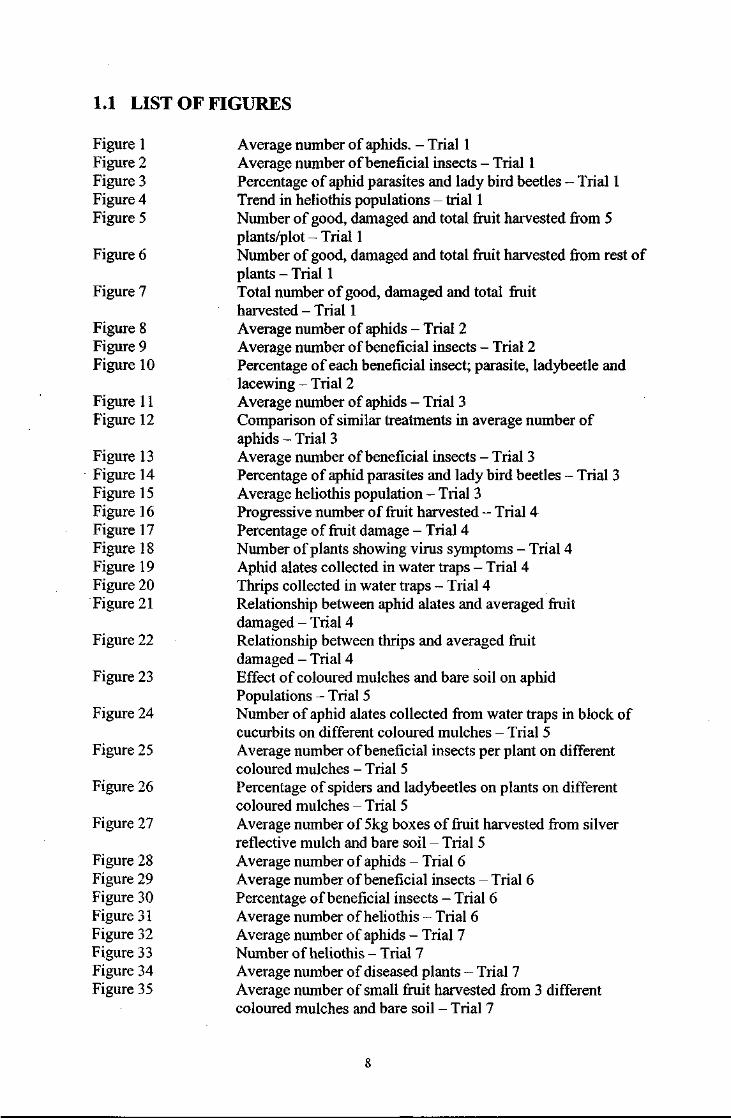
1.1 LIST OF FIGURES
Figure 1 Average number of aphids. - Trial 1 Figure 2 Average number of beneficial insects - Trial 1 Figure 3 Percentage of aphid parasites and lady bird beetles - Trial 1 Figure 4 Trend in heliothis populations - trial 1 Figure 5 Number of good, damaged and total fruit harvested from 5
plants/plot - Trial 1 Figure 6 Number of good, damaged and total fruit harvested from rest of
plants - Trial 1 Figure 7 Total number of good, damaged and total fruit
harvested - Trial 1 Figure 8 Average number of aphids - Trial 2 Figure 9 Average number of beneficial insects - Trial 2 Figure 10 Percentage of each beneficial insect; parasite, ladybeetle and
lacewing - Trial 2 Figure 11 Average number of aphids - Trial 3 Figure 12 Comparison of similar treatments in average number of
aphids - Trial 3 Figure 13 Average number of beneficial insects - Trial 3 Figure 14 Percentage of aphid parasites and lady bird beetles - Trial 3 Figure 15 Average heliothis population - Trial 3 Figure 16 Progressive number of fruit harvested - Trial 4 Figure 17 Percentage of fruit damage - Trial 4 Figure 18 Number of plants showing virus symptoms - Trial 4 Figure 19 Aphid alates collected in water traps - Trial 4 Figure 20 Thrips collected in water traps - Trial 4 Figure 21 Relationship between aphid alates and averaged fruit
damaged - Trial 4 Figure 22 Relationship between thrips and averaged fruit
damaged - Trial 4 Figure 23 Effect of coloured mulches and bare soil on aphid
Populations - Trial 5 Figure 24 Number of aphid alates collected from water traps in block of
cucurbits on different coloured mulches - Trial 5 Figure 25 Average number of beneficial insects per plant on different
coloured mulches - Trial 5 Figure 26 Percentage of spiders and ladybeetles on plants on different
coloured mulches - Trial 5 Figure 27 Average number of 5kg boxes of fruit harvested from silver
reflective mulch and bare soil - Trial 5 Figure 28 Average number of aphids - Trial 6 Figure 29 Average number of beneficial insects - Trial 6 Figure 30 Percentage of beneficial insects - Trial 6 Figure 31 Average number of heliothis - Trial 6 Figure 32 Average number of aphids - Trial 7 Figure 33 Number of heliothis - Trial 7 Figure 34 Average number of diseased plants - Trial 7 Figure 35 Average number of small fruit harvested from 3 different
coloured mulches and bare soil - Trial 7

Figure 36 Average number of medium fruit harvested from 3 different coloured mulches and bare soil - Trial 7
Figure 37 Average number of large fruit harvested from 3 different coloured mulches and bare soil - Trial 7
Figure 38 Average number of spotted fruit harvested from 3 different coloured mulches and bare soil - Trial 7
Figure 39 Average number of green fruit harvested from 3 different coloured mulches and bare soil - Trial 7
Figure 40 Average number of total fruit harvested from 3 different coloured mulches and bare soil - Trial 7
Figure 41 Average number of aphids and beneficial insects per leaf- Trial 8
Figure 42 Average number of aphids and beneficial insects per leaf- Trial 9
Figure 43 Average number of aphids per leaf- Trial 11 Figure 44 Average number of ladybeetles per leaf- Trial 11 Figure 45 Average number of lacewings per leaf- Trial 11 Figure 46 Average number of parasites per leaf- Trial 11 Figure 47 Average number of heliothis - Trial 11 Figure 48 Relationship between number of fruit and average number of
aphids - Trial 11 Figure 49 Number of good, honeydew and damaged fruit - Trial 11 Figure 50 Average number of aphids - Trial 12 Figure 51 Average number of ladybird beetles - Trial 12 Figure 52 Relationship between aphid and ladybird beetle
populations - Trial 12 Figure 53 Total aphid and ladybird beetle populations - Trial 12 Figure 54 Average number of lacewings - Trial 12 Figure 55 Average number of parasites - Trial 12 Figure 56 Percentage of beneficial insects - Trial 12 Figure 57 Trend in heliothis populations - Trial 12 Figure 58 Number of good and damaged fruit harvested - Trial 12 Figure 59 Average number of aphids - Trial 13 Figure 60 Average number of ladybird beetles - Trial 13 Figure 61 Average number of aphid and ladybird beetle - Trial 13
Populations - Trial 13 Figure 62 Average number of lacewings - Trial 13 Figure 63 Average number of parasites - Trial 13 Figure 64 Percentage of each beneficial insect - Trial 13 Figure 65 Trend in heliothis populations - Trial 13 Figure 66 Number of undamaged and damaged fruit
Harvested - Trial 13 Figure 67-74 Heliothis populations 1994 Figure 75-84 Heliothis populations 1995 Figure 85-94 Heliothis populations 1996 Figure 95-104 Heliothis populations 1997 Figure 105-112 Aphid and thrip populations 1994 Figure 113-122 Aphid and thrip populations 1995 Figure 123-132 Aphid and thrip populations 1996 Figure 133-142 Aphid and thrip populations 1997
9

Figure 143 Heliothis egg parasitism off capsicum Figure 144 Heliothis egg parasitism off zucchini Figure 145 Heliothis egg parasitism off squash Figure 146 Development time (days) for Cucumber Moth to reach the
different life stages under three different temperatures

1.2 LIST OF TABLES
Table 1 Table 2 Table 3 Table 4 Table 5 Table 6 Table 7 Table 8 Table 9
Table 10 Table 11 Table 12 Table 13
Table 14
Table 15
Table 16
Table 17
Table 18
Table 19
Table 20 Table 21 Table 22 Table 23 Table 24 Table 25 Table 26 Table 27 Table 28 Table 29 Table 30 Table 31
Table 32
Table 33 Table 34 Table 35
Table 36
Average number of aphids - Trial 1 Average number of heliothis - Trial 1 Average number of fruit harvested - Trial 1 Average number of aphids - Trial 2 Average number of aphids - Trial 3 Average number of heliothis - Trial 3 Average number of fruit harvested - Trial 4 Average number of aphids - Trial 5 Average number of diseased plants in each of the coloured mulch treatments - Trial 5 Average number of aphids - Trial 6 Average number of heliothis- Trial 6 Average number of aphids - Trial 7 Average number of plants showing disease symptoms in the different coloured mulch treatments - Trial 7 Average number of small fruit harvested from the different mulches and bare soil - Trial 7 Average number of medium fruit harvested from the different mulches and bare soil - Trial 7 Average number of large fruit harvested from the different mulches and bare soil - Trial 7 Average number of spotted fruit harvested from the different mulches and bare soil - Trial 7 Average number of green fruit harvested from the different mulches and bare soil - Trial 7 Average number of total fruit harvested from the different mulches and bare soil - Trial 7 Average number of aphids - Trial 8 Average number of syrphid flies - Trial 8 Average number of ladybeetles - Trial 8 Average number of aphids- Trial 9 Average number of aphids - Trial 10a Average number of heliothis - Trial 10a Average number of fruit harvested from 5 plants Average number of heliothis - Trial 1 Ob Average number of fruit harvested from 5 plants - trial 10b Average number of aphids - Trial 11 Average number of ladybird beetles - Trial 11 Average number of good, honeydew affected and damaged fruit harvested in the first pick - Trial 11 Average number of good, honeydew affected and damaged fruit harvested in the second pick - Trial 11 Average number of aphids - Trial 12 Average number of ladybird beetles - Trial 12 Relationship between aphid and ladybird beetle populations - Trial 12 Average number of lacewings - Trial 12
11

Table 37 Average number of parasites - Trial 12 Table 38 Average number of heliothis - Trial 12 Table 39 Average number of aphids - Trial 13 Table 40 Average number of ladybird beetles - Trial 13 Table 41 Average number of lacewings - Trial 13 Table 42 Average number of heliothis - Trial 13 Table 43 Average number of larvae - Trial 13a
12

2.0 Trials 1994.
2.1 TRIALS 1 and 2.
2.11 INTRODUCTION:
These trials were undertaken to evaluate different approaches to aphid and Heliothis control in a crop of capsicums. Trial 1 was designed to evaluate insecticides for the control of both aphids and Heliothis. The second trial was designed to evaluate control of aphids only when they reached designated population levels.
2.12 MATERIALS and METHODS:
Trial 1.
Trial design was based on 5 treatments by 4 replications with plot size 7 metres by 1 double row of capsicums. Each datum area was separated by a double row of capsicum plants. The crops were planted on black plastic mulch beds. Counts of insects were made by randomly selecting 5 plants per plot and examining 4 leaves on each of these plants. This gave a total of 20 leaves per plot that were examined each time throughout the trial period. The same plants were selected each time but not the same leaves.
Counts started on the 7th September and were undertaken every 3 to 4 days until the 14* October when counts were then undertaken at 7 day intervals up to and including the 2nd November. The last count on the 28th November was made to determine if insect population densities had changed. Aphid populations were determined by counting individuals, whether they were nymphs, wingless or winged-formed adults, while Heliothis eggs or larvae were recorded as separate individuals. Beneficial insects were counted in the following way. A mummified aphid (parasitised aphid) as one, adults or larvae of ladybird beetles and lacewing as one each while the egg cluster/mass of the latter two were recorded as one.
Spray treatments were applied to the crop through a powered motorised knapsack sprayer at 689 KPa over the top of the crop using a hand held boom. Sprays were applied on the following dates and the insecticides used on each of those dates listed. The compounds used are listed by their commercial name following the use of their chemical name on the first occasion.
Treatments 7th September. Treatments 26th September
A Nil spray A Nil B Imidacloprid (Confidor) B Endosulfan (Thiodan) C Imidacloprid + Bt + Vegetable oil (Synertrol) C Bt + Synertrol D Methamidophos (Nitofol) D Nitofol E Pirimicarb (Pirimor) E Thiodan + Pirimor
13
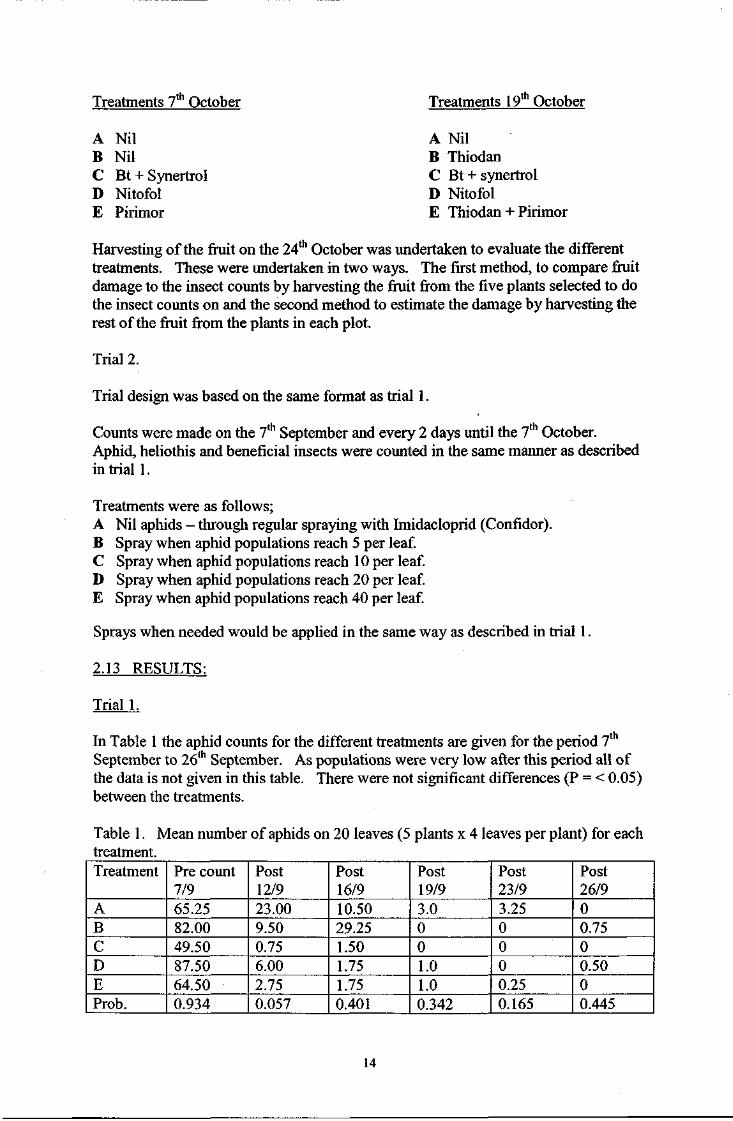
Treatments 7 October Treatments 19 October
A Nil B Nil C Bt + Synertrol D Nitofol E Pirimor
A Nil B Thiodan C Bt + synertrol D Nitofol E Thiodan + Pirimor
Harvesting of the fruit on the 24th October was undertaken to evaluate the different treatments. These were undertaken in two ways. The first method, to compare fruit damage to the insect counts by harvesting the fruit from the five plants selected to do the insect counts on and the second method to estimate the damage by harvesting the rest of the fruit from the plants in each plot.
Trial 2.
Trial design was based on the same format as trial 1.
Counts were made on the 7th September and every 2 days until the 7th October. Aphid, heliothis and beneficial insects were counted in the same manner as described in trial 1.
Treatments were as follows; A Nil aphids - through regular spraying with Imidacloprid (Confidor). B Spray when aphid populations reach 5 per leaf. C Spray when aphid populations reach 10 per leaf. D Spray when aphid populations reach 20 per leaf. E Spray when aphid populations reach 40 per leaf.
Sprays when needed would be applied in the same way as described in trial 1.
2.13 RESULTS:
Trial 1.
In Table 1 the aphid counts for the different treatments are given for the period 7th
September to 26th September. As populations were very low after this period all of the data is not given in this table. There were not significant differences (P = < 0.05) between the treatments.
Table 1. Mean number of aphids on 20 leaves (5 plants x 4 leaves per plant) for each treatment. Treatment Pre count
7/9 Post 12/9
Post 16/9
Post 19/9
Post 23/9
Post 26/9
A 65.25 23.00 10.50 3.0 3.25 0 B 82.00 9.50 29.25 0 0 0.75 C 49.50 0.75 1.50 0 0 0 D 87.50 6.00 1.75 1.0 0 0.50 E 64.50 2.75 1.75 1.0 0.25 0 Prob. 0.934 0.057 0.401 0.342 0.165 0.445
14

The pre-treatment count on the 7l September indicated no difference at the start of the trial but following the first insecticide application on that same date, the 5 day post-treatment count (12/9) was close to showing a significant difference (P = < 0.05) between the treatments. At this date all insecticide treatments had reduced aphid populations more than the nil spray treatment A. By the 16th September the population in the control treatment A, were further reduced by approximately 50% whereas in treatment B, the aphid population had trebled in number.
In Figure 1 the aphid population for each treatment is shown for the full period of the trial (7* September to 28th November). As can be seen from this figure the aphid populations were reducing across all treatments within the first 5 days of recording. It is only in treatment B that the population increased between the period 12th to the 19 September. The aphid populations did not recover in any of the treatment after the initial drop in populations occurred.
Figure 1. Average number of aphids recorded per leaf for 5 treatments over approximately a three-month period.
To show the influence that the beneficial insects (aphid parasites and ladybeetles) had on the aphid populations, the total number of these beneficial insects recorded from the different treatments is shown in Figure 2.
Analysis of this data gave no significant differences (P = < 0.05) between the treatments for the number of beneficial insects recorded. The nil spray treatment showed an increase in beneficial insects while the insecticide treatments showed different levels of decline. Treatment E (Pirimor) appeared to be softer on beneficial insects than the other insecticide treatments.
15

Figure 2. Average number of beneficial insects, that affect aphid populations, recorded per leaf for 5 treatments over approximately a three-month period.
The percentage of each of these beneficial insect recorded in this trial is shown in Figure 3. From this figure the parasites had the most influence on aphid numbers during the early stages of the crop and as the aphid numbers decreased the parasite numbers dropped and the ladybird beetles maintained this low aphid population.
Figure 3. Percentage of aphid parasites and ladybird beetles recorded over approximately a three-month period.
In Table 2, the Heliothis populations present throughout the trial period are given. Analysis of the numbers recorded did not show significant differences (P = < 0.05) between the treatments.
Table 2. Mean number of Heliothis (eggs and larvae) recorded on 20 leaves per treatments over approximately a three month period.
Se ptember | October Nov Treat 7 12 16 19 23 26 30 3 7 10 14 21 28 2
A 0.25 0.75 0.75 0.25 1.75 3.00 1.25 1.00 1.00 0.75 0.75 0.00 0.25 1.25
B 0.00 0.50 1.00 0.50 0.75 2.75 0.75 0.50 1.00 0.25 0.75 0.00 0.25 0.00 C 0.25 0.00 0.75 0.50 0.50 2.50 3.25 1.50 1.00 0.00 0.50 0.00 0.00 0.25
D 0.00 0.50 0.50 0.00 1.50 3.00 2.50 0.50 1.00 0.25 0.75 0.25 0.25 0.00
E 0.25 0.75 0.25 0.00 0.75 1.75 1.00 0.75 1.00 .050 0.25 0.75 0.25 0.50
Prob. 0.78 0.69 0.53 0.30 0.19 0.73 0.12 0.65 NS 0.09 0.84 0.18 0.89 0.14
Figure 4 shows the trend in the Heliothis populations recorded in the different treatments over approximately a three month period. The populations started to increase in all treatments after the first spray on the 7th September but then declined.
- Parasite
- L/beetle
16

On the 20 September the population started to increase again in all treatments but following the second insecticide application on the 26th September the population again declined. At this time two insecticides treatments C and D showed a delay in the population decline by approximately 4 days. From the 30th September until the 21st October the population remained at the same level with a slight increase in the unsprayed treatment A around the 2nd November.
Figure 4. Trend in Heliothis populations between 7 September and 2n November for 5 treatments.
In Table 3 the fruit harvested from 5 plants per plot (harvest 1) and all the remaining fruit (harvest 2) from the rest of the plants within the treated plots are given. The results of these harvests did not show a significant difference (P = < 0.05) between the treatments.
Table 3. Mean number of fruit harvested from 5 plants per plot (harvest 1), and harvest 2 (from the rest of the plants) for 5 treatments on the 24th October. Treat. harvest iarvest 2 Total Harvest
Good fruit
Dam. Fruit
Total Good fruit
Dam. Fruit
Total
A 18.25 14.00 24.25 68.00 6.00 82.00 106.2 B 17.25 9.00 21.00 55.75 3.75 64.75 85.75 C 14.75 5.75 18.25 58.50 3.50 64.25 82.50 D 17.50 8.75 19.50 69.25 2.00 78.00 97.50 E 16.50 8.50 19.25 70.75 2.75 79.25 98.50
Prob. 0.955 0.076 0.815 0.820 0.132 0.668 0.743
In each of Figures 5, 6 and 7 the number of good, damaged and total fruit harvested for 5 plants per plot (Figure 5), rest of the plants per plot (Figure 6) and total number of fruit harvested from the two harvests (Figure 7) are shown for the 5 treatments.
17

Figure 5. Number of good, damaged and total fruit harvested from 5 plants per plot for 5 treatments.
120 i
100-
E 60-
Z 40
20
0
120 i
100-
E 60-
Z 40
20
0
120 i
100-
E 60-
Z 40
20
0
120 i
100-
E 60-
Z 40
20
0
-—
— •
BGood
• Damaged
D Total
120 i
100-
E 60-
Z 40
20
0
-— - *
— •
i
BGood
• Damaged
D Total
120 i
100-
E 60-
Z 40
20
0
—
• B
-
C
atm
— •
120 i
100-
E 60-
Z 40
20
0 A
• B
Tre
C
atm ent
D E
Figure 6. Number of good, damaged and total fruit harvested from the rest of the plants per plot for 5 treatments.
350
300 |-
250
| 200 -
I 150 -Z 100
50
0
• Good
• Damaged
D Total
C
Treatment
Figure 7. Total number of good, damaged and total fruit harvested for the 5 treatment.
500-i
400
j j 300 E = 200
100
0 m m
SI Good
B Damaged
• Total
C
Treatment
18

Trial 2.
In Table 4 the aphid counts for the different treatments are given for the period 7th
September to 7 October. As the aphid populations did not reach the required levels to meet the treatment thresholds for treatments B, C, D and E no chemical treatment were applied to these treatments. There were no significant differences between these same treatments. Because of this, the counts in these treatments have been blocked together as an unsprayed treatment. This is the analysis undertaken on the data comparing sprayed and unsprayed treatments for aphid number per leaf.
Table 4. Mean number of aphids on 20 leaves (5 plants x treatment A and 80 leaves for the unsprayed blocks.
4 leaves ?er plant) for
Treat. 7/9 12/9 16/9 19/9 23/9 26/9 30/9 7/10
Spray 2.913 o.oooa 0.187a 0.012a 0.037 0.000 0.012 0.025
Un-spray
2.225 2.012" 0.909" 0.128" 0.162 0.022 0.047 0.019
Prob. 0.710 0.039 0.017 0.035 0.292 0.133 0.362 0.844
*Numb( ;rs follow* 3d by the s same lette r are not s ignificant y different P = < 0.05.
At the pre-treatment count (7th September) there were no significant differences between the sprayed and unsprayed blocks. Five days after the spray application to treatment A, the sprayed treatment had a significantly lower mean number of aphids than the means of the unsprayed blocks. This significant difference continued through the 9 and 12day post-treatment counts. After this period there were no significant differences between the treatments.
Figure 8 shows that the decline in aphid populations to very low levels took 7 days following a spray application. It also shows that the aphid population declined in the unsprayed blocks took 14days to reach the same level. The two populations then remained very low for the rest of the trial period.
Figure 8. Average number of aphids per leaf for the sprayed and unsprayed treatments.
19

The decline in the unsprayed blocks was probably due to the beneficial insects. This can be seen in Figure 9 where the number of beneficial insects was higher in the unsprayed blocks compared to the sprayed blocks and their populations peaked at the height of the aphid populations. The aphid populations in both the sprayed and unsprayed blocks did not recover from the initial decline and this could be contributed to the beneficial insect populations.
Figure 9. Average number of beneficial insects per leaf in the sprayed and unsprayed blocks.
-•— Sprayed
-•— Unsprayed
ss&^J'&Wf-?•??•?
In figure 10 the percentage of each of the beneficial insects, parasites, ladybeetles and lacewings is shown.
Figure 10. Percentage of each beneficial insect; parasite, ladybeetle and lacewing.
100 90 80 70 60 50 40 30 20 10 0
—-iSfce.
x ^ ^ -*=——*====3r—
.<£
<£' J* <* sfi <T
&
-•— Farasite
-a— Lady beetle
Lacewing
Again it shows that the aphid parasites were the most dominant beneficial insect and they were probably responsible for the decrease in aphid populations. Ladybird beetles replaced the parasites as the aphid populations declined.
2.14 DISCUSSION:
The insecticides used in Trial 1 are known to have some effect on aphid populations. The rapid reduction in aphid populations in trial 1 from the 7th to the 12th September could be attributed to these chemicals but because the aphid population in the control treatment (unsprayed) also declined the overall reduction could be partly attributed to the beneficial insect populations, particularly the parasites. Trial 2 shows that the
20

difference in time was only 7days in reducing the aphid populations to very low populations. The aphid populations did not recover in this crop in both trials following the initial decline in population and this was probably due to the continual presence of these beneficial insects. The need to look at Confidor in its affect on beneficial insects as it reduced the beneficial populations the most of all the chemical treatments. Pirimor appeared to have the least affect on beneficial populations. The reduction in beneficial populations as the aphid population declined is expected as they need aphid populations to survive.
The reason for the Heliothis decline in the control treatment (unsprayed) during 26 September, the same period as when the sprayed treatments were applied, and then remaining low for the rest of the trial period similar to the other treatments is unknown. It is possible that the population of ladybeetles could have been feeding on the eggs or early larval stages of Heliothis when their preferred hosts were reduced in numbers, but this could not be recorded.
Looking at the total yield recorded for the 5 treatments, it shows that there were more fruit harvested from the control treatment, though not significantly more than the other treatments. This could be due to more insect pollinators being present in the absence of insecticides.
21

2.2 TRIAL 3
2.21 INTRODUCTION:
This trial was superimposed on a trial evaluating control options for Powdery Mildew in capsicums. Some of the control options being evaluated involved oil sprays and these were considered to be effective against aphid populations in crops.
2.22 MATERIALS and METHODS:
Trial design was based on 8 treatments by 4 replications with plot size 7 metres by 1 double row of capsicums. Each datum area was separated by a double row of capsicum plants. The crop was planted on black plastic mulch beds. Counts of insects were made by randomly selecting 3 plants per plot and examine 4 leaves on each of these plants. This gave a total of 12 leaves per plot that were examined each time throughout the trial period. The same plants were selected each time but not the same leaves.
Counts were made on the 26th September, 3rd and 10th October and the 2nd November. Aphid populations were determined by counting individuals, whether they were nymphs, wingless or winged-formed adults, while Heliothis eggs or larvae were recorded as separate individuals. Beneficial insects were counted in the following way. A mummified aphid (parasitised aphid) as one, adults of ladybird beetles as one while their egg clusters were recorded as one.
Spray applications were applied weekly using a motorised knapsack sprayer.
The following treatments were; A Plants water stress + nil chemical treatment. B t t tC t t + Vegetable oil (Synertrol) C a tc i t + Mineral oil (Paramount oil) D 61 6i t t + Growth regulator (Envy) E Plant water maintained + Nil chemical treatment F U (.(. ti + Synertrol G n (.(. a + Paramount H sc tt tc + Envy
2.23 RESULTS:
In Table 5 the aphid counts for the different treatments are given. The populations did not recover after the first sprays and this cannot be contributed to sprays alone as the nil - sprayed plots also declined.
22

Table 5. Mean number of aphids on 12 leaves (3 plants x 4 leaves per plant) for each treatment. Treatment 26/9 3/10 10/10 2/11 A 6.75 31.50 3.50 0.00 B 29.25 17.00 0.00 0.00 C 33.50 25.25 0.75 0.00 D 9.25 34.25 0.50 0.00 E 0.50 15.25 0.50 0.25 F 31.75 4.50 1.00 0.00 G 11.00 16.00 3.75 0.00 H 9.50 11.50 0.50 0.00 Prob. 0.391 0.233 0.616 0.459
There were no significant differences between the treatments for aphid populations at each of the count dates.
The changes in aphid populations can be see from Figure 11.
Figure 11. Average number of aphids recorded per leaf for 8 treatments between 26th
September and 31st October.
This figure shows that most treatments were increasing between the first and second counts with only treatments B, C and F decreasing. This might suggest that the vegetable oil and Synertrol had some effect against aphid populations though not significant from the other treatments in this trial. All treatments declined between the second and third counts and remained low.
As this trial evaluated the same treatments except that one group were applied to stressed plants and a similar group to unstressed plants, the difference between the 4 treatments, Nil spray, Synertrol oil, Paramount oil and Envy is shown in figure 12.
23

Figure 12. Comparison of similar treatments in the average number of aphids when totalled together.
6
• 4
| 3 «: 2
i 1 0 -
of
6
• 4
| 3 «: 2
i 1 0 -
of
I 6
• 4
| 3 «: 2
i 1 0 -
of
I —•—Nil
—•— Synertrol
Paramount
—-*=— Envy
6
• 4
| 3 «: 2
i 1 0 -
of
- - (
—•—Nil
—•— Synertrol
Paramount
—-*=— Envy
6
• 4
| 3 «: 2
i 1 0 -
of
— - - (
—•—Nil
—•— Synertrol
Paramount
—-*=— Envy
6
• 4
| 3 «: 2
i 1 0 -
of
*
— I
—•—Nil
—•— Synertrol
Paramount
—-*=— Envy
6
• 4
| 3 «: 2
i 1 0 -
of
* >?•
i J
"3
—•—Nil
—•— Synertrol
Paramount
—-*=— Envy
6
• 4
| 3 «: 2
i 1 0 -
of
* >?•
i J
"3
6
• 4
| 3 «: 2
i 1 0 -
of
] M 1
Date S
i J
"3
Looking at this figure it appears that the Synertrol treatment has a direct effect on aphid populations compared to the other treatments which initially increased before decreasing.
Figure 13 shows the beneficial insect population associated with the aphid population in this trial. Again the beneficial insect populations decreased with the decrease in aphid populations. This is expected as in this trial the main beneficial insect is the parasites and they need the host to survive. From Figure 14 the percent of each beneficial insect is shown and again as the parasite population decreases the ladybird beetle populations increase.
Figure 13. Average number of beneficial insects, that affect aphid populations, recorded per leaf for 8 treatments.
The percentage of each of these beneficial insects recorded in this trial is shown in Figure 14. From this figure it shows that the parasites had the most influence on aphid numbers.
24

Figure 14. Percentage of the aphid parasites and ladybird beetles recorded during the trial.
<r ^ Date
-•— Parasite
-•— Lady beetle
Heliothis populations were recorded throughout the same period as the aphid counts. In Table 6 the average number of Heliothis on 12 leaves is given.
Table 6. Average number of Heliothis recorded on plant) for 8 treatments.
12 leaves (3 plants x 4 leaves per
Treatment 26/9 3/10 10/10 2/11 A 1.75 0.75 0.00 0.25 B 2.00 0.00 0.00 0.25 C 0.50 0.25 0.00 0.00 D 2.00 1.50 0.50 0.00 E 1.75 0.50 0.75 0.00 F 1.00 0.75 0.00 0.50 G 2.50 0.50 0.00 0.25 H 2.50 1.00 0.50 0.00 Prob. 0.675 0.148 0.333 0.402
There were no significant difference between treatments for the 4 periods of recording.
From Figure 15 the decline in Heliothis populations is shown. This decline is similar to that experienced with the aphid populations where they dropped to low populations within the first 10 days.
25

Figure 15. Average Heliothis population on 12 leaves (3 plants x 4 leaves per plant) for 8 treatments.
3
I 2"5 \ is 2 i ^ i 1.5 1 0 ,
8. 1 £ ^ *W
3
I 2"5 \ is 2 i ^ i 1.5 1 0 ,
8. 1 £ ^ *W -H»-B
c -~H— D
* > 0.5 -<
0 - , - ^S = = = * - • - F
* > 0.5 -<
0 - , - ^S • • - • - F
^ ^ Date
• / —1—G
— — H
2.24 DISCUSSION:
The decrease in aphid populations in the synertrol treatments could be real but the parasite populations also increased in these treatments which is probably influencing the declining aphid populations as well. All the treatments declined after the third count 10th October and this was probably due to the beneficial insects. It is known that the parasite populations will decline when their host, aphids in this case, are low in numbers. Again the increase in ladybird beetles as the parasite populations drop occurred.
The decline in Heliothis numbers during the same period cannot be due to treatment effects as the controls, (nil chemical treatments), also declined.
26

2.3 TRIAL 4
2.31 INTRODUCTION:
This trial was undertaken on the Ayr Research Station between July and October. The trial was designed to evaluate a number of insecticides and oils in controlling the aphid and Heliothis populations. The trial was planted on silver reflective mulch as it has been suspected that viruses, which are transmitted by aphids, are present at this time of the year. Previous research studies have shown that the use of reflective mulches delays the incidence of virus build up in plants. Thrip counts were undertaken in this trial as they were seen to be present and are recorded as pests in curcubit crops.
2.32 MATERIALS and METHODS:
Trial design was based on 9 treatments by 4 replicated blocks with plot size 6 metres x 1 row of zucchini plants planted on silver reflective plastic mulch. A guard row separated each datum row.
Counts were made on fruit harvested every 2 to 3 days with the first pick on 19 August. Fruit was examined for the presence of visible virus damage (deformed fruit) or Heliothis damage (chewed fruit). Weights of fruit were made but will not be discussed as weights can be misleading due to the fast growing nature of the fruit. If a fruit was missed being picked for a couple of days the weight is enormous. Yellow water traps, (pans 20cm diameter by 10cm deep and painted 'canary yellow'), were used to collect flying adult aphid and thrip populations.
Spray treatments were applied over the top of the crop using a motorised knapsack sprayer at 689KPa with a hand held boom. Sprays were applied weekly after planting.
Treatments.
A Pirimicarb (Pirimor) + Mineral oil (D C Tron) B t t + Vegetable oil (Synertrol) C Dimeothate (Rogor) + Mineral oil D t t + Vegetable oil E Acephate (Orthene) + Mineral oil F t t + Vegetable oil G Imidacloprid (Confidor) H t t +Vegetable oil I Control (nil spray)
27

2.33 RESULTS:
In Table 7 the number of fruit harvested from each treatment is shown for all picks.
Table 7 . Average number of fruit harvested from 9 treatments. Treat ment
August September
Date 19 22 24 26 29 31 2 5 9 12 14
A 1.75 4.00 4.50 4.00 12.0 5.50 11.0 5.00 11.2 13.7 12.5
B 2.00 4.50 5.75 5.00 8.75 5.75 8.00 5.0 12.7 10.2 9.75
C 1.75 2.25 6.25 6.50 12.2 6.50 9.00 9.50 13.7 10.2 10.2
D 2.25 4.75 4.25 8.25 14.0 5.50 12.2 5.75 14.5 10.5 11.5
E 2.25 5.00 8.25 6.50 13.5 8.00 13.0 6.25 11.7 5.75 11.5
F 2.00 6.25 5.75 5.25 13.0 7.75 10.2 5.25 14.7 11.0 12.5
G 2.75 8.00 7.25 5.75 10.2 5.75 10.0 6.25 10.5 11.5 9.75
H 3.25 3.75 7.25 5.75 12.0 5.00 8.50 6.25 15.0 8.00 14.2
I 1.75 5.75 7.25 9.75 12.0 4.75 14.5 4.75 19.2 8.75 7.50.
Prob. 0.96 0.1 0.92 0.19 0.84 0.39 0.53 0.32 0.16 0.69 0.78
There were no significant differences between the treatments.
From Figure 16 the progressive number of fruit harvested from each treatment is shown. From this figure it can be seen that there are no differences between the treatments as they follow a similar path.
Figure 16. Progressive total number of fruit harvested from each treatment.
^ ^ ^ ^ ^ o£> ^ cf -^ T > <$> <p <i> <£> ^ \ *
Date
^vv/vv*
-•—A
•~S I— B
c -X— D
- * — E
- • — F
- + — G
— H
——I
From Figure 17 the percent of fruit damaged for the different treatments is shown. From this figure it shows a higher incidence of damage between the 4th and 8th and then another increase between the 10th and 16th September. The analysis for the data did not give a significant difference between the treatments for the number of damaged fruit.
28

Figure 17. Percent of fruit damaged recorded for each treatment.
The increase in the damage for all treatments at the two periods can be linked to the increase in plants that were showing symptoms of virus. In Figure 18 the rating for virus affected plants is shown. Again these differences in numbers are not significantly different between the treatments.
Figure 18. Number of plants showing virus symptoms.
Figure 19 shows the number of aphid alates and Figure 20 the number of thrips collected from the water traps from the 13th July to the 15th September.
29

Figure 19. September.
Aphid alates collected in water traps between the 13th July and 15th
12
10
E 6
z" 4 -
2 -
0 -
10
E 6
z" 4 -
2 -
0 -
10
E 6
z" 4 -
2 -
0 -
- - •
10
E 6
z" 4 -
2 -
0 -
- - •
10
E 6
z" 4 -
2 -
0 -
- - •
—•—Aphid alates
10
E 6
z" 4 -
2 -
0 -
—•—Aphid alates
10
E 6
z" 4 -
2 -
0 -
—•—Aphid alates
10
E 6
z" 4 -
2 -
0 -
10
E 6
z" 4 -
2 -
0 -
13-Jul 18-Jul 27-Jul 02- 09- 16- 24-Aug Aug Aug Aug
Period of collection
30-Aug
07-Sep
15-Sep
th -th Figure 20. Thrips collected in water traps between the 13 July and 15 September
50 i
40
» 30
i 20 z
10 y^ » 30
i 20 z
10 y^ —4—Thrips
» 30
i 20 z
10 y^
n -, 13-Jul 18-Jul 27-Jul 02- 09- 16- 24- 30- 07- 15-
Aug Aug Aug Aug
Period of collection
Aug Sep Sep
When the flight records are plotted with the averaged number of fruit damage for all treatments, it shows a build up of both aphid and thrip populations prior to an increase in the number of fruit being damaged. Figure 21 shows the relationship for aphid alates and damage and Figure 22 shows the relationship between thrips and average damage.
30

Figure 21. Relationship between aphid alates and averaged fruit damaged for all treatments.
Date
-Aphids
-Average damage
Figure 22. Relationship between thrips and averaged fruit damaged for all treatments.
2.34 DISCUSSION:
Due to the low incidence of virus disease the effects of the treatments on aphid populations and hence the spread of the virus diseases cannot be gauged. The chemical treatments appeared to perform better that the non-chemical treatment but this is not significant. It will be important to consider the role of thrips in the transmission of diseases, as they were present throughout the trial.
31

3. Trials 1995
3.1 TRIAL 5.
3.11 INTRODUCTION: This trial was conducted on a growers property in a commercial crop of Curcubits, mainly zucchini and squash. The grower had planted one block of zucchini Dn black plastic mulch and two blocks of squash, one on a dirt bed and the other on silver reflective mulch on the 13th May. Each block, approximately 120 metres long, was adjacent to each other and the area used in this experiment was approximately 30 metres long by 12 rows. This demonstration trial attempted to show the value of reflective mulch in delaying the spread of virus disease by aphids throughout the crop.
3.12 MATERIALS and METHODS:
The trial area divided each of the blocks into three plots 10 metres long by 12 rows. The grower applied all chemical treatments to each block as required to produce a commercial crop. Yellow water traps as described in trial 4 were set up with three traps in each block (1 trap per plot). Harvesting was undertaken by the owner and yields supplied by him.
Counts of insects were undertaken from the 22nd May and every 2 to 3 days, finishing on the 9th June. The first three insect counts were based on whole of plant counts while the other counts were based on the top 4 leaves. Fifteen plants (5 plants from each plot) were used in each block to assess populations.
Counts of the number of diseased plants in each plot were undertaken on the 2nd and 9th June by walking through the crop and noting plant appearance.
Treatments. A Black mulch B Bare soil C Silver mulch Commercial insecticides recommended to control aphids and Heliothis were applied to the crop areas by the grower throughout the trial period.
3.13 RESULTS:
Aphid counts for the period 22nd May till the 9th June are given in Table 8 for the three treatments. Though the data is generated from observations rather than from a statistical design the following results did occur.
Table i >. Mean number of aphids per plot. Treat ment
22/5 24/5 26/5 29/5 31/5 2/6 5/6 7/6 9/6
A 0.66a 0.33 0.33 0.67 2.00 2.67 5.33a 4.33a 2.00a
B 3.00b 3.00 3.67 1.33 1.00 2.33 13.7b 13.7b 10.3b
C 0.00a 0.00 1.00 1.67 0.00 0.33 2.33a 5.33a 5.3ab
Prob. 0.004 0.107 0.461 0.815 0.064 0.057 0.001 0.042 0.022 * Num ?ers fol owed b> / the san ae letter are not significa nt diffei ent P = <0.05.
32

The results show that the bare soil recorded more aphids on the plants than the black or silver mulches on the 22nd May (based on whole plant counts) and the 5th and 7th
June (based on the top four leaves).
On the 9th June the black mulch had less aphids than the bare soil.
Figure 23 shows these differences.
Figure 23. Effect of two different coloured mulches and bare soil treatments on aphid populations.
In Figure 24 the number of aphid alates collected from the yellow water traps are shown.
Figure 24. Number of aphid alates collected from water traps placed in blocks of cucurbits planted under different coloured mulches.
This figure show that the adult aphid populations were present early in the trial and in combination with Figure 23 it shows that following these flights the aphid populations developed on the plants. This is especially so for the bare soil treatment. The coloured mulches had low aphid flights and the ensuring populations, which were lower than the bare soil treatment, reflect this difference compared to the bare soil populations.
33

The effect of the different coloured mulches and bare soil on the beneficial insect populations are shown in Figure 25 and the percentage of each beneficial insect present in the crops is shown in Figure 26.
Figure 25. Average number of beneficial insects per plant recorded in the different coloured mulches.
There were no significant differences in the numbers of spiders or ladybeetles recorded from the different coloured mulches.
Figure 26. Percentage of spiders and ladybeetles recorded in the trial on different coloured mulches.
Ratings on disease incidence in the plants from the different coloured mulches showed some differences. In Table 9 these differences are given.
Table 9. Average number of diseased plants in each of the coloured mulch treatments.
Mulch type 2nd June 9th June Black 0.7a 0.3a
Bare soil 8.7b 12.0b
Silver reflective 14.0" 18.7b
Prob. 0.006 0.006 * Numbers followed by the same letter are not significantly different P = < 0.05
This shows that the black mulch had less diseased plants than the other mulch types.
34

Harvesting, of the fruit from the silver and bare soil mulch plots was undertaken by the grower. The black mulch crop was not recorded as this crop was a different species of cucurbit.
Figure 27. Average number of 5kg boxes of fruit harvested from the silver reflective mulch and the bare soil treatments.
o
300
250
200
150-1-
100
50
-Bare
- Silver
19/6-24/6 25/6-28/6 29/6-4/7 5/7-10/7 Dates
11/7-16/7 18-Jul
3.14 DISCUSSION:
As this site was mainly a demonstration trial the statical analysis of the data is not a true indication of the results. The trial did demonstrate that the effect of silver mulch does delay the number of aphids building up in the crop. The increased incidence of disease in the silver mulch was probably due to a number of other symptoms. Samples taken from this site identified a number of plant pathogens and some of these are known not to exhibit their presence until certain conditions are present. All plants submitted for examination showed that the virus was present though some were not showing the symptoms of disease. The grower reported that the silver plants grew faster and yielded earlier but were not as hardy as the plants grown on the bare soil plots. This could explain the high visual incidence of disease in the silver mulch plots when the plants were rated for the presence of disease.
35
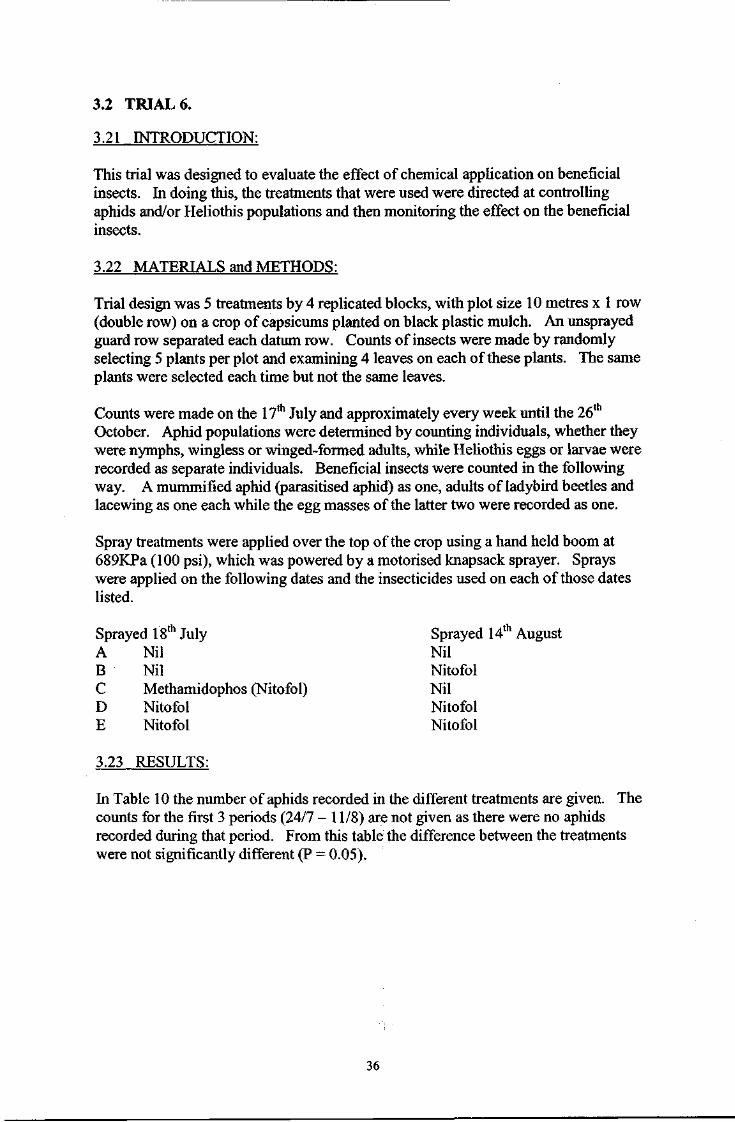
3.2 TRIAL 6.
3.21 INTRODUCTION:
This trial was designed to evaluate the effect of chemical application on beneficial insects. In doing this, the treatments that were used were directed at controlling aphids and/or Heliothis populations and then monitoring the effect on the beneficial insects.
3.22 MATERIALS and METHODS:
Trial design was 5 treatments by 4 replicated blocks, with plot size 10 metres x 1 row (double row) on a crop of capsicums planted on black plastic mulch. An unsprayed guard row separated each datum row. Counts of insects were made by randomly selecting 5 plants per plot and examining 4 leaves on each of these plants. The same plants were selected each time but not the same leaves.
Counts were made on the 17th July and approximately every week until the 26th
October. Aphid populations were determined by counting individuals, whether they were nymphs, wingless or winged-formed adults, while Heliothis eggs or larvae were recorded as separate individuals. Beneficial insects were counted in the following way. A mummified aphid (parasitised aphid) as one, adults of ladybird beetles and lacewing as one each while the egg masses of the latter two were recorded as one.
Spray treatments were applied over the top of the crop using a hand held boom at 689KPa (100 psi), which was powered by a motorised knapsack sprayer. Sprays were applied on the following dates and the insecticides used on each of those dates listed.
Sprayed 14th August Nil Nitofol Nil Nitofol Nitofol
In Table 10 the number of aphids recorded in the different treatments are given. The counts for the first 3 periods (24/7 - 11/8) are not given as there were no aphids recorded during that period. From this table the difference between the treatments were not significantly different (P = 0.05).
Sprayed 18th July A Nil B Nil C Methamidophos (Nitofol) D Nitofol E Nitofol
3.23 RESULTS:
36

Table 10. Mean number of aphids on 20 leaves ( 5plants x 4 leaves per plant) for each treatment. Treat 14/8 23/8 30/8 13/9 21/9 27/9 2/10 12/10 18/10 26/10 A .25 1.75 10.3 33.2 48.7 23.5 18.8 .50 .25 0 B 0 0.25 12.0 30.3 40.0 41.2 23.8 4.75 0.5 1.5 C .25 0 10.3 45.7 88.5 55.5 52.0 1.75 1.5 .25 D 0 0.75 15.3 39.0 39.2 41.7 8.8 0 .25 .25 E 0 0.25 0.50 42.5 62.0 18.2 16.3 .75 0.5 0 Prob. .445 .258 .657 .936 .399 .241 .301 .462 .730 .557
Figure 28 shows the aphid populations for the different treatments between the 24 July and the 26th October.
Figure 28. Average number of aphids recorded per leaf for 5 treatments over approximately a four month period.
In Figure 29 the number of beneficial insects recorded from the different treatments is shown. These populations did not develop until the aphid populations began to increase. The differences between the treatments are not significant and sprays were not applied during their presence.
Figure 29. Average number of beneficial insects per leaf for 5 treatments.
In Figure 30 the percentage of each beneficial insect recorded during the trial is shown.
37

Figure 30. Percentage of each beneficial insect recorded from the 24 July to 26 October 1995.
Per
cent
100 -
5 0 ,
Per
cent
100 -
5 0 ,
/ /
/ I
' /
.' / i.
\ /
/ - J
Per
cent
100 -
5 0 ,
/ /
/ I
' /
.' / i.
\ /
/ - J
—•— Lady beetles
Per
cent
100 -
5 0 ,
/ /
/ I
' /
.' / i.
\ /
/ - J
Per
cent
100 -
5 0 ,
/ /
/ I
' /
.' / i.
\ /
/ - J
Per
cent
c 24
-JuM
31-J
ul 1
7-A
ug
14-A
ug i
O) D) Q. CL Q. Q. 3 3 CO CO CD 0) < < CO CO CO CO r 0O ^" ^ <0 'f l CM CM r- r- CM
Date
2-O
ct I
9-O
ct - 1
16-O
ct •
23-O
ct -
This figure also shows that the beneficial insect populations do not come into the crop until the aphid population is established as shown in figure 28.
The Heliothis populations recorded in the different treatments are given in Table 11.
Table 11. Mean number of Heliothis on 20 leaves (5 plants x 4 leaves per plant) for each treatment. Treat JULY AUGUST SEPTEMBER OCTOBER
18 24 31 11 14 23 30 13 21 27 2 12 18 26 A 0.5 0.5 1.25° 0.5 .25 0a .25 4 2.2 2.0 0.5 1.0 0 .75
B 0.5 .25 J 5 b c 0.5 1.0 0a .75 5.2 2.5 4.7 4.7 .75 0 0
C 2.25 2.5 .25ab 0 .75 1.0" .25 5.2 1.0 2.2 1.7 1.7 .25 0.5
D 1.75 1.0 0a 0 1.0 0a .25 5.2 2.5 2 0 2.0 0 .25
E 2.25 1.25 .25ab .25 1.0 .25a 0.5 4.5 2.5 2.7 5
.75 .25 0.5 .25
Prob. .399 .076 .022 .22 .92 .042 .785 .94 .70 .17 .46 .16 .58 .53
* Numbers followed by the same letter are not significantly different P = < 0.05.
On the 31st July treatment A (nil spray) had significantly more Heliothis than nitofol treatments C, D and E. Treatment B also had significantly more Heliothis than treatment D. On the 23rd August Treatment C had significantly more Heliothis than the other treatments.
38

Figure 31. Mean number of Heliothis on 20 leaves (5 plants x 4 leaves per plant) for 5 treatments.
35-
I 30- t 1 i 25 J ^ i 1 - • - A
per
tre 20
15-JY sA \
1 .- •• c
Num
ber
!£* <r " ^ T P ^ i *s*a i T- r
sA fe^K—<5 —)K—E
Num
ber
!£* <r i *s*a i T- r
sA fe^K—<5
3 3 3 O) O) w a) 9- Q- 9- S- t> tS —3 —) I I
- J i < 4
3 3 CO Cu < < CO CO op to 9 9 O O
1 1 T - CM co h. «t 1 - oo • * - ^ CO IT) CM 0> CO CO
_ CM CM _ . •<-
Date i - CM
3.24 DISCUSSION:
As shown in Table 10 the effect of the chemical treatments applied on the 14/8 does reduce aphid populations. Following that application the treatments were not applied again. This allowed the aphid populations to develop and they reached maximum population numbers on the 21/10. As shown in Figure 26 the beneficial insect populations also peaked in numbers at the same time. This caused a rapid decline in aphid populations within 20 days and they did not recover after this period.
The Heliothis populations remained low during the early part of the trial and then increased. This increase was probably due to the plants flowering and fruiting, which is the preferred feeding site of these insects.
39
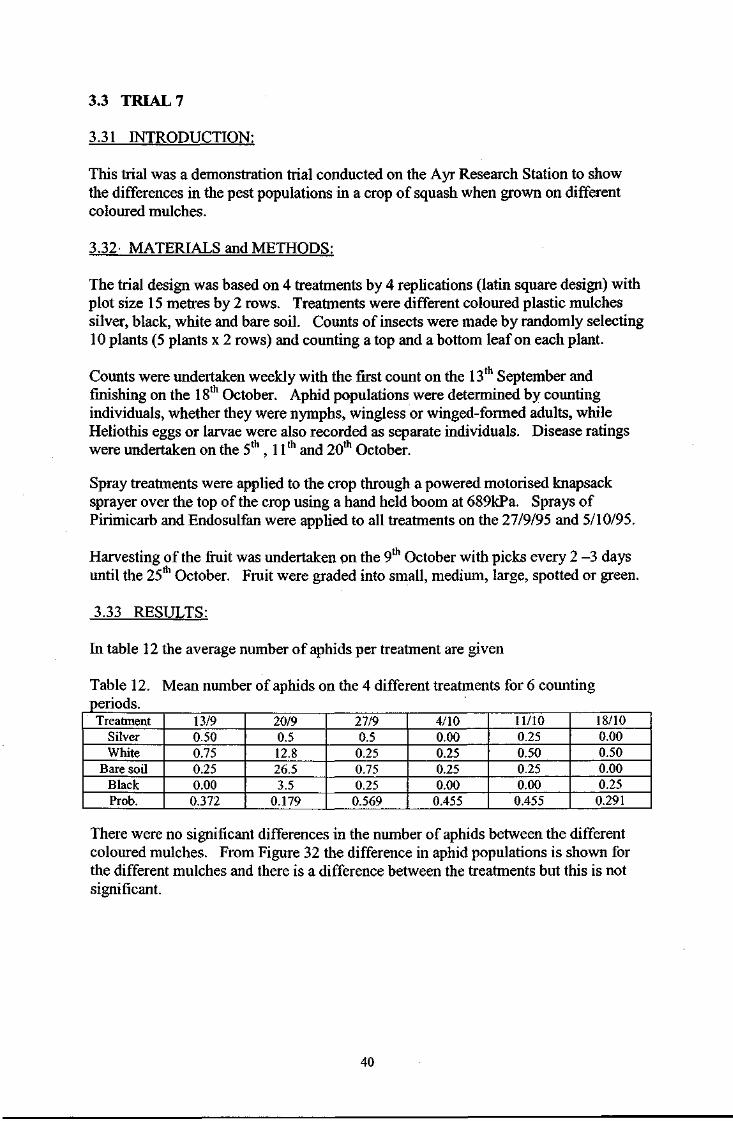
3.3 TRIAL 7
3.31 INTRODUCTION:
This trial was a demonstration trial conducted on the Ayr Research Station to show the differences in the pest populations in a crop of squash when grown on different coloured mulches.
3.32 MATERIALS and METHODS:
The trial design was based on 4 treatments by 4 replications (latin square design) with plot size 15 metres by 2 rows. Treatments were different coloured plastic mulches silver, black, white and bare soil. Counts of insects were made by randomly selecting 10 plants (5 plants x 2 rows) and counting a top and a bottom leaf on each plant.
Counts were undertaken weekly with the first count on the 13 September and finishing on the 18th October. Aphid populations were determined by counting individuals, whether they were nymphs, wingless or winged-formed adults, while Heliothis eggs or larvae were also recorded as separate individuals. Disease ratings were undertaken on the 5th , 11th and 20th October.
Spray treatments were applied to the crop through a powered motorised knapsack sprayer over the top of the crop using a hand held boom at 689kPa. Sprays of Pirimicarb and Endosulfan were applied to all treatments on the 27/9/95 and 5/10/95.
Harvesting of the fruit was undertaken on the 9th October with picks every 2 -3 days until the 25th October. Fruit were graded into small, medium, large, spotted or green.
3.33 RESULTS:
In table 12 the average number of aphids per treatment are given
Table 12. Mean number of aphids on the 4 different treatments for 6 counting periods. ' ^ _ Treatment 13/9 20/9 27/9 4/10 11/10 18/10
Silver 0.50 0.5 0.5 0.00 0.25 0.00 White 0.75 12.8 0.25 0.25 0.50 0.50
Bare soil 0.25 26.5 0.75 0.25 0.25 0.00 Black 0.00 3.5 0.25 0.00 0.00 0.25 Prob. 0.372 0.179 0.569 0.455 0.455 0.291
There were no significant differences in the number of aphids between the different coloured mulches. From Figure 32 the difference in aphid populations is shown for the different mulches and there is a difference between the treatments but this is not significant.
40

Figure 32. Average number of aphids recorded per leaf.
-•—A
-•— B C
-K—D
There were no significant differences in Heliothis populations between the treatments and Figure 33 shows the populations for the different treatments.
Figure 33. Number of Heliothis recorded in each treatment.
Table 13 gives the analysis of the virus ratings (diseased plants) for the different coloured mulches over 3 periods.
Table 13. Mean number of plants showing disease symptoms in the different coloured mulch treatments.
Treatment 5/10 11/10 20/10 Silver 0.75 0.75a 5.50a
White 2.50 4.50ab 12.00" Bare soil 4.50 9.00c 18.75c
Black 2.00 5.25bc 14.50" Prob. 0.064 0.010 0.001
* Numbers followed by the same letter are not significantly different P =< 0.05
On the 1 l l October the silver reflective mulch treatment had significantly less diseased plants than the bare soil and black mulch treatments, and the white mulch treatment had significantly less diseased plants than the bare soil treatment. On the 20l October the silver reflective mulch treatment had significantly less diseased plants than the other treatments and the white and black mulches had significantly less diseased plants than the bare soil treatment. These differences are shown in figure 34.
41

Figure 34. Mean number of diseased plants observed over three periods for 3 different coloured mulches and bare soil treatments.
|
80 70 60 50 40 30 20 10 0 « •
Date
In Table 14,15 and 16 the number of small, medium and large fruit harvested from the different treatments is given.
Table 14. Mean number of small fruit harvested from 3 different coloured mulches and bare soil treatments over 7 harvest times.
Treat. 9/10 11/10 13/10 18/10 20/10 23/10 25/10 Silver 4.50 5.25 18.0" 11.3 7.00 2.50 0.50
White 3.25 3.50 10.5ab 5.5 3.50 0.25 0.00
Bare soil
1.75 3.25 2.0a 2.0 0.25 0.25 0.00
Black 3.50 1.75 l.T 8.0 1.25 0.75 0.00
Prob. 0.367 0.146 0.023 0.115 0.059 0.198 0.117 * Num ?ers follow ed by the s ame letter i ire not sign ificantly di •ferent P = < 0.05
>th On the 13 the bare soil and black mulch treatments had significantly less small fruit than the silver mulch treatment.
Table 15. Mean nun mulches and bare sol
iber of medium fruit harvested from 3 different coloured treatments over 7 harvest times.
Treat. 9/10 11/10 13/10 18/10 20/10 23/10 25/10 Silver 29.3b 22.75c 12.00bc 20.0b 12.0b 6.50 0.00 White 29.8b 17.00bc 12.25c 8.0a 1.8a 0.00 0.00 Bare soil 10.8a 7.00a 2.25a '1.0a 0.8a 0.00 0.00 Black 21.5b 12.25ab 6.75ab 4.2a 1.0a 0.00 0.00 Prob. 0.009 0.005 0.011 0.003 0.032 0.058 NS * Number s followed ?y the same : letter are r lot signifies ntly differe nt P = < 0.( )5.
On the 9th October the bare soil treatment produced significantly less medium fruit than the other mulches. On the 11th the silver mulch produced significantly more medium fruit than the bare soil and black mulch treatments while the white mulch treatment produced significantly more fruit than the bare soil treatment. On the 13th
the bare soil treatment produced significantly less fruit than the silver and white
42

mulches and the black mulch also produced significantly less fruit than the white mulch treatment. On the 18th and 20th the silver mulch produced significantly more fruit than the other mulches.
Table 16. Mean number of large fruit harvested from 3 different coloured mulches and bare soil treatments over 7 harvest times. Treat. 9/10 11/10 13/10 18/10 20/10 23/10 25/10 Silver 2.00b 0.50 0.25 6.50c 0.25 2.50 0.00 White 2.75b 1.25 0.50 3.00b 0.00 0.00 0.00 Bare soil 0.00a 0.50 0.50 0.00a 0.00 0.00 0.00 Black 2.50b 0.75 0.00 2.00b 0.75 0.00 0.00 Prob. 0.022 0.512 0.291 O.001 0.117 0.257 NS * Number s followed ?y the same ; letter are not significantly different P = < 0.05.
On the 9th the bare soil treatment produced significantly less fruit than the other mulches. On the 18th the silver mulch produced significantly more fruit than the other mulches while the white and black mulches produced significantly more fruit than the bare soil treatment.
In figures 35, 36 and 37 the differences between the different coloured mulches and bare soil treatments are shown for small, medium and large fruit harvested.
Figure 35. Mean number of small fruit harvested from 3 different coloured mulches and bare soil treatments.
43

Figure 36. Mean number of medium fruit harvested from 3 different coloured mulches and bare soil treatments.
Figure 37. Mean number of large fruit harvested from 3 different coloured mulches and bare soil treatments.
Table 17 gives the mean number of spotted fruit harvested from the different coloured mulches and bare soil treatments.
Table 17. Mean number of spotted fruit harvested from 3 different coloured mulches and bare soil treatments over 7 harvest times. Treat. 9/10 11/10 13/10 18/10 20/10 23/10 25/10 A 8.50 6.7 9.8 25.0 11.0 6.5 5.2 B 10.50 8.3 14.8 24.8 8.5 8.0 2.2 C 5.50 10.0 12.5 11.5 2.7 6.7 4.7 D 4.00 7.2 13.3 25.3 6.5 5.0 2.2 Prob. 0.195 0.867 0.489 0.660 0.315 0.900 0.645
There were no significant differences between the treatments in the amount of spotted fruit harvested.
44
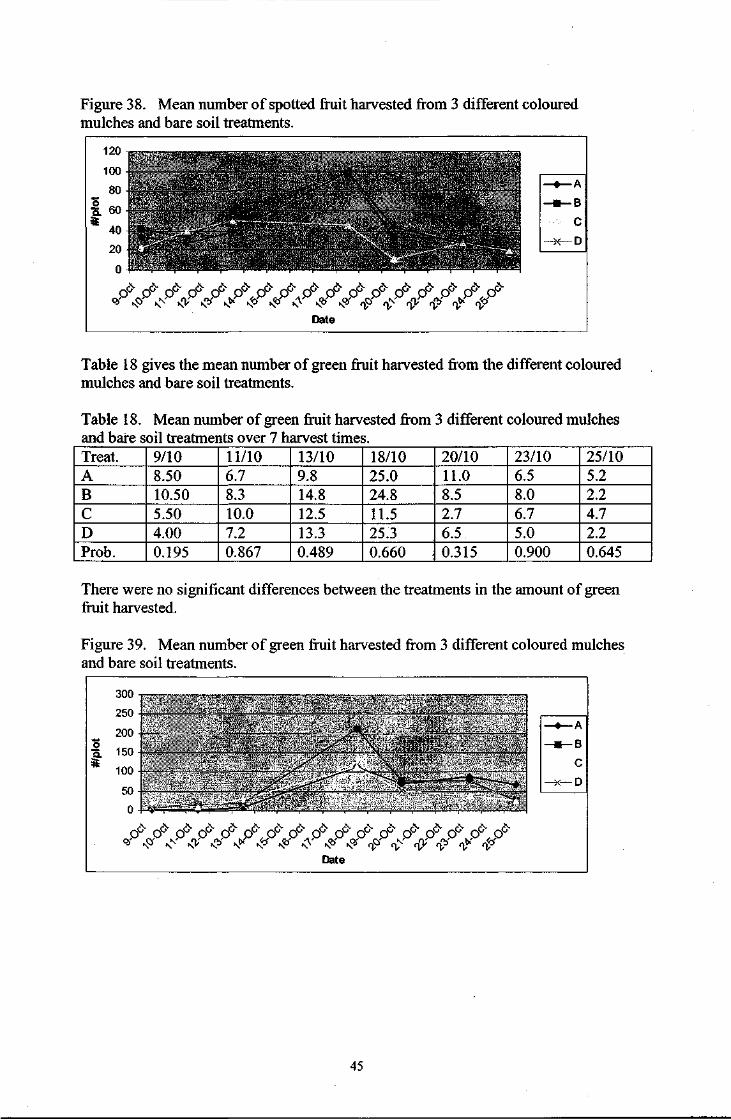
Figure 38. Mean number of spotted fruit harvested from 3 different coloured mulches and bare soil treatments.
Table 18 gives the mean number of green fruit harvested from the different coloured mulches and bare soil treatments.
Table 18. Mean number of green fruit harvested from 3 different coloured mulches and bare soil treatments over 7 harvest times. Treat. 9/10 11/10 13/10 18/10 20/10 23/10 25/10 A 8.50 6.7 9.8 25.0 11.0 6.5 5.2 B 10.50 8.3 14.8 24.8 8.5 8.0 2.2 C 5.50 10.0 12.5 11.5 2.7 6.7 4.7 D 4.00 7.2 13.3 25.3 6.5 5.0 2.2 Prob. 0.195 0.867 0.489 0.660 0.315 0.900 0.645
There were no significant differences between the treatments in the amount of green fruit harvested.
Figure 39. Mean number of green fruit harvested from 3 different coloured mulches and bare soil treatments.
I
300
250
200
150
100
50
0
-•—A
c -X—D
cP d* d5" o°v d5" d * d5" cP.cP d5" d * d * d5" d5" d5" d5" o°v
*- K & & K* #" N*>' <V # & <f V V <fc Date
V & <& tf <$
45

Table 19 gives the mean number of total fruit harvested from the different coloured mulches and bare soil treatments.
Table 19. Mean total number of fruit harvested from 3 different coloured mulches and bare soil treatments over 7 harvest times. Treat. 9/10 11/10 13/10 18/10 20/10 23/10 25/10 A 44.7b 35.7 41.7 85.2 47.7 40.0 22.3 B 48.0b 33.7 42.7 94.0 3.2 27.5 9.0 C 23.3a 23.5 24.3 43.2 16.8 16.8 11.3 D 33.5ab 26.3 31.5 100.0 2.3 22.8 10.8 Prob. 0.042 0.248 0.054 0.050 0.075 0.109 0.115 * Number s followed )y the same : letter are not significantly different P = < 0.05
On the 9th the silver white mulch treatments had significantly more fruit harvested than the bare soil treatment.
Figure 40. Mean number of total fruit harvested from 3 different coloured mulches and bare soil treatments.
450-4nn
t /pl
ot 350
300-250
- --
fru 200 • — -
4 -
o 150 - L ^ * -
* 100 -J -50 n -
c
o o o o o o o o o o O O O O O O O O O O
4
o o o o o O O O O O
o> O * - CM CO m CD D&e CO O T - CM CM CM CM
CO • * CM CM
O
O i
lO CM
3.34 DISCUSSION:
Aphid populations were controlled by the two insecticides applied on the 27l
September and from this date they did not recover for the rest of the trial period.
Heliothis populations increased after the first spray but decreased after the second application. Plants were starting to deteriorate and become unattractive to this insect to lay eggs on. This could explain the reduction in their populations.
There were significant differences between the treatments in the size of the fruit harvested on the different dates between the coloured mulches but overall (total fruit harvested) these were only significant in the first pick. This shows that the silver and white mulches produce fruit earlier than the black mulch or the bare soil treatments. This has been shown in previous work where the plants tend to grow faster on the silver mulch and come into production earlier.
46

4. Trials 1996
4.1 TRIALS 8 and 9.
4.11 INTRODUCTION:
These trials were designed to continually explore the possibility that spraying for aphid control in capsicums is not necessary. Treatments were not applied to control Heliothis as these treatments could influence the aphid populations.
4.12 MATERIALS and METHODS:
Trials 8 and 9.
Trial design was based on 5 treatments by 5 replications (latin square design) with plot size 15 metres by 1 row (double row) on a crop of capsicums planted on black plastic mulch. A guard row separated each datum row. Counts of insects were made by randomly selecting 5 plants per plot and examining 4 leaves on each of these plants. This gave a total of 20 leaves per plot that were examined each time throughout the trial period. The same plants were selected each time but not the same leaves.
Trial 8.
Counts were undertaken on the 7th June and every 3 to 4 days until the 1st July when counts were then undertaken at 7day intervals up to and including the 22nd July. The last two counts on the 5th and 13th August were made to determine if aphid population densities had reappeared. Aphid populations were determined by counting individuals, whether they were nymphs, wingless or winged-formed adults. Beneficial insects were counted in the following way. Adults or larvae of hover flies family Syrphidae, ladybird beetles and lacewings as one each while the egg cluster/mass of the latter two were recorded as one.
Trial 9.
Counts were undertaken on the 17th June and every 3 to 4 days until the 1st July when counts were then undertaken at 7day intervals up to and including the 2nd September. Aphid populations were determined by counting individuals, whether they were nymphs, wingless or winged-formed adults. Beneficial insects were counted in the following way. Adults or larvae of hover flies, ladybird beetles and lacewings as one each while the egg cluster/mass of the latter two were recorded as one.
4.13 RESULTS:
Trial 8
Table 20 gives the mean population of aphids recorded throughout the trial period. Population counts after the 1st July are not tabled due to aphid populations not being present after this date.
47

Table 20. Mean number of aphids recorded between 7th June and 1st July 1996. Treat 7/6 11/6 14/6 17/6 19/6 21/6 24/6 26/6 1/7
A 783 578 378 454 636 386 362 53 1.00 B 938 728 1091 528 695 395 242 28 1.20 C 748 791 662 720 847 403 195 19 1.40 D 1064 608 832 626 692 338 232 64 0.20 E 784 420 599 530 320 253 126 62 0.60
Prob. .555 .750 .319 .916 .801 .961 .823 .552 .819
There were no significant differences between the treatments (nil treatment).
Table 21 gives the mean population of hover flies recorded throughout the trial period. Population counts after the 1st July are not tabled. Hover fly populations were not present after this date.
Table 21. Mean number of hover flies recorded bel •ween 7th Juneanc 11st July. Treat 7/6 11/6 14/6 17/6 19/6 21/6 24/6 26/6 1/7
A 2.40 2.20 3.40 5.0 3.6 4.4 1.40 2.00 0.00 B 1.40 2.00 4.00 4.0 12.8 4.0 2.80 0.20 0.00 C 0.40 2.20 3.40 8.4 8.0 9.8 1.80 0.20 0.00 D 3.80 1.20 5.40 8.4 11.0 8.2 3.60 2.80 0.00 E 0.80 1.80 4.80 5.0 4.8 5.6 0.60 0.00 0.00
Prob. 0.364 0.649 0.877 0.792 0.430 0.809 0.526 0.377 NS
There were no significant differences between the treatments (nil treatment).
Table 22 gives the mean population of ladybeetles recorded throughout the trial period. Population counts after the 1st July are not tabled. Ladybeetle populations were not present after this date.
Table 22. Mean number of ladybeetles recorded between 71 June and 1st July. Treat 7/6 11/6 14/6 17/6 19/6 21/6 24/6 26/6 1/7
A 0.20 1.80 2.00 1.00 0.60 1.80 1.20 3.80 0.60 B 0.00 1.20 0.60 2.80 2.80 3.80 2.40 1.60 0.80 C 0.00 0.60 1.60 3.60 1.60 5.20 2.80 1.40 0.40 D 0.00 1.20 1.00 2.00 1.20 3.00 4.80 2.40 0.20 E 0.00 1.20 1.60 2.20 2.20 2.00 1.80 2.40 0.40
Prob. 0.445 0.743 0.559 0.720 0.087 0.078 0.259 0.585 0.741
There were no significant differences between the treatments (nil treatment).
Because the numbers of lacewings were low in this trial the numbers have not been tabled.
48

In Figure 41 the population of aphids and the beneficial insects associated with them in this trial are shown. As there were no treatments applied to the trial so total population figures have been used to produce Figure 41.
Figure41. Average number of aphids and beneficial insects per leaf during the period June to September 1996.
50 45 40
- 35 1 30 * 25" £ 2° < 15
10 5 0 M l 1 — — • «•» — — • * J ~ ~ ^ .
I VH I LW 1 UK I W l W
0.45 0.4 0.35 0.3 t5 0.25 ^ 0.2 * 0.15 £ 0.1 0.05 0
Date
-Aphids
-f-
Syrphid flies
-*— Ladybeetles
-*— Lacew ings
As can be seen from this figure the decline of the aphid populations is due to the incidence of beneficial insects. The incidence of syrphid flies is high and these were probably having the most influence on the aphid populations.
TRIAL 9.
Table 23 gives the mean population of aphids recorded throughout the trial period. Population counts after the 22nd July are not tabled as aphid populations were very low after this date.
Table 24. Mean number of aphids recorded between 17th June and 22nd July. Treat 17/6 19/6 21/6 24/6 26/6 1/7 8/7 15/7 22/7 A 45 74.2 30.2 74 121 1.2 0.2 0.2 0.2 B 33.4 46.6 38.4 77.6 85 1.0 1.8 0.6 0.4 C 41.4 52.4 34 51.8 109 0.8 0 0 0.8 D 67.6 26.2 27.2 45.8 40 2.4 1.0 1.0 0.2 E 38.2 81.2 59.2 57.6 83 2.2 4.4 1.2 16.2 Prob. .836 .402 .371 .758 .545 .710 .559 .248 .186
There were no significant differences between the treatments (nil treatment).
There were no significant differences in the populations of hover flies and ladybeetles
In Figure 42 the population of aphids and the beneficial insects associated with them in this trial are shown. As there were no treatments applied to the trial total population figures have been used to produce this figure.
49
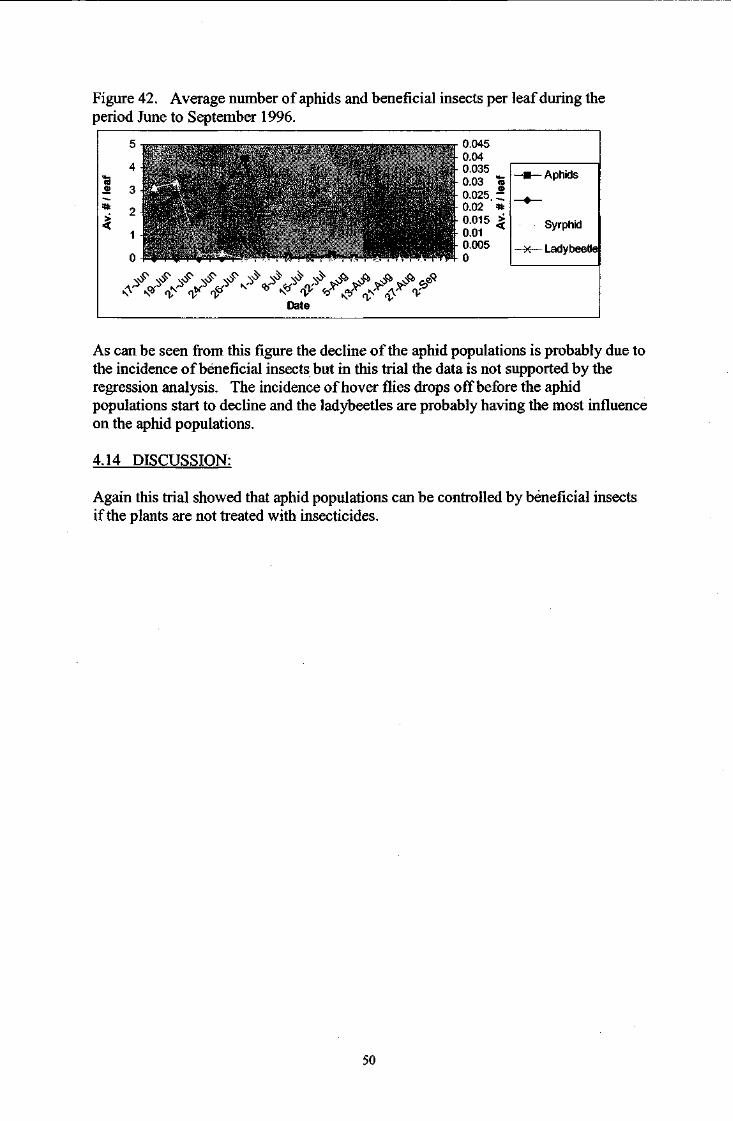
Figure 42. Average number of aphids and beneficial insects per leaf during the period June to September 1996.
0.045 0.04
f 0.035 0.03 "55 0.025 -0.02 *
4- 0.015 s> 0.01 0.005 0
A^Y^Ws*A^ v v
-m—Aphids
Syrphid
-x— Ladybeetle
As can be seen from this figure the decline of the aphid populations is probably due to the incidence of beneficial insects but in this trial the data is not supported by the regression analysis. The incidence of hover flies drops off before the aphid populations start to decline and the ladybeetles are probably having the most influence on the aphid populations.
4.14 DISCUSSION:
Again this trial showed that aphid populations can be controlled by beneficial insects if the plants are not treated with insecticides.
50

4.2 TRIALS 10a and 10b.
4.21 INTRODUCTION:
These trials were undertaken to evaluate different approaches to Heliothis control in capsicums and look at the measure the effect on aphid populations. Trial 10a was designed to evaluate the harder group of insecticides and 10b looked at the softer insecticides. These two trials were undertaken on the same block of capsicums with the insecticide trial at one end and the population study at the other end.
4.22 MATERIALS and METHODS
Trials 10a and 10b.
Trial design was based on 7 treatments by 4 replications with plot size 10 metres by 1 row (double row) on a crop of capsicums planted on black plastic mulch. A guard row separated each datum row. Counts of insects were made by randomly selecting 5 plants per plot and examining 4 leaves on each of these plants. This gave a total of 20 leaves per plot that were examined each time throughout the trial period. The same plants were selected each time but not the same leaves.
Counts were undertaken on the 10th October 1996 and approximately every 7days until the 9th December. Aphid populations were determined by counting individuals, whether they were nymphs, wingless or winged-formed adults, while Heliothis eggs or larvae were also recorded as separate individuals. Beneficial insects were counted in the following way. Adults or larvae of ladybird beetles and lacewing as one each while the egg cluster/mass of the latter two were recorded as one.
Spray treatments were applied to the crop through a powered motorised knapsack sprayer over the top of the crop using a hand held boom at 689kPa. Sprays were applied weekly and the insecticides used on each of the trials are listed below. The compounds used are listed by their commercial name following the use of their chemical name on the first occasion.
Trial 10a. Trial 10b.
A Endosulfan (Thiodan) A Nil B Methamidophos (Nitofol) B Bt continual C Methomyl (Lannate) C Bt + Thiodan D Mevinphos (Phosdrin) D MVP + Pirimicarb Pirimor) E Sulprofos (Heliothion) E MVP + Thiodan F. 303 (experimental) F. Nil till flowering then G. MVP (Bacillus) MVP/Thiodan rotation.
G. Nil till flowering then MVP/Thiodan rotation if needed
51

Harvesting of the fruit on the 20th November was used to evaluate the different treatments.
4.23 RESULTS:
Trial 10a.
Aphid populations did not develop in this trial as seen by the data in Table 24.
Table 24. Mean number of aphids on 20 leaves for each treatment. Treat 10/10 14/10 21/10 28/10 4/11 12/11 19/11 26/11 9/12
A 0 0 0 0 0 0 0 0 0 B 0 0 0 0 0 0 0 0 0 C 0 0.25 0 0 0 0 0.25 0 0 D 0 0 0 0 0 0 0 0 0 E 0 0 0 0 0 0 0 0.25 0 F 0 0.50 0 0 1.25 0 0 0 0 G 0 0 0 0 0 0 0 0 0.50
Prob. NS 0.562 NS NS 0.455 NS 0.455 0.455 0.455
There were no significant differences between the treatments for aphid populations.
As the aphid populations were very low the beneficial populations were also very low.
Heliothis populations recorded in this trial are given in Table 25.
Table 25. Mean number of Heliothis on 20 leaves for each treatmem t. Treat 10/10 14/10 21/10 28/10 4/11 12/11 19/11 26/11 9/12
A 0 0 0 0 2.50 0 0 125" 0 B 0 0 0 0.50 2.50 0 0 1.00" 0 C 0 0 0 0 2.50 0 0 1.50" 0 D 0 0 0 0 2.50 0 0 1.50" 0 E 0 0 0 0 2.50 0 0.25 2.00" 0.25 F 0 0 0 0 2.50 0 0 4.25b 0 G 0 0 0 0.25 2.50 0 0 2.25" 0
Prob. NS NS NS 0.562 NS NS 0.455 .002 0.455 * Numh >ers folio wed by t le same etter are not signi ficantly different P = <0.C )5.
On the 26l November, treatment F (303 experimental insecticide) had significantly more Heliothis on the plants than the other treatments.
Yields from trial 10a are given in Table 26.
52
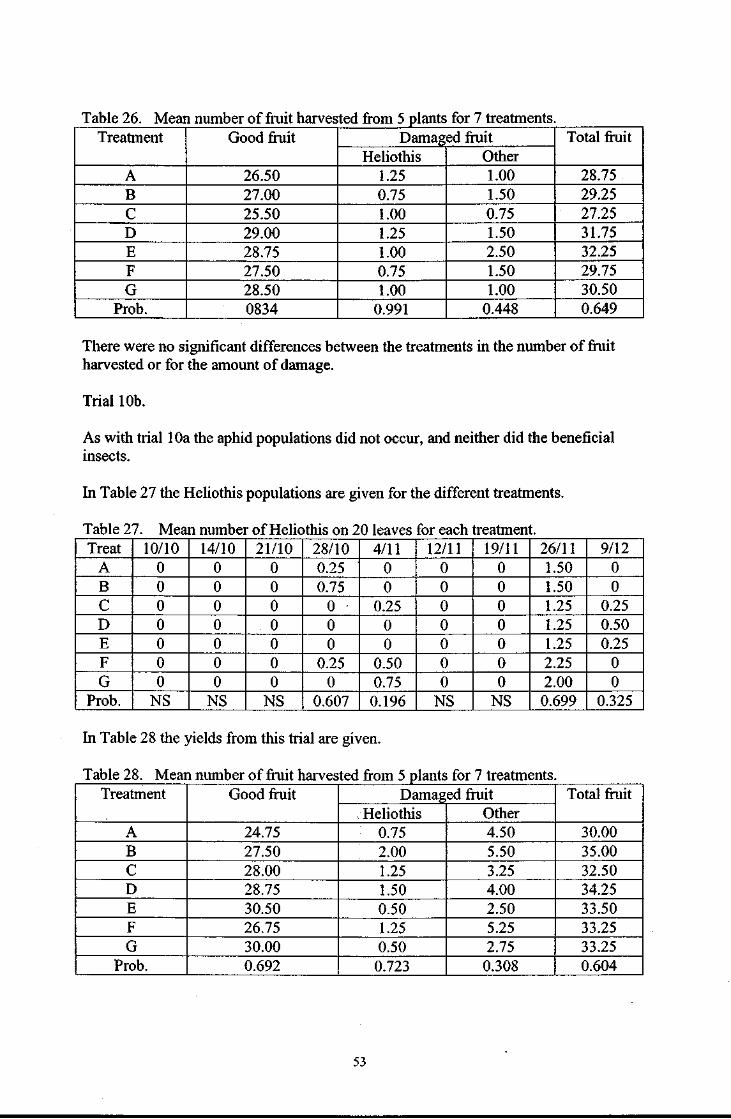
Table 26. Mean number of fruit harvested from 5 plants for 7 treatments. Treatment Good fruit Damaged fruit Total fruit Treatment Good fruit
Heliothis Other Total fruit
A 26.50 1.25 1.00 28.75 B 27.00 0.75 1.50 29.25 C 25.50 1.00 0.75 27.25 D 29.00 1.25 1.50 31.75 E 28.75 1.00 2.50 32.25 F 27.50 0.75 1.50 29.75 G 28.50 1.00 1.00 30.50
Prob. 0834 0.991 0.448 0.649
There were no significant differences between the treatments in the number of fruit harvested or for the amount of damage.
Trial 10b.
As with trial 10a the aphid populations did not occur, and neither did the beneficial insects.
In Table 27 the Heliothis populations are given for the different treatments.
Table 27. Mean number of Heliothis on 20 leaves for each treatmen t. Treat 10/10 14/10 21/10 28/10 4/11 12/11 19/11 26/11 9/12
A 0 0 0 0.25 0 0 0 1.50 0 B 0 0 0 0.75 0 0 0 1.50 0 C 0 0 0 0 • 0.25 0 0 1.25 0.25 D 0 0 0 0 0 0 0 1.25 0.50 E 0 0 0 0 0 0 0 1.25 0.25 F 0 0 0 0.25 0.50 0 0 2.25 0 G 0 0 0 0 0.75 0 0 2.00 0
Prob. NS NS NS 0.607 0.196 NS NS 0.699 0.325
In Table 28 the yields from this trial are given.
Table 28. Mean number of fruit harvested from 5 plants for 7 treatments. Treatment Good fruit Damaged fruit Total fruit Treatment Good fruit
Heliothis Other Total fruit
A 24.75 0.75 4.50 30.00 B 27.50 2.00 5.50 35.00 C 28.00 1.25 3.25 32.50 D 28.75 1.50 4.00 34.25 E 30.50 0.50 2.50 33.50 F 26.75 1.25 5.25 33.25 G 30.00 0.50 2.75 33.25
Prob. 0.692 0.723 0.308 0.604
53

4.24 DISCUSSIONS:
The failure of aphid populations to build up in these two trials is unknown. All of the treatments applied would not have a major affect on aphid populations so it was expected that an increase in these populations in some of the treatments should have occurred. The failure of aphid populations to build up reflected the low level of beneficial insects that were recorded also.
The only difference in Heliothis populations occurred in trial 10a on the 26th
November. Generally the Heliothis populations were low and this may reflect the situation throughout the district when there is a reduction in the number of crops at this time of the year.
54

5. Trials 1997
5.1 TRIAL 11.
5.11 INTRODUCTION:
This trial was undertaken to evaluate different insecticides for the control of aphids and Heliothis in capsicums.
5.12 MATERIALS and METHODS:
Trial design was based on 6 treatments by 5 replications with plot size 10 metres by 1 row (double row) on a crop of capsicums planted on black plastic mulch. A guard row separated each datum row. Counts of insects were made by randomly selecting 5 plants per plot and examining 4 leaves on each of these plants. This gave a total of 20 leaves per plot that were examined each time throughout the trial period. The same plants were selected each time but not the same leaves.
Counts were undertaken on the 26th June 1997 and every week until the 12th August. A final count on the 15th September was made to see if populations had recovered. Aphid populations were determined by counting individuals, whether they were nymphs, wingless or winged-formed adults, while Heliothis eggs or larvae were also recorded as separate individuals. Beneficial insects were counted in the following way. A mummified aphid (parasitised aphid) as one, adults or larvae of ladybird beetles and lacewing as one each while the egg cluster/mass of the latter two were recorded as one.
Spray treatments were applied to the crop through a powered motorised knapsack sprayer over the top of the crop using a hand held boom at 689kPa. Sprays were applied weekly. The compounds used are listed by their commercial name following the use of their chemical name on the first occasion.
Treatments
A Methamidophos (Nitofol) B Imidacloprid (Confidor) C MVP + Synertrol oil D Pirimicarb (Pirimor) E Control (nil spray) F. Control
Harvesting of the fruit was undertaken on the 1st and 19th August. Fruit was assessed for damage by Heliothis (chewed fruit) and aphids (honey dew on the fruit).
55
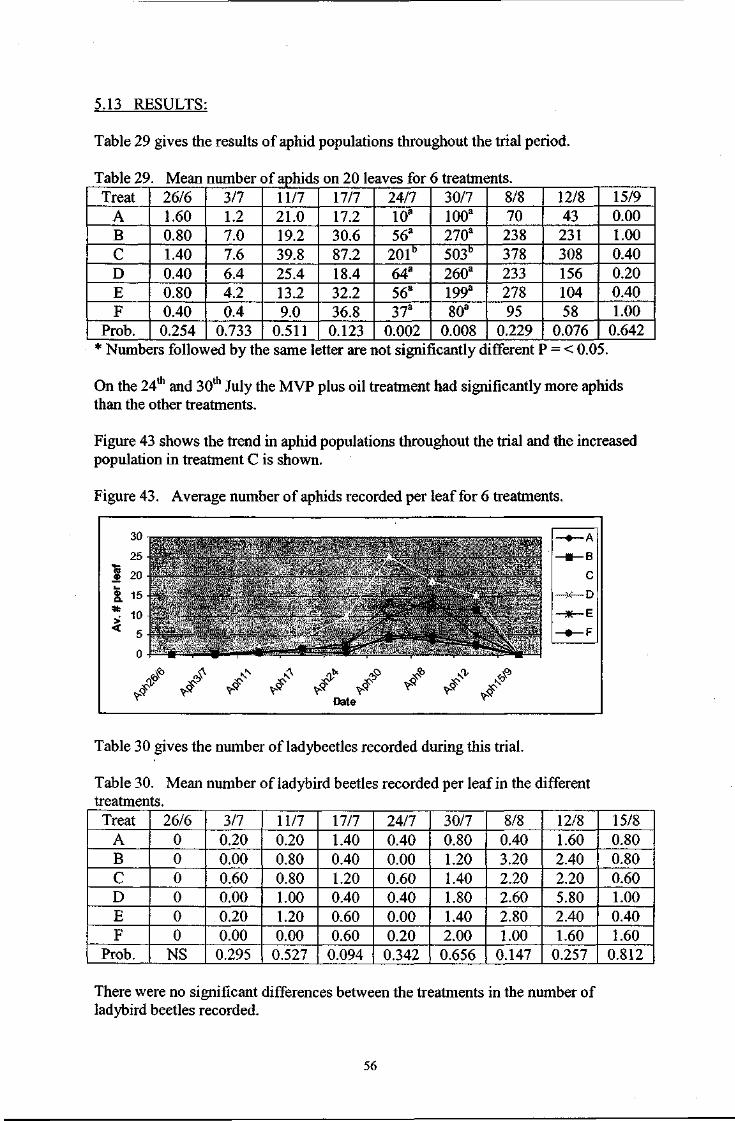
5.13 RESULTS:
Table 29 gives the results of aphid populations throughout the trial period.
Table 29 . Mean number of aphids on 20 leaves for 6 treatments. Treat 26/6 3/7 11/7 17/7 24/7 30/7 8/8 12/8 15/9
A 1.60 1.2 21.0 17.2 10" 100" 70 43 0.00 B 0.80 7.0 19.2 30.6 56" 270" 238 231 1.00 C 1.40 7.6 39.8 87.2 201" 503b 378 308 0.40 D 0.40 6.4 25.4 18.4 64" 260" 233 156 0.20 E 0.80 4.2 13.2 32.2 56" 199" 278 104 0.40 F 0.40 0.4 9.0 36.8 37" 80" 95 58 1.00
Prob. 0.254 0.733 0.511 0.123 0.002 0.008 0.229 0.076 0.642 *Numb( ;rs follov /ed by th e same letter are not significantly different P = < 0.05.
On the 24th and 30th July the MVP plus oil treatment had significantly more aphids than the other treatments.
Figure 43 shows the trend in aphid populations throughout the trial and the increased population in treatment C is shown.
Figure 43. Average number of aphids recorded per leaf for 6 treatments.
Table 30 gives the number of ladybeetles recorded during this trial.
Table 30. Mean number of ladybird beetles recorded per leaf in the different treatments. Treat 26/6 3/7 11/7 17/7 24/7 30/7 8/8 12/8 15/8
A 0 0.20 0.20 1.40 0.40 0.80 0.40 1.60 0.80 B 0 0.00 0.80 0.40 0.00 1.20 3.20 2.40 0.80 C 0 0.60 0.80 1.20 0.60 1.40 2.20 2.20 0.60 D 0 0.00 1.00 0.40 0.40 1.80 2.60 5.80 1.00 E 0 0.20 1.20 0.60 0.00 1.40 2.80 2.40 0.40 F 0 0.00 0.00 0.60 0.20 2.00 1.00 1.60 1.60
Prob. NS 0.295 0.527 0.094 0.342 0.656 0.147 0.257 0.812
There were no significant differences between the treatments in the number of ladybird beetles recorded.
56

In Figure 44 the trend in beetle populations in the different treatments are shown.
Figure 44. Mean number of ladybird beetles per leaf recorded in the different treatments.
Ladybeetle populations under 6 treatments 0.35-
0.3-•J5 0.25-5 0.2 * 0.15 -£ 0.1 -
0.05-0-«
<f ? y > ^ d * ^ I * * j *
- • — A
-•— B C
~X—D
- * — E
- • — F
The populations of lacewings and parasites were very low in this trial and there were no significant differences between the treatments. Figures 45 and 46 show the population trend of lacewings and parasites.
Figure 45. Average number of lacewings per leaf for 6 treatments.
0.35 -0.3-'
To 0.25-* 0.2 -* 0 . 1 5 -£ 0.1 -
0.05-0 -9
<r
Lacewing populations under 6 treatments
- / • /
- • — A
-B— B
C
-K— D
- * — E
- • — F
The parasite population in this trial remained low and probably had little effect on aphid populations. Figure 46 shows the parasite populations throughout the trial period for the different treatments.
Figure 46. Average number of parasites per leaf for 6 treatments.
0.045 0.04
0.035 g 0.03 -I - 0.025 * 0.02 i 0.015 ^ 0.01
0.005
Parasite population under 6 treatments
- • — A
C
- * — E
- • — F
57

The Heliothis populations throughout this trial remained low and there were no significant differences between the treatments. Figure 47 shows the population of Heliothis throughout the trial period.
Figure 47. Average number of Heliothis in each of the 6 treatments.
Heliothis population under 6 treatments
Harvesting of the trials gave the following results. Table 31 gives the number of fruit, (good, honeydew affected and damaged) for the first pick and Table236 for the second pick.
Table 31. Mean number of fruit, (good, honeydew affected and damaged), harvested from the 6 treatments in the first pick. ^__
Treatment Good Honeydew Damaged Total fruit A 39.6 7.4 0.40 47.4 B 43.8 4.6 1.80 50.2 C 29.0 7.6 0.80 37.4 D 40.8 7.6 1.40 49.8 E 21.0 11.6 0.60 33.2 F 35.6 8.6 1.40 45.6
Prob. 0.099 0.956 0.210 0.088
There were no significant differences between the treatments for the different categories of fruit harvested in the first pick.
Table 32. Mean number of fruit, (good, honeydew affected and damaged), harvested from the 6 treatments in the second pick.
Treatment Good Honeydew Damaged Total fruit A 20.4 26.8 2.20 49.4 B 45.8 9.2 5.20 60.2 C 33.6 23.6 3.80 61.0 D 19.4 27.6 3.00 50.0 E 43.4 18.8 4.20 66.4 F 32.8 20.2 3.80 56.8
Prob. 0.215 0.729 0.623 0.568
There were no significant differences between the treatments for the different categories of fruit harvested in the second pick.
58

In Figure 48 the relationship between the different categories of fruit harvested and the average number of aphids recorded at that time are shown.
Figure 48. Relationship between number of fruit in each category and the average number of aphids per leaf in the first pick for each treatment.
250
200-
30
25
20 -2 in
•D
15 •§. ro "5
10 *
Good
Damaged
Honeydew
-*— Aphid
In Figure 49 the number of fruit harvested in each category is shown for the second pick. No comparisons with aphid populations could be made for the second harvest as the populations had disappeared just prior to this harvest date.
Figure 49. Number of fruit, (good, honeydew and damaged), harvested from 6 treatments
250
£200 3
£150
Ja 100 | Z 50
—
R5i
BGood
H Damaged
•Honeydew
C D Treatment
Even though the aphid population had disappeared by this harvest date the amount of honeydew increased compared to the first fruit harvest. This could be due to a delay in the development of the fungus on the aphid excretions (honeydew).
5.14 DISCUSSION:
Aphid populations developed under all treatments and it is interesting to note that in treatment C, with an oil / insecticide combination that the population was significantly higher than all the other treatments. Previously the oil applications showed some control on aphid populations. There were no significant differences between the
59

treatments in the beneficial populations and these populations were low. This could reflect the effect of these insecticides on these beneficial insect populations. The reason why these populations did not develop in the control treatments is unknown but maybe the isolation of these plots within the treated plots is showing up. The small amount of damage to the fruit by Heliothis is evident and this could be the result of treatments or low populations. The slight variations in the treatments is what would be expected if the populations were much higher.
60

5.2 TRIAL 12.
5.21 INTRODUCTION:
This trial was undertaken again to evaluate the application of treatments for the control of aphids if they reached designated population levels. The trial was undertaken on a block of capsicums.
5.22 MATERIALS and METHODS:
Trial design was based on 6 treatments by 5 replications with plot size 10 metres by 1 row (double row) on a crop of capsicums planted on black plastic mulch. A guard row separated each datum row. Counts of insects were made by randomly selecting 5 plants per plot and examining 4 leaves on each of these plants. This gave a total of 20 leaves per plot that were examined each time throughout the trial period. The same plants were selected each time but not the same leaves.
rth th Counts were undertaken on the 5 August and approximately every week until the 7 October. Aphid populations were determined by counting individuals, whether they were nymphs, wingless or winged-formed adults, while Heliothis eggs or larvae were also recorded as separate individuals. Beneficial insects were counted in the following way. A mummified aphid (parasitised aphid) as one, adults or larvae of ladybird beetles and lacewing as one each while the egg cluster/mass of the latter two were recorded as one.
Spray treatments were not applied to the crop.
Harvesting of the fruit on the 9th October was undertaken to evaluate the extent of damage.
5.23 RESULTS:
Table 33 gives the number of aphids recorded during the period of the trial.
Table 33 . Mean number of aphids on 20 leaves for each 1 treatment. Treat 5/8 12/8 21/8 2/9 15/9 23/9 30/9 7/10
A 118 239 197 3.20 0.00 0 0 0.00 B 128 417 27 0.80 0.00 0 0 0.00 C 171 543 35 4.00 1.60 0 0 0.00 D 91 163 111 0.00 0.00 0 0 0.00 E 100 394 259 1.00 0.00 0 0 0.00 F 202 684 253 0.00 0.00 0 0 0.40
Prob. 0.272 0.194 0.392 0.408 0.443 NS NS 0.443
There were no significant differences between the treatments (all the same treatment).
Figure 50 shows the trend in aphid populations during the period of the trial.
61

Figure 50. Average number of aphids recorded per leaf for 6 treatments.
Aphid population
Table 34 gives the number of ladybird beetles recorded during the period of the trial.
Table 34. Mean number of ladybird beetles on 20 leaves for each treatment. Treat 5/8 12/8 21/8 2/9 15/9 23/9 30/9 7/10
A 0.20 1.80 1.80 1.60 0.80 0.60 0.00 0.00 B 0.40 2.60 0.60 0.60 1.80 1.20 0.00 0.60 C 1.20 0.80 1.40 0.60 1.00 0.40 0.00 0.20 D 0.60 0.80 1.20 1.230 0.40 0.80 0.00 0.20 E 0.60 2.60 2.80 0.60 0.80 1.00 0.40 0.20 F 1.20 3.40 2.40 2.20 0.80 0.60 0.00 0.00
Prob. 0.648 0.410 0.478 0.392 0.305 0.483 0.443 0.225
There were no significant differences between the treatments (all the same treatment).
Figure 51 shows the trend in ladybird beetle populations during the period of the trial.
Figure 51. Average number of ladybird beetles recorded per leaf for 6 treatments.
Lady beetle population
Table 35 gives the ANOV of the relationship between the aphid populations and ladybird beetle populations.
62

Table 35. ANOV for the relationship between the aphid populations and the ladybird beetle populations.
d.f. s.s m.s. v.r. F Regression 1 7.077E+07 70767288 8.17 0.029 Residual 6 5.196E+07 8660238 Total 7 1.227E+08 17532674
Figure 52 shows this relationship.
Figure 52. Fitted and observed relationship between aphid and ladybird beetle populations.
Filled ond observed relationship
own V
WMO
BDOO
axro /
4D00 y- "
swo-
s jS
y*
0 \y X v J:
- 2 0 0 0 -
X
beetles w
Figure 53 shows the total aphid and ladybird beetle populations during the trial period.
140 120
•5 100 Co
^ 80 * 60 £ 40
20 0
r
5-Aug 12-Aug 21-Aug 2-Sep 15-Sep 23-Sep 30-Sep 7-Oct
Date
0.7
0.6
0-5 %
0.4 £
0.3 *
0.2 %
0.1
0
-Aphid m
-Aphid
- Beetles - Beetles
63

In Tables 36 and 37 the mean number of lacewings and parasites recorded during the trial are given. The regression analysis of the data did not give a significant relationship between aphids and these two beneficial insects F = 0.682 and 0.548 respectively.
Table 36. Mean number of lacewings on 20 leaves for each treatment. Treat 5/8 12/8 21/8 2/9 15/9 23/9 30/9 7/10
A 0.20 0.40 5.20 1.20 0.80 0.00 0.00 0.00 B 0.20 0.00 2.40 0.40 0.00 0.00 0.00 0.00 C 0.00 0.20 1.00 1.60 0.40 0.00 0.00 0.00 D 0.00 0.20 1.80 2.20 0.00 0.00 0.00 0.00 E 0.00 1.40 4.00 1.20 0.20 0.00 0.00 0.00 F 0.00 0.20 1.60 1.20 0.40 0.00 0.00 0.00
Prob. 0.588 0.186 0.115 0.155 0.288 NS NS NS
There were no significant differences between the treatments.
Table 37 . Mean number of parasites on 20 leaves for eac i treatment. Treat 5/8 12/8 21/8 2/9 15/9 23/9 30/9 7/10
A 0.00 0.00 0.40 0.40 0.00 0.00 0.00 0.00 B 0.00 0.00 0.20 0.00 0.00 0.20 0.40 0.00 C 0.00 0.00 0.00 0.20 0.00 0.00 0.00 0.00 D 0.20 0.40 0.60 0.40 0.00 0.00 0.00 0.00 E 0.20 0.20 1.20 0.40 0.20 0.00 0.20 0.00 F 0.00 0.40 1.00 0.40 0.20 0.20 0.00 0.00
Prob. 0.588 0443 0.605 0.785 0.588 0.443 0.218 NS
There were no significant differences between the treatments.
Figures 54 and 55 show the lacewing and parasite trends throughout the trial period.
Figure 54. Average number of lacewings recorded per leaf for 6 treatments.
64

Figure 5 5. Average number of parasites recorded per leaf for 6 treatments.
In Figure 56 the percentage of each beneficial is shown.
Figure 56. Percent of each beneficial insect throughout the trial period. 120 i —•— Lady beetle 120 i —•— Lady beetle
—•— Lacew ing
_ 80 ! — ^ A . c \ 8 fin
B^~-Rarasites _ 80 ! — ^ A .
c \ 8 fin
B^~-Rarasites _ 80 ! — ^ A .
c \ 8 fin
B^~-1
a>
°- 40
20
0 -
I
j a>
°- 40
20
0 -^ » i a
t
i
,i co en 3 3
< <:
Aug
Aug
Q. CL CO CD
CO CO Sep
Sep
Sep
-Oct
LO CM CD CM
CM O)
Date CD CO
CM o co
i^-
Table 43 gives the numbers of Heliothis present throughout the crop and figure 57 shows these numbers.
Table 43. Mean number of Heliothis recorded in each treatment. Treat 5/8 12/8 21/8 2/9 15/9 23/9 30/9 7/10
A 0.00 0 0.00 0.00 0 0.40 0.00 0.20 B 0.00 0 0.00 0.00 0 0.00 0.20 0.20 C 0.00 0 0.40 0.00 . 0 0.40 0.20 0.00 D 0.40 0 0.00 0.00 0 0.00 0.00 1.20 E 0.00 0 0.20 0.40 0 0.40 0.20 2.00 F 0.40 0 0.00 0.00 0 0.00 1.00 0.00
Prob. 0.143 NS 0.558 0.053 NS 0.601 0.588 0.487
There were no significant differences between the treatments in the number of Heliothis present.
65
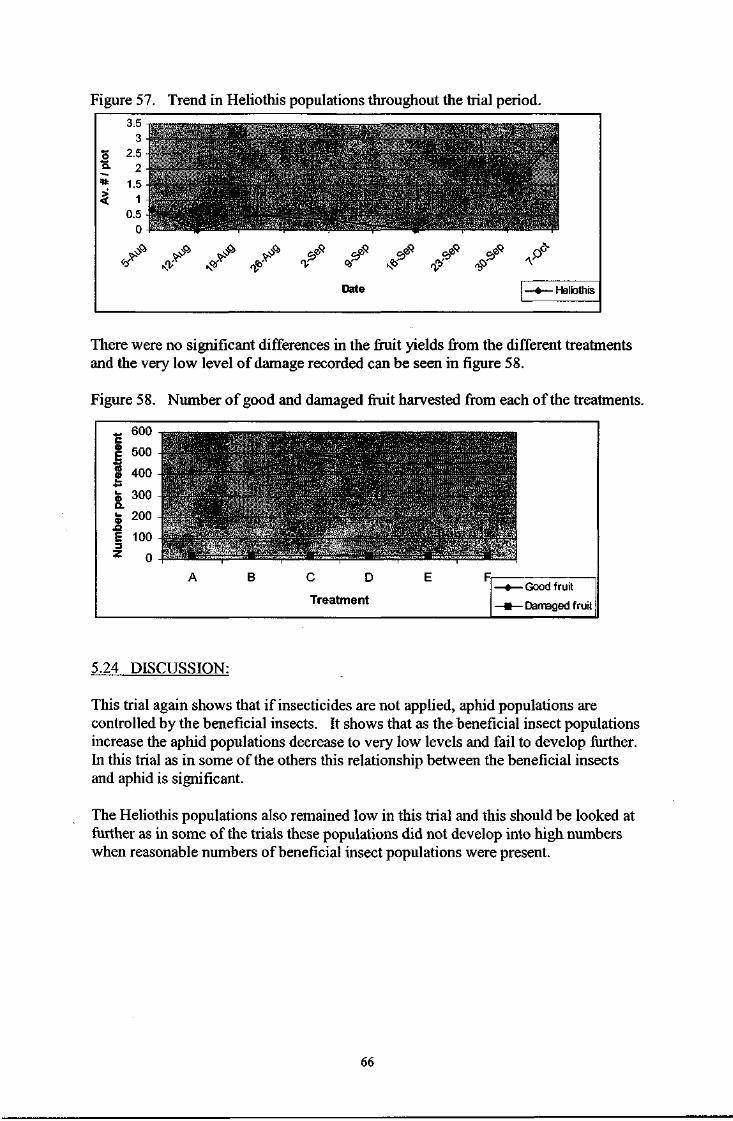
Figure 57. Trend in Heliothis populations throughout the trial period.
i
Date • Heliothis
There were no significant differences in the fruit yields from the different treatments and the very low level of damage recorded can be seen in figure 58.
Figure 58. Number of good and damaged fruit harvested from each of the treatments.
« 600
| 500 - ( - - -
to 400
300
fe 200
E 100
0 - at -fit r=H !
C D
Treatment -•—Good fruit
- a — Damaged fruit
5.24 DISCUSSION:
This trial again shows that if insecticides are not applied, aphid populations are controlled by the beneficial insects. It shows that as the beneficial insect populations increase the aphid populations decrease to very low levels and fail to develop further. In this trial as in some of the others this relationship between the beneficial insects and aphid is significant.
The Heliothis populations also remained low in this trial and this should be looked at further as in some of the trials these populations did not develop into high numbers when reasonable numbers of beneficial insect populations were present.
66

5.3 TRIAL 13
5.31 INTRODUCTION:
This trial was undertaken again to evaluate the application of treatments for the control of aphids if they reached designated population levels. The trial was undertaken on a block of capsicums.
5.32 MATERIALS and METHODS:
Trial design was based on 6 treatments by 5 replications with plot size 10 metres by 1 row (double row) on a crop of capsicums planted on black plastic mulch. A guard row separated each datum row. Counts of insects were made by randomly selecting 5 plants per plot and examining 4 leaves on each of these plants. This gave a total of 20 leaves per plot that were examined each time throughout the trial period. The same plants were selected each time but not the same leaves.
Counts were undertaken on the 14th October and approximately every week until the 9th December. Aphid populations were determined by counting individuals, whether they were nymphs, wingless or winged-formed adults, while Heliothis eggs or larvae were also recorded as separate individuals. Beneficial insects were counted in the following way. A mummified aphid (parasitised aphid) as one, adults or larvae of ladybird beetles and lacewing as one each while the egg cluster/mass of the latter two were recorded as one.
Spray treatments were not applied to the crop.
Harvesting of the fruit on the 14th and 28th November was undertaken to evaluate the extent of damage.
5.33 RESULTS:
Table 44 gives the number of aphids recorded during the period of the trial.
Table 44. Mean number of aphid s on 20 leaves for each treatment. Treat 14/10 21/10 27/10 3/11 11/11 19/11 24/11 2/12 9/12 A 19.6 4.6 48.2 35.6 4.0 5.0" 1.2 0.8 0.2 B 2.8 5.4 42.2 27.6 5.2 0.2' 1.0 9.2 0.0 C 2.4 13.0 51.8 18.8 1.8 1.6' 0.4 2.0 0.0 D 0.8 7.4 19.2 32.6 1.6 1.8' 0.0 0.0 0.0 E 3.8 0.6 27.4 29.0 0.8 1.2' 0.0 0.2 0.0 F 1.6 2.8 17.0 14.8 2.2 0.8' 0.4 0.4 0.0 Prob. 0.174 0.352 0.519 0.644 0.215 0.030 0.390 0.459 0.443 * Numb >ers folio wed by t he same etter are not signi] ficantly d ifferent P = < O.C )5.
-vth On the 19 November treatment A had significantly more aphids than the other treatments. As all treatments are the same, this difference may be due to the very low numbers recorded at that time.
In Figure 59 the trend in aphid populations is shown for the trial period.
67

Figure 59. Average number of aphids recorded per leaf for 6 treatments.
Table 45 gives the number of ladybird beetles recorded throughout the trial period.
Table 45. Mean number of ladybird beetles on 20 leaves for each treatment. Treat 14/10 21/10 27/10 3/11 11/11 19/11 24/11 2/12 9/12 A 0.6 0.4 0.8 1.0 1.0 0.6 0.2 0.4 0.0 B 0.2 0.2 1.0 1.8 1.2 0.8 0.2 0.2 0.2 C 0.4 0.2 0.2 0.4 2.0 0.8 0.2 0.6 0.2 D 0.2 0.2 0.6 0.4 0.8 0.8 0.0 0.6 0.4 E 0.2 0.0 0.6 1.0 0.6 1.0 0.2 0.0 0.2 F 0.2 0.2 0.6 1.2 0.8 0.8 0.4 0.6 0.0 Prob. 0.903 0.905 0.858 0.217 0.162 0.997 0.915 0.675 0.778
There were no significant differences between the treatments.
Figure 60 shows the trend in ladybird beetle populations throughout the trial period.
Figure 60. Average number of ladybird beetles recorded per leaf for 6 treatments.
There were no relationship between the number of aphids and ladybird beetles.
68

Figure 61 shows the aphid and ladybird beetle population trends throughout the trial period.
Figure 61. Average number of aphid and ladybird beetle populations during the trial period.
n V\
10 » ^ ! 0.3
•55 8 -« * 6
i 4-
I J - 0-25 fc
- 0.2 ^
|- 0.15 *
-0.1 ^
2 -
0 -
• « «—
>» - 0.05
14-Oct 21-Oct 27-Oct 3-Nov 11-Nov 19-Nov 24-Nov Date
2-Dec 9-Dec • Aphid
—•— Beetles
Table 46 gives the mean number of lacewings recorded in the trial.
Table 46. Mean number of lacewings on 20 leaves for each treatment. Treat 14/10 21/10 27/10 3/11 11/11 19/11 24/11 2/12 9/12 A 0 0 0.2 0.2 0.0 0.0 0.8b 0,2 0.0 B 0 0 0.0 0.0 0.0 0.2 0.0' 0.0 0.0 C 0 0 0.0 0.0 0.2 0.0 0.0' 0.0 0.0 D 0 0 0.0 0.0 0.0 0.0 0.0' 0.0 0.2 E 0 0 0.0 0.2 0.0 0.0 0.0' 1.2 0.0 F 0 0 0.4 0.0 0.4 0.0 0.2' 3.2 0.0 Prob. NS NS 0.558 0.588 0.138 0.443 0.020 0.467 0.443 * Numb >ers folio wed by t le same etter are not signi icantly c ifferent P = <0.0 5.
ith On the 24 November treatment A had significantly more lacewings than the other treatments. Again the treatments are all the same so this higher population is probably due to the higher population of aphids on the 19th.
There were no significant differences between the treatments in the number of parasites.
In figures 62 and 63 the population trends for lacewings and parasites are shown.
69

Figure 62. Average number of lacewings recorded per leaf for 6 treatments.
0.045 -0.04-
0.035 -15 0.03 -. £ 0.025 -* 0.02 -r £ 0.015--
0.01 -0.005 -
0 -s
Date
Figure 63. Average number of parasites recorded per leaf for 6 treatments.
0.12-
0.1 -
n 0.08 o
J 0.06 -
£ 0.04-
0.02 -
.& #
^&
Date % <r Sr
-•—A
-•—B
•-:•- C
-x—D
-*— E
-•— F
-+-
In Figure 64 the percentage of each beneficial insect recorded throughout the trial period are shown.
Figure 64. Percent of each beneficial insect throughout the trial period.
T>' Pu .&
V ^° Date <v
f Sf •v
• Beetle
- Lacew ing
Rarasite
Heliothis numbers were also low throughout the trial period and the numbers recorded are given in Table 47. Figure 65 shows the population trend.
70

Table 47. Mean number of Heliothis recorded in each treatment. Treat 14/10 21/10 27/10 3/11 11/11 19/11 24/11 2/12 9/12 A 0.6 1.0 0.8 0.8 0.0 0.2 0.0 0.2 0.2 B 0.4 0.8 0.2 0.8 0.6 0.0 0.0 0.2 0.0 C 0.8 1.0 0.4 0.6 0.4 0.2 0.2 0.4 0.0 D 0.2 0.8 0.0 0.4 0.0 0.0 0.0 0.0. 0.4 E 0.2 1.0 0.2 0.8 0.2 0.4 0.2 0.4 0.2 F 1.0 1.0 0.0 0.6 0.4 0.2 0.0 0.0 0.2 Prob. 0.492 0.997 0.137 0.983 0.619 0.802 0.588 0.497 0.517
There were no significant differences between the treatments.
Figure 65. Trend in Heliothis populations throughout the trial period.
0) Q.
-•—A
-•—B
C
-X—D
-*— E
-•— F
.& V
^ ^ ^ ^
^ ^ ^ r Date
S </
There were no significant differences between the treatments in the number of undamaged or damaged fruit in either pick 1 or 2. Figure 66 shows the undamaged and damaged fruit harvest from the trial for the two picks.
Figure 66. Number of undamaged and damaged fruit harvest from each of the treatments.
800-700
3 600 t 500 t 400 a> •Q 3 0 0 -E =j 200
100 -
- - - - - - - - -800-700
3 600 t 500 t 400 a> •Q 3 0 0 -E =j 200
100 -
- -i
800-700
3 600 t 500 t 400 a> •Q 3 0 0 -E =j 200
100 -
1
1
1 i
_ 1
800-700
3 600 t 500 t 400 a> •Q 3 0 0 -E =j 200
100 - 81111111 -WSSmm
1
1
1 i
_ 1
Pickl
Pick number
Pickl
Pick number
Pick 2 H Good fruit
M Damaged fruit
Pickl
Pick number
5.34 DIS CUSS ION:
Again in this trial it showed that as the beneficial insect populations increased the aphid populations decreased. Also the Heliothis populations tended to decrease over the period of the trial when normally they should be increasing as the plants flower
71

and set fruit. As stated previously when beneficial insects populations are present the Heliothis populations tend to remain low.

5.4 TRIAL 13a.
5.41 INTRODUCTION:
This trial evaluated a number of insecticides against the cucumber moth larvae in a rockmelon crop grown on black plastic mulch.
5.42 MATERIALS and METHODS:
The trial design was based on 6 treatments by 5 replications with plot size 10 metres by a single row. A guard row separated each datum row. Counts of larvae were undertaken by examining 7 plants per plot.
Counts were made as a pre-treatment on the 25th and a post-treatment count 7days after spraying.
Sprays were applied by a motorised knapsack on the 26 th, and the chemicals evaluated in the trial listed below.
Treatment.
A. Deltamethrin (decis) 50ml/100L B. Methomyl (Lannate) 200ml /100L C. Endosulfan (Thiodan) 2.1 L/ha D. MVP (Bt) 2 L / 1 0 0 L E. Imidacloprid (Confidor) 500ml / ha F. Nil spray
5.43 RESULTS:
Table 48. Mean number of larvae recorded in the different treatments at a pre-treatment and a post-treatment count.
Treatment Pre-count 25/6/97 Post-count 3/7/97 A 14.0 0.80 B 9.6 0.00 C 11.0 0.00 D 7.6 0.00 E. 10.8 0.40 F 13.0 2.20
Prob. 0.704 0.560
There were no significant differences between the treatments. With a covariate analysis the covariate was significant (F = < 0.001).
5.44 DISCUSSIONS:
As there were no significant differences between the treatments no conclusions can be made. From this trial and others it appears that the larvae of this insect can be controlled by most insecticides.
73

6. POPULATION MONITORING.
6.1 INTRODUCTION:
Pheromone traps for heliothis were distributed throughout the district to monitor the heliothis populations during the year. At the same time water bath traps were set to monitor aphid populations and later thrip populations as well. From these records it was intended to build up data records that could be used in predicting these insect populations.
At the same time egg collections of heliothis were made to determine the egg parasite populations and their effect throughout the year.
6.2 MATERIALS and METHODS:
Heliothis traps were set up near crops at Ayr, Brandon, Clare and Home Hill. In the second year this trapping was extended to include the Gumlu district. Green funnel traps suspended approximately 1.5m off the ground were used to monitor heliothis populations. Traps were emptied weekly and moth numbers recorded.
Aphids and thrips were collected in yellow pan traps 20cm diameter and 10cm deep filled with water and a drop of detergent to break surface tension. These traps were placed in the centre of a yellow sheet lm 2 . This sheet was painted canary yellow also. Traps were emptied weekly by sieving the solution through a fine mesh and extracting the adult aphids or thrips from this mesh back in the laboratory.
Parasite counts were made by collecting individual heliothis eggs from crops and placing then in a multi cell plate to note emergence.
74

6.3 RESULTS:
Heliothis.
Figures 67 and 68 show the weekly collections for moths of Helicoverpa armisera and H. punctisera for the year 1994 on the Ayr Research Station. Also each graph shows a line for the monthly average.
Figure 67.
20 -
H. armigera - Ayr 1994
20 -
• i Weekly Totals —•— Monthly Average
20 -18 16 14 -12 -10-8-1
6", \ 4- 1
2 -n . A I. i t rl^Tl c
993-
99
4-
99
4-
3) o> o> o> o) o) O) o> o) o o) o) o> 9
94
-
99
4-
994-
31/1
2/1
31/0
1/1
28/0
2/1
O 5
30/0
4/1
31/0
5/1
30/0
6/1
31/0
7/1
31/0
8/1
30/0
9/1
31/1
0/1
30/1
1/'
31/1
2/1
Figure 68.
H. punctigera - Ayr 1994
EUHl Weekly Totals —•-— Monthly Averages
2.5 -
2
1.5
1 -
0.5
0 -
2.5 -
2
1.5
1 -
0.5
0 - . . /
J
I 1 1
I
2.5 -
2
1.5
1 -
0.5
0 - . . / t I 1 1
I
c c c
c
V
C
0 n n
0 31/0
1/19
94 -
28/0
2/19
94 -
31/0
3/19
94 -
30/0
4/1
994-
31/0
5/19
94 -
30
/06
/19
94
- <
31/0
7/19
94 - <
31
/08
/19
94
- <
30/0
9/19
94 J
31
/10
/19
94
-
30
/11
/19
94
-
31
/12
/19
94
-
The population of H. armigera peaked in the month of July with an average of approximately 9 moths per week whereas H. punctisera peaked in October with approximately 0.75 moths per week.
75

Figures 69 and 70 show the weekly collections for moths of Helicoverpa armigera and H. punctisera for the year 1994 at Brandon. Also each graph shows a line for the monthly average.
Figure 69.
H. armigera - Brandon 1994
70
^ • • W e e k l y Totals — •— Monthly Average
70 60
I I
50 40
30 20 10 n - _•_ _ _ .L . _ . * _ „...!_... I I I ITih
c c c
n n n 9
94
-
99
4-
99
4-
99
4-
99
4-
99
4-
99
4-
994
99
4-
99
4-
99
4-
99
4-
31/1
2/'
31/0
1/1
28/0
2/1
31/0
3/1
30/0
4/1
31/0
5/1
30/0
6/1
31/0
7/1
31/0
8/1
30/0
9/1
31/1
0/-
30/1
1/1
31/1
2/1
Figure 70.
H. punctigera - Brandon 1994
5
i — B Weekly Totals —•— Monthly Average
5
5 -
4 - •
3
2 -1
1
n , I 1 J
c
1993
-
Tien cn 19
94 -
19
94
-
19
94
-
1994
-
1994
-
1994
-
19
94
-
19
94
-
1994
-
1994
-
31/1
2/
31/0
1/
28/0
2/
30/0
4/
31/0
5/
30/0
6/
31/0
7/
31/0
8/
30/0
9/
31/1
0/
30/1
1/
31/1
2/
The population of H. armisera peaked in the month of July with an average of approximately 37 moths per week and again in October with an average of approximately 30 whereas H. punctisera peaked in October with approximately 1 moth per week.
76

Figures 71 and 72 show the weekly collections for moths of Helicoverpa armisera and H. punctisera for the year 1994 at Clare. Also each graph shows a line for the monthly average.
Figure 71.
H. armigera - Clare 1994
OEl
• • • W e e k l y Totals — •— Monthly Average
OEl
20
15
10 • V 5
n lb "v-^r X$\ I c 9
93
-
99
4-
99
4-
99
4-
99
4-
99
4-
99
4-
99
4-
99
4-
99
4-
99
4-
99
4-
31/1
2/'
31/0
1/'
28/0
2/1
30/0
4/'
31/0
5/1
30/0
6/1
31/0
7/1
31/0
8/1
30/0
9/1
31/1
0/-
30/1
1/'
31/1
2/
Figure 72.
H. punctigera - Clare 1994
1.2-
^ • • W e e k l y Totals —4 >— Monthly Average
1.2-
1 - [ 0.8 i
0.6
0.4- / V 0.2 I / \
n I 1 J V 1
19
93
-
19
94
-
19
94
-
19
94
-
19
94
-
1994
-
1994
-
" * • * • * • * ! •
cn cn cn cn en cn cn cn cn
cn 1994
-
31/1
2/
31/0
1/
28/0
2/
31/0
3/
30/0
4/
31/0
5/
30/0
6/
31/0
7/
31/0
8/
30/0
9/
31/1
0/
30/1
1/
31/1
2/
The population of// armisera was rising in the month of October with an average of approximately 10 moths per week whereas H. punctisera also peaked in October with approximately 0.7 moths per week.
77

Figures 73 and 74 show the weekly collections for moths of Helicoverpa armisera and H. punctisera for the year 1994 at Home Hill. Also each graph shows a line for the monthly average.
Figure 73.
400- r
350 T
300 250 -2 0 0 -150-100 50 0
& .& *&
H. armigera - Home Hill 1994
I Weekly Totals • Monthly Average
• J& ^ ^ A # N „ # . ^ ^ ^ O rtO n v rv x f iv r O n V rt?1 f>T* o^> rv^ n v fxx
t>
Figure 74.
H. punctigera - Home Hill 1994
1 * 1 r
m m Weekly Totals —•— Monthly Average
1 * 1 r
vz i
10 j a ' ii i
4 * 2
1 j
C
99
3-
99
4-
994
99
4-
99
4-
99
4-
994
99
4-
994
99
4- <
99
4- <
99
4-
en en
31/1
2/1
31/0
1/1
28/0
2/1
31/0
3/1
30/0
4/1
31/0
5/1
30/0
6/1
31/0
7/1
31/0
8/1
30/0
9/1
31/1
0/1
30/1
1/1
31/1
2/1
The population of H. armisera peaked in the month of August with an average of approximately 300 moths per week whereas H. punctisera also peaked in August with approximately 6 moths per week.
It is interesting that the H. armisera collections at Home Hill were much higher than the other sites and especially the Clare site as these two sites were within a 6km distance from each other. The Clare sites was an isolated area surrounded by large cane areas. The H. punctisera populations appeared in late August or in September for this year. These populations did not reach the same numbers as the other species.
78

Figures 75 and 76 show the weekly collections for moths of Helicoverpa armisera and H. punctisera for the year 1995 at Ayr. Also each graph shows a line for the monthly average.
Figure 75.
16 — -14-
H.armigera - Ayr 1995
16 — -14-
• I Weekly Totals —•• — Monthly Averages
16 — -14-16 — -14-1 2 "I 10 ' 8 6 4-2 0 i frtr'TT Tin il 1 TT TfkrvT*l
• * in m lO in m m in in in m in m CD O) CD co o> co o> co co CO CO CO CO CD O) co CD o> o> co CO CO CD CD CD co v j \ • T— T - T - *— T ~ T— T— T— T— T— T —
C\J T — Si CO 51 55 <B ^ 55 35 o ^ CM
~ o o o o o o o o O T - J - ^ r- X — 00 T — O T - O T- ^ O T - O T —
CO CO CM co co co co CO CO co co co co
Figure 76.
50 45 40 35 30 25 20 15 10 5 0
CD
H. punctigera - Ayr 1995
I Weekly Totals —•— Monthly Average
. X ••lrf»—rr»i m co CO
in cn cn
Si o o5 CM
in co CD
in CO CO
g o CO
in co CD 55 o
in CO co
co
g o co
in in in m in co co co co CD CD CD CD CD 00
co o o CO
in CD CD
The population of//, armigera peaked in the month of June with an average of approximately 5 moths per week whereas H. punctisera peaked in September with approximately 12 moths per week.
79

Figures 77 and 78 show the weekly collections for moths of Helicoverpa armisera and H. punctisera for the year 1995 at Brandon. Also each graph shows a line for the monthly average.
Figure 77.
H. armigera - Brandon 1995
• • B Weekly Totals —•—Monthly Average
3 5 -3 0 -25 -20 -15-10 -5 -0 -.
/hi i n w m i n m i n m i n i n m i n m
2/19
9
1/19
9
2/19
9
3/19
9
4/19
9
5/19
9
6/19
9
7/19
9
8/19
9
9/19
9
0/19
9
1/19
9
2/19
9
C o g g g o o o g o ^ ^ ^ CO c o c M c o c o c o c o c o c o o o c o c o CO
Figure 78.
H. punctigera - Brandon 1995
— W e e k l y Totals —•—Monthly Average
20 i 1 1
15 - 1 1
10 -; i JK •
si V
. _p n 0 -
1 • _p
994
995 L O i o i o i o m i o m m in
0 ) 0 ) 0 ) 0 ) 0 ) 0 ) 0 0 ) O) 995
995
31/1
2/'
31/0
1/1
28/0
2/1
31/0
3/1
30/0
4/1
31/0
5/1
30/0
6/1
31/0
7/1
31/0
8/1
30/0
9/1
31/1
0/1
30/1
1/1
31/1
2/1
The population of//, armisera peaked in the month of March with an average of approximately 13 moths per week and again in June with an average of approximately 20 whereas H. punctisera peaked in September with approximately 7 moths per week.
80

Figures 79 and 80 show the weekly collections for moths of Helicoverpa armieera and H. punctisera for the year 1995 at Home Hill. Also each graph shows a line for the monthly average.
Figure 79.
140-120-100 -80-' 60 ' 40-20-0-,
JSP •y nv
H. armigera - Home Hill 1995
I Weekly Totals - Monthly Average
<£>" &
^ ^ rf ^ # ^ &
.& &J
& «5» <P
K ^ ^ ^ ^ ^ ^ «§» ^ O ^
K«S°
^
# J J>
Figure 80.
180 160 140 120 100 80 60 40 20 0
H. punctigera - Home Hill 1995
J .J> *
I Weekly Totals —•— Monthly Average
& J> J> A * 3
v v a? « J ( F S" * a"
lT " ^ t ^ <rf CT '£>' r$*~ ^ ' rf *b & °? # "
# J> J> J> \-sJ \K J \ N J \ V
& V
The population of//, armisera peaked in the month of August with an average of approximately 65 moths per week though there were a reasonable population between July and September. The H. punctisera peaked in September with approximately 60 moths per week.
81
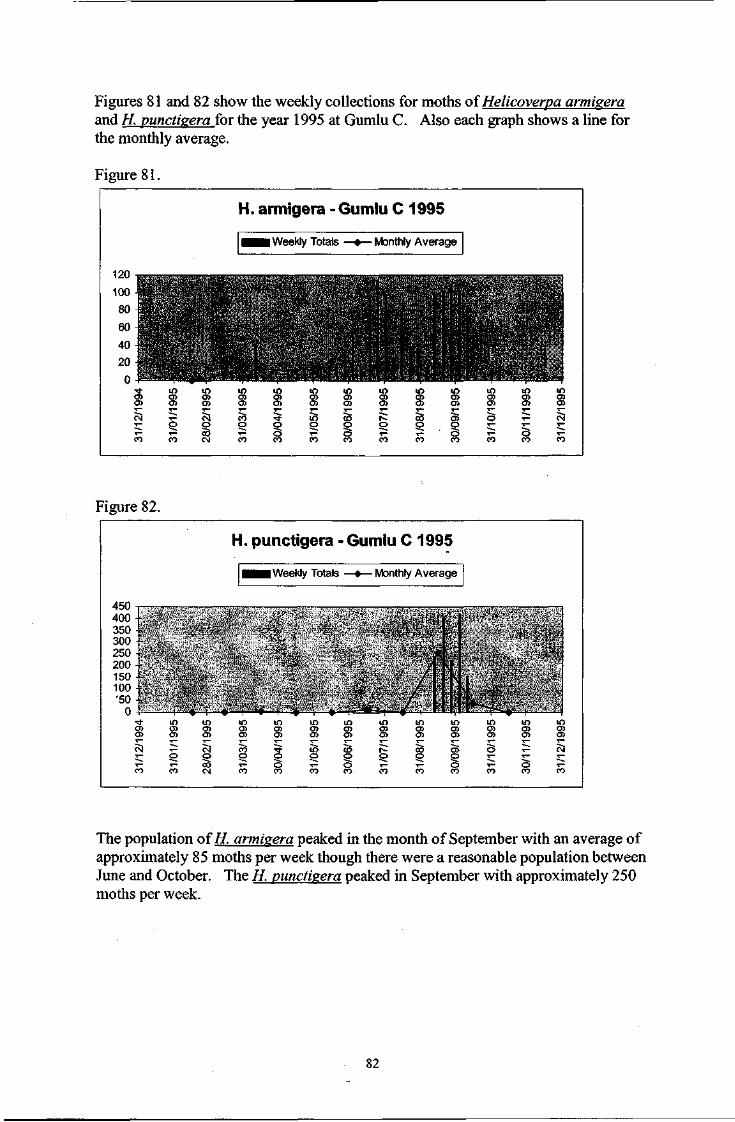
Figures 81 and 82 show the weekly collections for moths of Helicoverpa armisera and H. punctigera for the year 1995 at Gumlu C. Also each graph shows a line for the monthly average.
Figure 81.
120 -
H. armigera - Gumlu C 1995
120 -
• B E i Weekly Totals —•— Monthly Average
120 -
100 -
8 0 - A 6 0 - A. / * \ 4 0 - . / r
• • s 2 0 -n ^—r-tr rrfTiTTrriTnl 1 1 II. 7M>.
en CO
in en en
in CO CD 99
b-
995-
995-
995-
99
5-
995-
995
995-
995- m
en CO
31/1
2/1
31/0
1/1
28/0
2/1
31/0
3/1
30/0
4/1
31/0
5/1
30/0
6/1
31/0
7/1
31/0
8/1
30/0
9/1
31/1
0/1
30/1
1/1
31/1
2/1
Figure 82.
450 | —
K I. punctigera - Gumlu C 1995
450 | —
K
• • 1 Weekly Totals —•— Monthly Avere ge
450 | —
K
450 | — 1
400 -! 350 -I 300 -250 -. A 200 - / s 150 -' / S 1 100 - / si •50 -
n ' A A « & M. A - . / v . >* i n i n m in in m in in in in m i n CO CO CO ID CO CO co co en en CO co CO CO CO CO CO CO CO co co CO CD
Ri i ; Si CM Ri r> • * i n CD r - co CO O Si T — o o 3 O O o o o O T~ T -
co T" O •>" o « - T - o T - o CO CO CM CO CO CO CO CO CO co co CO CO
The population of// armigera peaked in the month of September with an average of approximately 85 moths per week though there were a reasonable population between June and October. The H. punctigera peaked in September with approximately 250 moths per week.
82

Figures 83 and 84 show the weekly collections for moths of Helicoverpa armisera and H. punctisera for the year 1995 at Gumlu Z. Also each graph shows a line for the monthly average.
Figure 83.
H. armigera - Gumlu Z1995
i ° n
B H Weekly Totals • Monthly Average
i ° n
100
80
60
40 I
k
20 t
*~-*-r-+Y' irlYfTrri+rm I U\\ ^ J c 1
99
4-
1995
-
in en en 19
9b-
19
95
-
19
95
-
19
95
-
1995
-
1995
-
1995
-
1995
-
19
95
-
19
95
-
31/1
2/
31/0
1/
28/0
2/
31/0
3/
30/0
4/
31/0
5/
30/0
6/
31/0
7/
31/0
8/
30/0
9/
31/1
0/
30/1
1/
31/1
2/
Figure 84.
h 1. punctigera - Gumlu Z1995
1
i f in -
h
m m Weekly Totals • Monthly Average
1
i f in -
h
1 140
h
1
120- 1
100 1
80 - 60 -'- / | 40 -• / \ 1
1
20 -| / 1
n I A A .1*. ^ —* r - A L . J 1 1 A c 1
99
4-
in en en
in en en 19
9b-
19
95
- <
19
95
-
19
95
-
19
95
- <
19
95
-
19
95
-
1995
-
in en CB 1
99
5-
31/1
2/
31/0
1/
28/0
2/
31/0
3/
30/0
4/
31/0
5/
30/0
6/
31/0
7/
31/0
8/
30/0
9/
31/1
0/
30/1
1/
31/1
2/
The population of H. armisera peaked in the month of September with an average of approximately 65 moths per week though there were a reasonable population between June and October. The H. punctisera peaked in September with approximately 70 moths per week.
During 1995 the populations of heliothis were present most of the year with peak activity around July to October for H. armisera and in September for H. punctisera. This high population of punctigera is unusual for this area.
83

Figures 85 and 86 show the weekly collections for moths of Helicoverpa armisera and H. punctisera for the year 1996 at Ayr. Also each graph shows a line for the monthly average.
Figure 85.
H. armigera -Ayr 1996
1fi
M B i Weekly Total —•— Monthly Average
1fi ID 14 i 12 -10 -8 6 -4 > l 2 Jf / f N ^ . — r •"T-++*-!-. - •
c 19
95 i
CO
1996
1996
1996
1996
19
96
- -
1996
19
96
-
1996
1996
< 1
99
6-
31/1
2/
31/0
1/
29/0
2/
31/0
3/
30/0
4/
31/0
5/
30/0
6/
31/0
7/
31/0
8/
30/0
9/
31/1
0/
30/1
1/
Figure 86.
10
H. punctigera - Ayr 1996
10
m r a Weekly Totals —*— Monthly Average
10 9 8 7 i 6 5 4 • JK 3 / 1 s
2 . X l " 1 0 , *-^ir -- _ * - • -T Ifl ill \ll 1 0 ,
I D CD co CD CO CD CD CD CD CD CO CI D o> O o> 3> C3> <3> 05 O Q> Ol en c ) o> CD en G> O 0> O} 0 ) a> O 05 0 0
CM t— CM CO -*t IT) CD C- 00 Ol O T-T -
o o Z> O O O O O C O) T— O *— O T - T - C T ~ C 3
CO CO CM CO CO CO CO CO CO CO CO P 0
The population of//, armisera peaked in the month of May with an average of approximately 4 moths per week whereas H. punctisera peaked in November with approximately 4 moths per week.
84

Figures 87 and 88 show the weekly collections for moths of Helicoverpa armisera and H. punctigera for the year 1996 at Brandon. Also each graph shows a line for the monthly average.
Figure 87.
20 18 16 14 12 10 8 6 4 2 0-r-
l O
H. armigera - Brandon 1996
I Weekly Totals • Monthly Average
^ U m i co co CD CD CD en
co CM
co co o> en o> CD
co co co en a> en
co o o o co
o
CO CD
en
o
co co en en en en
co en en
co CD CD
co CD CD Si
co co
00 CD O T-9 2 C C JZ ^ O ^ O T-co co co co co
Figure 88.
r 1. punctigera -Brandon 1996
o c
r
H ^ B Weekly Totals —•— Monthly Average
o c
r
2 i •
1.5 -i
1 -i :
0.5-! * S
oi , A A A *> *, ***01^ oi 9661 19
96 9661
CO CD CO Oi Oi Oi Oi Oi Oi
CO CD CO CD CD 0> Oi Oi CT> Oi Oi Oi Oi Oi Oi 19
96 f
ififil 31
/12/
31/0
1/
29/0
2/
31/0
3/
30/0
4/
31/0
5/
30/0
6/
31/0
7/
31/0
8/
30/0
9/
31/1
0/
30/1
1/
31/1
2/
The population of//, armisera peaked in the month of November with an average of approximately 6 moths per week whereas H. punctisera peaked in October with approximately 0.75 moths per week.
85

Figures 89 and 90 show the weekly collections for moths of Helicoverpa armisera and H. punctigera for the year 1996 at Home Hill. Also each graph shows a line for the monthly average.
Figure 89.
?*5 -,
H. armigera - Home Hill 1996
?*5 -,
^^m Weekly Totals —•— Monthly Average
?*5 -,
30 -25 20
15- A j 10 - • M' k j ^ ^ \ 5 0
u c c
«^L^/df L iTTi i \ j 5 0
u c c
-9661 1996
-
19
9C
-
1996
-
1996
- <
1996
- <
1996
-
1996
-
1996
-
CD CO CD Oi Oi Oi Oi Oi Oi
c T 0 31
/01/
29/0
2/
31/U
3/
30/0
4/
31/0
5/
30/0
6/
31/0
7/
31/0
8/
30/0
9/
31/1
0/
30/1
1/
31/1
2/
Figure 90.
H. punctigera • Home HUM996
Rn
HSBI Weekly Totals —•— Monthly Average
Rn 70
1
1 1
60 - j 50 . 40 i
30 ! . 20 | y^ 10 '
n . ~ / / V J
C
1995
1996
CD C35 O
CD CO CO Oi Oi Oi Oi Oi Oi
CO CD CD CD Oi Oi Oi Oi Oi Oi Oi Oi
CD CI <J> C O) C
3 CD n o>
31/1
2/
31/0
1/
29/0
2/
31/0
3/
30/0
4/
31/0
5/
30/0
6/
31/0
7/
31/0
8/
30/0
9/
31/1
0/
31/1
2/
The population of if. armisera peaked in the month of September with an average of approximately 13 moths per week whereas H. punctigera peaked in November with approximately 25 moths per week.
86

Figures 91 and 92 show the weekly collections for moths of Helicoverpa armisera and H. punctisera for the year 1996 at Gumlu C. Also each graph shows a line for the monthly average.
Figure 91.
H. armigera - Gumlu C 1996
• m Weekly Totals —•— Monthly Average
45 40
I
35 30 25 20 15 v « X^\ 10 5 : itTli \ * -vttlT INI,..! >lj c
99
5-
CO o 0)
-966 996
99
6-
99
6-
99
6- <
99
6-
996
99
6-
CO CD CD O CD O <J> O) 0>
31/1
2/1
31/0
1/1
29/0
2/1
31/0
3/1
30/0
4/1
31/0
5/1
30/0
6/1
31/0
7/1
31/0
8/1
30/0
9/1
31/1
0/'
30/1
1/1
31/1
2/"
Figure 92.
h 1. punctigera - Gumlu C 1996
1Rf)
h
1Rf)
h
1Rf)
h
150 j
120
90 -! i
60 -! ; 30 -| 1
1
0 4 1 L —M •v r 0 4 1 L —M •v r
1995
9661. 1996
CD CO CO CD CD CD CD Oi 03 O) G> O) CD G> G> G> O) O O G> O) 19
96
cc a a 19
96
31/1
2/
31/0
1/
29/0
2/
31/0
3/
30/0
4/
31/0
5/
30/0
6/
31/0
7/
31/0
8/
30/0
9/
31/1
0/
c c 31
/12/
The population ofH. armisera peaked in the month of May with an average of approximately 15 moths per week again in November with an average of approximately 15 whereas H. punctisera peaked in November with approximately 35 moths per week.
87

Figures 93 and 94 show the weekly collections for moths of Helicoverpa armisera and H. punctisera for the year 1996 at Gumlu Z. Also each graph shows a line for the monthly average.
Figure 93.
40 35 30 25 20 15 10 5 0
i n
H. armigera - Gumlu Z1996
I Weekly Totals - Monthly Average
/
h\ CO CD
CD g
CO CM
CD
O
CO O
CD
O
CO
en <D CO OJ <3> en en
• * l O CD
g o g o ?s O CO CO CO
o
CO
OJ
55 o
CO O) <J>
55 o S CO
CO CO CO O C3> OS 0> C3> G>
CNl
O CO
Figure 94.
200 180 160 140 120 100 80 60 40 20 0
io en O)
H. punctigera - Gumlu Z1996
I Weekly Totals - Monthly Average
CO
05
g CO
CO
en
?3 o
CD CO en en a> en
CO
o o
CO CO o o en ro
in o CD
o
CO c» en
o T- O CO CO
^U^i fc^J CD CD CD CO CO en en o o> • o> en en en o> en
co en o g ?= o co co
o 1-
The population of H. armisera peaked in the month of November with an average of approximately 24 moths per week though populations were present from July. The H. punctisera peaked in November with approximately 40 moths per week.
During the year 1996 the heliothis populations numbers were much lower than the previous year. Also the number of punctigera were more uniform throughout the districts though approximately 1 month later than previous years.
88

Figures 95 and 96 show the weekly collections for moths of Helicoverpa armisera and H. punctigera for the year 1997 at Ayr. Also each graph shows a line for the monthly average.
Figure 95.
1 6
1 4 -•
12 -
1 0
8 + 6 4 2-[ 0
to
si
H. armigera - Ayr 1997
I W e e k l y Totals • Monthly A v e r a g e
l li * *~T**~~T°-+-
]/\
en o> a>
Si o 55 CM
1 ^ o
co o
o> a>
o 3 co
h l - 4 - I • >
a> en
o co
o> O)
S3
Figure 96.
H. punctigera - Ayr 1997
I Weekly Totals - Monthly Average
6 -.—
4 .:
3-I
2-i 1 i I thJ iw^dfe^J^
0 5 0 > a > o > 0 5 0 5 c n c n c n a ) C » c » o > o > 0 ) o o o > o > a > o > o > C 3 > o > o > o >
co o
T- 00 CO CM
o o co
in p to o o co o
fa o co
The population of H. armisera peaked in the month of August with an average of approximately 6 moths per week whereas H. punctisera populations were present for most of the year with approximately 1 moth per week.
89

Figures 97 and 98 show the weekly collections for moths of Helicoverpa armisera and H. punctigera for the year 1997 at Brandon. Also each graph shows a line for the monthly average.
Figure 97.
35 30 25 20 -15 10 -
H. armigera - Brandon 1997
I Weekly Totals • Monthly Average
jZjp=s, CD CD O
CD CD
Iv, CD CD
eg o co C\J
^w-rftTf rlifiK IV. CD CD
tv CD CD
CD O CO
I tv, CD CD
cS C3 O CO
fv, CD CD
p
s i
IV. CD CD
55 o o CO
|v. CD CD
|v . CD CD
O i -
O CO
|v. CD CD
Figure 98.
r -I. punctigera - Brandon 1997
A R
r
H H M Weekly Totals —•—Monthly Average
A R
r
4 -3.5
3 : 1
2.5 •- 1
2 ! , 1.5 * s' < 1
1 0.5
o I. / - V . . y II N I 1 ^
1 1
j CD h- f v |v. |v. |v. |v. |v. |v. |v. I V . I V . | v -CD CD CD 35 CD CD CD CD CD CD CD CD CD CD CD CD CD CD CD CD CD CD CD CD CD CD
CM CM n -* to co N- co co o CM T— O O 3 O O O O O O i—
00 T - O t - O T - T " O o co CO CM CO CO CO CO CO CO CO CO co CO
The population ofH. armisera peaked in the month of August with an average of approximately 8 moths per week whereas H. punctieera peaked in February with approximately 1 moth per week and again in August with approximately 1 moth per week.
90

Figures 99 and 100 show the weekly collections for moths of Helicoverpa armisera and H. punctigera for the year 1997 at Home Hill. Also each graph shows a line for the monthly average.
Figure 99.
70 - r — 60 -'
H. armigera - Home Hill 1997
70 - r — 60 -'
j ^ M Weekly Totals —•— Monthly Average
70 - r — 60 -' 70 - r — 60 -' 1
50 -! 40 -j * 30 -! 20 - vf'tl
1 1
10- ' —rf—s—. ritTi 111 i . L9
66l
3 -Z661
cn en
* . r~- i-- h- N . t>- r«-3) en en en en en en 3> en en en en en en 19
97-
1997
- <
19
97
-
31/1
2/
31/0
1/
28/0
2/
30/0
4/
31/0
5/
30/0
6/
31/0
7/
31/0
8/
30/0
9/
31/1
0/
30/1
1/
31/1
2/
Figure 100.
H. punctigera -Home Hill 1997
1A
^ m Weekly Totals i Average
1A
^ m Weekly Totals i Average
1A
12 I I
10 -8 | 6 1
4 2 0
CI c c 19
97
/
1997
1
1 1 1 1
r--Oi
4 2 0
CI c c
1 1
1997
/
1997
1
1 1 1 1
r--Oi
4 2 0
CI c c n en n en 1
99
7-
N- N- N-Oi O O) G> <J> O)
Z66L
-Z661
- Z66i 19
97
1997
/
1997
1
1 1 1 1
r--Oi
31/1
2/
31/0
1/
28/0
2/
31/0
3/
30/0
4/
31/0
5/
30/0
6/
31/0
7/
31/0
8/
30/0
9/
31/1
0/
30/1
1/
31/1
2/
The population of H. armisera peaked in the month of August with an average of approximately 35 moths per week whereas H. punctisera peaked in August and September with approximately 4 moths per week.
91

Figures 101 and 102 show the weekly collections for moths of Helicoverpa armisera and H. punctigera for the year 1997 at Gumlu C. Also each graph shows a line for the monthly average.
Figure 101.
100
H. armigera -Gumlu C 1997
I Weekly Totals • Monthly Average
Figure 102.
H. punctigera - Gumlu C 1997
| Weekly Totals • Monthly Average
60
50
40
30
20
10
0 *. I i I \ > . «• _. co co CD
CD CD
T 1 c\j o o ^ oo co c\j
CD CD
a> CD
o o co
8 I
CD CD
CO CO
O
f -CD CD
c5 o
CD CD
CD CD
CD CD
1^-CD CO
5
The population of//, armisera peaked in the month of August with an average of approximately 60 moths per week though there were populations present from April until November. The H. punctigera peaked in April with approximately 20 moths per week.
92

Figures 103 and 104 show the weekly collections for moths of Helicoverpa armieera and H. punctigera for the year 1997 at Gumlu Z. Also each graph shows a line for the monthly average.
Figure 103.
H. armigera - Gumlu Z1997
^ M i Weekly Totals —•— Monthly Average
on 80 70 -60 -50 40 A. 30 s K 20 10 I f t - r « »i i i. . * n r M 1 i l l -W-—
C O r ~ r ~ r ^ l - - t ^ - l ^ r ^ h - r ~ i^ r~ r-o> en en en en en en o> en en en en cn en en en en en en en en en en CO en en
?3 - i - CN CO • * lO CD h . 0 O O > o ? S3 T - O O O O O O O O O T — C ~ T - T - O O T - O T - O T - T - O T— o
T— CO CO 0>J CO CO CO CO C O C O C O CO CO CO
Figure 104.
I HI. punctigera - Gumlu Z1997
ftn
I
^ ^ H Weekly Totals —•— Monthly Average
ftn
I
70 -! I 60 { ! 50 - i
40 | 30 20 ! 10 n . Iftt. * . *. J . , . _^ . . / I !
1 1 V . •»• . - i •»• i i
996
997
997
— N . r» r- (-- r«- t~-3> en en en en en en 3> en en en en en en 99
7
997
997
31/1
2/'
31/0
1/'
28/0
2/1
30/0
4/1
31/0
5/1
30/0
6/1
31/0
7/1
31/0
8/1
30/0
9/1
31/1
0/1
30/1
1/1
31/1
2/1
The population of//, armigera peaked in the month of August with an average of approximately 40 moths per week whereas H. punctisera peaked in August with approximately 15 moths per week.
During 1997 the populations were low in the Ayr / Brandon areas but were higher in the Home Hill and Gumlu areas. The presence of//, punctisera throughout the year was unusual.
93

Aphid and Thrips
Figures 105 and 106 show the weekly collections of Aphids and Thrips taken at the water trap for the year 1994 at Ayr Research Station. Also each graph shows a line for the monthly average.
Figure 105.
12-r-
10 -
8^
6 -
4 -
2
0 -
Aphids-Ayr 1994
I Weekly Totals - Monthly Average
I! I CO • * •* •<fr • * • * • * •* • * • * •* • * •* CD CD o> CD CD CD CD CD CD O ) CD CD O) CD CD CD CD CD CD CD CD CD CJ> CD CD OJ
Si J ; CM Si CO •St- lO CD h- co O) o r - CM
O g o o g g g o g V -
-~-T -
oo c5 T— o T -
o o T —
co CO CM CO CO co co CO co co CO co CO
Figure 106.
Thrips-Ayr 1994
msam Weekly Totals —•— Monthly Average
45 40 35 30 25 20 15 10 5 0
0 C
c
c T
o
r
•
A T> /1>—~u CD CD
O
T— CO
CD CD
O CO
i
1
CD CD
CM
CO
45 40 35 30 25 20 15 10 5 0
0 C
c
c T
o
0 D D
M
0 31/0
1/19
94
28/0
2/19
94
30/0
4/19
94
31/0
5/19
94
30/0
6/19
94 <
31/0
7/19
94
31/0
8/19
94
30/0
9/19
94 /1>—~u
CD CD
O
T— CO
CD CD
O CO
i
1
CD CD
CM
CO
The population of Aphids peaked in the month of August with an average of approximately 4 aphids per week whereas Thrips peaked in August with approximately 17 thrips per week.
94

Figures 107 and 108 show the weekly collections of Aphids and Thrips taken at the water trap for the year 1994 at Brandon. Also each graph shows a line for the monthly average.
Figure 107.
3.5 3
2.5 2
1.5 1
0.5 0
CO CO
en
Aphids - Brandon 1994
I Weekly Total • Monthly Average
N lttv.
en en
en o>
en en
g g •< - o o CO CM
en en
p
co CO
In p
1 1
en en s: o
• * S 3 o> en en o> en en
en o
i - O co co
oo o ?= o T= co oo co
co
o co
CO CO
Figure 108.
1
Thrips - Brandon 1994
60
1
^ ^ H Weekly Totals —•— Monthly Average
60
1
50 -
4 0 -
30 -
20
10-
0 - 1
K
^ > T — - ^ ~U 0 c c
c
C
0 0
3
0 31/0
1/19
94 -
28/0
2/19
94
30/0
4/19
94 -
31/0
5/19
94
30
/06
/19
94
- <
31
/07
/19
94
-
31/0
8/19
94 -
30
/09
/19
94
-
31
/10
/19
94
-
30/1
1/1
994-
c o
c>
t > >
J
>
The population of Aphids peaked in the month of July with an average of approximately 2 aphids per week whereas Thrips peaked in August with approximately 18 thrips per week.
95

Figures 109 and 110 show the weekly collections of Aphids and Thrips taken at the water trap for the year 1994 at Clare. Also each graph shows a line for the monthly average.
Figure 109.
V) -,
Aphids -Clare 1994
V) -,
• i Weekly Totals • - Monthly Average
V) -,
25 -I
20 - 1
15-
10 * * L
5
0 0
„\\ ~ * ^ *-t—1 J.
5
0 0 o • * • * * •* • * • * • * • * • * • * •a- • *
c > CD CD T) o> Ol o> CD CD CD c a a> CD ( 3) o> en CD CD co a> CD CD CD
c M T - Si i •o ^ to CO s: 55 35 0 5 Si o o < O O o CD 0 0 5 T - J ; T -
_ T - CO t— O T — O f T- O V — 0 T—
c O CO CM *J CO CO co co co co CO co CO
Figur 3 110.
35-30
Thrips • Clare 1994
35-30
B Weekly Tota - Monthly Average
35-30
B Weekly Tota - Monthly Average
35-30 35-30
1
25 -20
15 10 5 0
c
.
• > * - * f
\
1 w WrT
15 10 5 0
c 0 • * • > * - * f •* •* • * • * • * • * • * i - •* c 0 CD CT> » CD en CD CD CD CJ> CD CD CD c D en CD J> o> CD CD CD CD CD CD CD CD
£ si ^ Si • * > •* m CO 1^- CO CD 0 CM
* o o o 5 o O g 0 g r - 1 ; T ~
— x— 00 O v- O T - •<- 0 T— 0 y —
c O CO CM •*> co CO CO CO CO CO CO CO CO
The population of Aphids peaked in the month of August with an average of approximately 9 aphids per week whereas Thrips peaked in August with approximately 15 thrips per week.
96

Figures 111 and 112 show the weekly collections of Aphids and Thrips taken at the water trap for the year 1994 at Home Hill. Also each graph shows a line for the monthly average.
Figure 111.
16 -14 -12 -10 -8 6-4 -2 0 -,
CO CO en
Aphids-Home Hill 1994
I Weekly Totals • Monthly Average
yCiilLffrt^ ._ CO
o
•<*•
CD CD
^ S3 o o ?= o5 CO CN
en co
co o
co co
g o co
1 1
•* •* •>* 2t 5t 3C co co co o> o> co CD CO CO CO CO CO
CD g o co
1-o co
o
CD O
O T-
CD CD
Si
Figure 112.
Thrips-Home Hill 1994
A(\
^ ^ B Weekly Totals —•— Monthly Average
A(\
35 \ 30 . 25 - }s I 20 / V
15 / X 10 / \ L 1 5 / >-4 n .r . , J , 1 1 Ti T c
99
3-
99
4-
99
4-
99
4-
99
4-
99
4- <
994
99
4-
99
4-
CD CD
CD CD 9
94
-
31/1
2/'
31/0
1/'
28/0
2/'
30/0
4/1
31/0
5/1
30/0
6/1
31/0
7/1
31/0
8/1
30/0
9/1
31/1
0/1
30/1
1/1
31/1
2/'
The population of Aphids peaked in the month of August / September with an average of approximately 5 aphids per week whereas Thrips peaked in August with approximately 25 thrips per week.
During 1994 the aphid populations were active around the May to August period while thrip populations were present around the August period. Numbers were similar at all sites.
97

Figures 113 and 114 show the weekly collections of Aphids and Thrips taken at the water trap for the year 1995 at Ayr. Also each graph shows a line for the monthly average.
Figure 113.
4.5 4 -)
3.5 3
2.5-1 2
1.5 1
0.5
Aphids-Ayr 1995
I Weekly Totals • Monthly Average
..^rHlirr^-nnw^ ^- LO to m CD CD CD CD CD CD CD CD
Si ^ ft o o ?= & CO CM
co p
m en a>
5= o —. o co
in en en
iS o
• • I -in m in m io m en en en en en en en en en en en en
co o 5 co
o co o
co g o co
in en en
ft o co
Figure 114.
Thrips• • Ayr 1995
a
— m Weekly Totals —•— Monthly Average
a
5-1
4 i
3 1
2-L 1 1
11 0 -,- *""C _ J - _ _ - l _ ^ U - 1 11 0 -,- *""C
^ ^ i ! • _ - l _ ^ U -
'
1994
1995
1995
n in m T> en c» » CD CD
tn in to m CD CD CD CD CD CD CD CD 19
95 9661 19
95
31/1
2/
31/0
1/
28/0
2/
0 l
/UO
/
30/0
4/
31/0
5/
30/0
6/
31/0
7/
31/0
8/
30/0
9/
31/1
0/
30/1
1/
31/1
2/
The population of Aphids peaked in the month of May with an average of approximately 1.5 aphids per week though there were populations present from April to October. The thrips peaked in February with approximately 1 thrip per week.
98

Figures 115 and 116 show the weekly collections of Aphids and Thrips taken at the water trap for the year 1995 at Brandon. Also each graph shows a line for the monthly average.
Figure 115.
7 -6 -
Aphids - Brandon 1995
7 -6 -
• • • W e e k l y Totals —•— Monthly Average
7 -6 -7 -6 -5 -4 -
3 -2 1 _^KiTiY N Ji
19
94
-
19
95
- V i W V 1 •--- i W-"—i~ m m m m m m m m Oi Oi Oi Oi Oi Oi Oi Oi Oi Oi Oi Oi Oi Oi Oi Oi
<
1995
-966t 1995
-
31/1
2/
31/0
1/
28/0
2/
31/0
3/
30/0
4/
31/0
5/
30/0
6/
31/0
7/
31/0
8/
30/0
9/
31/1
0/
30/1
1/
31/1
2/
Figure 116.
Thrips -Brandon 1995
7 0 - r
60 -7 0 - r
60 -7 0 - r
60 -7 0 - r
60 -50 -' 40 -j , 30 -20 -10 - f 0 A a—£f f • >» I . J — • — r z ' i T * — » . . *. . . ^ . ,
• * m en en en en
in en en
-9661
• -9661
-9661
-9661
-9661
-9661
in en en 1
99
5-
IT) en en
31/1
2/
31/0
1/
28/0
2/
31 IU
.il
30/0
4/
31/0
5/
30/0
6/
31/0
7/
31/0
8/
30/0
9/
31/1
0/
30/1
1/
31/1
2/
The population of Aphids peaked in the month of September with an average of approximately 2.7 aphids per week whereas Thrips peaked in April with approximately 17 thrips per week.
99
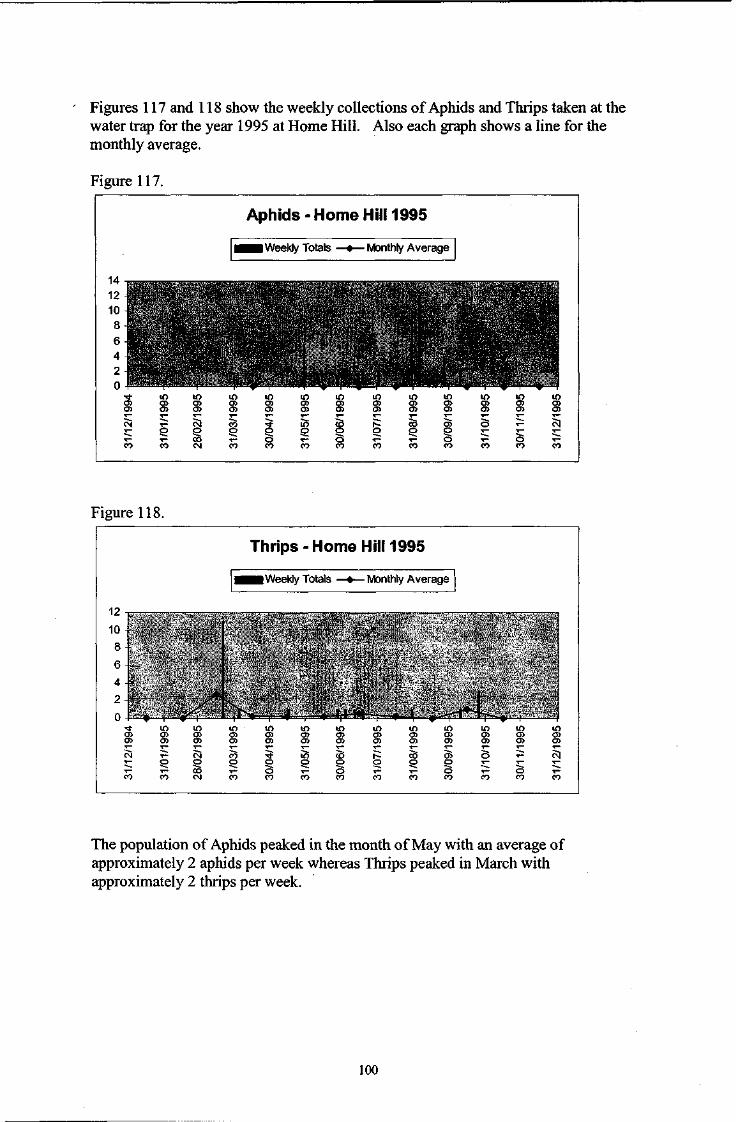
Figures 117 and 118 show the weekly collections of Aphids and Thrips taken at the water trap for the year 1995 at Home Hill. Also each graph shows a line for the monthly average.
Figure 117.
14 12
Aphids-Home Hill 1995
14 12
I ^ H Weekly Totals —•— Monthly Average
14 12 14 12 10 8
6 I 4 - I 1 2 0-, -
en
^ ^ T ^ - l 1, m 1 . J . •41 in en en
1- 9661
<>
--96
61
2 0-, -
en lO en en
i
m en en
n m m m in in in Ji O) 0> Oi O) Ol O Ji O 0> O O) O) O
in en en
1- 9661
<>
--96
61
31/1
2/
31/0
1/
28/0
2/
31/0
3/
30/0
4/
31/0
5/
30/0
6/
31/0
7/
31/0
8/
30/0
9/
31/1
0/
30/1
1/
31/1
2/
Figure 118.
12-
10 -
Thrips-Home Hill 1995
12-
10 -
O B I Weekly Totals —•— Monthly Average
12-
10 -
12-
10 -'
8 -
6 - 1
4 - * 2 - . .X i
c c
<
1995
< 19
95
1995
|
1995
,
1995
-
1995
-1
1995-
1995
<
1995
1995
"
<
1995
1995
-
c
0 31/0
1/
28/0
2/
31/0
3/
30/0
4/
31/0
5/
30/0
6/
31/0
7/
31/0
8/
30/0
9/
31/1
0/
30/1
1/
31/1
2/
The population of Aphids peaked in the month of May with an average of approximately 2 aphids per week whereas Thrips peaked in March with approximately 2 thrips per week.
100

Figures 119 and 120 show the weekly collections of Aphids and Thrips taken at the water trap for the year 1995 at Gumlu C. Also each graph shows a line for the monthly average.
Figure 119.
Aphids - Gumlu C 1995
fin
fUm Weekly Totals —•— Monthly Average
fin
50 -
40 -
30
20 - \ I t
10 . . ^ 1 I V s. , J c 1
99
4-
m en en
< 1
99
5- < 9661.
-9661
-9661
-9661
•9661
> •9661 > Q
fifiL
<
19
95
- <
19
95
- -9661
31/1
2/
31/0
1/
28/0
2/
31 /U
o7
30/0
4/
31/0
5/
30/0
6/
31/0
7/
31/0
8/
30/0
9/
31/1
0/
30/1
1/
31/1
2/
Figure 120.
Thrips -Gumlu C 1995
4*1
i — W e e k l y Totals —•— Monthly Average
4*1
40 -' 35-i-30 - ( 2 5 -20 -15- 1
10-5-t 0 ' •"1 lT\tr i l l r r r ^ - ~- ^ ^ A .
1
994
995 in m in in in m m in
C D O i C D C O O i C D O C D O > O > C 0 O > C D O) CD CD 99
5
995
995
31/1
2/'
31/0
1/1
28/0
2/1
31/0
3/1
30/0
4/1
31/0
5/1
30/0
6/1
31/0
7/1
31/0
8/1
30/0
9/1
31/1
0/1
30/1
1/1
31/1
2/1
The population of Aphids peaked in the month of September with an average of approximately 15 aphids per week whereas Thrips peaked in March and May with approximately 10 thrips per week.
101

Figures 121 and 122 show the weekly collections of Aphids and Thrips taken at the water trap for the year 1995 at Gumlu Z. Also each graph shows a line for the monthly average.
Figure 121.
Aphids - Gumlu Z1995
RC\
• ^ • W e e k l y Totals —•— Monthly Average
RC\
70 60 50 4 0 -30 20 I 10- .^--^-L. . .^* "it r
99
4- -9
66
m i o m i o m m i o i o O) & o> o> o> a> o> o> 0 ) C > 0 ) 0 > 0 > 0 ) 0 ) 0
-96
6 99
5-
99
5-
31/1
2/1
31/0
1/1
28/0
2/1
31/0
3/1
30/0
4/1
31/0
5/1
30/0
6/1
31/0
7/1
31/0
8/1
30/0
9/1
31/1
0/1
30/1
1/1
31/1
2/1
Figure 122.
* * • _ • ^ T
m en C3>
C M
o oo CNJ
Thrips - Gumlu Z1995 3
0/1
1/1
99
5-
i i
1
i i
in en o>
CM
co
* * • _ • ^ T
m en C3>
C M
o oo CNJ
• • • W e e k l y Totals —•— Monthly Average
30
/11
/19
95
-
i i
1
i i
in en o>
CM
co
200 180 160 140 120 100 80 60 40 20
0
c c c T
c
•
* * • _ • ^ T
m en C3>
C M
o oo CNJ
30
/11
/19
95
-
i i
1
i i
in en o>
CM
co
200 180 160 140 120 100 80 60 40 20
0
c c c T
c
t > n
M
•3 31
/01
/19
95
- * * • _ • ^ T
m en C3>
C M
o oo CNJ
31/0
3/1
995-
30
/04
/19
95
-
31
/05
/19
95
-
30/0
6/19
95 - <
31/0
7/19
95 <
31
/08
/19
95
- *
30
/09
/19
95
-
31
/10
/19
95
-
30
/11
/19
95
-
i i
1
i i
in en o>
CM
co
The population of Aphids peaked in the month of August and September with an average of approximately 10 aphids per week whereas Thrips peaked in March with approximately 40 thrips per week.
During 1995 the population of aphids was slightly higher than the previous year with higher populations in the Gumlu district than in the Burdekin district. There were little differences between the thrip populations for the two years at all sites.
102

Figures 123 and 124 show the weekly collections of Aphids and Thrips taken at the water trap for the year 1996 at Ayr. Also each graph shows a line for the monthly average.
Figure 123.
Aphids-Ayr 1996
o
H M Weekly Totals —•— Monthly Average
o
8 -7 6 -5 -4 -3 -2 1 -n . I T T 4 + ^ _ . A 41 c
1995
-1
9661 1996
1996
1996
19
96
-
19
96
- <
19
96
- <
19
96
- <
19
96
- -9661 19
96
-
19
96
-
31/1
2/
31/0
1/
29/0
2/
31/0
3/
30/0
4/
31/0
5/
30/0
6/
31/0
7/
31/0
8/
30/0
9/
31/1
0/
30/1
1/
31/1
2/
Figure 124.
1.2 -
Thrips - Ayr 1996
1.2 -
— i Weekly Totals —•— Monthly Average
1.2 -
1 -
0.8-
0.6-
0.4 - \ 0.2-
n \ . ^*~~ \ - s* c
19
95
-
CO co co
co co co co co en
CO CD co co en co
CO CO CO CO CD CO CO CO
co co co co
CO CO CO
co co co co CD CO
31/1
2/
g CO
CM CO
g g CM CO
g g o ?= CO CO
CO 1^- CO CD
§ 2 S 9 O ^ T^ O CO CO CO CO
o
co o ^ CO CO
The population of Aphids peaked in the month of March with an average of approximately 1.5 aphids per week whereas Thrips peaked in March and August with approximately 0.3 thrips per week.
103

Figures 125 and 126 show the weekly collections of Aphids and Thrips taken at the water trap for the year 1996 at Brandon. Also each graph shows a line for the monthly average.
Figure 125.
Aphids - Brandon 1996
°
• • •Weekly Totals —•—Monthly Average
° 2
1.5
1 1 0.5
n . V *\ V . . . S - . c
1995
1996
-
1996
-
CD CD CD CD CD CD CD G) Gi G> G> G> G) Gi O G> G) O G) G> G>
<
1996
1996
4 19
96-
31/1
2/
31/0
1/
29/0
2/
31/0
3/
30/0
4/
31/0
5/
30/0
6/
31/0
7/
31/0
8/
30/0
9/
31/1
0/
30/1
1/
31/1
2/
Figure 126.
6 -
Thrips - Brandon 1996
6 -
— Weekly Totals —*— Monthly Average
6 -
5-4 -
3 - 1 2 1 1 J 1 - J / -th T~" r\ - - - * - 4 - — x ^ M i i
D n n
C
1995
-
CD en en 19
96-
O CD CD t o CD CD CD 3> en cn cn en en cn 3> en en en en en en
CD en en 19
96-
D n n
31/1
2/
31/0
1/
29/0
2/
a 1/
03/
30/0
4/
31/0
5/
30/0
6/
31/0
7/
31/0
8/
30/0
9/
31/1
0/
30/1
1/
M
0
The population of Aphids peaked in the month of May and again in November with an average of approximately 0.7 aphids per week whereas Thrips peaked in November with approximately 1 thrips per week.
104

Figures 127 and 128 show the weekly collections of Aphids and Thrips taken at the water trap for the year 1996 at Home Hill. Also each graph shows a line for the monthly average.
Figure 127.
Aphids-Home Hill 1996
Q
H B Weekly Totals —•— Monthly Average
Q
7 f
6-5 4 -3 2 1 -n ,A V . ^^ -9661
3
19
96
-
19
96
-
I 5 C O C O C O C D C D C O C O 35 05 0 5 0 5 0 5 0 5 0 5 05 3 5 0 5 0 5 O 5 0 5 O 5 G 5 0 5
<
1996
-
19
96
-
31/1
2/
31/0
1/
29/0
2/
31/U
3/
30/0
4/
31/0
5/
30/0
6/
31/0
7/
31/0
8/
31/1
0/
30/1
1/
31/1
2/
Figure 128.
Thrips-Home Hill 1996
^ s -^ s -^ s -3
I 1
2.5 2
1.5 1
0.5-
1 1.5 1
0.5- ^K K '
0 - * . * — — • * I 1 N
1995
1996
1996
C D C O C D C O C D C D C D C O
o > o > C D C 3 > o > a i o > a > 1996
1996
31/1
2/
31/0
1/
29/0
2/
31/0
3/
30/0
4/
31/0
5/
30/0
6/
31/0
7/
31/0
8/
30/0
9/
31/1
0/
30/1
1/
31/1
2/
The population of Aphids peaked in the month of May with an average of approximately 2 aphids per week whereas Thrips peaked in October with approximately 1 thrips per week.
105

Figures 129 and 130 show the weekly collections of Aphids and Thrips taken at the water trap for the year 1996 at Gumlu C. Also each graph shows a line for the monthly average.
Figure 129.
3.5-3
2.5
2
1.5 1
0.5 0
u c c
c
0
Aphids -Gumlu C 1996
3.5-3
2.5
2
1.5 1
0.5 0
u c c
c
0
• • •Weekly Totals —•—Monthly Average
3.5-3
2.5
2
1.5 1
0.5 0
u c c
c
0
3.5-3
2.5
2
1.5 1
0.5 0
u c c
c
0
l\ ^ *. -+~-\ A . A A
3.5-3
2.5
2
1.5 1
0.5 0
u c c
c
0 31/0
1/1
996-
29/0
2/19
96 -
31/0
3/19
96 -
30/0
4/19
96 - <
31
/05
/19
96
- <
30/0
6/1
996- <
31/0
7/1
996-
31/0
8/1
996- <
30/0
9/19
96 - <
31/1
0/1
996- <
30
/11
/19
96
- <
31/1
2/19
96
Figure 130.
8
Thrips -Gumlu C 1996
8
USUI Weekly Totals —•—Monthly Average
8 7 6 5 4 3 2 1 0 , v i v i K «4-Wh
T V I T 1 fc**r*
1995
co (35
CO o>
D CO CO CO CD CO CO 35 05 Oi G> Oi 0> Oi 35 Q5 <3> 0 5 05 <3> G5
D CO CD 35 O) O) 35 05 05
31/1
2/
o CO
CM ( 9 ! 35 CVJ 30
/04/
31/0
5/
30/0
6/
31/0
7/
31/0
8/
30/0
9/
3 v - CM
? O ^ •o co co
The population of Aphids peaked in the month of April with an average of approximately 1 aphid per week whereas Thrips peaked in June and October with approximately 1-1.5 thrips per week.
106

Figures 131 and 132 show the weekly collections of Aphids and Thrips taken at the water trap for the year 1996 at Gumlu Z. Also each graph shows a line for the monthly average.
Figure 131.
Aphids - Gumlu Z1996
• • • W e e k l y Totals — •— Monthly Average
1 1 0.9- I 0.8 0.7 - I 0.6 -0.5- I 0.4 - •
0.3 - I 0.2- I
0.1 -n .
CO CD CD CD CO CD CD CO CD CD CD CO CO
co co o> o> CD en a> co o> CJ> OS C5 O C3> CD 0> Oi CO OJ
Si CNi CM T - Si CO • * CO CD t ^ 00 CO o T - CNi o o O O O O O O O T - T —
c> T - O T - O t - T - O o ^ CO CO CM co co co co co co co CO CO CO
Figure 132.
Thrips- Gumlu Z1996
1?
i ^ B Weekly Totals —•— Monthly Average
1?
10 - I
8 -1
1
6- , . 4 -
1
2 n . f\.-W . . . c
19
95
- -9661.
CD CI o> a co a
3 CD CD CD CD CD CD "> O OT C3> O) O) O) •> O) Oi O) O) O <J>
CO o>
CD CO co
CD CO CO
31/1
2/
31/0
1/
29/0
2/
•31
mil
30/0
4/
31/0
5/
30/0
6/
31/0
7/
31/0
8/
30/0
9/
31/1
0/
30/1
1/
31/1
2/
No populations of aphids were detected during 1996 whereas Thrips peaked in April with approximately 2 thrips per week.
Populations throughout 1996 were generally very low. Most of the aphid activity started around April - May. Thrip populations were very low compared to previous years.
107
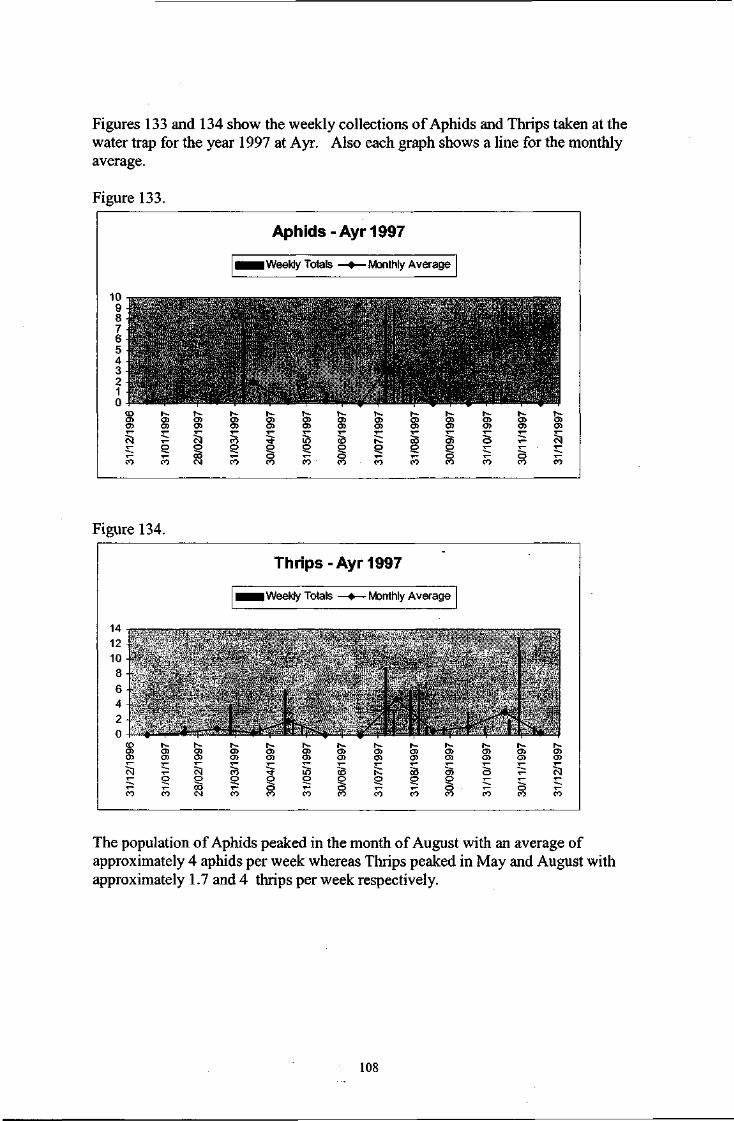
Figures 133 and 134 show the weekly collections of Aphids and Thrips taken at the water trap for the year 1997 at Ayr. Also each graph shows a line for the monthly average.
Figure 133.
Aphids-Ayr 1997
m
• i Weekly Totals —•— Monthly Average
m 9 ! 8 I 7 6 5 4 3 A 2 ^ / \ 1 I >L. i J l \ . —u*-^ , )
CD r~ I ' * •• — i •*• i — i — w — i • • • v v r
N. cn cn o> 7) O O) O) OS O 0> CO CO cn CO CO CO < 33 o> a> o3 <J> o> a OJ cn o> S3 Si S3 c M ' i " a - i o c D r - . o o o > O r - Si
o o o o o o o o o T -
oo — o *•* o T— T— o T" O CO CO CM co co co co co co co CO CO co
Figure 134.
14 12
Thrips-Ayr 1997
14 12
• H I Weekly Totals —•— Monthly Average
14 12 14 12 1
10 i F
8 1
6 i
4 A I
2 0 t*^y rr f.. "fc N* : 2 0 i I - 1 -W I -W 1 i
rr f.. CI c c 19
97
1997
~- h - h>- h - f - h - h~ 35 CO CO CO CO D> CO 35 CO CO CO CO O) CO
Z66L
O CJ> cn co
c
c 31/0
1/
28/0
2/
•o •<}• i n CD N- oo co 5 2 9 2 ° 2 2 ? O T - O ^ ^ O •O CO CO CO CO CO CO 31
/10/
30/1
1/
31/1
2/
The population of Aphids peaked in the month of August with an average of approximately 4 aphids per week whereas Thrips peaked in May and August with approximately 1.7 and 4 thrips per week respectively.
108

Figures 135 and 136 show the weekly collections for flying adults of Aphids and Thrips for the year 1997 at Brandon. Also each graph shows a line for the monthly average.
Figure 135.
Aphids - Brandon 1997
• n Weekly Totals —•— Monthly Average
4 R -4
3.5 3
2.5-2
1.5-1 -
0.5 :+.. / / * W / II r
4 3.5
3 2.5-
2 1.5-
1 -0.5 :+.. /
/ * W / II r • N.
31/1
2/19
96 -
31/0
1/19
97 - <
28/0
2/19
97 - <
31/0
3/19
97 -
30/0
4/19
97 -
31/0
5/19
97 -
30/0
6/1
997- <
31/0
7/19
97 -
31/0
8/19
97 -
30/0
9/19
97 -
31/1
0/19
97 -
30
/11
/19
97
-
31
/10
/1Q
a7
-
> > J
Figure 136.
14 12 10 8
Thrips - Brandon 1997
1 Weekly Totals • Monthly Average
._. •^f l ini t^.xM CD CO CO
CN
— CO
f-co CD
o CO
CO CO
Si g co CM
1^ CO CO
CO
o
1 -CO co
g o co
co CO
o
8
1
i^ I— i— I— r~- t-~ CO CO CO CO CO CO CO CO CO CO CO CO
o CO
o o CO
co co
The population of Aphids peaked in the months of April and August with an average of approximately 2 aphids per week whereas Thrips peaked in April / May and again in September with approximately 5 thrips per week.
109

Figures 137 and 138 show the weekly collections of Aphids and Thrips taken at the water trap for the year 1997 at Home Hill. Also each graph shows a line for the monthly average.
Figure 137.
Aphids-Home Hill 1997
1 9
• • i Weekly Totals —•— Monthly Average
1 9
10 I I |
8
6-
4 2 n *L_^ ^ T t - i ^ i . - 1 & i fc c
1996
- -Z661
o en 19
9/ -
1997
-
1997
-
1997
- <
1997
-
1997
-
1997
-
en en 19
97-
en CO
31/1
2/
31/0
1/
28/0
2/
31/0
3/
30/0
4/
31/0
5/
30/0
6/
31/0
7/
31/0
8/
30/0
9/
31/1
0/
30/1
1/
31/1
2/
Figure 138.
120 -
100 -
80 -
60 -
40 -
20 -.
0-r-CD en en
Thrips-Home Hill 1997
I Weekly Totals —•— Monthly Average
A .. Al^ ^
CM 1 -
en en
CM
5 co CM
en en
co o
en
o co
cn en
i?5 o
en
o o co
en
p
en en
co o
en en
35 5 o co
en en
en en
o co
cn en
The population of Aphids peaked in the month of April with an average of approximately 3 aphids per week whereas Thrips peaked in May with approximately 60 thrips per week.
110

Figures 139 and 140 show the weekly collections of Aphids and Thrips taken at the water trap for the year 1997 at Gumlu C. Also each graph shows a line for the monthly average.
Figure 139.
Aphids - Gumlu C 1997
g
••Weekly Totals • Monthly Average
g
5
4 -
3-
2 V I 1 -
n . A t i W tii K ^ t 4 u ^ _ A A I
< 9
96
- <
99
7- <
99
7-
5 N. i^ r i . h- h-o> o> o> O) a o> 0> O) O) O) O 0>
<
99
7- <
99
7- 4
99
7-
31/1
2/'
31/0
1/1
28/0
2/1
o
O 30/0
4/1
31/0
5/1
30/0
6/1
31/0
7/1
31/0
8/1
30/0
9/1
31/1
0/1
30/1
1/'
31/1
2/'
Figure 140.
Thrips - Gumlu C 1997
I Weekly Totals —•— Monthly Average
18 16 14 12 10 8 6 4 2 0 I fr
ee G> CB T—
Si T— CO
c»
g co
The population of Aphids peaked in the month of May with an average of approximately 1.75 aphids per week whereas Thrips peaked in March and August with approximately 10 thrips per week. The populations were present in three distinct peaks throughout the year.
I l l

Figures 141 and 142 show the weekly collections of Aphids and Thrips taken at the water trap for the year 1997 at Gumlu Z. Also each graph shows a line for the monthly average.
Figure 141.
Aphids - Gumlu Z1997
o tz
H H Weekly Totals —•— Monthly Average
o tz
3 2.5 ->
2
1.5 J 1 -j - A | j
0.5 xj 1 n ^ | fr L _ M. A _ W A A . A
A CD h -en co en en
h - i— i — r* t— i^- ?— r*— o> o > o > o o > a > o ) o O 0> O O) O 0> O) O)
Z661
> <
19
97
- Z661
31/1
2/
31/0
1/
28/0
2/
31/0
3/
30/0
4/
31/0
5/
30/0
6/
31/0
7/
31/0
8/
30/0
9/
31/1
0/
30/1
1/
31/1
2/
Figure 142.
20 18 16 14 12 10 8 6 4 2 0
en co
Thrips-Gumlu Z1997
I Weekly Totals —•— Monthly Average
xkk^^ai t<~ i ^ r*- h - i^- r -CO CO CO CO CO CO CO CO CO CO CO CO
o in o CD
o co o
T- O CO CO
CD
o O r-
The population of Aphids peaked in the month of April with an average of approximately 1 aphid per week whereas Thrips peaked in April and September with approximately 6 thrips per week.
During 1997 the records show that the aphid populations at all sites appear to start around April. The thrip populations were active throughout the year with some high numbers being recorded in May.
112

Parasite.
Figures 143, 144 and 145 show the difference in the percentage parasitism at one site (Brandon) recorded on different crops. Figure 143 is eggs collected off capsicums, Figure 144 eggs off Zucchini and Figure 145 eggs off squash.
Figure 143.
I
o* d5" -%Parasitism
-Av. Temperature
Rainfall
Figure 144.
Figure 145.
§
\ /
/ ^ ^ v ^ of j? • % Parasitism
113

7. DISCUSSION:
The experimental options that were originally to be pursued was to evaluate a number of alternative control options other than the broad-spectrum insecticides. Some of these were to examine the use of fungal diseases in association with oil sprays and reflective mulch for the control of aphids and reducing virus disease incidence in cucurbits. The evaluation of newer pesticides for the control of Heliothis was also to be undertaken. After the first year the direction changed from introducing and evaluating diseases for aphid control to the evaluation of the naturally occurring beneficial insects. Previous research, Kay and Brown (Pers. Comm.) had seen only one instance where the benefits of predators on aphid populations occurred and this was in a trial block of capsicums. Though predators/parasites would not have been ignored in this project it was not thought likely that they would exhibit the extent of control to aphid populations that was seen in the first and subsequent years of this project.
The introduction of fungal diseases for evaluation as a control for aphids had some disadvantages. The first of these was the identification and how best to maintain and increase these populations in the laboratory so that they could be applied to the crops. Another problem would have been that, if the local strains were not virulent the introduction of strains from overseas could have meet import problems. As the natural beneficial insects that occurred in the first trials proved very effective the direction of the research changed to place more emphasis on these. The benefits of using naturally occurring predators/parasites is much higher than trying to introduce them from other areas as the local populations are already well adapted to the local environment.
Control of Heliothis is an ongoing problem not only in vegetable crops but also in field crops. If new projects evaluating control of this pest are to be developed, then they should be evaluated against the other pests in the crops as well if IPM systems are to be developed.
114

8. TECHNOLOGY TRANSFER
1. Information developed from this project was disseminated widely to the QDPI extension officers and crop consultants in the Dry Tropics region and to grower organisations.
2. Grower meetings in Ayr and Bowen were attended regularly and presentations were given outlining the outcomes of the project at that point in time.
3. Results were presented to growers at a field day held in Ayr during November 1996.
4. Reports to the QFVG were made yearly and a presentation to the Vegetable subcommittee was made in 1996, on the developments of the project.
5. Demonstration trials were held on grower properties and on the Departmental Research Station in Ayr to show the outcomes of the research completed.
6. Results from the project are being prepared for publication. At least one publication is to be produced from this work. This will be on the relationship between aphids and beneficial insects, especially the ladybird beetles and aphid parasites.
7. Extension, in the form of advising growers on control options, were conducted on some grower properties to show the benefits of reducing pesticide applications and what this would do to aphid populations.
9. RECOMMENDATIONS:
Control of aphids by predators and or parasites occurred in all years of this project. These beneficial insect populations reduced aphid populations within short periods of time and the aphid populations failed to recover if the crop was left unsprayed. Applications of insecticides to crops affected both aphid and beneficial insect populations and should be discouraged when ever possible. The use of silver reflective mulch has advantages in reducing aphid-transmitted disease in cucurbit crops. The presence of Heliothis in crops is a major problem not only from the damage it causes directly to the crops, but also because of the need to apply insecticides against them and this interferes with the aphid and beneficial insect populations. Alternative controls for this pest should be explored.
A new project looking at control of Heliothis with pesticides that will not disrupt the balance between aphids and beneficial insects should be considered as the final stages before the implementation of an IPM system in capsicum crops.
115

10. ACKNOWLEDGEMENTS:
The support of Mrs. L. Kluckas for encouragement and gaining financial assistance to undertake this project is much appreciated.
The assistance with technical support from Mr. L. Owens, Mrs. D. Galvin and Mrs. C. Owens is much appreciated as well as Mr. S. Boreel who assisted with producing of some of the graphs. The support of Dr. D. Murray and Mr. I. Kay for information on properties and performance of some chemicals that could be useful in trialing against Heliothis, in developing EPM systems, is appreciated.
The staff of the Ayr research Station, who grew and maintained the crops for most of the trials which were undertaken on that station and who also assisted with harvesting of the crops, is appreciated.
Thanks are also extended to the growers who allowed the use of their crops for experimental purposes or demonstration blocks.
The financial support of QFVG and HRDC is gratefully acknowledged.
11. REFERENCES:
Adams D. 1991. Oils Keep Mosaic Virus Diseases at Bay. Amercian vegetable Grower. March: pp 50-52.
Bai B and Smith S. M. 1993. Effect of host availability on reproduction and survival of the parasitoid wasp Trichogramma minutum. Ecological Entomology 18: pp 279-286.
Basky Z. and Nasser M. A. 1989. The Activity of Virus Vector Aphids on Cucumbers. Agriculture, Ecosystems and Environmental. 25: pp 337-342.
Daane K. M., Yokota G. Y., Rasmussen Y. D., Zheng Y. and Hagen K. S. 1993. Effectiveness of leafhopper control varies with lacewing release methods. California Agriculture, Nov.-Dec: pp 19-23.
Kay I. R. and Brown J. D. 1990. Insecticidal Control of Aphids on Capsicums. Final Report Project Ent/03R/100d.
Monsour C. and Teakle B. 1995. MVP: A novel Bt with improved field persistence. The Australian Cottongrower. Sept.- Oct. pp 33- 34
Pickett J. A., Wadhams L. J. and Woodcock C. A. 1992. The Chemical Ecology of Aphids. Annu. Rev. Entomol. 37: 67-90.
116

Pinese B. 1987. Reflective mulches and mineral oil/aphicide combinations for control of watermelon mosaic virus in cucurbits. Proceedings Tropical Entomology Workshop.
Qureshi Z. A., Ahmad N. and Hussain T. 1993. Pheromone trap catches as a means of predicting damage by pink bollworm larvae in cotton. Crop Protection Vol. 12, No. 8: pp 597 - 600.
Reuter L. L., Toscano N. C. and Perring T. M. 1993. Modification of Feeding Behaviour of Myzus persicae (Homoptera: Aphididae) by Selected Compounds. Entomological Society of America. Vol. 22, no 5: pp 915-919.
Sewell G. H., Storch R. H., Manzer F. E. and Forsythe H. Y. Jr. 1990. The Relationship Between CoccineUids and Aphids in the Spread of Potato Leafroll Virus in a greenhouse. American potato Journal. Vol 67: pp865-868
Seymour J., Foster J. and Brough E. 1994. Use of Trichogramma as a Biocontrol Agent in Australia. Workshop Report, CRC Tropical Pest Management.
Zalucki M. P., Daglish G., Firempong S. and Twine P. 1986. The Biology and Ecology of Heliothis armigera (Hubner) and H. punctigera Wallengren (Lepidoptera: Noctuidae) in Australia: What do we know? Aust. J. Zool. 34, 779-814.
117