Embed Size (px)
Citation preview
Vertex2002 pCT: Hartmut F.-W. Sadrozinski , SCIPP
SCIPPSCIPP
Initial Studies in Proton Computed Tomography
L. R. Johnson, B. Keeney, G. Ross, H. F.-W. Sadrozinski, A. Seiden, D.C. Williams, L. Zhang
Santa Cruz Institute for Particle Physics, UC Santa Cruz, CA 95064V. Bashkirov, R. W. M. Schulte, K. Shahnazi
Loma Linda University Medical Center, Loma Linda, CA 92354
• Proton Energy Loss in Matter
• Proton Tomography / Proton Transmission Radiography
• Proton Transmission Radiography Data
• Proton Transmission Radiography MC Study

Vertex2002 pCT: Hartmut F.-W. Sadrozinski , SCIPP
SCIPPSCIPPComputed Tomography (CT)
X-ray tube
Detector array
• Based on X-ray absorption
• Faithful reconstruction of patient’s anatomy
• Stacked 2D maps of linear X-ray attenuation
• Coupled linear equations
• Invert Matrices and reconstruct z-dependent features
• Proton CT replaces X-ray absorption with proton energy loss to reconstruct mass density ( distribution

Vertex2002 pCT: Hartmut F.-W. Sadrozinski , SCIPP
SCIPPSCIPP
0.01
1
100
104
1 10 100 1000
X-Ray Absorption Coefficient
Bone
Muscle
H2O
Fat
X-Ray Energy [keV]
[1/cm]
1
10
100
10 100 1000
Stopping Power for Protons
Bone MuscleH2OFat
dE/dl[MeV/cm]
Proton Energy E [MeV]
Radiography: X-rays vs. Protons
Attenuation of Photons, ZN(x) = Noe- x
Energy Loss of Protons, l
dx
dEdx
dx
dEE
NIST Data
dx
dE
dl
dE
Low Contrast: = 0.1 for tissue, 0.5 for bone
Measure Statistical Process of X-rays Removal Measure Energy Loss on Individual Protons
Vertex2002 pCT: Hartmut F.-W. Sadrozinski , SCIPP
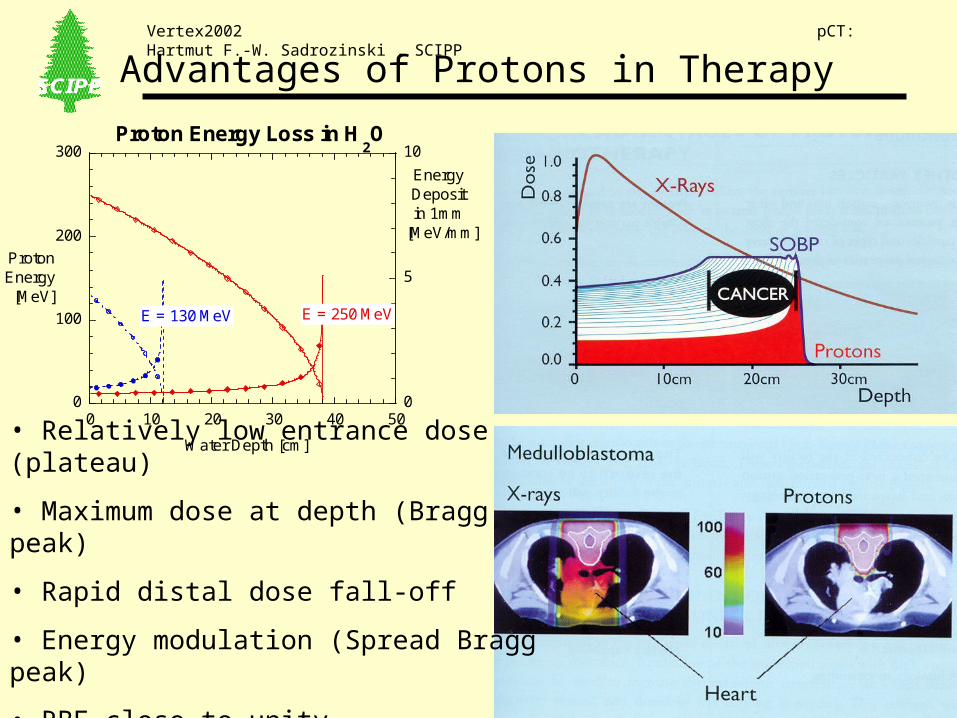
SCIPPSCIPP Advantages of Protons in Therapy
NIST Data
0
100
200
300
0
5
10
0 10 20 30 40 50
Proton Energy Loss in H2O
Proton Energy
[MeV]
Energy Deposit in 1mm
[MeV/mm]
Water Depth [cm]
E = 130 MeV E = 250 MeV
• Relatively low entrance dose (plateau)
• Maximum dose at depth (Bragg peak)
• Rapid distal dose fall-off
• Energy modulation (Spread Bragg peak)
• RBE close to unity
Vertex2002 pCT: Hartmut F.-W. Sadrozinski , SCIPP
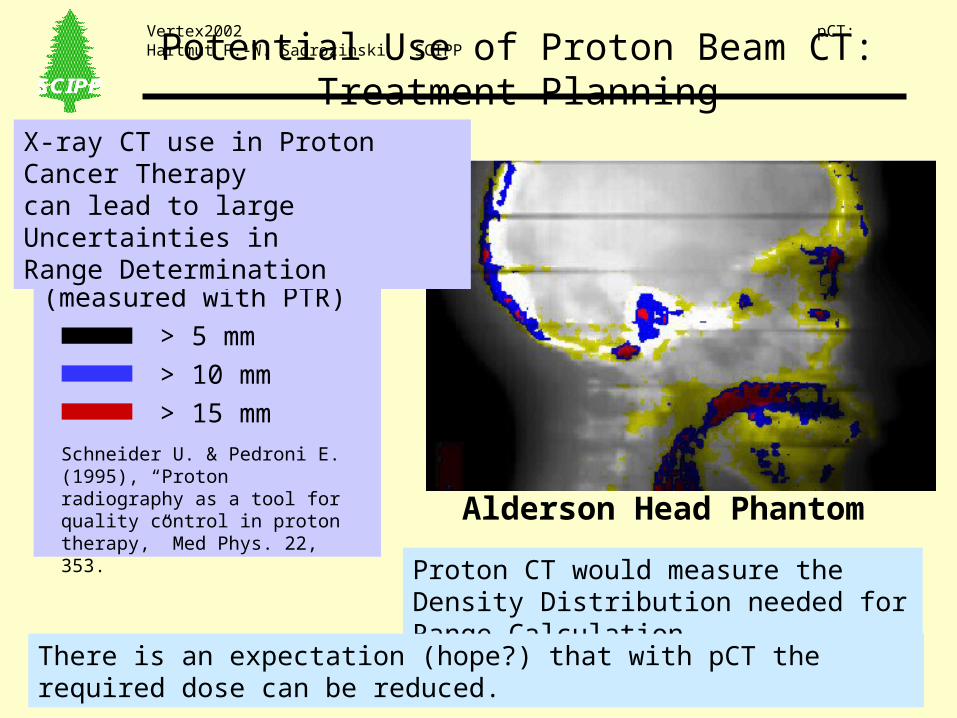
SCIPPSCIPP Potential Use of Proton Beam CT: Treatment Planning
Alderson Head Phantom
Range Uncertainties
(measured with PTR)
> 5 mm
> 10 mm
> 15 mm
Schneider U. & Pedroni E. (1995), “Proton radiography as a tool for quality control in proton therapy,” Med Phys. 22, 353.
X-ray CT use in Proton Cancer Therapy can lead to large Uncertainties in Range Determination
Proton CT would measure the Density Distribution needed for Range Calculation.
There is an expectation (hope?) that with pCT the required dose can be reduced.

Vertex2002 pCT: Hartmut F.-W. Sadrozinski , SCIPP
SCIPPSCIPP
0
0.2
0.4
0.6
0.8
1Energy Loss in Water
0 5 10 15 20 25
Energy Loss
[MeV/mm]
150
200
250
0 5 10 15 20 25
Proton Energy
Proton Energy[MeV]
Depth in H2O [cm]
Low Contrast in Proton CT
Sensitivity Study:Inclusion of 1cm depth and density at midpoint of 20cm H2O
l[g/cm2]
Energy[MeV]
Range [cm]
TOF[ps]
1.0 164.1 38.2 1309
1.1 163.6 38.1 1311
1.5 161.5 37.7 1317
2.0 158.9 37.2 1325

Vertex2002 pCT: Hartmut F.-W. Sadrozinski , SCIPP
SCIPPSCIPPRequirements for pCT Measurements
Tracking of individual Protons requires Measurement of:
NE
E
%1E
52
2
~ D
A
N D
d
dx
dE
E
• Proton angle to better than a degreeMultiple Coulomb Scattering
• Proton location to few hundred um
• Average Proton Energy <E> to better than %
• In order to minimize the dose, the final system needs to employ the best energy resolution! Energy straggling is 1- 2 %.
• Improve energy determination with statistics
• Issue: Dose D = Absorbed Energy / MassVoxel with diameter d = 1mm 105 protons of 200 MeV = 7 [mGy]

Vertex2002 pCT: Hartmut F.-W. Sadrozinski , SCIPP
SCIPPSCIPP Development of Proton Beam Computed Tomography
• Exploratory Study in Proton Transmission Radiography
– Silicon detector Telescope
– Simple phantom in front
• Theoretical Study (GEANT4 MC simulation)
– Evaluation of MCS, range straggling, and angular measurements
– Optimization of energy
• Future Experimental Study in pCT
– Three or four x-y Si planes
– H2O phantom on turntable
– 3-D Reconstruction
Collaboration Loma Linda University Medical Center – UC Santa Cruz
Protonbeam
Simodule 2
Simodule 1
Water phantom
Turntable
Scatteringfoil
Simodule 3

Vertex2002 pCT: Hartmut F.-W. Sadrozinski , SCIPP
SCIPPSCIPPExploratory Proton Radiography Set-up
Degraded down to 130 MeV by 10” Wax Block
27.3 cm30 cm
Beam from Synchrotron
Object
Wax block Air Air
250MeV 130MeV 50+130MeV
y x x ySi Modules
Proton Beam from Loma Linda University Medical Ctr @ 250 MeV
Object is Aluminum pipe 5cm long, 3cm OD, 0.67cm ID Very large effects expected, x = *l = 13.5 g/cm2
Traversing protons have 50 MeV, by-passing protons have 130 MeV
Silicon detector telescope with 2 x-y modules: measure energy and location of exiting protons

Vertex2002 pCT: Hartmut F.-W. Sadrozinski , SCIPP
SCIPPSCIPP Proton Energy Measurement with LET in Si
Simple 2D Silicon Strip Detector Telescope of 2 x-ymodules
built for Nanodosimetry (based on GLAST Design)
2 single-sided SSD/module
measure x-y coordinates
194um Pitch, 400um thickness
GLAST Readout
1.3us shaping time
Binary readout
Time-over-Threshold TOT
Large dynamic range
Measure particle energy via LET

Vertex2002 pCT: Hartmut F.-W. Sadrozinski , SCIPP
SCIPPSCIPP
TOT charge LET
Time-Over-Threshold (TOT) ~ Energy Transfer
Digitization of Position and Energy Deposit with large Dynamic Range
Pulse
Threshold
Time-over-Threshold TOT
0
20
40
60
80
100
120
0 50 100 150 200
TOT Measurement vs Charge in MIP'sEffect of Threshold and Voltage
TOT SLACTOT LLUMC
Input Charge [fC]

Vertex2002 pCT: Hartmut F.-W. Sadrozinski , SCIPP
SCIPPSCIPPProton Energy Measurement with LET
10
100
1 10 100 1000 104
TOT vs. Proton EnergyMeasurement vs. Expectation
TOT & Resolution measuredTOT expected
Proton Energy [MeV]
LLUMCSynchrotron P Beam
GLAST SLAC Test Beam
TOT Saturation
0
0.1
0.2
0.3
0.4
10 100 1000
0
0.1
0.2
0.3
0.4
Proton Energy [MeV]
TOT Saturation
Derive Energy Resolution from TOT vs. E Plot
Good agreement between measurement and MC simulations

Vertex2002 pCT: Hartmut F.-W. Sadrozinski , SCIPP
SCIPPSCIPPImage !
Subdivide SSD area into pixels1. Strip x strip 194um x 194um2. 4 x 4 strips (0.8mm x 0.8mm)
Average Energy in Pixel makes Image

Vertex2002 pCT: Hartmut F.-W. Sadrozinski , SCIPP
SCIPPSCIPPEnergy Resolution => Position Resolution
Hole “filled in”
Average Pixel Energyin Slice of 4x4 pixels(need to apply off-line calibration!)
Clear Profile of Pipe,but Interfaces blurred.
“Fuzzy” Edges

Vertex2002 pCT: Hartmut F.-W. Sadrozinski , SCIPP
SCIPPSCIPPGEANT4 MC: Energy Reconstruction
NIST Data
Energy Loss in Si
Energy Scale of Data ok to 10% BEFORE of-line calibration
Angular distribution narrower in the data!
Energy Reconstructed
from Energy Loss in Si

Vertex2002 pCT: Hartmut F.-W. Sadrozinski , SCIPP
SCIPPSCIPPGEANT4 MC: Loss of Resolution in Back
First Plane, 2cm behind Object
Second Plane, 30cm behind Object: Fuzzy

Vertex2002 pCT: Hartmut F.-W. Sadrozinski , SCIPP
SCIPPSCIPPMultiple Scattering: Migration
Protons scatter OUT OF Target (not INTO).
Scatters have larger energy loss, larger angles, fill hole, dilute energy
Image Features:
Washed out image in 2nd plane (30cm downstream)
Energy diluted at interfaces
(Fuzzy edges, Large RMS, Hole filled in partially)
Migration of eventsare explained by Multiple Coulomb Scattering MCS

Vertex2002 pCT: Hartmut F.-W. Sadrozinski , SCIPP
SCIPPSCIPPGEANT4 MC: Migration
Protons entering the Object in Front Facebut leaving it before the Rear Face
Beam Profile in Slice shows Migration out of Object
Energy of Protons
Entering Front Face

Vertex2002 pCT: Hartmut F.-W. Sadrozinski , SCIPP
SCIPPSCIPPGEANT4 MC: Use of Angular Information
Hit Profile after angle cut
Hit Profile before angle cut
Less Migration
Effect of Angular Cut: Energy more uniform
Energy Profile before (after ) Angle Cut
Energy RMS before (after ) Angle Cut
Sharp edges (Energy Average)
Sharp edges (Energy RMS)

Vertex2002 pCT: Hartmut F.-W. Sadrozinski , SCIPP
SCIPPSCIPP Conclusions:
• Imaging with protons is working!
• GEANT4 program describes the data well
(energy and position resolution, angular distribution, migration)
Issues:
• Energy needs Optimization depending on Target
• Improve Resolution with cut on exit angle
• Investigate Energy Measurement independent from Silicon Detectors
• Dose – Contrast - Resolution Relationship:
Dose from 10,000 Protons of 200 MeV: 1 mGy
Next step: pCT

Vertex2002 pCT: Hartmut F.-W. Sadrozinski , SCIPP
SCIPPSCIPP Mahalo
http:scipp.ucsc.edu/~hartmut/Kona


![LecturesonHolographicSpace-time - arXiv · arXiv:1311.0755v1 [hep-th] 4 Nov 2013 RUNHETC-2013-1 SCIPP 13/10 LecturesonHolographicSpace-time Tom Banks Department of Physics and SCIPP](https://img.dokumen.tips/doc/110x75/5c1d8b3e09d3f2870f8c82ca/lecturesonholographicspace-time-arxiv-arxiv13110755v1-hep-th-4-nov-2013.jpg)