Embed Size (px)
Citation preview
Shelley S. Magill, MD, PhD
July 16, 2015
Ventilator-Associated Event Surveillance:CDC Updates
National Center for Emerging and Zoonotic Infectious Diseases
Division of Healthcare Quality Promotion

Overview
� Review the current status of National Healthcare Safety
Network (NHSN) Ventilator-Associated Event (VAE)
surveillance
� Discuss VAE data reported to NHSN in 2013-2014
� Provide definition and IT updates

STATUS OF NHSN VAE SURVEILLANCE

VAE
Ventilator-Associated Condition (VAC):
Based on changes in PEEP and
FiO2
Infection-related Ventilator-Associated Complication (IVAC):
VAC with general evidence of
infection
Possible Ventilator-Associated Pneumonia
(PVAP):
IVAC with lab evidence
of pneumonia

VAE Surveillance Timeline
1/2013 1/20151/20148/2013
VAE
implemented
in NHSN
PEEP criterion
changes
Changes to
eligible
antimicrobials
Additional
guidance for
microbiological
criteria
Additional
organism
exclusions
Addition of new,
optional
denominator
(“EMV”)
Consolidation of
Possible and
Probable VAP into
single “PVAP”
definition
1/2016
CMS reporting
requirement for
LTCH QRP

VAE DATA REPORTED TO NHSN
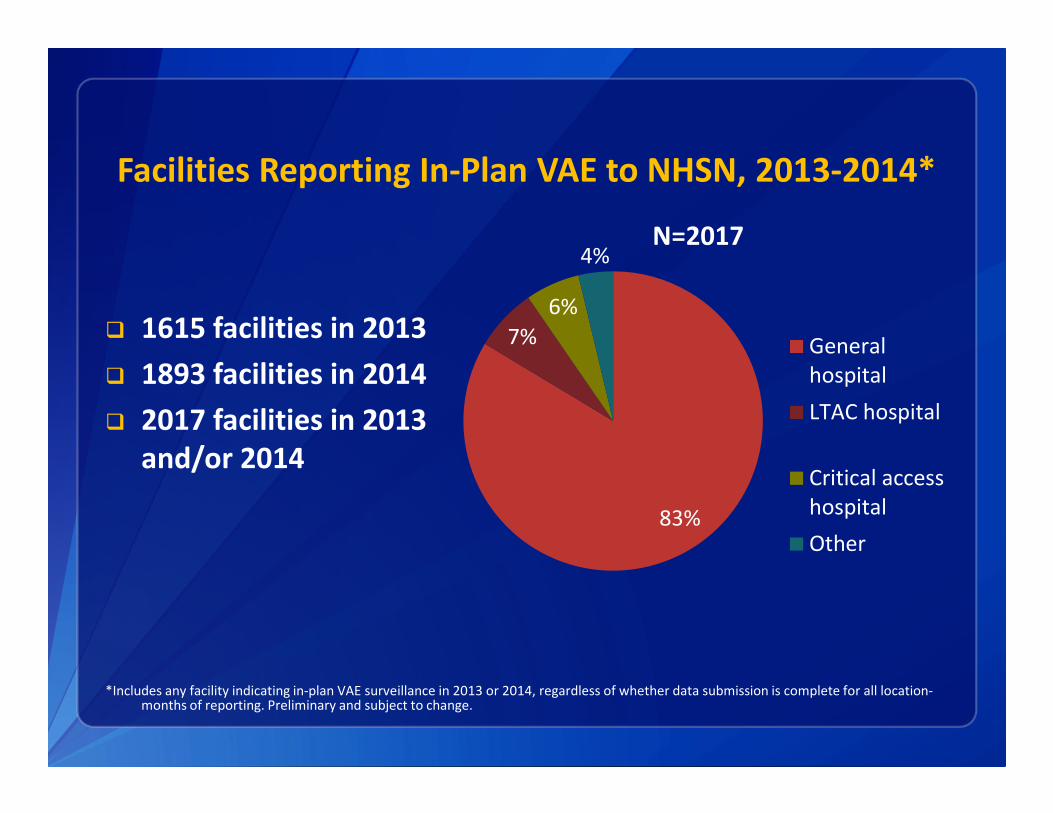
Facilities Reporting In-Plan VAE to NHSN, 2013-2014*
� 1615 facilities in 2013
� 1893 facilities in 2014
� 2017 facilities in 2013
and/or 2014
*Includes any facility indicating in-plan VAE surveillance in 2013 or 2014, regardless of whether data submission is complete for all location-months of reporting. Preliminary and subject to change.
83%
7%
6%
4%N=2017
General
hospital
LTAC hospital
Critical access
hospital
Other
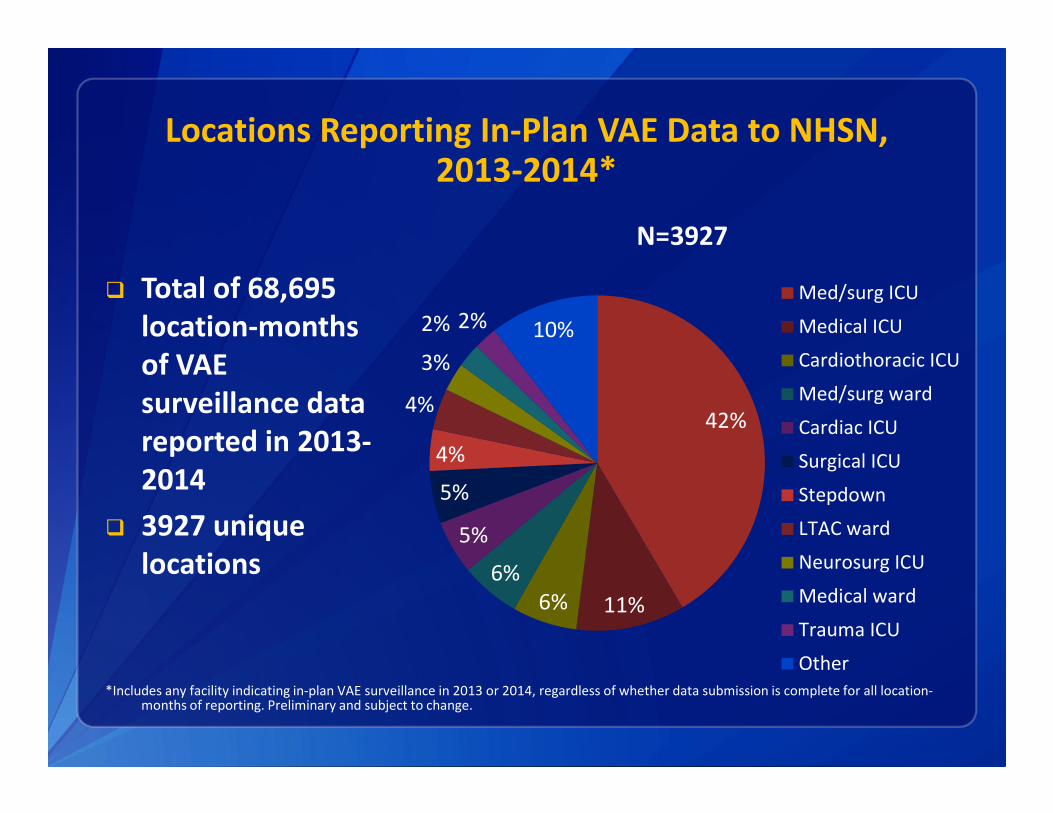
Locations Reporting In-Plan VAE Data to NHSN, 2013-2014*
� Total of 68,695
location-months
of VAE
surveillance data
reported in 2013-
2014
� 3927 unique
locations
*Includes any facility indicating in-plan VAE surveillance in 2013 or 2014, regardless of whether data submission is complete for all location-months of reporting. Preliminary and subject to change.
42%
11%6%
6%
5%
5%
4%
4%
3%
2% 2% 10%
N=3927
Med/surg ICU
Medical ICU
Cardiothoracic ICU
Med/surg ward
Cardiac ICU
Surgical ICU
Stepdown
LTAC ward
Neurosurg ICU
Medical ward
Trauma ICU
Other
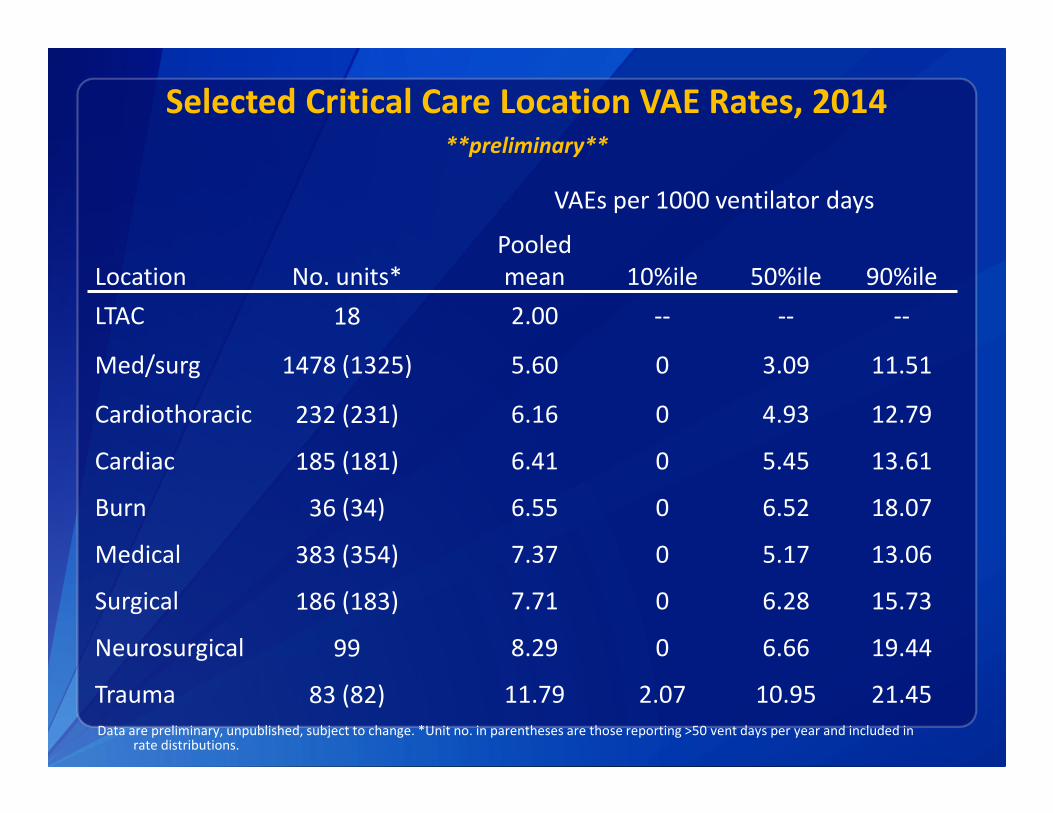
Selected Critical Care Location VAE Rates, 2014**preliminary**
Data are preliminary, unpublished, subject to change. *Unit no. in parentheses are those reporting >50 vent days per year and included in rate distributions.
VAEs per 1000 ventilator days
Location No. units*
Pooled
mean 10%ile 50%ile 90%ile
LTAC 18 2.00 -- -- --
Med/surg 1478 (1325) 5.60 0 3.09 11.51
Cardiothoracic 232 (231) 6.16 0 4.93 12.79
Cardiac 185 (181) 6.41 0 5.45 13.61
Burn 36 (34) 6.55 0 6.52 18.07
Medical 383 (354) 7.37 0 5.17 13.06
Surgical 186 (183) 7.71 0 6.28 15.73
Neurosurgical 99 8.29 0 6.66 19.44
Trauma 83 (82) 11.79 2.07 10.95 21.45
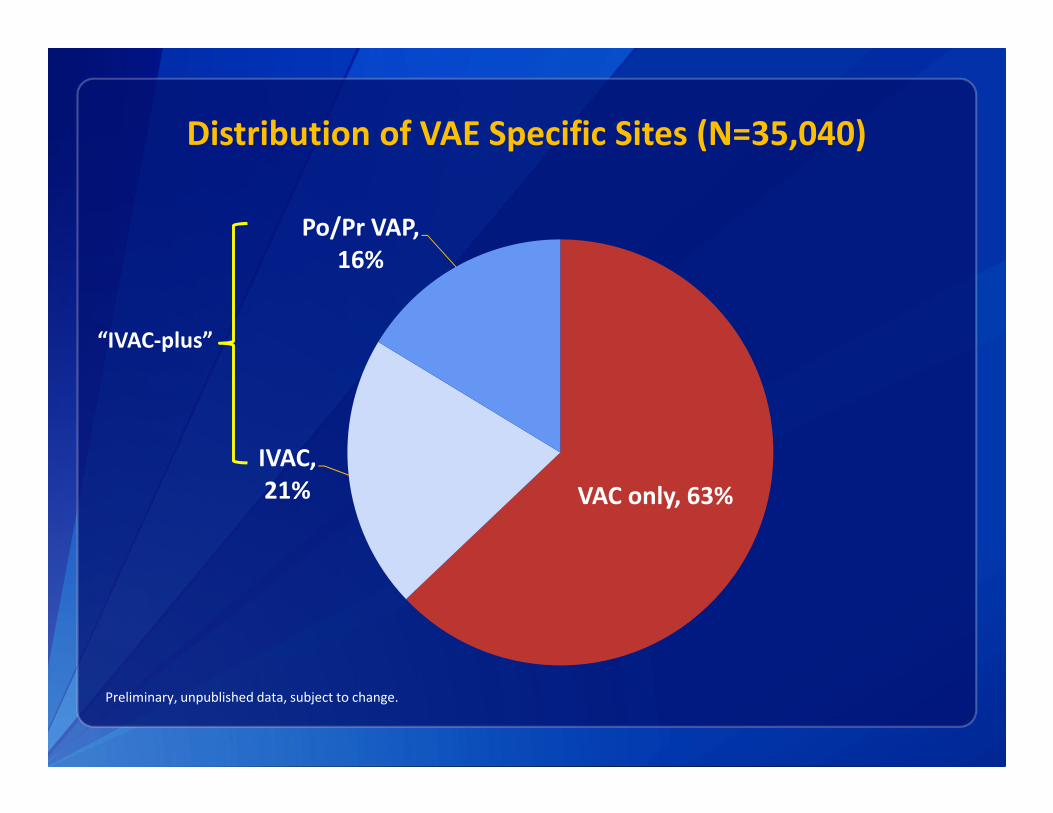
Distribution of VAE Specific Sites (N=35,040)
VAC only, 63%
IVAC,
21%
Po/Pr VAP,
16%
Preliminary, unpublished data, subject to change.
“IVAC-plus”

Criteria Used to Report VAEs (N=35,038)
Preliminary, unpublished data, subject to change.
Excludes 2 events with incomplete criteria reporting.
PEEP only,
68%
FiO2 only,
22%
Both PEEP
and FiO2,
10%

What’s the breakdown of VAEs in different ICUs?
67% 65% 65%60% 59% 59%
56% 54%
33% 35% 35%40% 41% 41%
44% 46%
0%
10%
20%
30%
40%
50%
60%
70%
80%
Cardiac Medical Med/surg Surgical Cardiothor Neurosurg Burn Trauma
Pro
po
rtio
n o
f V
AE
s
VAC
IVAC-plus
Preliminary, unpublished data, subject to change.

Time from Intubation/Mechanical Ventilation Initiation to VAE (N=35,021)*
Preliminary, unpublished data, subject to change; *19 records excluded due to data entry error.
19%
16%
13%
9%7%
6%4%
0
1000
2000
3000
4000
5000
6000
7000
8000
9000
10000
Day 3 Day 4 Day 5 Day 6 Day 7 Day 8 Day 9 Day 10+
Nu
mb
er
of
VA
Es
Mechanical Ventilation Day
35% 39% 25%

Time from Hospital Admission to VAE, Among Patients with VAEs on Mechanical Ventilation Days 3-4
(N=12,361)*
Preliminary, unpublished data, subject to change. *One record excluded due to data entry error; 2 records excluded due to missing data.
28%
32%
10%
6%4%
3% 2%
15%
0
500
1000
1500
2000
2500
3000
3500
4000
4500
Day 3 Day 4 Day 5 Day 6 Day 7 Day 8 Day 9 Day 10+
Nu
mb
er
of
VA
Es
Hospital Day
40%
60%

Timing of VAE Onset
Preliminary, subject to change.
VAEs in patients
in the hospital OR
on the ventilator
for at least 5 days
= 68% of all VAEs
VAEs in patients in
the hospital <5 days
AND on the
ventilator <5 days
= 32% of all VAEs

Summary
� Majority of VAEs occur on/after mechanical ventilation day 5
or hospital day 5
� Suggests most are healthcare-associated
� Distribution of VAC vs. IVAC-plus differs by ICU type
� Reflects capture of a variety of conditions that may be more or less
common depending on the patient population
� Additional work needed to:
� Describe VAEs in different patient populations
� Understand reasons for differences in VAE specific event distributions
� Understand clinical correlates of early-onset VAEs
� Consider whether VAC definition can be modified to exclude events
where oxygenation has not worsened but rather PEEP is being
increased to allow for reduction in FiO2

VAE DEFINITION AND IT UPDATES

Definition Updates
� Minor changes for 2016—adding recently approved
antimicrobial drugs to the list of drugs eligible for meeting
IVAC and PVAP definitions
� Pediatric VAE
� Recent work exploring potential pediatric VAE-like definitions
presented at SHEA 2015
� Reconvening the work group in September 2015
� Goal to implement in NHSN in 2017
Synthetic Data Set
� An EHR vendor seeking to automatically detect VAEs within
their data will first read and interpret the definitions from
written description/VAE protocol
� Need a way to electronically confirm that the vendor is
applying the VAE definitions accurately
� Creation of a synthetic data set
Modified from slide courtesy of Cindy Gross and Barry Rhodes
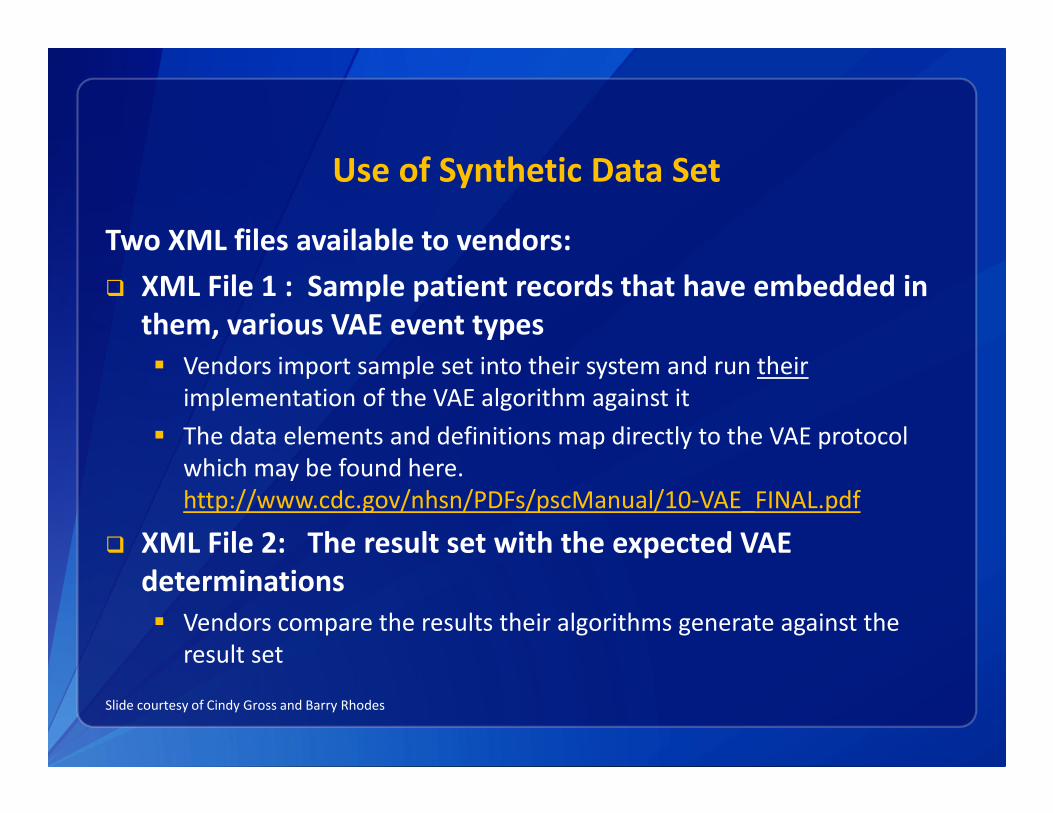
Use of Synthetic Data Set
Two XML files available to vendors:
� XML File 1 : Sample patient records that have embedded in
them, various VAE event types
� Vendors import sample set into their system and run their
implementation of the VAE algorithm against it
� The data elements and definitions map directly to the VAE protocol
which may be found here.
http://www.cdc.gov/nhsn/PDFs/pscManual/10-VAE_FINAL.pdf
� XML File 2: The result set with the expected VAE
determinations
� Vendors compare the results their algorithms generate against the
result set
Slide courtesy of Cindy Gross and Barry Rhodes

Web Service
� A service for vendor systems to submit de-identified data
automatically or for individual users to submit de-identified
datasets through a web page
� XML or CSV file format
� Data elements
� Patient index (de-identified)
� Ventilator day
� Daily minimum PEEP
� Daily minimum FiO2
� Min temp / max temp
� Antimicrobial agent
� Assumes daily min PEEP and FiO2 are determined accurately
Slide courtesy of Cindy Gross and Barry Rhodes
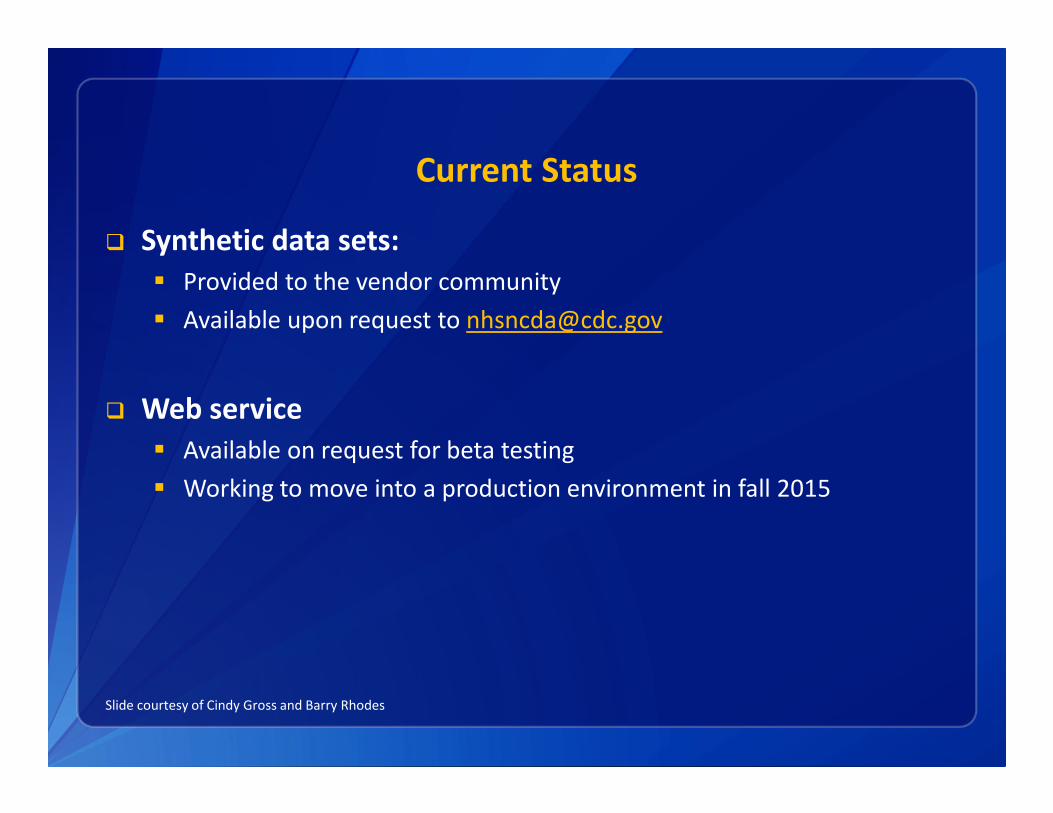
Current Status
� Synthetic data sets:
� Provided to the vendor community
� Available upon request to [email protected]
� Web service
� Available on request for beta testing
� Working to move into a production environment in fall 2015
Slide courtesy of Cindy Gross and Barry Rhodes
Acknowledgments
� DHQP staff, including Qunna Li, Cindy Gross, Barry Rhodes,
Jonathan Edwards, Maggie Dudeck, Kathy Bridson, Susan
Hocevar
� NHSN facilities and users
� VAP/VAE Surveillance Definition Working Group and
Neonatal/Pediatric Working Group
� CDC Prevention Epicenters
� Many subject matter experts
� Federal partners
The findings and conclusions in this presentation are those of the author and do not necessarily
represent the views of the Centers for Disease Control and Prevention.

For more information please contact Centers for Disease Control and Prevention
1600 Clifton Road NE, Atlanta, GA 30333
Telephone, 1-800-CDC-INFO (232-4636)/TTY: 1-888-232-6348
E-mail: [email protected] Web: www.cdc.gov
The findings and conclusions in this report are those of the authors and do not necessarily represent the official position of
the Centers for Disease Control and Prevention.
Questions?
National Center for Emerging and Zoonotic Infectious Diseases
Division of Healthcare Quality Promotion


![Janko Hocevar (Aragon): Uporaba spletnih skupnosti za odkrivanje emocionalnih izkušenj in odnosa do blagovnih znamk [54. MARKETINŠKI FOKUS]](https://img.dokumen.tips/doc/110x75/58a118901a28ab4b658b6f2b/janko-hocevar-aragon-uporaba-spletnih-skupnosti-za-odkrivanje-emocionalnih.jpg)