Embed Size (px)
Citation preview

•
..
•
..
VEHICLE CRASH TEST AND EVALUATION OF MEDIAN BARRIERS FOR
TEXAS HIGHWAYS
by
T. J. Hirsch Research Engineer and Principal Investigator
Edward R. Post Assistant Research Engineer
and
Gordon G. Hayes Physics Research Associate
Research Report Number 146-4 Studies of Field Adaptation of Impact Attenuation Systems
Research Study Number 2-8-68-146
Sponsored by The Texas Highway Department
in cooperation with The United States Department of Transportation
Federal Highway Administration
September 1972 Texas Transportation Institute
Texas A&N University College Station, Texas

ABSTRACT
Key Words: Median Barriers, Roadway Safety, Vehicle Damage, Vehicle
Decelerations, Accidents, Injury Severity, Injury Probability,
Maintenance, Luminaire Poles
Full-scale tests were conducted to evaluate and compare the perfor
mance of three median barriers of different configuration and lateral
stiffness. The three barriers selected by the Texas Highway Department
were: (a) the Metal Beam Guard Fence (MBGF) which consists of two back
to-hack steel W-beam guardrails on weak breakaway steel posts, (b) the
E-3 which consists of two different size strong elliptical steel rail
members mounted on strong fabricated steel posts, and (c) the concrete
median barrier (CMB) with sloping faces.
All three barriers remained intaat in restraining and redirecting a
standard size 4,000 lb. passenger vehicle under the severe impact condi
tions of about 60 mph and 25 degrees. However, some snagging occurred
on a post of the E-3 barrier as a result of the vehicle mounting the
lower rail member.
A 60 mph and 25 degree test demonstrated that luminaire poles and
fencing can ?e safely mounted on the top of the CMB barrier in narrow
medians. Flexible guardrail may be unsafe in narrow medians because the
lateral displacements of the guardrail may allow the vehicle to contact
and knock the luminaire pole onto the roadway.
A comparative study of the three barriers demonstrated that barrier
displacements were effective in reducing vehicle decelerations, vehicle
ii

• damage, and the probability and severity of injuries to unrestrained
occupants. An injury probability of 46 percent represents the apparent
division between minor and major injuries. The ~ffiGF barrier, undergoing
the largest dynamic displace~ent of 1.5 ft., was on the threshoZd of
major injuries under the impact conditions of 60 mph and 25 degrees.
A graph is presented from which an engineer can examine the proba
bility and severity of injury associated with rigid traffic barriers
under various combinations of imapct speed, impact angle, and passenger
vehicle weight. The results of this and other studies show that the
performance of the CMB barrier with sloping faces would be similar to
that of a rigid concrete barrier with·a vertical wall under those com
binations of impact speed and angle exceeding an average lateral vehicle
deceleration of 2 G's and a probability injury level of 20 percent.
This study adds support to the vast knowledge obtained from previous
testing programs and field experience in demonstrating that maintenance
repair increases as barrier flexibility increases. Maintenance of the
rigid CMB barrier would require at most an occasional light sandblasting
job to remove unsightly tire scrub markings.
The findings of this study indicate that the CMB barrier would
best serve the public in narrow medians of roadways located in urban
developments and carrying high speed and high traffic volume. Infor
mation is presented on the safety, economic, and aesthetic considera
tions for each of the three barriers investigated.
iii

SUMMARY
Full-scale tests were conducted to evaluate the performance of three
median barriers of different configuration and lateral stiffness. The
barriers selected by the Texas Highway Department were: (a) the Metal
Beam Guard Fence (MBGF) which consists of two standard W-beam guardrails
mounted back-to-back on breakaway steel posts, (b) the E-3 which consists
of two elliptical steel rails mounted on strong steel posts, and (c) the
concrete median barrier (CMB) with sloping faces.
All three barriers remained intact in restraining and redirecting
a 4,000 lb. passenger vehicle under the severe impact conditions of about
60 mph and 25 degrees. However, some snagging occurred on a post of the
E-3 barrier as a result of the vehicle mounting the lower.rail member.
Increasing the height of the lower rail member may be one solution for
reducing the snagging.
The 150 ft. test section of the CMB barrier, which was not anchored
to the roadway and contained continuous #5 longitudinal reinforcing steel,
showed no tendency to overturn or slide during the 60 mph and 25 degree
collision. The measured rotation~l displacement at the top of the barrier
was 0.09 inches. A l-in. layer of hot mix asphalt was placed l-in. above
the median and adjacent to the base of the barrier to help prevent slid
ing.
The breakaway fillet-weld post connections of the MBGF barrier were
effective from a standpoint of providing greater flexibility and permitting
the posts to displace laterally without significantly reducing the height
iv

•
E
of the rail member, and thereby, preventing vehicle ramping •
A 60 mph and 25 degree test showed that luminaire poles and fencing
can be safely mounted on the top of the C}ffi barrier in narrow medians.
On the other hand, a luminaire pole protected by flexible guardrail may
be unsafe in narrow medians because the lateral displacements of the
guardrail may allow the vehicle to contact and knock the luminaire pole
onto the roadway.
The departure angles of the vehicles after redirection varied from
a low of 6 degrees to a high of 20 degrees. The 20 degree departure angle
occurred with the semi-rigid MBGF barrier due to the side ramping effect
created by the barrier displacements. On wide shoulders and under high
speed and large angle collisions, the large departure angles would most
likely not create a hazardous condition for other nearby vehicles because
most full-scale tests demonstrate that the colliding vehicle after re
direction is pulled back toward the barrier due to the high friction drag
forces of the severely damaged front wheel.
A comparative study of the three barriers demonstrated that barrier
displacements were very effective in reducing the lateral vehicle decel
erations, vehicle damage, and hence, injury severity. During a 60 mph
and 25 degree barrier collision, it was predicted from measured lateral
decelerations that _the probability and severity of injury to unrestrained
occupants in a standard size 4,000 lb. passenger vehicle would be: 72
percent and major for the rigid CMB barrier; 62 percent and major for the
E-3 barrier undergoing a displacement of 0.7 feet; and, 46 percent and
on the threshold of major for the MBGF barrier undergoing the largest
v

displacement of 1.5 feet. An injury probability of 46 percent represents
the apparent division between minor and major injuries. An average of nine
individual assessments of vehicle damage rating using the National Safety
Council (NSC) 7-point rating severity scale were: .. 5. 75 for the CMB bar
rier; 6.1 for the E-3 barrier; and, 5.2 for the MBGF barrier.
Two additional tests were conducted on the CMB barrier at lower angles
of impact of 7 and 15 degrees to evaluate its performance under represen
tative inservice narrow median type collisions. It was predicted that
the probability and severity of injuries to unrestrained occupants in a
standard size 4,000 lb. passenger vehicle would be: between 19 to 22
percent and minor for a 60 mph and 7 degree collision; and, between 43
to 47 percent and on the threshold of major for a 60 mph and 15 degree
collision. The averages of nine individual NSC vehicle damage scale
ratings were 2.1 and 5.5 for the 7 and 15 degree collisions, respectively.
The 60 mph and 7 degree CMB barrier test and the tests of other in
vestigators on concrete medians with sloping faces definitely show that
minor sheet metal vehicle damage occurs under low impact speeds and/ or
angles.
As well known from field experience, this study showed that mainte-
nance increases as barrier flexibility increases. Maintenance of the CMB
barrier would be nil and would require at most an occasional light sandblast
ing job. Maintenance of the relatively rigid E-3 barrier would re-
quire the replacement of one upper 10 ft. rail, straightening of one
post, and a paint touchup for an estimated cost of $290. Maintenance
of the semi-rigid MBGF barrier would require the replacement of 25 ft.
of the barrier including three breakaway posts for an estimated cost of $440.
vi

•
Based upon information provided by the Texas Highway Department,
the initial construction costs of the three barriers on a linear foot
basis are: $13.40 for the CMB barrier; $19.20 for the E-3 barrier;
and, $11.75 for the MBGF barrier.
One could conclude from the results presented (see also Table 6).
that the MBGF barrier is the most economical concerning initial construc
tion costs, and that the barrier is the safest concerning probability
and injury severity to unrestrained occupants during a 4,000 lb. auto
mobile 60 mph/25 deg. impact. However, the MBGF barrier would cost the
most to maintain and its use in narrow medians is not desirable due
to the possibility of the vehicle displacing the barrier a sufficient
distance and knocking the luminaire pole onto the roadway. It appears
that the MBGF barrier would probably be satisfactory for use on rural
type roadways with wide shoulders, wide medians and relatively high speed
but low traffic volume.
One could further conclude from the results presented that the
CMB barrier is the most economical when both initial construction costs
and estimated maintenence costs are considered. The CMB barrier with
luminaire poles would be very desirable for use on urban type roadways
with narrow medians and carrying high speed and high traffic volume.
In addition, low maintenance reduces the amount of exposure time, and
hence, increases safety to maintenance personnel.
It is important that one keep in mind that all three median bar
riers investigated in this study have performed adequately while in
service on our highways. Also, other factors in addition to those
vii

presented here should be considered when selecting a barrier. For
example, information is available which indicates that approximately
75% of the vehicle collisions will occur at angles of 15 deg. or less.
At lower impact angles, the safety and maintenance aspects of all three
median barriers would improve. A graph (Figure 35) is presented from
which a highway engineer can examine the probability and severity of
injury associated with rigid type traffic barriers under various com
binations of impact speed, impact angle, and passenger vehicle weight.
It is the contention of the writers that the safety aspects of
the E-3 could be improved by increasing the height of the lower rail
member to prevent vehicle snagging on the support posts.
viii

IMPLEMENTATION STATEMENT
In this study, three median barriers were evaluated and compared
under full-scale test conditions. The se~i-rigid MBGF barrier, the
relatively rigid E-3 barrier, and the rigid CMB barrier all remained
intaat in restraining and redirecting a standard size 4,000 lb. passenger
vehicle under the severe impact conditions of 60 mph and 25 degrees.
A noticeable amount of snagging occurred on a post of the E-3 bar
rier as the result of the vehicle front wheel mounting the lower rail
member. It appears that snagging could be greatly reduced by increasing
the height of the lower rail member. Also, the splice sleeve in each
rail member of the E-3 barrier, adjacent to a post support, functions
largely as a shear connection distributing the lateral load on a rail
member to one or at most two posts. Failure of a splice would allow
the colliding vehicle to penetrate the barrier or abruptly snag on the
exposed rail member end and the post. It is therefore important that
the 1/2-in. diameter bolt connecting the rail member and splice sleeve
shown on the shop drawings be securely tightened.
The initial construction costs for the three barriers on a linear
foot basis are: $19.20 for the E-3 barrier; $13.40 for the CMB barrier;
and, $11.75 for the MBGF barrier. The figures on construction were
obtained from a Texas Highway Department D-8 Interoffice Memorandum (20)
dated April 10, 1972.
The estimated maintenance costs following a 4,000 lb. automobile
impact at 60 mph/25 deg. are: $290 for the E-3 barrier; nil for the
ix

CMB barrier; and, $440 for the MBGF barrier.
The initial construction cost of the CMB barrier is about 12 per
cent higher than the cost of the MBGF barrier. However, the findings
in this study indicate that the CMB barrier would be.tter serve the
public in narrow medians of roadways located in urban developments and
carrying high speed and high traffic volume. Maintenance of the CMB
barrier would require at the most an occasional light sandblasting job
to remove unsightly tire scrub marks. And, low maintenance insures
increased safety by reducing the exposure time of repair crews and
equipment to high speed and high'traffic volumes. A 60 mph and 25
degree test also demonstrated that luminaire poles and fencing can be
safely mounted on the top of the CMB barrier. Guardrail, such as the
MBGF barrier, may be unsafe in narrow medians because the lateral dis
placements of the guardrail may allow the colliding vehicle to contact
and knock the luminaire pole onto the roadway. Lastly, the majority of
the rigid traffic barrier collisions in urban areas would occur under
impact conditions in which the probability of vehicle occupant (unre~
strained) injury would be low. A graph is presented in this study (see
Figure 35) from which a highway engineer can examine the probability
and severity of injury associated with rigid traffic barriers under
various combinations of impact speed, impact angle, and passenger ve
hicle weight.
X

TABLE OF CONTENTS
ABSTRACT •
SUMt<IARY
IMPLEMENTATION STATEMENT
LIST OF FIGURES.
LIST OF TABLES •
I. INTRODUCTION .
II. DESCRIPTIONS AND PROCEDURES FOR TESTS ..
Description of Median Barriers • Vehicle Control Apparatus. Instrumentation. • • • • . . . • . Data Reduction Technique .
III. DISCUSSION AND EVALUATION OF TESTS
E-3 Median Barrier Test. . . MBGF Median Barrier Test . . . . . Concrete Median Barrier Test CMB-1 Concrete Median Barrier Test CMB-2 Concrete Median Barrier Test CMB-3 Concrete Median Barrier Test CMB-4
IV. INJURY SEVERITY
. .
. . .
. . .
. . .
. . . .
. . . . . .
. . . . . . . .
ii
iv
ix
• xii
. . .
. . .
. . .
. . . . . . . . .
XV
1
3
3 13 14 16
18
18 26 33 41 47 53
59
V. ESTIMATED CONSTRUCTION COSTS • • • • . • • . • • • • . • • . . 71
VI. CONCLUSIONS ••••
Acknowledgments • References • . • • • • • • • • • Appendices • • • • • • • • . . •
High-Speed Film Test Data . Position of Data Points for Triangulation Data. Triangulation Data. . • . • • Acceleration and Seat Belt Data . • . . •
xi
74
77 78 80 81 87 88 90
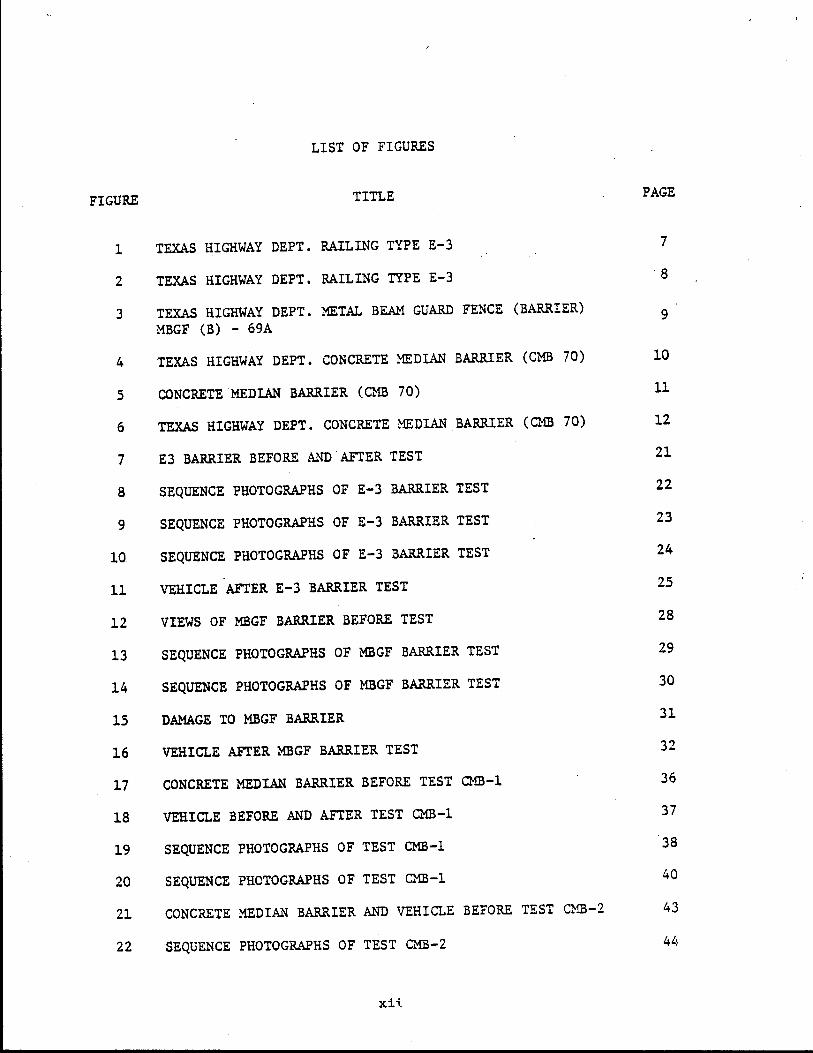
LIST OF FIGURES
FIGURE TITLE
1 TEXAS HIGHWAY DEPT. RAILING TYPE E-3
2 TEXAS HIGHWAY DEPT. RAILING TYPE E-3
3 TEXAS HIGHWAY DEPT. METAL BEAM GUARD FENCE (BARRIER) MBGF (B) - 69A
4 TEXAS HIGHWAY DEPT. CONCRETE MEDIAN BARRIER (CMB 70)
5 CONCRETE MEDIAN BARRIER (CMB 70)
6 TEXAS HIGHWAY DEPT. CONCRETE MEDIAN BARRIER (CMB 70)
7 E3 BARRIER BEFORE AND AFTER TEST
8 SEQUENCE PHOTOGRAPHS OF E-3 BARRIER TEST
9 SEQUENCE PHOTOGRAPHS OF E-3 BARRIER TEST
10 SEQUENCE PHOTOGRAPHS OF E-3 BARRIER TEST
11 VEHICLE AFTER E-3 BARRIER TEST
12 VIEWS OF MBGF BARRIER BEFORE TEST
13 SEQUENCE PHOTOGRAPHS OF MBGF BARRIER TEST
14 SEQUENCE PHOTOGRAPHS OF MBGF BARRIER TEST
15 DAMAGE TO MBGF BARRIER
16 VEHICLE AFTER MBGF BARRIER TEST
17 CONCRETE MEDIAN BARRIER BEFORE TEST CMB-1
18 VEHICLE BEFORE AND AFTER TEST CMB-1
19 SEQUENCE PHOTOGRAPHS OF TEST CMB-1
20 SEQUENCE PHOTOGRAPHS OF TEST CMB-1
21 CONCRETE MEDIAN BARRIER AND VEHICLE BEFORE TEST CMB-2
22 SEQUENCE PHOTOGRAPHS OF TEST CMB-2
xi{
PAGE
7
8
9
10
11
12
21
22
23
24
25
28
29
30
31
32
36
37
38
40
43
44

LIST OF FIGURES (CONTINUED)
FIGURE TITLE
23 VEHICLE AFTER TEST CMB-2
24 DAMAGE TO CONCRETE MEDIAN BARRIER AFTER TEST CMB~2
25 CONCRETE MEDIAN BARRIER BEFORE AND AFTER TEST CMB-3
26 VEHICLE BEFORE AND AFTER TEST CMB-3
27 SEQUENCE PHOTOGRAPHS OF TEST CMB-3
28 SEQUENCE PHOTOGRAPHS OF TEST CMB-3
29 CONCRETE MEDIAN BARRIER BEFORE AND AFTER TEST CMB-4
30 VEHICLE DAMAGE AFTER TEST CMB-4
31 SEQUENCE PHOTOGRAPHS OF TEST ~ffi-4
32 SEQUENCE PHOTOGRAPHS OF TEST CMB-4
33 CURVE RELATING AUTO LATERAL DECELERATION, INJURIES, AND DAMAGE SEVERITY
34 COMPARISON OF SELECTED BARRIERS FROM A VIEWPOINT OF INJURY SEVERITY
35 PREDICTED PROBABILITY AND INJURY SEVERITY UNDER VARIOUS IMPACT CONDITIONS INVOLVING RIGID BARRIERS
36 LONGITUDINAL ACCELEROMETER DATA FOR E-3 BARRIER TEST
37 LONGITUDINAL. ACCELEROMETER DATA FOR E-3 BARRIER TEST
38 TRANSVERSE ACCELEROMETER DATA FOR E-3 BARRIER TEST
39 SEAT BELT DATA FOR E-3 BARRIER TEST
40 LONGITUDINAL ACCELEROMETER DATA FOR MBGF BARRIER TEST
41 LONGITUDINAL ACCELEROMETER DATA FOR MBGF BARRIER TEST
42 SEAT BELT DATA FOR MBGF BARRIER TEST
43 LONGITUDINAL ACCELEROMETER DATA FOR TEST CMB-1
xiii
PAGE
45
46
49
50
51
. 52
55
56
57
58
66
67
68
90
91
92
93
94
95
96
97

. LIST OF FIGURES (CONTINUED)
FIGURE TITLE PAGE
44 TRANSVERSE ACCELEROMETER DATA FOR TEST CMB-1 98
45 SEAT BELT DATA FOR TEST CMB-1 99
46 LONGITUDINAL ACCELEROMETER DATA FOR TEST CMB-? - 100
47 TRANSVERSE ACCELEROMETER DATA FOR TEST CMB-2 101
48 SEAT BELT DATA FOR TEST CMB-2 102
49 LONGITUDINAL ACCELEROMETER DATA FOR TEST CMB-3 103
50 TRANSVERSE ACCELEROMETER DATA FOR TEST CMB-3 104
51 TRANSVERSE ACCELEROMETER DATA FOR TEST CMB-3 105
52 SEAT BELT DATA FOR TEST CMB-3 106
53 LONGITUDINAL ACCELEROMETER DATA FOR TEST CMB-4 107
54 TRANSVERSE ACCELEROMETER DATA FOR TEST CMB-4 108
55 SEAT BELT DATA FOR TEST CMB-4 109
xiv

LIST OF TABLES
TABLE TITLE
1 SUMMARY OF TEST DATA FOR E3 AND MBGF TESTS
2 SUMMARY OF TEST DATA FOR CMB TESTS
3 COMPARISON OF INJURY PROBABILITIES OBTAINED BY THREE TECHNIQUE METHODS
4 DAMAGE RATINGS OF TEST VEHICLES USING NSC 7-POING PHOTOGRAPHIC SCALES
5 COMPARATIVE STUDY ON I!!ITIAL CONSTRUCTION COSTS
6 ESTIMATED MAINTENANCE COSTS
7 COMPARATIVE SUMMARY ON THREE TEXAS MEDIAN BARRIERS
XV
PAGE
20
35
69
70
72
73
76

DISCLAIMER
The contents of this report reflect the views of the authors
who are responsible for the facts and the accuracy of the data present
ed herein. The contents do not necessarily refle.ct the official views
or policies of the Federal Highway Administration. This report does not
constitute a standard, specification, or regulation.

. •
I. INTRODUCTION
Highway engineers in Texas became concerned about the performance
of certain median barriers being used or.being considered for use on
Texas highways. Consequently, three different types of median barriers
were selected by the Texas Highway Department for full scale vehicle
crash testing in order to determine their behavior under controlled
impact conditions •
The three median barriers selected were: (a) the Metal Beam Guard
Fence (MBGF) which consists of two standard W-sections mounted on each
side of 6 WF 8.5 support posts; (b) the E-3 Railing or Median Barrier
(E-3) which consists of two elliptical shaped steel rails mounted on
steel posts; and, (c) the concrete median barrier (CMB) with sloping
faces.
Median barriers are very effective in preventing serious head-on
multiple vehicle accidents. In order to be assured that a barrier has
adequate strength to prevent vehicle penetration, the three selected
median barriers were subjected to the severe impact conditions recom
mended by HRB Circular 482 (!). That is, a test shall be conducted at
a speed of 60 mph and 25 degrees using a standard size passenger vehicle
weighing about 4,000 lbs., with load. Conducting the tests under similar
jmpact conditions also provides a means of comparing the performance of
the three barriers from primarily a viewpoint of injury severity and
maintenance.
Most CMB type barriers are located in narrow medians of large urban
developments. Because of the restricted widths of roadway, most barrier
1

accidents will occur at relatively shallow angles. Therefore, two addi
tional tests were conducted on the CMB barrier at lower impact angles of
7 and 15 degrees in order to evaluate its performance under representative
inservice collisions.
One other objective of this study was to determine if a passenger
vehicle would snag or dislodge a luminaire pole mounted on the top of the
CMB barrier. One test was conducted under the impact conditions of 60
mph and 25 degrees to investigate this problem.
2
•
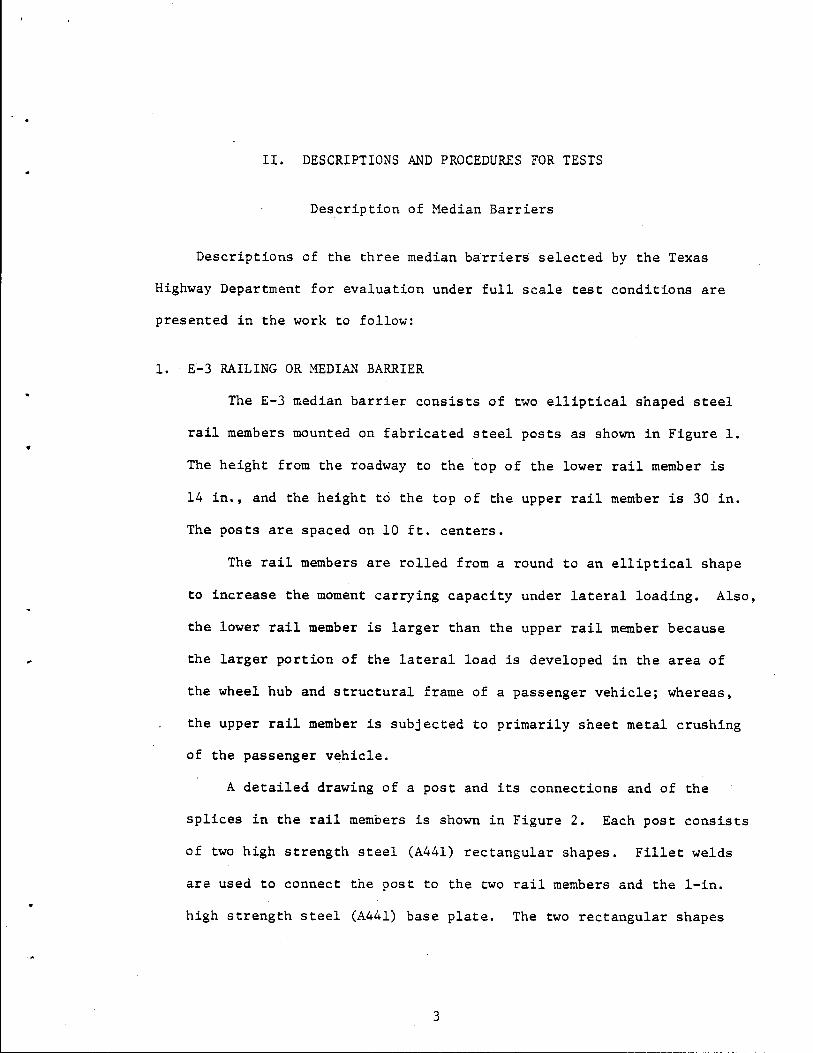
II. DESCRIPTIONS AND PROCEDURES EOR TESTS
Description of Median Barriers
Descriptions of the three median b~rriers selected by the Texas
Highway Department for evaluation under full scale test conditions are
presented in the work to follow:
1. E-3 RAILING OR MEDIAN BARRIER
The E-3 median barrier consists of two elliptical shaped steel
rail members mounted on fabricated steel posts as shown in Figure 1 •
The height from the roadway to the top of the lower rail member is
14 in., and the height to the top of the upper rail member is 30 in.
The posts are spaced on 10 ft. centers.
The rail members are rolled from a round to an elliptical shape
to increase the moment carrying capacity under lateral loading. Also,
the lower rail member is larger than the upper rail member because
the larger portion of the lateral load is developed in the area of
the wheel hub and structural frame of a passenger vehicle; whereas,
the upper rail member is subjected to primarily sheet metal crushing
of the passenger vehicle.
A detailed drawing of a post and its connections and of the
splices in the rail members is shown in Figure 2. Each post consists
of two high strength steel (A441) rectangular shapes. Fillet welds
ara used to connect the post to the two rail members and the l-in.
high strength steel (A441) base plate. The two rectangular shapes
3

of the post extend through the lower rail member. The base plate is
anchored by two 3/4-in. A325 U-shaped bolts embedded in an 18-in.
diameter concrete shaft.
The E-3 median barrier is considered to .be a r.igid barrier
capable of undergoing only small displacements in the redirection
of a standard size passenger vehicle because of the relatively strong
posts and rail members.
2. METAL BEAM GUARD FENCE
The metal beam guard fence or barrier, designated as MBGF(B)-69A,
consists of two standard 12-gage steel W-shaped rail members mounted
back-to-hack on each side of a 6 WF 8.5 support post as shown in Figure
3. The posts are spaced on 6 ft.-3 in. centers, and the height above
the roadway to the top of the rail member is 27 in.
The 3/8-in. fillet welds connecting the outer faces of the two
post flanges and .the 5/8-in. base plate are designed to fracture
during the redirection of a standard size passenger vehicle under
high impact speeds and moderate to large angles. Failure of the
welded connections allows the two back-to-back rail members to dis
place several feet laterally, thereby, reducing the vehicle decelera
tions and incidence of injury. Also, failure of the welds allows the
posts to displace laterally with the rail member without pulling the
rail member down 9 thereby, preventing vehicle ramping.
3. CONCRETE MEDIAN BARRIER
The concrete median barrier, designated as CMB-70, is a massive
solid concrete barrier with inclined plane surfaces as shown in the
4

•
cross seetional view of Figure 4. The CMB barrier tested had: a
weight of about 507 lb./ft.; a height of 32 in. above the roadway;
a lower 10-in. high inclined surface of about 55 degrees; an upper
19-in. high inclined surface of about 8~ degiees; a base width of
27 in.; and a top width of 8 in.
The Texas CMB barrier is similar to the New Jersey Median Barrier
(~) except that #5 longitudinal reinforcing steel is used in the Texas
barrier whereas none is used in the New Jersey barrier. As shown in
Figure 5, the CMB barrier was constructed in two longitudinally rein
forced continuous length sections of 150 ft. and 50 ft. The construction
joint between the two sections offers no lateral restraint.
The luminaire pole wa~ mounted on top of the shorter 50 ft. section.
Three 18-in. diameter drilled concrete shafts were used to support
the shorter CMB section against possible overturning due to wind and
vibratory forces on the luminaire pole. The longer 150 ft. section,
on which three tests were conducted, contains no mechanical anchors
to the roadway. The l-in. layer of hot mix asphalt at the base of
the CMB barrier provided some restraint to sliding during a vehicle
collision.
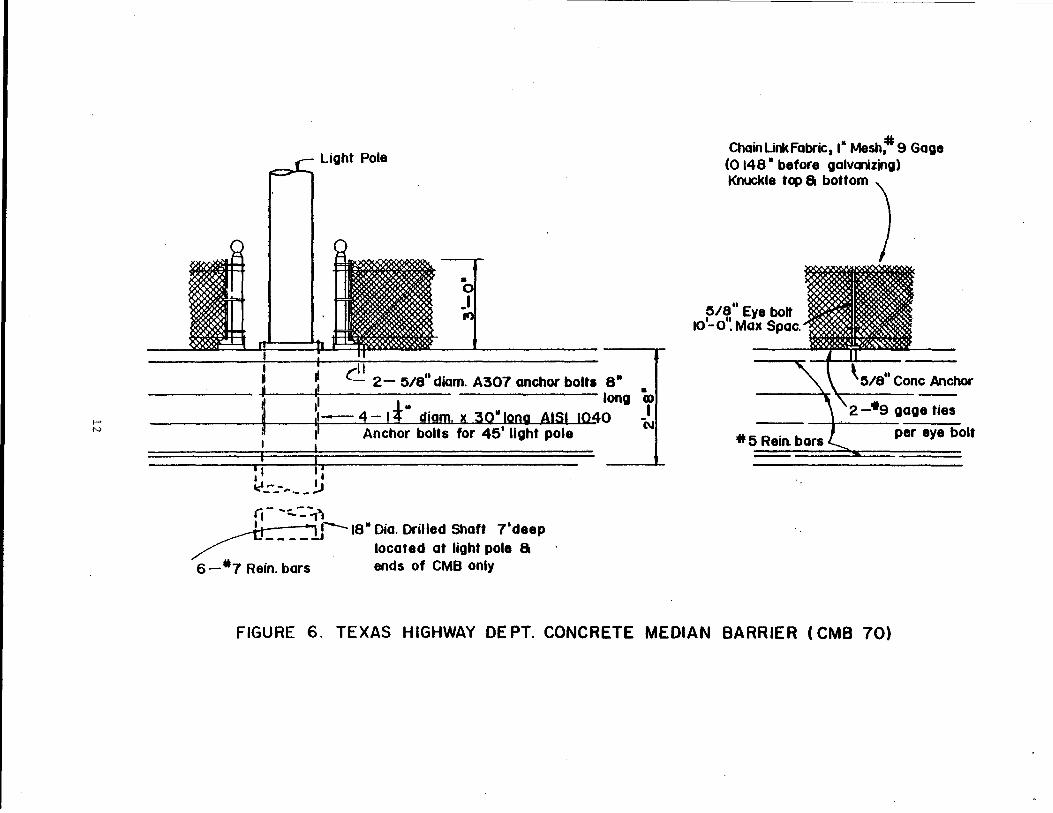
Details of the chain link fabric fence and of the luminaire
pole connection is shown in Figure 6.
The CMB barrier when located in narrow medians provides, as
demonstrated in test CMB-1, additional safety to motorists because
highway luminaire poles can be placed on top of the barrier and thus
removed from possible traffic conflict. For example, a luminaire pole
5

protected by guardrail may be unsafe in narrow medians because the
guardrail could be displaced laterally a sufficient distance so that
the colliding vehicle could snag on the pole and even conceivably
fracture and knock the pole into the stream of traffic.
6

- ~
"E ~
~ en ~
= " ~ L--
., I --' I=, l P.
I I I ..... _ _.
b I
0 -
'i~
~
t u lJ
... "'
~
_ .. "'
7
~ -------,
~---
-c.j z 0 (.) -~
I I
,( I \ I I _____ }:..,
1-------~-\ I
I ~', ( l \ I
-------~'
t.J a:: :::) (!) -u..

CXl
I.D I
"'
N I
t3/411
I I
I I
<t_ RAILING
4" STD. PIPE OR 4li2". x 7.251b/LF API TUBING SHAPED TO 3li2" X 5 ~·· OVAL
6"
lll4" ----<
POST a BASE Jt---+i OF A441 STEEL
41~4'1 413/411
6" STD. PIPE OR 6f¥8"t x 12.89 lb/LF API TUBING SHAPED TO 5" x 8
11
OVAL
1~411 OVAL PIPE SLEEVE
112" t x I" MACH. BOLT (TYP.)
. ~
3;4" t HIGH STRENGTH ·A ..
9~~11
13~ 11 5''
II I
I
ll 4T ·" . I I ANCHOR BOLTS A325 .d . I I
Ill I>
I I • "A I
A 18"t DRILLED SHAFT .. I
I> I I I I . .. I
I I I I ~> .
(CONCRETE) I
I I .. ~ II
I I 4 "' .. l.f 4 \ l--- - --- J J . , _________ /
.. 4
FIGURE 2. TEXAS HIGHWAY DEPT. RAILING TYPE E- 3
--.a
" I r+ If II I I I
it>
Ill
'I' I I v . I I I I I I I I A I I I I
~r . A.
l I ) A
b

' I I I I
I I I I
' \.0
I P'--"1
l '
12 GAGE METAL 6" x 4" WF POST 8.5 1~ A •
~ DIA. BUTTON HEAD T BOLT(A307),
--
j I I I ' -~ I I I I
I I I I I N I I I I
BASE PLATE (TYP) 4-i. OIA. ANCHOR BOLTS ' 7
11X 11
11 xi 11
( A36) ~~~ 911 LONG (A 307) i'~IL
4"LC )
LET
NG r=:rii::-L1 (
SLAB~ 6'-3 11 POST SPACING CONCRETE 7. f--
II"
_j A SECTION AA
FIGURE 3. TEXAS HIGHWAY DEPT. METAL BEAM GUARD FENCE (BARRIER)
MBGF (B)- 69A

2• HPO CONDUIT
•
• -.----+-'- a-• 5 REJNF.
I 0 I
. ,
•
•
BARS CONTIN. GRADE 60
•
• en
• en
= en
FIGURE 4. TEXAS HIGHWAY DEPT. CONCRETE MEDIAN BARRIER ( CMB 70)
10
.. CD _, N
1• Hot mix asphalt

A """ ~ - ~ ~ l&l &Sl
~ moo s•-~-
~ ~ 1IX
<: ~
I .,_ ~- .·.== - ~~ ·- ·--- ~:- ·-. .:--~-----"':':-:· -:-~--"==~--- --~- ·-·-~:-~:-~:--·~--=--::.·:·· .. ·_____ 4 ~
'11/J.'~" . ''}.r;;;;,~~'~ 'll"'""'"'""~.o''"'"*'' "'1:\\'"'"""''' ""''-1 Ground Level
• ,,, .... /liN• '\\Y//11 AI ,,.,,,,,,- Q/1'\"fll"'lllt.,\' 'fill•
149' ----------------------------·-· ~~~-·· -- ·-·- ----------- .__..
South End Of Barrier
25' --+-
t-'
~Luminaire Support
Mechanical Anchors)
7 I
- -·-------- I --,--·· ------------------------- ·--·------ 50'
North End of Barrier
FIGURE 5. CONCRETE MEDIAN BARRIER ( CMB 70)
1-' N
Light Pole
•
~ ~ c....:..: 2- eve" diam. A307 anchor balta a• ' 11 long 'Co i I _1.. I
11-4- 14 diam. x 30•1oog AlSl 1040 'N 11 Anchor bolts for 45' light pole
I I
~-·· 1 1 rr I II ~ _.-_-... - - !.J
(j- -:.::.;-.. ~_J-1a• Dia. Drilled Shaft 7'deep
/.. located at light pole a 6-*1 Rein. bars ends of CMB only
ChainUnkFabric,l• Mesh~9 Gage (0 148 • before galvanizing)
Knuckle top 8 bottom )
.. y 10'-o .Max Spac. 5/S"Eebo~
r,te" Cone Anchor
2 -•9 gage ties
per eye bolt
FIGURE 6. TEXAS HIGHWAY DE PT. CONCRETE MEDIAN BARRIER ( CMB 70)

Vehicle Control Apparatus
The passenger test vehicles were guided along the desired approach
paths by a cable guidance system. In this system, a breakaway flange
attached to the left front wheel hub follows a cable stretched along the
desired path. Before impact, this device shears off and leaves the
vehicle unguided.
The vehicles were brought to the desired test speed by a cable
attached through a pulley system to a reverse tow vehicle. The cable
has an eye in the end which is looped around a pin welded to the front
bumper of the test vehicle. As the test vehicle approaches the impact
area, the pulley system exerts a downward force on the cable and causes
it to disengage from the towing pin on the bumper. From this point,
the test vehicle was unpowered.
13

Test Instrumentation
All tests were recorded photographically using high-speed and docu
mentary motion picture cameras. The high-speed films (usually 500 frames
per second) have accurate timing marks placed on the edge from which
elapsed times can be computed. Vehicle displacement can be measured from
the films using the stadia boards on the vehicles and other targets and
range poles. The position of the vehicle in the horizontal plane can be
determined using two cameras and a triangulation technique. However, the
roof target over the vehicle's e.g. is used as a tracking point, and if
excessive roll or pitch motions are encountered, this method is not
effective because at this time it is limited to two dimensions, and a
plot of the positions of the roof target would not be representative of
the positions of the vehicle's e.g. Tables in the Appendix give either
time-position data for the roof target or time-displacement data for the
vehicle along its path.
All test vehicles had four accelerometers mounted on the longitudinal
frame members behind the front seat. One accelerometer was mounted trans
versely and one longitudinally on each frame member. The tests of the
E-3 and MBGF median barriers were conducted in July of 1970. At that time
the signals from the accelerometers were transmitted by shielded cable to
a nearby instrumentation van where they were recorded on magnetic tape.
In these two tests, piezoelectric accelerometers were mounted transversely
and strain-gage-type accelerometers were mounted longitudinally. Although
the strain-gage-type accelerometers are ~onsidered more suitable for
14

vehicle crash testing, they require four electrical conductors. The
limited number of conductors in the "hard-wired" system required that
the two-conductor piezoelectric devices be used.
The tests on the concrete median barrier were conducted in the summer
of 1971. At this time, a telemetry data acquisition system had been
acquired. This system transmitted the accelerometer data by radio signals
to a ground station where they were recorded on magnetic tape. This
system eliminated the need for a physical connection to the test vehicle
and allowed the use of all strain-gage-type instruments.
In all tests, a 160 lb anthropometric dummy simulated a driver. The
dummy was secured by a lap belt attached to a load cell for sensing lap
belt force.
Reproductions of the accelerometer and lap belt force traces are
shown in the Appendix.
Auxiliary devices were used for quick-look determinations of initial
vehicle speed and subsequent accelerations on test day. But these are
not considered as accurate as the processed data from the films and
accelerometer traces, and they are therefore not presented here. All
accelerometer and lap belt data were passed through an 80 Hz low-pass
active filter.
15

Data Reduction Techniques
The initial, or impact, vehicle speeds are determined from films
obtained with a camera located for that purpose perpendicular to the
vehicle's initial path. These speeds are actually average speeds over
an approximately six-foot interval prior to impact. The position or
displacement of the vehicle is usually determined at the end of successive
small time intervals throughout the interaction, and the speed at any
point can be computed over a suitable interval.
The average lateral and longitudinal decelerations from the film
data are calculated from impact to the time when the vehicles are parallel
to the barriers. These decelerations are the perpendicular and parallel
components with respect to the barriers, whereas the decelerations from
the accelerometers are perpendicular and parallel to the vehicles'
longitudinal axes. The longitudinal deceleration from the film is calcu
lated from the impact angle, impact speed, speed at parallelism, and the
distance traveled parallel to the barrier as shown in footnote "a" of
Tables 1 and 2. The lateral deceleration is calculated from initial
speed and angle, vehicle dimensions, and barrier deflection as shown in
footnote "b" of Tables 1 and 2. This method has proven to give values
that are comparable to those obtained by triangulation methods.
The peak-decelerations are read from the accelerometer traces. The
average decelerations from these traces are taken over the interval from
impact to the point where significant accelerations have ceased. This
point usually occurs before the vehicle has completely lost contact with
the barrier. As the vehicle is redirected, the departing angle is such
16

that ordinarily very little force is exerted on the vehicle even though
it is still in contact with the barrier.
The average decelerations from accelerometer traces are determined
by measuring the area under the curve with a planimeter, dividing this
area by the length to get average height,· and converting this height to
deceleration. The values reported in Tables 1 and 2 are averages of
the decelerations measured on the left and right vehicle frame members.
The accelerometer traces are reproduced in the Appendix.
17

III. DISCUSSION AND EVALUATION OF TESTS
A discussion and evaluation of the .six full scale tests conducted
on three median barriers of different configuration and lateral stiffness
are presented in the work to follow. Assessments of the damage to the
test vehicles and predictions on the probability and severity of injury
that would occur under impact conditions similar to the tests are pre
sented later in Section IV. Descriptions and detailed drawings of the
median barriers were presented earlier in Section II.
E-3 Median Barrier Test
The E-3 Median Barrier test was conducted at an impact speed of
59.3 mph and an impact angle of 25 degrees using a standard size 1963
Plymouth weighing 3,610 lbs., with instrumentation and dummy. The point
of impact was slightly·upstream from the splice connections in the rail
members and a support post as shown by the location of the vehicle control
cable and damaged barrier in the photographs of Figure 7.
Sequential photographs of the vehicle collision and its redirection
are shown in Figures 8, 9, and 10 from three camera positions. And, a
summary of the test results from an analysis of the film data and accelero
meter traces ate presented in Table 1.
The longitudinal accelerometer traces on the right and left frame
members of the vehicle in Figures 36 and 37 (see appendix) indicate that
snagging occurred on a support post during the time interval of 100 to
160 milliseconds after impact. The peak acceleration was 21.3 G's.
The tire marks in Figure 7 and the motion of the vehicle in Fig~re 10
show that the vehicle had climbed on the lower rail member. It is the
18

•
opinion of the writers that the snagging on the post could be reduced
by placing the lower rail member at a higher height.
It can be seen in Figure 10 that the right front wheel of the vehi
cle was pulled left toward the barrier. This pulling effect in combina
tion with the severely damaged left wheel caused the vehicle after re
direction to travel in a circular arc back toward the barrier as shown
in Figure 11. This phenomenon, which is typical of high speed and large
angle barrier collisions, is certainly desirable because it minimizes
the danger to other vehicles in the vicinity of the collision.
As indicated in Table 1, the change in heading speed of the vehicle
during redirection was 30 mph; the departure angle from the barrier was
9 degrees; and, the maximum dynamic lateral displacement of the top rail
member was 0.7 ft.
It can be seen in Figure i that the barrier remained intact and was
not extensively damaged under the severe imposed test conditions. Main
tenance would require the replacement of one 10 ft. length of upper rail
member, straightening of one support post, and a paint touchup. It appears
that the damaged barrier would, prior to repair, be functional under a
possible second collision.
The damaged test vehicle is shown in Figure 11. It can be seen that
the left front quarter and wheel are severely damaged, the windshield
is knocked out, and the passenger compartment area is slightly warped.
19

TABLE 1
SUMMARY OF TEST DATA FOR E3 &~D MBGF TESTS
DATA
VEHICLE
Year
Make
W, Weight (lbs)
6, Impact Angle (deg)
FILM DATA
a.
b.
VI, Initial Impact Speed (mph)
VP' Speed at Parallel (mph)
S Longitudinal Distance to Parallel (ft) long'
G
D, Dynamic Barrier Displacement (ft)
5lat' ~t,
long'
G lat'
Lateral Distance to Parallel (ft)
Time to Parallel (sec)
Average Longitudinal Deceleration (G's) (Parallel to Barrier)
Average Lateral Deceleration (G's) (Normal to Barrier)
Departure Angle (deg)
ACCELEROMETER DATA
a.
b.
Longitudinal Deceleration (G's) (parallel to long. axis of vehicle)
Maximum Average
Time (sec)
Transverse Deceleration (G's) (normal to long. axis of vehicle)
M~ximum Average
Time (sec)
G = long
(VIcose)2
- v; 28 5long
G lat
V2 . 26 Isl.n =~~--2g s
1 at where:
20
BARRIER TEST
E3 MBGF
1963 1963
Plymouth Plymouth
3610 3640
25 25
59.3 57.3
28.9 32.7
20.7 17.5
0.7 1.5
3.4 4.28
0.394 0.270
3.3 3.0
6.2 4.6
8.7 19.7
21.3 12.8 4.1 3.0
0.533 0.560 /
6.1 -0.4 --
0.537 --
= ALsin6-B(l-cos6)+D

•
1-
•
FIGURE 7, E3 BARRIER BEFORE AND AFTER TEST.
21

t = 0.000 sec t = 0.063 sec
t = 0.116 sec t = 0.213 sec
t = 0.309 sec t = 0.332 sec
t = 0.441 sec t = 0.567 sec
FIGURE 8, SEQUENCE PHOTOGRAPHS OF E-3 BARRIER TEST (View Parallel To Rail Members)
22
---·- -=- •
. ----~~··wC~ziJ
. .. -....... ..:_~: .... _~.......!-i.::..i.-:...(

,.
t = -0.010 sec
t = 0.066.sec t = 0.139 sec
t = 0.230 sec t = 0.345 sec
t = 0.485 sec t = 0.578 sec
FIGURE 9, SEQUENCE PHOTOGRAPHS OF E-3 BARRIER TEST (Overhead View)
23

. . . . s:---~·-··· ·-.. < .,
• .' ·' ~ :: • • ~~ • • I
:
---· - ~--· -· ---__ : ~ - ..
. .- ~c,;:_:_, ~·~·'••~ .. -·~:.
.... -· -- . .a --:- .__ ___ ·'-•'~•--'1."'...---._... ...
t= -0.022 sec t = 0.057 sec
' -.. - ----~-... -~-__ .,__ ...-.,.,.--· -....~ ........ ~~"--~ ............. ""16--.. ---,. .... JY·
-· -------- ---- _____ __.:.. _____ -~ .:--~~~-:;~·~: -. --~-~~
t = 0.095 sec t = 0.160 sec
t = 0.244 sec t = 0.339 sec
FIGURE 10, SEQUENCE PHOTOGRAPHS OF E-3 BARRIER TEST (View Perpendicular To Initial Path of Vehicle Prior to Impact)
24

··.·.
•, ,,. ~; ~-;' -~ ..
',<·:~ .-:~:~:~ -. , . ..,. .. .· .. .-...,:,.·_ .. : ~:..::_~":.:...:.:.~:_:>.,.~ _,: ,_::;..·_,:..,._.~ .. ~z-~·-.::-c
FIGURE 11, VEHICLE AFTER E-3 BARRIER TEST.
25

MBGF Median Barrier Test
The MBGF Median Barrier test" was conducted at an impact speed of
57.3 mph and an impact angle of 25 degrees using a standard size 1963
Plymouth weighing 3,640 lbs., with instrumentation and dummy. The
point of impact was near a support post as shown by the location of the
vehicle control cable in the photographic views of the barrier before
testing in Figure 12.
Sequential photographs of the vehicle collision and its redirection
are shown in Figures 13 and 14 from two camera positions. And, a summary
of the test results from an analysis of the film data and accelerometer
traces are presented in Table 1.
The longitudinal accelerometer traces on the right and left frama
of the vehicle in Figures 40 and 41 (see appendix) indicate that the
snagging on the weak breakaway posts was not of any great concern. The
peak longitudinal acceleration was 12.8 G's.
As indicated in Table 1, the change in heading speed of the vehicle
during redirection was 25 mph; the departure angle from the barrier was
20 degrees; and, the maximum dynamic lateral displacement of the barrier
was 1.5 ft.
The departure angle was large due to the side ramping effect re
sulting from the displacements of the single back-to-back rail member.
In any event, the large departure angle would probably not create a
hazardous condition to other nearby traffic, because it can be seen in
Figure 15 that the severely damaged wheel pulled the vehicle after re
direction back toward the barrier.
26

The effectiveness of the breakaway fillet welded post connection in
allowing the posts to displace laterally without pulling the rail member
down, and thereby, preventing any tendency of the vehicle to ramp is evi
dent in the photographs of the damaged barrier in Figure 15.
It can be seen in Figure 15 that the MBGF barrier remained intact
under the severe imposed test conditions. Maintenance would essentially
require the replacement of three posts and one 25 ft. length section of
the two back-to-back W-beam guardrails. It appears that the damaged
barrier would, prior to repair, be functional under a possible low-angle
second collision.
The damaged test ve~icle is shown in Figure 16. It can be seen
that the damage is less severe than the E-3 barrier test vehicle. The
left front quarter is severely damaged, but the windshield remained in
tact and the passenger compartment area is not warped.
27

FIGURE 12, VIEWS OF ~ffiGF BARRIER BEFORE TEST.
28

..
t = 0.000 sec t = 0.079 sec
t = 0.123 sec t = 0.198 sec
t = 0.277 sec t = 0.358 sec
t = 0.512 sec t = 0.664 sec
FIGURE 13, SEQUENCE PHOTOGRAPHS OF MBGF BARRIER TEST. (View Parallel To Rail Member)
29

- ~ •• :;... - .... ~ .J _ .. -· -
- - . ~·:v-:~~ ... ~ -: Q
..... ~ . . --
t • 0.000 sec t .., 0.101 sec
t = 0.155 sec t = 0.239 sec
t = 0.352 sec t = 0.457 sec
FIGURE 14, SEQUENCE PHOTOGRAPHS OF MBGF BARRIER TEST. (Overhead View)
30

.. ·-~! .,
FIGURE 15, DAMAGE TO MBGF BARRIER.
31

FIGURE 16, VEHICLE AFrER MBGF BARRIER TEST.
32
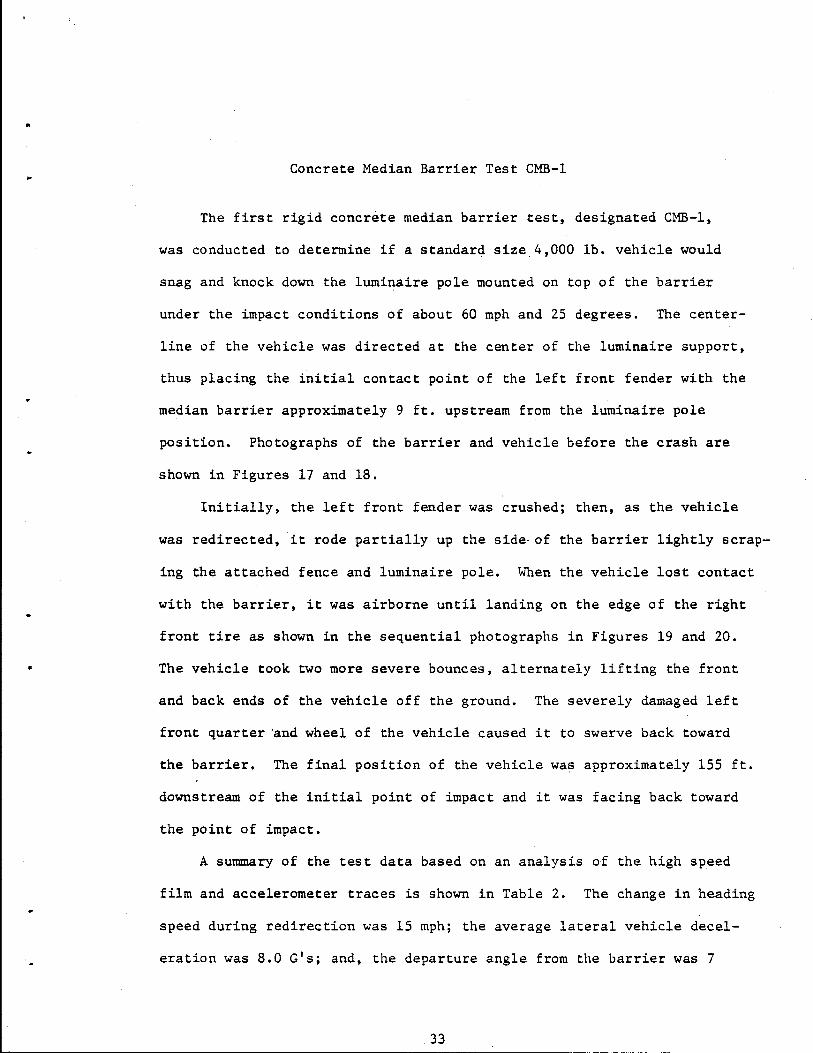
Concrete Median Barrier Test CMB-1
The first rigid concrete median barrier test~ designated CMB-1~
was conducted to determine if a standar~ size_4,000 lb. vehicle would
snag and knock down the lumi~aire pole mounted on top of the barrier
under the impact conditions of about 60 mph and 25 degrees. The center
line of the vehicle was directed at the center of the luminaire support,
thus placing the initial contact point of the left front fender with the
median barrier approximately 9 ft. upstream from the luminaire pole
position. Photographs of the barrier and vehicle before the crash are
shown in Figures 17 and 18.
Initially, the left front fender was crushed; then, as the vehicle
was redirected~ it rode partially up the side-of the barrier lightly scrap
ing the attached fence and luminaire pole. When the vehicle lost contact
with the barrier, it was airborne until landing on the edge of the right
front tire as shown in the sequential photographs in Figures 19 and 20.
The vehicle took two more severe bounces, alternately lifting the front
and back ends of the vehicle off the ground. The severely damaged left
front quarter ~nd wheel of the vehicle caused it to swerve back toward
the barrier. The final position of the vehicle was approximately 155 ft.
downstream of the initial point of impact and it was facing back toward
the point of impact.
A summary of the test data based on an analysis of the high speed
film and accelerometer traces is shown in Table 2. The change in heading
speed during redirection was 15 mph; the average lateral vehicle decel
eration was 8.0 G's; and, the departure angle from the barrier was 7
33

degrees.
The damaged vehicle is shown in Figure 18. As can be seen the front
quarter and wheel were severely damaged, the door on the driver's side
was sprung open, and the windshield was cracked.
34

w U1
•
TABLE 2
SUMMARY OF TEST DATA FOR CMB TESTS
BARRIER TEST
DATA CMB-1 CMB-2 CMB-3
VEHICLE Year 1963 1964 1963 Make Plymouth Chevrolet Chevrolet
W, Weight (lbs) 4000 4230 4210 e, Impact Angle (deg) 25 25 7
FILM DATA VI, Initial Impact Speed (mph) 62.4 55.7 60.9 Vp, Speed at Parallel (mph) 47.2 -- 58.8
s1
, Longitudinal Distance to Parallel (ft) 15.3 -- 17.6 ong D, Dynamic Barrier Deceleration (ft) o.o 0.0 0.0
Slat' Lateral Distance to Parallel (ft) 2.9 2.9 0.85
~t, Time to Parallel (sec) 0.223 0.320 0.206 a. G
1 , Average Longitudinal Deceleration (G's) ong 2.0 0.4 (Parallel to Barrier) --
b. G1
, Average Lateral Deceleration (G's) at (Normal to Barrier) 8.0 6.4 2.2
Departure Angle (deg) 7.3 6.0 6.5
ACCELEROMETER DATA Longitudinal Deceleration (G's) (parallel to long. axis of vehicle)
Maximum 8.7 10.3 8.4 Average 3.2 1.8 0.5
Time (sec) 0.184 0.271 0.325 Transverse Deceleration (G's) (normal to long. axis of vehicle)
Maximum 16.1 13.3 29.2 Average 4.4 2.8 1.8
Time (sec) 0.254 0.280 0.282 '------~ ------ ~~- --------- --------
a and b -- see Table 1.
CMB-4
1963 Chevrolet
4210 15
60.7 50.5 23.0
0.0 1. 74
0.298
1.3 I
4.7 11.5
I
I
7.8 I
1.4 0.244
14.0 3.0
0.264

~-~~:----_; '-...--
. :.-.·. ~- 't_.,. ....
FIGURE 17. CONCRETE MEDIAN BARRIER BEFORE TEST CMB-1.
36
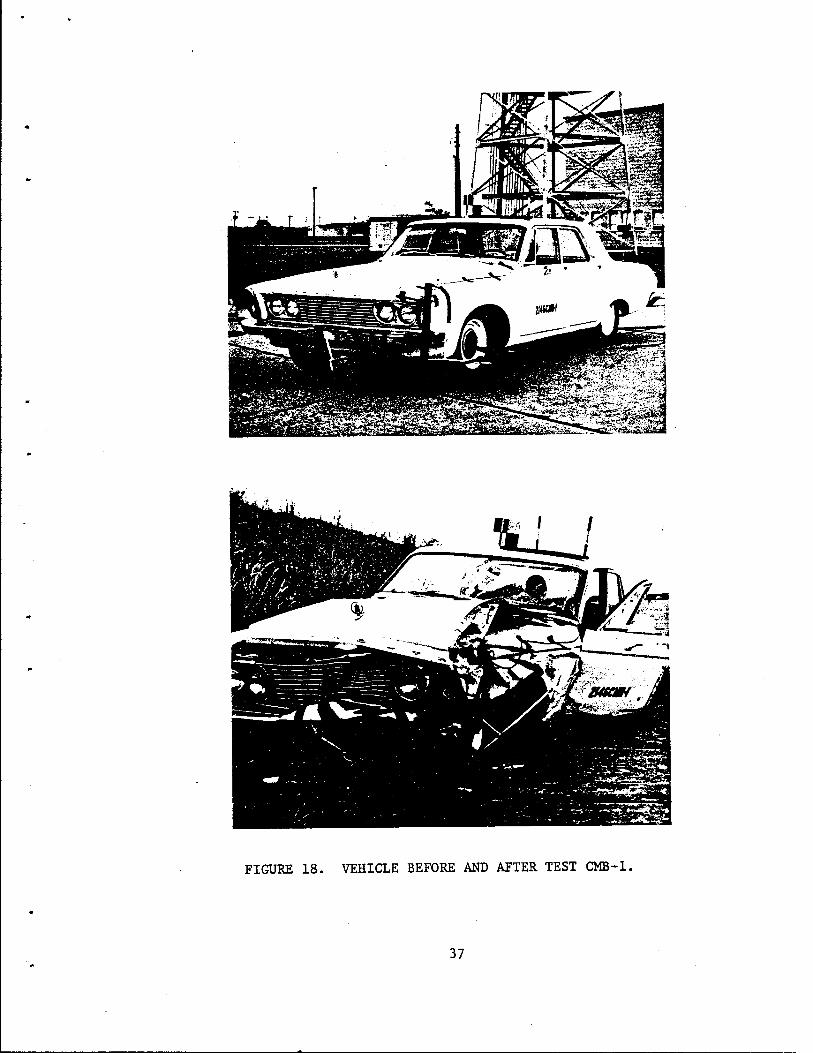
FIGURE 18. VEHICLE BEFORE AND AFTER TEST CMB-1.
37

t = 0.000 sec
'
t = 0.040 sec t = 0.094 sec
,
t = 0.169 sec t = 0.223 sec
FIGURE 19. SEQUENCE PHOTOGRAPHS OF TEST CMB-1. (View Parallel To Concrete Median Barrier)
(Continued)
38

'
..
'
'
t = 0.341 sec
t = 0.954 sec
t = 1.990 sec
FIGURE 19. (Concluded)
39
t = 0.587 sec
'
t = 1. 396 sec

-.'· ~" . " . . .
..... ' -·- ~
.--:~.
--..- .-,·~-- -r~- ·-"'*
t = 0.000 sec
........
. 1. > • • • ·-<~:--.·. __ ..,
t = 0.067 sec
. ~:-- , - ~ ";.. . ; - J ..... ~- .. _.;_ .............. - . .
t = 0.138 sec t = 0.223 sec
' .•
. .. - ~ ... -. . . . .
t = 0.302 sec t = 0.456 sec
. . .. ·
.. .:.;_ ' ' - .
t = 0.631 sec t = 0.742 sec
FIGURE 20. SEQUENCE PHOTOGRAPHS OF TEST CMB-1. (View Perpendicular To Concrete Median Barrier)
40

•
Concrete Median Barrier Test CMB-2
This test, designated CMB-2, was conducted to determine if the 150
ft. unanchored section of the CMB barrier, with continuous steel rein
forcement, would slide and/or rotate in restraining and redirecting a
standard size 4,000 lb. passenger vehicle under the impact conditions of
about 60 mph and 25 degrees. Photographs of the barrier and vehicle
prior to impact are shown in Figure 21.
The vehicle-barrier interaction in the CMB-2 test was similar to
that of the first test, CMB-1. While the vehicle was being redirected,
the left front fender was· crushed and the vehicle rode up the side of
the barrier. The tire marks go all the way up the side of the concrete
barrier as can be seen in Figure 24. At loss of contact with the barrier,
the right front wheel had already recontacted the pavement. Two more
severe bounces followed this, alternately lifting the front and rear of
the car off the ground. The drag forces from the severely damaged left
front quarter caused the vehicle to swerve back toward the barrier. Se
quential photographs of the vehicle collision and redirection are shown
in Figure 22.
Strain gages were placed on the backside of the barrier to measure
the barrier displacement during the collision. The gage which was placed
2.25 in. above the ground showed a maximum displacement of 0.03 in.,
while the other gage, placed near the top of the barrier showed a maximum
displacement of 0.09 inches.
A summary of the test data based on an analysis of the high speed
film and accelerometer traces is shown in Table 2. As can be seen in
41

Table 2, the average lateral vehicle deceleration in this test of 6.4 G's
was smaller than that in previous tests because the impact speed was
about 6 mph less. For all practical purposes, the departure angle of 6
degrees in this test was the same as in the previous .test.
The damaged vehicle is shown in Figure 23. It can be seen that the
6 mph lower impact speed in this test also resulted in slightly less
vehicle damage than that encountered in the previous CMB-1 test. For
instance, the door is not sprung open in this test, whereas, in the CMB-1
test the door was sprung open.
42

..
..
FIGURE 21. CONCRETE MEDIAN BARRIER AND VEHICLE BEFORE TEST CMB-2.
43

t • 0.000 sec .t = 0~033 sec
···---~
t = 0.099 sec t .. 0.144 sec
t = 0.207 sec t = 0.320 sec
t = 0.390 sec t = 0.450 sec
FIGURE 22. SEQUENCE PHOTOGRAPHS OF TEST CMB-2. (View Parallel to Concrete Median Barrier)
44

•
FIGURE 23. VEHICLE AFTER TEST CMB-2.
45
·"L -.J-

FIGURE 24.
I
-·-··~··'":J~@t~~c·-· . -
----~--- ·-· nee•·_--;:·-----.. ·---· ~ --····-·--
-~-
·.•. --. · .......
- , . ~ . -~ ""·~ ... .: .. ".-:. ;_ .. _ . ... .
.. ·.·-...... \ ...
DAMAGE TO CONCRETE MEDIAN BARRIER AFTER TEST CMB-2.
46

•
Concrete Median Barrier CMB-3
Concrete median barriers with sloping faces are currently being
used mostly on urban roadways having narrow medians and carrying a high
traffic volume. The majority of the accidents under these conditions
usually occur at shallow angles of 15 degrees and less. This test,
designated CMB-3, was therefore conducted to evaluate the performance of
the barrier in redirecting a 4,000 lb. passenger vehicle under represen
tative inservice impact conditions of about 60 mph and 7 degrees.
This test was again run on the 150 ft. length section of the CMB
barrier that was not anchored to the roadway. A photograph of the
barrier prior to the test, which shows the tire scrub markings of the
previous CMB-2 test run, is shown in Figure 25. And, a photograph of
the vehicle prior to the test is shown in Figure 26.
Sequential photographs of the vehicle collision and redirection are
shown in Figures 27 and 28. As can be seen by the tire scrub markings
in Figure 25, the vehicle quickly climbed up the lower face of the
barrier and was redirected when the tire contacted the steeper upper
face of the barrier. The maximum height of climb was approximately 18 in.
The vehicle lost contact with the barrier after 46 ft. of travel. At a
point 72 ft. downstream from the point of impact, the vehicle again
recontacted the barrier.
A summary of the test data based on an analysis of the high speed
film and accelerometer traces is shown in Table 2. The departure angle
was, for all practical purposes, the same as the two previous 25 degree
47

angle collisions. The change in the vehicle heading speed of 2 mph was
much lower than in the 25 degree angle collision because the redirection
of the vehicle occurred primarily as the result of an interaction between
the vehicle tire and barrier. Also, it can be ~een in Table 2 that the
average lateral vehicle decelerations of 2.2 G's are very low in compari
son to the previous tests.
The damaged test vehicle is shown in Figure 26. The relatively minor
damage consisted of bumper and sheet metal crushing.
48

•
' ' -~--
"'"<·,_~~~. -~!::
FIGURE 25.
... •:.:"'-· ~t~ .. -:-o.~
CONCRETE MEDIAN BARRIER BEFORE AND AFTER TEST CMB-3. (Darkest Tire Mark is from Test CMB-2.)
49

FIGURE 26. VEHICLE BEFORE AND AFTER TEST CMB-3.
so

..
t = -0.033 sec t = 0.019 sec
.. t = 0.057 sec t = 0.100 sec
"""~~> ..... ~ __ _,.; _,;;.:-&:;·"::.:_- ,-::->.,...
t = 0.112 sec t = 0.150 sec
t = 0.211 sec t = 0.242 sec
FIGURE 27. SEQUENCE PHOTOGRAPHS OF TEST CMB-3. (View Parallel to Concrete Median Barrier)
51

t • 0.000 sec t • 0.101 sec
t = 0.207 sec t • 0.304 sec
FIGURE 28. SEQUENCE PHOTOGRAPHS OF TEST CMB-3. (Overhead View)

a
Concrete Median Barrier Test CMR-4
This test, designated CMB-4, was conducted to determine the perfor
mance of the barrier in redirecting a 4,000 lb. passenger vehicle under
somewhat of an upper bound on inservice type collisions of 60 mph and
15 degrees.
The 150 ft. unanchored section of the CMB barrier was used. A photo
graph of the barrier prior to the test, which shows the tire scrub mark
ings of the two previous CMB-2 and CMB-3 test runs, is· shown in Figure 29.
Sequential photographs of the vehicle collision and redirection are
shown in Figures 31 and 32. The sequential photographs and the photograph
of the tire scrub markings in Figure 29 show that the vehicle climbed all
the way to the top of the barrier. Sheet metal.contact caused relatively
minor damage to the fence as can be seen in Figure 29. After losin~ con
tact with the barrier, the vehicle took two more severe bounces, alternate
ly lifting the right side and the back end off the ground.
A summary of the test data based on an analysis of the high speed
film and accelerometer traces is shown in Table 2. For some unknown rea
son, the change in the vehicle heading speed of 11 mph was roughly double
the speed of the previous CMB-1 test which was run at a much larger im
pact angle, and hence, probably developed greater sheet metal friction
forces. However, the greater change in heading speed could be the reason
for the departure angle of 12 degrees also being roughly double the angles
in previous test runs. In any event, it appears that this larger departure
angle would most likely not create any hazardous situation to other nearby
53

vehicles because the drag forces of the damaged front wheel pulled the
vehicle back toward the barrier as can be seen in Figure 29.
The damaged vehicle is shown in Figure 30. The damage to the vehi
cle in this test was somewhat less than the damaged vehicles in the pre
vious CMB-1 and CMB-2 tests which were run at larger impact angles.
54

•
..
..
y ,·_:· . ;_.," ~-;;~~~:~?} ' '
• ~ 4 •
: .... .. ·cf~.
FIGURE 29 • CONCRETE MEDIAN BARRIER BEFORE AND AFTER TEST CMB-4.
..
55

:;~:;~·:_;_.~~~~~~$' -~ ·--~--~.· .
-·-::_;~~l~f.-;. •. ~~:,~~;;;~~N~, . ::~~~~~~~~f£.
.,; .... _, .. ,,.,.;,,, ....... ,,,, ;~~-~.,.~~::;;. .. ~ ,..:~- ,..._~ ::~·:/·~-. : .. >~ .....
:·~~:~tl~~~ :;c;e~~:~r-.·~ ·<:,;,;? ..... ,,..::;_' ;'"~~!!~~!~~~. ".a==r~------_;.
FIGURE 30. VEHICLE DAMAGE AFIER TEST CMB-4.
56
_ ...... ·-·

;r
t = -0.010 sec t = 0.023 sec
• t = 0.077 sec t = 0.128 sec
·<
___ _............""" . . .. .. .
. --:.·~-:-:--.!~
t = 0.176 sec t = 0.199 sec
.... 1 t = 0.273 sec t = 0.327 sec
FIGL~ 31. SEQUENCE PHOTOGRAPHS OF TEST CMB-4. (View Parallel to Concrete Median Barrier)
57

t = 0.000 sec t • 0.079 sec
t = 0.225 sec t • 0.298 sec
FIGURE 32. SEQUENCE PHOTOGRAPHS OF 'IES'I CMB-4. (Overhead View)
58

•
•
IV. INJURY SEVERITY
Vehicle damage and vehicle accelerations appear to be, at the present
time, good indicators of the severity of occupant injury. Michalski Cl) . .
of the National Safety Council recently established from a statistical
analysis of accident information a relationship between type of colli-
sion, vehicle damage, and the percentage of vehicles in which injuries
occurred to unrestrained occupants. Shortly thereafter, Olson (4) in
NCHRP 86 extended the work of Michalski (1) to include the average decel-
erations of vehicles involved in head-on collisions with roadside fix-
tures and angle collisions with traffic barriers. The combined efforts
of Michalski (1) and Olson (~) are shown in Figure 33 for angle impacts.
The equations relating the variables in Figure 33 are:
in which
V2 . 2 I s~n e
Glat = ~~:----:--:----:-~-~----~ 2g{AL sine - B(l-cose) + D} (1)
••• (NCHRP 86 Eq. 5)
Glat = 0.204 R2 = 10.0 P (2)
••• (NCHRP 86 Eq. 11)
G lat = average lateral deceleration of vehicle normal to barrier from instant of impact to the time the vehicle is parallel to barFier
VI = vehicle impact speed
e = vehicle impact angle
AL = distance from front bumper to center-of-mass of vehicle
59

2B = overall width of vehicle
D = dynamic barrier displacement
R = vehicle damage rating using NSC 7-point photographic guide (Ref. 5)
P • percentage of vehicles in which injuries will occur (occupants unrestrained)
In addition, Michalski (l) determined upon examining only those acci-
dents in which injuries occurred that injury accidents corresponded to a
mean damage rating of R = 4.73. Referring to Figure 33, this mean damage
rating corresponds to a mean average lateral deceleration of about 4.6
G's and a mean probability of injury considering atZ accidents of 46
percent. Probability is used as a shorthand notation for the "pe.rcentage
of vehicles in which injuries occurred". Since the injury type accidents
ranged from minor (not defined by Michalski) to fatalities, it is reason-
able to regard the above mean values as representing a division between
minor and major injuries.
Independently of the above work, a severity-index concept was develop-
ed by Weaver (i), Ross (l, !) and Young (i) for predicting the severity of
injuries to unrestrained occupants of- vehicles involved in median and road-
side traversals and rigid traffic barrier collisions. As shown in the
equation below, the severity-index takes into consideration the longitu-
dinal, lateral, and vertical acceleration components at the center-of-mass
(CM) of the vehicle.
SI = (3)
60

•
..
in which
G = longitudinal acceleration of vehicle at CM long (parallel to long. axis of vehicle)
G = lateral acceleration of vehicle at CM lat (normal to long. axis of vehicle)
G vert = vertical acceleration of vehicle at CM
GXL = tolerable longitudinal acceleration limit
GYL = tolerable lateral acceleration limit
GZL = tolerable vertical acceleration limit
The tolerable accelerations used by Ross (l, 8) and Young (i) for
unrestrained occupants and a time duration of 50 milliseconds were:
G = XL 7
GYL = 5
GZL = 6
The vehicles' accelerations in Eq. 3 can be measured or computed
from the mathematical model (HVOSM) developed by McHenry (10) and modified
for specific applications by Young (i, 11).
A severity-index of unity and less indicates that an unrestrained
occupant will not be seriously injured. The relationship between the
seve~ty-inde= concept and the probabiZity of injury concept was found
by Post and Young (21) to be approximately:
P(%) = 30 SI (4)
It can be seen from Eq. 4 that the findings of Michalski (l) and
Olson (4) differs slightly from the findings of Post and Young (21).
61

That is, the work of Post and Young (21) indicates that major injuries
would occur at a probability of 30 percent, whereas, the work of Michalski
(~ and Olson (4) indicates that major injuries would occur at a proba
bility of 46 percent.
The results of Michalski (l) and Olson (4) were based on a statis
tical analysis of accident information and a rational analytical approach;
whereas, the selection of the tolerable acceleration limits in the severity
index equation for unrestrained occupants were extrapolated in a somewhat
subjective manner from acceleration limits established by Hyde (13) for
a fully restrained vehicle occupant. Rather than attempt to redefine
the tolerable acceleration limits to obtain results that would agree
with that of Michalski (1) and Olson(~), Post and Young (21) had elected
to define a severity-index value of SI = 1.5 as an indicator of major
injuries with a probability injury level of 46 percent. An interpreta
tion of the entire range of severity-index values from a low probability
of 10 percent (SI = 0.4) to a probability of 100 percent (SI = 3.3)
are defined in the CMB barrier report by Post and Young (21).
The available information presented above on probability of injuries
and injury severity will now be used to evaluate the full-scale tests
on the three median barriers selected by THD.
Predictions on the probability and severity of injuries on the three
barriers of different configuration and lat~ral stiffness are shown in
Figure 34. The probability of injury values were computed from Eq. 2
using the average lateral vehicle decelerations in Tables 1 and 2 obtain
ed by an analysis of high speed film. The corresponding severity-index
62

..
..
values were obtained from Eq. 3. It can be seen in Figure 34 that the
probability of injury (46%) and severity-index (1.5) were lowest for the
semi-rigid MBGF barrier undergoing the lgrgest displacement of 1.5 ft.;
whereas, the probability of injury (72%) and severity-index (2.3) were
highest for the rigid CMB barrier undergoing negligible displacements.
The E-3 barrier, undergoing a lateral displacement of 0.7 ft., had a
probability of injury (62%) and severity-index (2.0) in between that of
the CMB and MBGF barriers. The comparison of the three barriers in
Figure 34 clearly illustrates the desirable effect of barrier displace
ments in enhancing safety. However, under the severe impact conditions
suggested by HRB Circular 482 (l) and used in this study, it can be pre
dicted that major injuries will occur during collisions with the CMB
and E-3 barriers, whereas, major injuries may or may not occur during
collisions with the MBGF barrier. A small decrease in the lateral stiff
ness of the MBGF barrier appears desirable from a viewpoint of safety.
Predictions on the probability and severity of injuries associated
with rigid traffic barriers in general under various conditions of impact
speed, impact angle, and vehicle weight are presented for simplicity in
one overall view in Figure 35. The probability curves were obtained from
Eq.'s 1 and 2. The relationships between the vehicle dimensions in Eq.
1 and vehicle weight were obtained from a recent NCHRP 86 continuation
study by Olson (12).
The four full scale test runs on the rigid CMB barrier at different
impact speeds and angles are plotted in Figure 35. Knowing the weight
63

of the test vehicles, one can readily predict the probability of injuries.
A comparison of injury probability by three different techniques are shown
in Table 3. The probabilities based on test vehicle damage were obtained
from Eq. 2 using the average damage rating values of nine research engi
neers in Table 4. The assessment of vehicle damage was based on the 7-
point photographic scales developed by the National Safety Council (5).
It can be seen in Table 3 that a good comparison exists between the three
different prediction techniques. The excellent correlation between the
measured and computed techniques indicates that the probability predic
tions shown in Figure 35 can be extended to any combination of impact
speed, impact angle, and vehicle weight.
Before leaving this section on injury severity, a summary on several
points of interest in Figure 35 will be presented:
1. A large 5,000 lb. passenger vehicle can strike a rigid barrier
at a larger angle than a compact 3,000 lb. vehicle with no
difference in injury probability. Interpolation can be used
for intermediate weight vehicles.
2. Major injuries will occur under impact conditions exceeding
an injury probability of 46 percent and a severity-index of
1.5. For example, major injuries may occur during a rigid
barrier redirection of a 4,000 lb. vehicle under the impact
conditions of about 60 mph and 17 degrees; to reduce the proba
bility and severity of injury for possible angles of impact
greater than 17 degrees, one would need to consider a semi
rigid barrier.
64

•
3. A probability injury level of about 20 percent (G1
= 2 from at
Eq. 2) corresponds to impact conditions in which minor sheet
metal damage occurs during collisions with the CMB barrier.
Further verification of this fact can be easily obtained by
examining the results of tests conducted by California (14, 15).
The effectiveness of the CMB barrier beyond this level is simi-
lar to that of a vertical concrete barrier.
4. Live driver tests lend considerable support to the probability
and injury severity predictions of Michalski Cl) and Olson (i)
in Figure 35. Tests run by Lunstrom (16) on the General Motors
(GM) rigid concrete barrier at 50 mph/8 deg. resulted in minor
vehicle damage and no driver concern. The GM test conditions
in Figure 35 would correspond to a low injury probability of
about 15 percent and an injury severity of minor. The tests
conducted by the Ontario Department of Highways (19) on the New
Jersey concrete median barrier at 10, 20, 30, 40 mph/10 deg.
and 20 mph/25 deg. resulted in minor vehicle damage, little
driver discomfort, and good driver control of the vehicle both
when in contact with the barrier and on exit. The test condi-
tions of Ontario (19) in Figure 35 would correspond to a low
probability of about 11 percent and less and an injury severity
of minor •
65

10
z 2a ~ a:: LLI ...J LLI (.)
~6
~ ::> <t
...J4 <t a:: LLI
tt ...J
w2 (!) <t 0: LLJ
~ 0
ANGLE IMPACTS v
I v
I /
v y I'
v __, 0 I 2 3 4 5 6
AUTO DAMAGE SEVERITY SCALE (R)
-100 .e:
0 LLJ a:: a:: ::> (.)
80 (.) o_ cno LLJLIJ -z 0::-::><t ~a::
60 ~ ~ :cLLI ua:: -z :C::>
. ~ CJ)
40 z t--z _fn ~ o=> t-U ::>U <tO
20 LL.-0 1-2 LLJ (.) a::
0 LLJ 7 a.
FIGURE 33 CURVE RELATING AUTO LATERAL DECELERATION, INJURIES, AND DAMAGE SEVERITY (Refs. 3,4)
66

..
•
100 r---;::=============~---, AVERAGE IMPACT TEST CONDITIONS:
W, AUTO WEIGHT = 3,850 LBS ( ~~ LBS) V1, AUTO SPEED = 59 MPH { :t 3 MPH)
8 , AUTO ANGLE = 25 DEG
0 I 2 D, DYNAMIC BARRIER DISPLACEMENTS (FT)
3.0
-0 IJJ z x-2.0 IJJ cq:
oa:: zi_CJ) .w >a::
1.5 1:: ~ a::CJ) l.LJI>z IJJ
1.0 CJ) ~ •:)
-u C/)0 0 -
FIGURE 34 COMPARISON OF SELECTED BARRIERS
FROM A VIEWPOINT OF INJURY SEVERITY
67

NOTATION:
A LIVE DRIVER TESTS BY LUNSTROM (16) ON G.M. BARRIER
• LIVE DRIVER TESTS BY ONTARIO DEPT. OF HIGHWAYS (19) ON N.J. BARRIER -
120~~--~~~--~------~----~------~----~
1 \ ~ ~ ~
100
II
RIGID TRAFFIC BARRIERS
0=0 I
;; 3,000 LB AUTO II 5,000 LB AUTO
r1:: tl-+-----4 ~~ 5~~
5
•• •• ...
••
"""
"~9· ...... - ~IF .
1: 'f .... ;;:::.sq
··-
~~
~~-·-~
•• L-(P), PERCENTAGE OF AUTOS
IN WHICH INJURIES WILL OCCUR (OCCUPANTS p~I"<E:) 11-(AINfD) I
10 15 20 25 8, IMPACT ANGLE ( DEG)
FIGURE 35 PREDICTED PROBABILITY AND INJURY SEVERITY UNDER VARIOUS IMPACT CONDITIONS INVOLVING RIGID BARRIERS
68
-
30

0\ \0
c
TECHNIQUE METHOD
PROBABILITIES BASED ON DECELERATIONS OBTAINED BY
..
TABLE 3
COMPARISON OF INJURY PROBABILITIES OBTAINED BY THREE TECHNIQUE METHODS
c
MEDIAN BARRIER TESTS
E3 MBGF CMBl CMB2
62% 46% 80% 64% ANALYSIS OF HIGH SPEED FILM
COMPUTED PROBABILITY 82% 63% --- ---CURVES IN FIGURE 35
PROBABILITIES BASED ON 76% DAMAGE RATINGS IN TABLE 4
55% 66% 69%
-- --------~- ---------------------
•
CMB3 CMB4.
22% 47%
19% 4 3%
9% 62%

........ 0
TTl RESEARCH RATING ENGINEER
EDWARD R. POST
EUGENE MARQUIS
ROBERT M. OLSON
HAYES E. ROSS
RONALD YOUNG
TEDDY J. HIRSCH
NEILON J. ROWAN
NED E. WALTON
GRAEME D. WEAVER
R, AVERAGE RATING
T~LE 4
DAMAGE RATINGS OF TEST VEHICLES USING NSC 7-POINT PHOTOGRAPHIC SCALES
MEDIAN BARRIER TESTS
E3 MBGF CMB1 CMB2
LFQ6 LFQS LFQ6 LFQ6
FLS FL4 LFQS LFQS
LFQ7 LFQS LFQS LFQ7
FLS FLS FLS FLS
LFQ7 LFQS LFQ6 LFQS
FL5 FL4.5 FL5.5 FL5.5
FL6 FL6 FL7 FL6
LFQ7 LFQ6 LFQ6 LFQ7
LFQ7 LFQ6 LFQ5.5 LFQS.S
6.1 5.2 5.7 5.8
CMB3 CMB4
FL2 LFQS
FLl FLS
LFQ3 LFQ7
FL1 FL5
~FQ3 LFQS
FLl FL3.S
.FL2 FL6
LFQ3 LFQ6
LFQ3 LFQ6.5
2.1 5.5

•
•
•
V. ESTIMATED CONSTRUCTION COSTS AND REPAIR COST
In order to properly evaluate the three selected barriers, it is
important that one take into consideration the initial costs of con
struction and the maintenance costs.
Initial construction costs for the three selected barriers are
presented in Table 5. The unit cost breakdowns were adjusted to agree
with the total cost per linear foot figures obtained from a Texas
Highway Department D-8 Interoffice Memorandum (20) dated April 10,
1972. As evident, the construction cost of $19.20/ft for the E-3
barrier is relatively high in comparison to the more efficient CMB
barrier with a cost of $13.40/ft and the MBGF barrier with a cost of
$11.75/ft.
The estimated maintenance costs for the three barriers after the
comparable 4,000 lb. automobile tests of 60 mph/25 deg. are presented
in Table 6. The initial construction costs for the E-3 and MBGF
barriers were increased by a factor of 1.5 for purposes of repair to a
small section.
71

ITPE MEDIAN BARRIER
CMB (70) 9,181 LF
E - 3 72,778 LF
MBGF(B)-69 36,079 LF
TABLE 5
COMPARATIVE STUDY ON
INITIAL CONSTRUCTION COSTS*
STRUCTURAL COMPONENT
Steel Forms (Rental and Labor) 8 pes #5 Reinforcing Steel Concrete (Ready-Mix) Site Preparation; Stabilize Soil; l-in. Asphalt at base; Contingencies
Top Rail Member (7. 25 lbs·/ft) Bottom Rail Member (12.89 lbs/ft) Fabricated Posts (10 ft. on centers) Drilled Concrete Shafts (18-in. dia.) Base Plates and Anchor Bolts Contingencies
2-12 Ga. Steel W-Beams 6 B 8.5 Posts (6 ft. 3 in. on Centers) Drilled Concrete Shafts (18-in. dia.) Base Plates and Anchor Bolts Contingencies
UNIT COST
INCLUDING LABOR
$0.30/Ft $ 45/ cyd
$0.60/lb $0.60/l.b
$0.45/ lb $0:45/1b
COST PER LINEAR
FOOT ($/FT)
4.00 2.40 5.50 1.50
13.40
4.35 7.75 4.25 1.00 1.00 0.85
19.20
6.00 1.50 1.80 1.60 0.85
ll. 75
* These costs do not include the costs of the fence and luminaire poles because in roadway median& the fence and luminaire poles would be common to all three barriers. It is estimated that the fencing would cost about $1.00/ft. Steel 40 ft. luminaire poles (Galv.) with 12ft. mast and 15ft. mast would cost about $3.30/ft. and $3.60/ft., respectively. Steel 50 ft. luminaire poles (Galv.) with 12 ft. mast and 15 ft. mast would cost about $2.90/ft. and $3.10/ft., respectively. Luminaire pole costs include conduit, dual cable, service pole, and installation. Aluminum luminaire poles are considerably higher in cost. Luminaire costs obtained from Highwaz Research Record No. 377 (Ref. 17).
72

'-.1 w
Barrier
CHll (70) ·
E-3
MllGF
TA.HLE 6
ESTIMATED MAINTENANCE COSTS
·-
Required Haintenance
,
• Occasional Sandblasting Job to remove tire scrub marks
• Replace one 10-ft. length section upper rail
• Straighten one support post
• Paint touchup
•
• Replace one 25-ft. length section of 2 back-to-back W-beam guardrails
• Replace 3 breakaway support posts
•
*Cost/ft **Total Cost
($/ ft) ($)
- - - - Nil
19.20 (1.5) 290
11.75 (1.5) 440
* The initial construction costs for the E-3 and MBGF barriers were increased by a factor of 1.5 for purposes of repair to a small sectio.n.
** Values rounded off to the nearest $10.

VI. CONCLUSIONS
A summary of the comparative results made on the three Texas median
barriers is presented in Table 7, The barriers are compared on the basis
of:
1. Initial construction cost
2. Estimated maintenance following a 4,000 lb. automobile impact
at 60 mph/25 deg.
3. Predicted probability and severity of injuries to unrestrained
occupants during a 4,000 lb. 60 mph/25 deg. impact.
4. National Safety Council vehicle damage rating after 4,000 lb.
automobile 60 mph/25 deg. impact.
5. Applicability for narrow medians with luminaire poles for
probably 4,000 lb. automobile 60 mph/25 deg. impact.
6. Appearance
One could conclude from the results in Table 7 that the MBGF barrier
is the most economical concerning initial construction costs, and that
the barrier is the safest concerning probability and injury severity to
unrestrained occupants during a 4,000 lb. automobile 60 mph/25 deg.
impact. However, the MBGF barrier would cost the most to maintain and
its use in nar.row medians is not desirable due to the possibility of
the vehicle displacing the barrier a su!ficient distance and knocking
the luminaire pole onto the roadway. It appears that the MBGF barrier
would probably be satisfactory for use on rural type roadways with wide
shoulders, wide medians and relatively high speed but low traffic volume.
74

One could further conclude from the results in Table 6 that the CMB
barrier is the most economical when both initial construction costs and
estimated maintenance costs are considered. The CMB barrier with lumi
naire poles would be very desirable for use on urban type roadways with
narrow medians and carrying high speed and high traffic volume. In
addition, low maintenence reduces the amount of exposure time, and hence,
increases safety to maintenance personnel.
It is important that one keep in mind that all three median barriers
investigated in this study have performed adequately while in service
on our highways. Also, other factors in addition to those presented
here should be considered when s~lecting a barrier. For example, Hutchin
son and Kennedy (18) present data which indicates approximately 75% of
the vehicle collisions will be at angles of 15 deg. or less. At lower impact
angles, the safety and maintenance aspects of all three median barriers
would improve. A graph (Figure 35) is presented from which a highway
engineer can examine the probability and severity of injury associated
with rigid type traffic barriers under various combinations of impact
speed, impact angle, and passenger vehicle weight.
75

....... 0\
TABLE 7
COMPARATIVE SUMMARY ON THREE TEXAS lo-IEDIAN BARRIERS
Basis for Comparison
1. Initial Construction Cost*
2. Estimated Maintenance after 4,000 lb. Auto 60 mph/25 deg. impact
3. Predicted probability and severity of injury during 4,000 lb. Auto 60 mph/25 deg. impact
4. National Safety Council Vehicle Damage Rating after 4,000 lb. Auto 60 mph/25 deg. impact ·
5. Should barrier be used in Narrow Medians with Luminaire Poles for Probable 4,000 lb. Auto 60 mph/25 deg. impact
6. Appearance
CMB(70)
(Long. Reinf. Concrete)
$13.40 /ft
Nil
72% Major Injuries
5.8
YES
E - 3
(Tubular Rails)
$19.20 /ft
$290
62% Hajor Injuries
6.1 (snagging)
PROBABLY Negligible I Small Barrier Dis-
Barrier Displacements placements of 0.7 ft Should raise lower rail to prevent snag ging.
Simple and smooth lines
Smooth and Thin Tubular rails
* Cost does not include chain link fence (glare screen) or luminaire poles.
MBGF
(Back-to-Back W-Beams)
$11. 75/ft
$440
46% Threshold of Major
Injuries
5.2
PROBABLY NOT Barrier Displacements of 1.5 ft. may allow auto .to knock down
luminaire pole
Adequate

ACKNOWLEDGMENTS
This study was conducted under an interagency contract between the
Texas Transportation Institute and the Texas Highway Department. It was
sponsored jointly by the Texas Highway Department and the Federal High
way Administration. Liaison was maintained through Mr. John Nixon and
Mr. Paul Tutt, contact representatives for the Texas Highway Department.
77

REFERENCES
1. Committee on Guardrail and Guide Posts, HRB CiPaular 482 (Sept. 1962).
2. New Jersey State Highway Department, "Center Barrier Save Lives", 1966, 15 pp.
3. Michalski, C. S., "Model Vehicle Damage Scale: A Performance Test". TPaffic Safety, Vol. 12, No. 2 (June 1968), pp. 34-39.
4. Olson, R. M., Post, E. R., and McFarland, W. F., "Tentative Service Requirements for Bridge Rail Systems". NCHRP Report 86, 1970, 62 pp.
5. "Vehicle Damage Scale for Traffic Accident Investigation". Traffic Accident Data Project, National Safety Council, TAD Project TechnicaZ BuZZ. No. 1 (1968), 18 pp.
6. Weaver, G. D., "The Relation of Side Slope Design to Highway Safety". Final Report on Task Order No. 2, Report No. 626-2, NCHRP Project 20-7, Texas Transportation Institute, Texas A&M University, May 1970.
7. Ross, H. E., and Post, E. R., "Criteria for the Design of Safe Sloping Culvert Grates," Vol. 1: Development of Criteria, Research Report 140-3, Texas Transportation Institute, Texas A&M University, August 1971, 23 pp.
8. Ross, H. E., and Post, E. R., "Criteria for Guardrail Need and Location on Embankments," Vol. 1: Development of Criteria, Research Report 140-4, Texas Transportation Institute, Texas A&M University, April 1972, 63 pp.
9. Young, R. D., Ross, H. E., and Post, E. R., "Rigid Traffic Barrier Study," First Rough Draft, Texas Transportation Institute, Texas A&M University, Nov. 1971.
10. McHenry, R. R., and Deleys, N.J., "Vehicle Dynamics in Single Vehicle Accidents: Validation and Extension of a Computer Simulation," Cornell Aeronautical Laboratory Report No. VJ-2251-V-3, Buffalo, N. Y., Dec. 1968, 276 pp.
11. Young, R. D., Edwards, T. C., Bridwell, R. J., and Ross, H. E., "Documentation of Input for Single Vehicle Accident Computer Program," Research Report 140-1, Texas Transportation Institute, Texas A&M University, July 1969, 110 pp.
12. Olson, R. M., Ivey, D. L., Post, E. R., Gunderson, R. H., and Cetiner, A., "Bridge Rail Service Requirements as a Basis for Design Criteria," Final Report to NCHRP 12-8/1, Texas Transportation Institute, Texas A&M University, Feb. 1972.
78

•
..
13. Hyde, A. s., "Biodynamics and the Crashworthiness of Vehicle Structures," Wyle Laboratories - Research Staff, Huntsville Facility, Report WR 68-3, Vol. III of V, March 1968.
14. Nordlin, E. F., and Field, R. N., "Dynamic Tests of Steel Box-Beam and Concrete Median Barriers," Highway Researoh Reoord '222, 1968, pp. 61-88.
15. Nordlin, E. F., Hackett, R. P., Woodstrom, J. H., and Folsom, J. J., "Dynamic Tests of the California Type 20 Bridge Barrier Rail," Presented at the 50th Annual Meeting of the Highway Research Board, Jan. 1971.
16. Lunstrom, L. C., Skeels, P. C., Englund, B. R., and Rogers, R. A., "A Bridge Parapet Designed for Safety," Highway Researoh Reoord No. 83, 1965, pp. 169-187.
17. McFarland, W. F., and N. E. Walton, "Economic and Accident Potential Analysis of Roadway Lighting Alternatives," Highway Researah Reaord 37?, 1971, pp. 92-102.
18. Hutchinson, J. W., and Kennedy, T. W., "Medians of Divided HighwaysFrequency and Nature of Vehicle Encroachments," BuUetin 487, University of Illinois Engineering Experiment Station, 1966.
19. Smith, P., "Development of a Three Cable Guide Rail System and Other Guide Rail Tests, 1967-1968".
20. Texas Highway Department D-8 Interoffice Memorandum to Mr. John Nixon from R. S. Williamson, April 10, 1972.
21. Post, E. R., and Young, R. D., "Tentative Relationship Between Injury Probability, Injury Severity and Severity-Index," Work-InProgress as part of THD 2140-5 Project, Texas Transportation Institute, August 1972.
79


•
APPENDIX
•
--
·-
80

HIGH-SPEED FILM DATA FOR E-3 BARRIER TEST
Time Displacement Time Displacement (msec) (ft) (msec) (ft)
-51 -4.4 ·(Continued)
-41 -3.5 203 12.8
-30 -2.7 213 13.4
-20 -1.8 223 13.7
-10 -0.9 233 14.1
0 Impact 0 254 14.8
10 0.9 274 15.6
20 1.7 294 16.3
30 2.6 315 17.1
41 3.4 335 17.8
51 4.3 355 18.6
61 5.1 376 19.5
71 5.9 396 20.4
81 6.6 416 21.2
91 7.3 436 22.1
102 8.0 457 22.9
112 8.6 477 23.8
122 9.2 497 24.6
132 9.7 518 25.4
142 10.2 538 26.2
152 10.6 558 27.0
162 11.1 579 27.7
173 11.5 599 28.6
183 11.9 619. 29.3
193 12.4
81

•
HIGH-SPEED FILM DATA FOR MBGF BARRIER TEST
Time Displacement (msec) (ft)
-61 -5.2
-51 -4.3
-41 -3.4
-31 -2.6
-20 -1.7
-10 -0.8
0 Impact 0
•
..
. ~
82
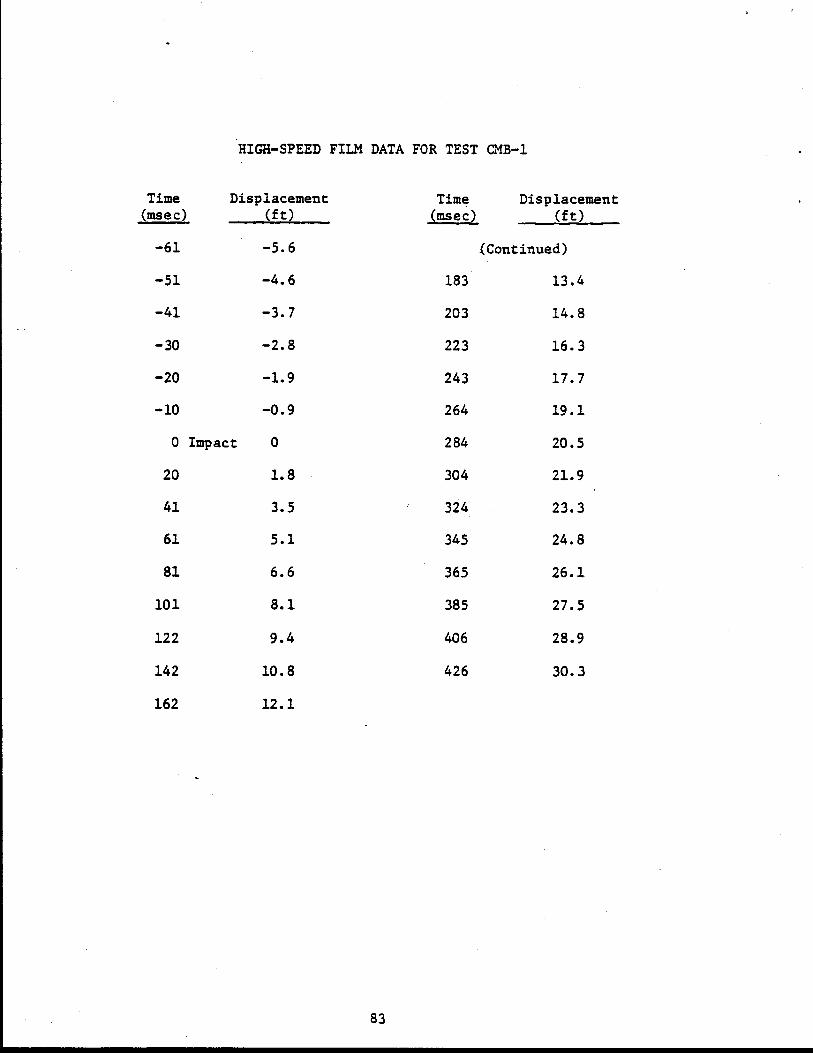
HIGH-SPEED FILM DATA FOR TEST CMB-1
Time Displacement Time Displacement (msec) (ft) (msec) (ft)
-61 -5.6 {Continued)
-51 -4.6 183 13.4
-41 -3.7 203 14.8
-30 -2.8 223 16.3
-20 -1.9 243 17.7
-10 -0.9 264 19.1
0 Impact 0 284 20.5
20 1.8 304 21.9
41 3.5 324 23.3
61 5.1 345 24.8
81 6.6 365 26.1
101 8.1 385 27.5
122 9.4 406 28.9
142 10.8 426 30.3
162 12.1
83

..
HIGH-SPEED FILM DATA FOR TEST w'1B-2
Time Displacement (msec) (ft)
-71 -5.8
-57 -4.6
-43 -3.4
-29 -2.3
-14 -1.2
0 Impact 0 ..
84

HIGH-SPEED FILM DATA FOR TEST CMB-3
Time Displacement Time Displacement (msec) (ft) (msec) (ft)
-68 -6.1 (Continued) -61 -5.5 327 27.9 -46 -4.1 342 29.2 -30 -2.7 357 30.4 -15 -1.4 372 31.8
0 Impact 0 388 33.1 15 1.4 403 34.3 30 2.7 418 35.6 46 4.0 433 37.0 61 5.3 448 38.2 76 6.5 464 39.5 91 7.7 479 40.9
106 9.0 494 42.1 122 10.3 509 43.5 137 11.5 524 44.8 152 12.8 532 45.4 167 14.1 547 46.7 175 14.8 562 48.0 190 16.0 578 49.3 205 17.4 593 50.6 220 18.7 608 51.9 236 20.0
251 21.4
266 22.6
281 24.0
296 25.2
312 26.6
85

•
HIGH-SPEED FILM DATA FOR TEST CMB-4
Time ·Displacement Time Displacement (msec) (ft) (msec) (ft)
-23 -2.0 (Continued)
-15 -1.3 393 31.0
-8 -0.7 476 37.3
0 Impact 0 514 40.2
.. 129 10.8 529 41.3
144 12.1 536 41.8 .. 159 13.3 552 43.0
174 14.7 567 44.2
189 15.9 587 45.3
204 17.0 594 45.9
234 19.2
264 21.4
280 22.5
294 23.6
310 24.7
317 25.3
.-
86

POSITION OF DATA POINTS FOR
TRIANGULATION DATA
ROOF TARGETS: Shown in relation to vehicle
• #1 i • 113 + 112 6.3'
l ~---------------17.0'--------------~
x,y COORDINATES: Shown in relation to median barrier
Median Barrier
X ~ x=o,y=o
y
87

•
"' TRIANGULATION DATA FOR E-3 BARRIE~ TEST
x,y coordinates of roof target 3. Point where x • 0 and y = 0 is 33 ft north and 5.5 ft east of the soutl1 end of the barrier.
Time X y (msec) (ft) (ft)
-10 13.6 2.9
0 12.8 2.5
40 9.8 1.1
80 6.9 0.03
• 120 4.6 -0.7
160 2.6 -0.9
200 0.6 -1.2
240 -1.3 ~1. 3
280 -3.1 -1.2
320 -4.7 -1.1
360 -6.4 -1.1
400 -8.1 -1.1
440 -9.7 -1.1
480 -11.2 -1.1
520 -12.9 -0.9
560 -14.2 -0.7
600 -15.7 -0.4
..
88

TRIANGULATION DATA FOR MBGF BARRIER TEST
x,y coordinates of roof target 2 (above c. g.). Point tvhere x = 0 and y • 0 is 32.1 ft north and 3.9 ft east of the south end of the bar~ier.
Time X y Time X y (msec) .ill)_ (ft) (msec) (ft) (ft)
-40 14.2 4.3 (continued)
-30 13.9 3.9 275 -6.5 -1.6
-20 13.5 3.6 300 -7.7 -1.4
-10 12.0 3.3 325 -8.9 -1.1
0 11.2 2.9 350 -10.2 -0.7
25 9.3 2.0 375 -11.4 -0.4
50 7.4 1.2 400 -12.7 0
75 5.5 0.4 425 -13.8 0.3
100 3.7 -0.2 450 -15.0 0.6
125 1.9 -0.7 475 -16.2 1.1
150 0.3 -1.1 500 -17.4 1.6
liS -1.1 -1.3 525 -18.6 2.0
200 -2.6 -1.6 550 -19.7 2.5
225 -4.0 -1.8 575 -20.9 3.0
250 -5.4 -1.6 585 -21.4 3.1
89

,· • .. '
+5
0
,...... Ul -
--Impact r\ /\. lA 1'0>.
\'V 1\ A v- wv~ ~v -v lJ1
tiO .._,
~ 0
..-1 ~ -10 Ill J.< Qj
.-i Qj
vv~ \ n/ v N \)v
u u <
\D. 0 .-i
Ill ~
..-1 "0 ::I -20 ~
•.-i tiO .: 0
...:l Right Frame Member
v
-30 --
0 100 200 300 400 500 600
Time (msec)
FIGURE 36. LONGITUDINAL ACCELEROMETER DATA FOR E-3 BARRIER TEST.

\0 ~
......... Ill -00 .._..
!::l 0 ort 4-1 liS ~ Gl
...-1 Ql u u < ...-1 liS !::l ·ri 'tJ ::I 4-1 ort 00 !::l 0
.....1
+5 I
0
-10
-20 0
--Impact
100
FIGURE 37.
200 300
Time (msec)
400
Left Frame Member
500
LONGITUDINAL ACCELEROMETER DATA FOR E-3 BARRIER TEST.
600

\0 N
. ·
-(I) -0() -~ 0
..-I
'"' 111 ~ Q)
...... Q) (.J
u < Q)
u: ~ Q)
> u:
~ ~ r
........ u: -Clli
'-"'
~ c
•r-1 .u 111 ~ G.i
..-i Q) u (.J
< Q) (I) ~ Q)
> 'Jl
1ii
-10
0
+10
-10
0
~ E-< + 10
.,.__Impact
0 100
~J.mpact
0 100
FIGURE 38.
# ..
200 300
Time (msec)
2()() 300
Time (msec)
•
400
400
Frame Member
Right , Frame Hember
500
son
TRANSVERSE ACCELEROMETER DATA FOR E-3 BARRIER TEST.
•
600
600

-CD ,.Q .-I
- +200~-----------r------------r------------r----------~
Impact
-200 ------------~----------_.----------~~--------~ 0 100 200 300 400
Time (msec)
FIGURE 39. SEAT BELT DATA FOR E-3 BARRIER TEST.
93

• •
+10
,...... .-Impact (/) -00 .._,
j:;: 0 0
..-t ~ Cll .... Q) ......
\0 Q) (.)
.t'- (.)
<(
...... Cll j:;:
-10 "M "'0 ::1 ~ "M Right 00 j:;: Frame 0
...:I Member
-20 0 100 200 300 400 500 600
Time (msec)
FIGURE 40. LONGITUDINAL ACCELEROMETER DATA FOR MBGF BARRIER TEST.

+10
-ID ~
bO ..._,
~ 0 0 ...t 4.J 111 ... Ql
.-f Ql
\0 () Ul ()
< .-f
111
-~ -10 'lj :.:s 4-1 ..... bO s:: 0
....1
-20
-Impact
0 100
FIGURE 41.
200 300
Time (msec)
400
Frame Member
500
I.ONGITUDINAL ACCEI.EROMETER DATA FOR HBGF BARRIER TEST.
600

•
+600 - .,__Impact Cll .a
.. .-l +400 -
• <I) t.J 1-< +200 0
r:::..
~ .-l
<I) 0 = ~
ttl <I)
en -200 0 100 200 300 400
Time (msec)
FIGURE 42. SEAT BELT DATA FOR MBGF BARRIER TEST.
96

- +10 CD . 1:10 -c 0 ~ Impact ~ ~ QS ... Ql
P"4 0 Ql
u u < P"4
QS c ~ ~ ::s 4.1 ~ 1:10 c -10 0 ,.J
0
+10
-CD - Impact . 1:10 -c
0 0 ~ 4.1 QS ... Ql
P"4 Ql u u <
\ ~
\fl/'1 ....
QS c -10 ~ ., ::s ~ ~ 1:10 c 0
,.J
-20 0
FIGURE 43.
100 200
Time (msec)
r I "
100 200
Time (msec)
Left Frame Member
300 400
Right Frame Member
300 400
LONGITUDINAL ACCELEROMETER DATA FOR TEST CMB-1.
97

•
..
•
-til -00 -c: 0 ..... ..... ell .... ClJ ~
ClJ u u <
ClJ til .... ClJ > til c: ell .... ~
-til -00 -
+20
+-Impact
+10
0
-10 0 100
Time
+20
-+- Impact
200 300
(msec)
Left Frame Member
Right Frame Member
400
-10 ~------------4------------~----------~~--~------..J 0
FIGURE 44.
100 200 300
Time (msec)
TRANSVERSE ACCELF.RONETF.R DATA FOR TFST CMB-1.
(Positive acceleration is acceleration to the right of the vehicle.)
98
400

.., CJ 111
i """ !
0 0 0 N +
(SCl!) a:)~O~ 'l taca
99
0 0 N I
0 0
""
0 0 -4'
0 0 M
0 0 N
0 0 ~
0
'leas
. ~ I
~ E-1 til ~ E-1
= 0 - ror. CJ ~ < rn ~ s - ~
~ ~ s ~ .,.j llQ E-1
E til
. U"'' -4'
~ :::l ~
""" ~

- +10 en • -00 '-" -Impact c 0
..-1 .... CIS ).j Qj
.-4 Qj 0 u u < .-4
Left CIS c
Frame ..-1
"' Member ::s .... ..-1 Clli c 0 -10 ~
0 100 200 300 400
... Time (msec)
• +10
-Impact
-en -00 '-"
c 0 0 ..-1 ....
CIS ,.. Qj
.-4 Qj u u < .-4
CIS c
-10 ..-1
"' ::s .... Right ..-1 00 Frame c 0 Member ~
-20~----------~----------~----------~--------~
0 100 200 300 400
Time (msec)
FIGURE 46. LONGITUDINAL ACCELEROMETER DATA FOR TEST CMB-2.
100

+20
-IJ) . 1:10 -= +10 0
"0"4 ~
" ,.. QJ ..... QJ CJ CJ < QJ CID 0 ,.. QJ
> CID
= " ,.. E-o
-10
- +10 CID -CliO -= 0
"0"4 ~ Ill ,.. QJ
.-4 0 QJ u u ~
QJ IJ) ,.. QJ
> CID = Ill ,..
E-o -10
- Impact
0
.-Impact
0
FIGURE 47.
Left Frame Member
100 200 300
Right Frame Member
100 200 300
Time (msec)
TRANSVERSE ACCELEROMETER DATA FOR TEST CMB-2.
(Positive acceleration is acceleration to the right of the vehicle.)
101
400
400

. - • t •
•
+400r-----------,-----------~-----------..-----------,------------r-----------,
r--Ul .0 +--lmoact r-1
...... .._, 0 N +200~----------~------------r---~r+----~------------~----------~------------i
Ill tJ .... 0
fL.
.w r-1
0 ~ ,_........- ~· I !9 ' \ ), v::t ..< =:::: r<= =>- I Ill
p:)
.w 111 <li
U) -2ooL-----------~-----------L----------~~----------~-----------L----------~
0 100 200 300 400 500 600
Time (msec)
FIGURE 48. SEAT BELT DATA FOR TEST CMB-2.

-CD -00 -
-
+10 ------------~------------~-----------P------------
+-Impact
-10
Left Frame Member
-20 ~----------~-----------L----------~----------~ 0 100 200 300 400
Time (msec)
-= +10 ~------------~------------~------------~------------~ 00 -
Right Frame Member
-10 ~----------------------_.----------~~--------~ 0 100 200 300 400
Time (msec)
FIGURE 49. LONGITUDINAL ACCELEROMETER DATA FOR TEST CMB-3.
103

•
• +40
+30
-(I) .. . tiO -= +20
.. 0 ~ ~ 10 ,.. Q) ~ Q) u u < Q) (I) +10 ,.. Q)
> all
; ,.. E-4
• 0
-10
- Impact
Left Frame Member
~
_}\ ~II\ ~JV ~ ~ \A "'"A
"' 0
FIGURE 50.
\j V"'V
v
100 200 300
Time (msec)
TRANSVERSE ACCELEROMETER DATA FOR TEST CMB-3.
(Positive acceleration is acceleration to the right of the vehicle.)
104
400

+30
+20 -II) -CIO -c: 0 ~ 4.1 as ... Ql .... +10 Ql CJ CJ < Ql II) ... Ql > II) c: II ...
E-4 0
-10
........- Impact
Right Frame Member
~
J\ ~ (\ n (\A) \ f\1\ -
~~ v v- vy
0
FIGURE 51.
100 200 300
Time (msec)
TRANSVERSE ACCELEROMETER DATA FOR TEST CMB-3.
(Positive acceleration is acceleration to the right of the vehicle.)
105
400

:
-Ill .a ...... ........
QJ ()
.... 0 ~
+.1 ...... ...... 0
QJ ltl
"' +.1 Ill QJ
(/)
+400
!+--Impact +200
0 -
L..-.---- - ------200 0
•
-
4
' '
~ . ~ 1--..... I--""
100 200 300 400 500
Time (msec)
FIGURE 52. SFAT BELT DATA FOR TEST CMB-3.

- +10 (I) -00 -= Impact 0 ~ .u Ill 1-i G.l ~
G.l 0 u u < ~ Ill
= ~ ~ = .u ~ 00
= 0 -10 ~
0
-; +10 -00 -Impact
0
-10 0
FIGURE 53.
100
100
200
Time (msec)
200
Time (msec)
300
300
Left Frame Member
Right Frame Member
LONGITUDINAL ACCELEROMETER DATA FOR TEST CMB-4.
107
400
400

•
•
•
...... Ill -co .._,
c: 0
'P'4 4-1 111
"" • QJ ......
QJ (J (J
< QJ Ill
"" QJ > Ill c: 111
"" j-<
•
+20
-Impact
+10
0
-10 0 100 200
Time (msec)
300
Left Frame Member
400
+20 r----~---------~------------T-------------~------------~
-Impact
+10
0
-10 0
FIGURE 54.
100 200
Time (msec)
300
Right Frame Member
TRANSVERSE ACCELEROMETER DATA FOR TEST CMB-4 •
(Positive acceleration is acceleration to the right of the vehicle.)
108
400

-t.O ..0 +400 ~ - ..,_Impact Ql +200 (J ... 0
J;a..
... 0 ~ Ql = -200 ...
0 «< 100 200 300 Q)
en Time (msec)
FIGURE 55. SEAT BELT DATA FOR TEST CMB-4.
109