Embed Size (px)
Citation preview

Vg 1-1 (7-00)
Washington, D.C.
Vegetables
Released July 10, 2000, by the National Agricultural Statistics Service (NASS), Agricultural Statistics Board, U.S. Department ofAgriculture. For information on "Vegetables" call Biz Wallingsford at 202-720-2157 or Debbie Flippin at 202-720-3250, office hours 7:30a.m. to 4:00 p.m. ET.
Fresh Vegetables Harvested Acreage Down 2 Percent
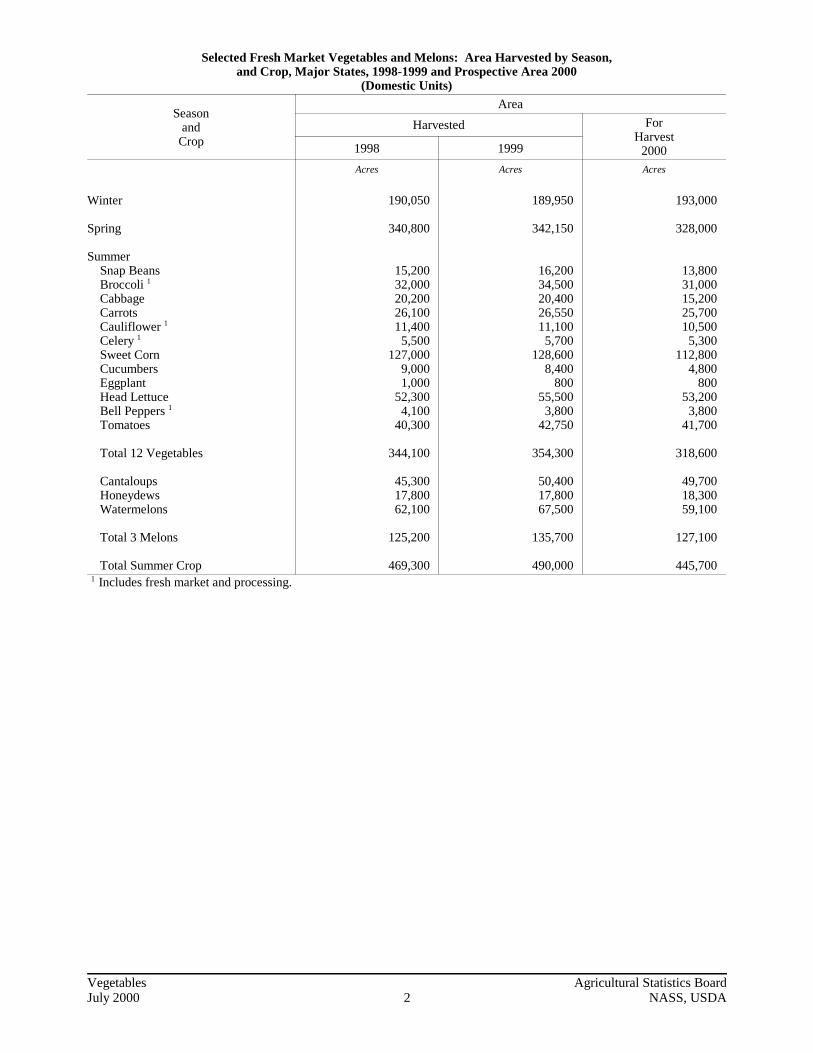
The prospective area for harvest of 12 selected fresh market vegetables during the summer quarter isforecast at 318,600 acres, down 2 percent from last year but 1 percent above 1998 for comparable states. Acreage increased for cabbage, carrots, cauliflower, and tomatoes. Acreage decreased for snap beans,broccoli, celery, sweet corn, and head lettuce. Cucumbers, eggplant, and bell peppers remained thesame. Area forecasted for melon harvest is 127,100 acres, down 5 percent from last year for comparablestates. Cantaloup acreage is forecast at 49,700 acres, down 4 percent from 1999. Honeydew acreage,forecasted at 18,300 acres, is up 3 percent. Watermelon acreage is forecast at 59,100 acres, down8 percent from last year for comparable states.
Spring strawberry production is forecast at 16.8 million cwt, up 7 percent from last year. Area forharvest, at 32,850 acres, was up 7 percent from comparable states in 1999.
Onion Acreage Down 8 Percent
Onion growers expect to harvest 165,630 acres of onions in 2000. This is down 8 percent from thecomparable states of last year. Spring onion growers harvested 34,700 acres, down 7 percent from lastyear. Summer, non-storage onion growers expect to harvest 21,500 acres, up 6 percent from comparableacreage last year. Storage onion growers (including California) plan to harvest from 109,430 acres in2000, down 10 percent from last year. California plans to harvest 36,300 acres, down 7 percent fromlast year.
Processed Vegetable Contracted Acreage Down 2 Percent
Vegetable processors have contracted 1.37 million acres to be planted to the five major vegetable crops(snap beans, sweet corn, cucumbers for pickles, green peas, and tomatoes). This acreage is down2 percent from last year for comparable states. Acreage changes vary from 15 percent down fortomatoes to 6 percent up for green peas. Green pea production, at 499,920 tons, is up 9 percent forcomparable states in 1999. Contracted tomato production is forecast at 10.5 million tons, down16 percent from 1999 for comparable states.
Vegetables Agricultural Statistics BoardJuly 2000 2 NASS, USDA
Selected Fresh Market Vegetables and Melons: Area Harvested by Season,and Crop, Major States, 1998-1999 and Prospective Area 2000
(Domestic Units)
SeasonandCrop
Area
Harvested ForHarvest20001998 1999
Acres Acres Acres
Winter
Spring
Summer Snap Beans Broccoli 1
Cabbage Carrots Cauliflower 1
Celery 1
Sweet Corn Cucumbers Eggplant Head Lettuce Bell Peppers 1
Tomatoes
Total 12 Vegetables
Cantaloups Honeydews Watermelons
Total 3 Melons
Total Summer Crop
190,050
340,800
15,20032,00020,20026,10011,4005,500
127,0009,0001,000
52,3004,100
40,300
344,100
45,30017,80062,100
125,200
469,300
189,950
342,150
16,20034,50020,40026,55011,1005,700
128,6008,400
80055,5003,800
42,750
354,300
50,40017,80067,500
135,700
490,000
193,000
328,000
13,80031,00015,20025,70010,5005,300
112,8004,800
80053,2003,800
41,700
318,600
49,70018,30059,100
127,100
445,700 1 Includes fresh market and processing.

Vegetables Agricultural Statistics BoardJuly 2000 3 NASS, USDA
Selected Fresh Market Vegetables and Melons: Area Harvested by Season,and Crop, Major States, 1998-1999 and Prospective Area 2000
(Metric Units)
SeasonandCrop
Area
Harvested ForHarvest20001998 1999
Hectares Hectares Hectares
Winter
Spring
Summer Snap Beans Broccoli 1
Cabbage Carrots Cauliflower 1
Celery 1
Sweet Corn Cucumbers Eggplant Head Lettuce Bell Peppers 1
Tomatoes
Total 12 Vegetables 2
Cantaloups Honeydews Watermelons
Total 3 Melons 2
Total Summer Crop 2
76,910
137,920
6,15012,9508,170
10,5604,6102,230
51,4003,640
40021,1701,660
16,310
139,250
18,3307,200
25,130
50,670
189,920
76,870
138,460
6,56013,9608,260
10,7404,4902,310
52,0403,400
32022,4601,540
17,300
143,380
20,4007,200
27,320
54,920
198,300
78,110
132,740
5,58012,5506,150
10,4004,2502,140
45,6501,940
32021,5301,540
16,880
128,930
20,1107,410
23,920
51,440
180,370 1 Includes fresh market and processing. 2 Totals may not add due to rounding.

Vegetables Agricultural Statistics BoardJuly 2000 4 NASS, USDA
Selected Fresh Market Vegetables and Melons: Area Harvested by Crop,State, and Total, Summer Season, 1998-1999 and Prospective Area 2000
CropandState
UsualHarvestPeriod
Area 2000Area forHarvest
as Percentof 1999
Harvested ForHarvest20001998 1999
Acres Acres Acres Percent
Snap Beans GA MD 1
MI NY VA
Total 2
Broccoli 3
CA
Cabbage GA MI NY OH 1
WI 1
Total 4
Cantaloups CA GA SC 5
TX
Total 6
Carrots CA MI NY 7
WA 1
Total 8
Cauliflower 3
CA NY 1
Total 9
Jul-SepJul-SepJul-OctJul-SepJul-Sep
Jul-Sep
Jul-SepJun-NovAug-SepJul-SepAug-Oct
Jul-SepJul-SepJun-OctJul-Sep
Jun-SepJul-NovAug-NovJul-Dec
Jul-SepJul-Dec
3,2001,5002,1005,3003,100
15,200
32,000
5001,700
12,1001,2004,700
20,200
38,0002,000
5,300
45,300
18,0004,600
5003,000
26,100
10,0001,400
11,400
3,5001,8002,2006,1002,600
16,200
34,500
5001,800
12,1001,3004,700
20,400
42,5002,500
5,400
50,400
18,5004,700
7502,600
26,550
10,0001,100
11,100
2,500
2,0006,7002,600
13,800
31,000
4001,800
13,000
15,200
40,0002,5001,5005,700
49,700
21,0004,700
25,700
10,500
10,500
71
91110100
96
90
80100107
106
94100
106
96
114100
111
105
105See footnotes at end of table. --continued

Vegetables Agricultural Statistics BoardJuly 2000 5 NASS, USDA
Selected Fresh Market Vegetables and Melons: Area Harvestedby Crop, State, and Total, Summer Season,
1998-1999 and Prospective Area 2000 (continued)
CropandState
UsualHarvestPeriod
Area 2000Area forHarvest
as Percentof 1999
Harvested ForHarvest20001998 1999
Acres Acres Acres Percent
Celery 3
CA
Sweet Corn CA CT 1
IL MA 1
MI NJ NY NC OH PA WI
Total 10
Cucumbers NJ NY 1
VA
Total 9
Eggplant NJ
Honeydews AZ CA
Total
Head Lettuce CA CO NY 7
Total 9
Bell Peppers 3
NJ
Jul-Sep
Jul-SepJul-OctJul-OctJul-OctJul-OctJul-OctAug-SepJun-AugJul-OctJul-SepAug-Sep
Jun-OctAug-SepJul-Sep
Jul-Nov
Jun-JulJul-Sep
Jul-SepJun-SepJun-Sep
Jul-Oct
5,500
13,9004,5006,8006,400
10,00010,60029,2006,600
14,00017,1007,900
127,000
3,1003,8002,100
9,000
1,000
2,80015,000
17,800
49,0002,700
600
52,300
4,100
5,700
13,5003,8006,9006,300
10,6008,000
33,7007,000
15,10015,8007,900
128,600
3,0003,6001,800
8,400
800
2,80015,000
17,800
53,0002,000
500
55,500
3,800
5,300
12,000
5,500
10,60010,50026,9008,100
15,00017,0007,200
112,800
3,000
1,800
4,800
800
2,70015,600
18,300
52,0001,200
53,200
3,800
93
89
80
10013180
11699
10891
95
100
100
100
100
96104
103
9860
97
100See footnotes at end of table. --continued
Vegetables Agricultural Statistics BoardJuly 2000 6 NASS, USDA
Selected Fresh Market Vegetables and Melons: Area Harvestedby Crop, State, and Total, Summer Season,
1998-1999 and Prospective Area 2000 (continued)
CropandState
UsualHarvestPeriod
Area 2000Area forHarvest
as Percentof 1999
Harvested ForHarvest20001998 1999
Acres Acres Acres Percent
Tomatoes AL 1
AR 1
CA MI NJ NY PA VA
Total 11
Watermelons AL 1
CA GA MS SC TX
Total 12
Jul-SepJul-SepJul-SepJul-SepJul-OctAug-SepJul-SepJul-Sep
Jul-SepJul-SepJul-SepJun-SepMay-AugJul-Sep
900700
21,0002,3003,9003,3004,4003,800
40,300
2,10010,90023,0003,4008,800
13,900
62,100
1,000750
24,0002,6003,6003,1003,8003,900
42,750
3,10010,50025,0003,2009,500
16,200
67,500
24,0002,4003,6003,1004,7003,900
41,700
9,30021,0002,8008,000
18,000
59,100
10092
100100124100
102
89848884
111
92 1 Seasonal estimate discontinued. Estimate to be published in Vegetable 2000 Summary, released January 2001. 2 Percent calculated excluding MD. 3 Includes fresh market and processing. 4 Percent calculated excluding OH and WI. 5 Added to vegetable program in 2000. 6 Percent calculated excluding SC. 7 Estimate discontinued in 2000. 8 Percent calculated excluding NY and WA. 9 Percent calculated excluding NY.10 Percent calculated excluding CT and MA.11 Percent calculated excluding AL and AR.12 Percent calculated excluding AL.

Vegetables Agricultural Statistics BoardJuly 2000 7 NASS, USDA
Snap Beans: Summer fresh market acreage for harvest is forecast at 13,800 acres, down 4 percent fromcomparable states last year but 1 percent more than comparable states in 1998. Michigan growers areexperiencing a good season with no disease problems reported. In New York, planting was behindschedule due to heavy, frequent rains and a record-breaking rainstorm in June which left behind standingwater and washed out fields. In addition, the New York crop has been experiencing cool weather whichslowed development. Virginia harvest is expected to be slightly later than normal because of cooltemperatures and wet conditions, but a few days of warm weather should enable the crop to catch up.
Broccoli: California's acreage for summer harvest is forecast at 31,000 acres, down 10 percent from lastyear and 3 percent less than 1998. The California broccoli crop is doing well with no unusual pest ordisease problems reported.
Cabbage: Fresh market acreage for harvest is forecast at 15,200 acres, up 6 percent from comparablestates in 1999 and 1998. Georgia continues to suffer from drought conditions. In Michigan, cabbageplants have responded well to the early cool, rainy weather. The cabbage season in New York startedout wet and rainy with most fields too wet and sticky to get into. Growers were able to plant but laterrains washed out seed beds and left transplants in standing water. The Finger Lakes region reports earlyplants growing well. Long Island planting was behind schedule because of wet conditions but plantdevelopment is on schedule.
Cantaloups: Summer cantaloup acreage for harvest is forecast at 49,700 acres, down 4 percent fromcomparable states last year but 6 percent greater than the same states in 1998. Southern Californiaharvest ended two weeks early due to excellent growing and harvest conditions. The Texas crop islooking good with many areas experiencing optimal rainfall recently.
Carrots: Acreage for fresh market harvest is forecast at 25,700 acres, up 11 percent from comparablestates last year and 14 percent above 1998 comparable states. California growers report good quality andfew problems with their carrot crop. Kern County continues to produce carrots year-round. Michigangrowers had favorable weather for early planting, but heavy rains after planting made it necessary toreplant some acreage. Initial planting of some acreage was delayed because of the rain. At this time, thecrop is progressing satisfactorily and not disease problems have been reported.
Cauliflower: Acreage for summer harvest is forecast at 10,500 acres, up 5 percent from comparablestates in 1999 and 1998. In California, quality and yield are expected to be good this season. No majorpest or disease problems have been reported.
Celery: California's summer acreage for harvest is forecast at 5,300 acres, down 7 percent from 1999and 4 percent below 1998. The summer celery crop in Salinas has benefitted from favorable weatherand harvest has begun two weeks early as a result.
Sweet Corn: Fresh market acreage for harvest is forecast at 112,800 acres, down 5 percent fromcomparable states last year and 3 percent below comparable states in 1998. California sweet corn isprogressing well with no problems reported. Michigan crop development was slowed by cool, wetweather but responded well to recent warm temperatures. Early plantings had tassels in late June. NewJersey plantings were on schedule and development is ahead of schedule this season. Acreage is downin New York due to the wet spring which prevented many growers from completing their planting. North Carolina conditions were dryer than normal in May resulting in a later harvest than usual. Ohiosweet corn is currently tasseling. Wisconsin late planting was delayed due to heavy rains.

Vegetables Agricultural Statistics BoardJuly 2000 8 NASS, USDA
Cucumbers: Acreage for summer harvest is forecast at 4,800 acres, the same as comparable states lastyear but 8 percent below comparable states in 1998. Early plantings in New Jersey were adverselyaffected by the cold conditions. Recent hot and humid conditions have been beneficial.
Eggplant: New Jersey’s acreage for summer harvest is forecast at 800 acres, unchanged from 1999 but20 percent below 1998. Harvest of regular eggplant is expected to start the second week of July.
Honeydews: Fresh market acreage for summer harvest is forecast at 18,300 acres, up 3 percent fromlast year and the year before. The market remains strong due to good demand.
Head Lettuce: Acreage for summer harvest is forecast at 53,200 acres, down 3 percent fromcomparable states last year but up 3 percent from comparable states in 1998. The San Joaquin Valley inCalifornia continues harvest. Short periods of rain this spring caused minimal delay for summerplanting. The Colorado growing season has been favorable so far.
Bell Peppers: New Jersey’s acreage for summer harvest is forecast at 3,800 acres, the same as last yearbut 7 percent below 1998.
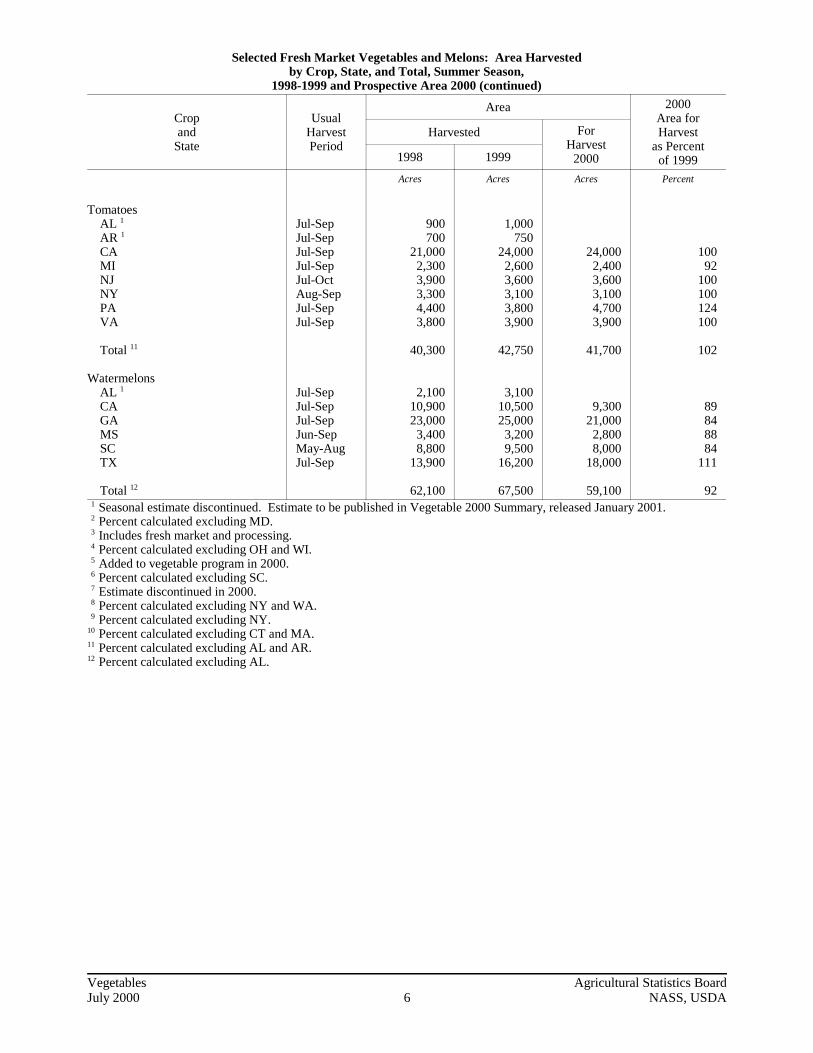
Tomatoes: Fresh market acreage for summer harvest is forecast at 41,700 acres, up 2 percent fromcomparable states last year and 8 percent greater for the same states in 1998. California tomatoes weretransplanted in April and May. Some young transplants were affected by heavy rain and hail in lateApril but as of early June, the crop is reported in good condition. Michigan tomatoes are developingnormally despite late spring rains and cool weather which slowed progress. The New Jersey seasonbegan with light harvest the last week of June, one week early. Sufficient rainfall and high humidity inJune promoted quicker development of the crop.
Watermelons: Summer acreage for harvest is forecast at 59,100 acres, down 8 percent fromcomparable states in 1999 and 1 percent below comparable states in 1998. California harvest in thesouthern desert was two weeks earlier than normal due to excellent growing conditions. Some desertshippers that normally market watermelons past the fourth of July were finished by the third week ofJune. Georgia growers were forced to irrigate because of hot, dry conditions. South Carolinawatermelon acreage decreased due to an extremely dry spring. Texas has received a lot of good rainfalllately and the crop is progressing well.

Vegetables Agricultural Statistics BoardJuly 2000 9 NASS, USDA
Strawberries: Area Harvested, Yield, and Productionby Season, State, and Total, 1998-2000 1
SeasonandState
Area Yield per Acre Production
Harvested ForHarvest2000
1998 1999 2000 1998 1999 20001998 1999
Acres Acres Acres Cwt Cwt Cwt 1,000 Cwt 1,000 Cwt 1,000 Cwt
Winter FL
Spring CA MI NJ OR WA 2
Major Sts
Total
6,200
24,2001,400
4504,4001,500
31,950
38,150
6,200
24,6001,400
4504,2001,500
32,150
38,350
6,300
27,6001,300
4503,500
32,850
39,150
260
5606844
11580
447
417
300
61564449980
491
461
340
5906745
110
511
483
1,612
13,5529520
506120
14,293
15,905
1,860
15,1559020
416120
15,801
17,661
2,142
16,2848720
385
16,776
18,918 1 Includes fresh market and processing. 2 Seasonal estimate discontinued. Estimate to be published in Vegetable 2000 Summary, released January 2001.
Strawberries: Spring strawberry production in the U.S. is estimated at 16.8 million cwt, up 7 percentfrom comparable states last year and 18 percent more than comparable states in 1998. Acres harvested,at 32,850 acres, was up 7 percent from comparable states last year and 8 percent more than comparablestates in 1998. In California, warm temperatures during December and January in the southern areashelped to get strawberry production off to a good start. Production slowed during the second half ofFebruary due to excessive rainfall, but improved weather during March allowed the crop to bounce back. In Michigan, wet weather and cool to moderate temperatures in May and June have allowed for anextended growing season. New Jersey harvest began a week early with good fruit size and quality. Oregon reports very good quality in the early season but the second pick had more fruit rot due to rainyweather. Oregon harvest peaked about June 20.

Vegetables Agricultural Statistics BoardJuly 2000 10 NASS, USDA
Onions: Area Planted and Harvested, and Yield Per Acreby Season, State, and United States, 1999-2000 1
SeasonandState
Area Planted Area Harvested Yield per Acre
1999 2000 1999 2000 1999 2000
Acres Acres Acres Acres Acres Acres
Spring 2
AZ CA GA TX
Total
Summer Non-storage 2
CA 3
NV 4
NM TX WA
Total
Storage 5
CA 6
CO ID MI MN NY OH OR Malheur Other UT WA WI
Total
Summer
US
3,0007,500
16,00013,800
40,300
3,2008,3003,800
850
16,150
41,60015,5008,1004,100
48013,000
480
13,0007,3002,800
18,3002,300
126,960
143,110
183,410
3,1007,200
13,00015,900
39,200
6,5003,2008,0004,100
800
22,600
38,00012,0007,6003,800
30013,400
480
11,7006,2002,500
15,3002,100
113,380
135,980
175,180
3,0007,300
14,50012,700
37,500
2,8007,3003,500
800
14,400
39,00014,5007,9004,000
42012,600
480
12,9007,2002,700
18,0001,800
121,500
135,900
173,400
3,1007,100
11,00013,500
34,700
6,2003,0007,8003,700
800
21,500
36,30011,5007,4003,600
15012,900
480
11,6006,1002,400
15,0002,000
109,430
130,930
165,630
545440190285
299
560450400360
454
435375700270280280285
670500465490380
459
459
424
450435250310
329
395540460370330
432
1 Estimates for 1999 revised. 2 Primarily fresh market. 3 Added to vegetable program in 2000. 4 Seasonal estimates beginning in 2000. 5 Yield and production for 2000 will be published September 8, 2000. 6 Revised for 1999. Primarily dehydrated and other processing.

Vegetables Agricultural Statistics BoardJuly 2000 11 NASS, USDA
Onions: Production, Shrinkage and Lossby Season, State, and United States, 1998-2000 1
SeasonandState
Production Shrinkage and Loss
1998 1999 Ind 2000 1998 1999
1,000 Cwt 1,000 Cwt 1,000 Cwt 1,000 Cwt 1,000 Cwt
Spring 2
AZ CA GA TX
Total
Summer Non-storage 2
CA 3
NV 4
NM TX WA
Total
Storage 5
CA 6
CO ID MI MN NY OH OR Malheur Other UT WA WI
Total
Summer
US
1,1754,0502,2242,907
10,356
9243,3121,160
255
5,651
14,3886,0804,6401,092
1503,750
161
6,1203,3001,0568,500
780
50,017
55,668
66,024
1,6353,2122,7553,620
11,222
1,5683,2851,400
288
6,541
16,9655,4385,5301,080
1183,528
137
8,6433,6001,2568,820
684
55,799
62,340
73,562
1,3953,0892,7504,185
11,419
2,4491,6203,5881,369
264
9,290
2501,090
610218
356320
1,34636399
1,75056
6,368
6,368
6,368
2501,7671,300
21680
59614
1,729757265
1,77082
8,826
8,826
8,826 1 Estimates for 1999 revised. Shrinkage and loss for 2000 will be published in the Vegetable 2000 Summary, released
January 2001. 2 Primarily fresh market. 3 Added to vegetable program in 2000. 4 Seasonal estimates beginning in 2000. 5 Yield and production for 2000 will be published September 8, 2000. 6 Revised for 1999. Primarily dehydrated and other processing.

Vegetables Agricultural Statistics BoardJuly 2000 12 NASS, USDA
Onions: Price and Value by Season, State,and United States, 1998-1999 1
SeasonandState
Value Per Cwt Total Value
1998 1999 1998 1999
Dollars Dollars 1,000 Dollars 1,000 Dollars
Spring 2
AZ CA GA TX
Total
Summer Non-storage 2
NV NM TX WA
Total
Storage CA 3
CO ID MI MN NY OH OR Malheur Other UT WA WI
Total
Summer
US
15.3014.1030.9021.70
20.00
14.0013.0023.4026.00
15.90
9.7016.2013.0011.008.00
16.309.30
13.0013.4011.0011.507.60
12.10
12.60
13.80
5.5311.9027.1017.40
16.50
8.5016.0022.0024.40
15.90
7.5311.205.40
10.006.00
12.208.00
5.106.405.806.358.00
7.33
8.37
9.78
17,97857,10568,72263,082
206,887
12,93643,05627,1446,630
89,766
137,13980,83852,3909,6141,176
51,9481,311
62,06239,35610,52777,6255,502
529,488
619,254
826,141
9,04238,22374,66162,988
184,914
13,32852,56030,8007,027
103,715
125,93641,11522,8428,640
22835,770
984
35,26118,1955,748
44,7684,816
344,303
448,018
632,932 1 1999 revised. 2 Primarily fresh. 3 Primarily dehydrated and other processing.

Vegetables Agricultural Statistics BoardJuly 2000 13 NASS, USDA
Spring Onions: Production of spring onions in 2000 was estimated at 11.4 million cwt, up 2 percentfrom last year and 10 percent above 1998. The crop was produced on 34,700 harvested acres, averaging329 cwt per acre. California growers have had favorable weather for the 2000 spring onion crop. Lateseason rain caused minimal damage and harvest progressed smoothly. Conditions in Georgia are verydry causing more abandonment than in previous years. In Texas, yields were good despite abandonmentof some acreage in the Rio Grande area due to heavy rains and decay.
Summer, Non-Storage Onions: Production of non-storage onions is forecast at 9.29 million cwt, up5 percent from last year’s comparable states. Harvested area covers 21,500 acres, up 6 percent from lastyear’s comparable states. Favorable weather in California has allowed the crop to progress normallywith good quality. Irrigation water supplies have been sufficient in most areas of California. Nevadagrowers have reported some acreage lost to frost which has been reseeded. Empire onions are in goodcondition and the Yerington crop is excellent. Over one third of the New Mexico crop has beenharvested with growers reporting good quality and low prices. West Texas had heavy rains at harvesttime causing growers to abandon some of their acreage.
Summer, Storage Onions: Growers expect to harvest 109,430 acres of storage onions (includingCalifornia) this year, down 10 percent from last year. The California crop is good quality and onschedule due to favorable weather conditions. Colorado acreage is down due to previous years lowprices brought by overproduction. Colorado quality is mostly good to excellent as a result of warmtemperatures and limited moisture in May and June. Michigan growers were able to complete plantingearly due to warm temperatures. Most acreage in Minnesota was drowned out by excessive rains. NewYork onion development has been behind schedule due to recent cool, wet weather, but growers areoptimistic that a few hot, dry days will allow them to catch up. Ohio has received above averageprecipitation since April 1 which does not seem to have affected the onion crop. Oregon growers arehaving no major problems. Planting was late in some areas due to rain but progress is good so far. Utahand Washington growers are planting less acreage in reaction to last years low prices.
1999 Storage Onions, Revised: The final tally of 1999 storage onion production was 55.8 million cwt(including California), up 12 percent from 1998. Harvested acreage, at 121,500 acres, was 5 percentabove 1998 acreage. Average yield of 459 cwt per acre, was up 25 cwt from 1998. The 1999 storagecrop was valued at $344 million, a decrease of 35 percent from 1998. Average price per cwt decreasedfrom $12.10 in 1998 to $7.33 in 1999. With spring and non-storage summer onions added in, total valueof 1999 harvested onions was $633 million, down 23 percent from 1998.

Vegetables Agricultural Statistics BoardJuly 2000 14 NASS, USDA
Processing Vegetables: Area Planted, Production, and ExpectedUtilization by Crop, United States, 1998-2000
(Domestic Units)
UtilizationandCrop
Area Planted Contract2000 as
% of 19991998Total
1999 2000Contract 1Total Contract 1
Acres Acres Acres Acres Percent
All Processing
Snap Beans 2
Sweet Corn Cucumbers for Pickles 3
Green Peas 4
Tomatoes 5
Total 2 3 4 5
Canning
Snap Beans 2
Sweet Corn Cucumbers for Pickles 3
Green Peas 4
Tomatoes 5
Total Canning 2 3 4 5
Freezing
Snap Beans 2
Sweet Corn Green Peas 4
Total Freezing 2 4
208,600486,400
105,970299,000302,560
1,402,530
136,400267,400
105,970127,250302,560
939,580
72,200219,000171,750
462,950
218,410473,400
107,130287,740359,120
1,445,800
152,270259,900
107,130121,800359,120
1,000,220
66,140213,500165,940
445,580
209,210473,100
86,370287,740354,010
1,410,430
146,070259,700
86,370121,800354,010
967,950
63,140213,400165,940
442,480
207,480470,000
86,690302,300300,000
1,366,470
138,580272,100
86,690135,000300,000
932,370
68,900197,900167,300
434,100
10399
10410685
98
100105
10411185
97
10993
102
98
Production Contract2000 as
% of 19991998Total
1999 2000Contract 1Total Contract 1
Tons Tons Tons Tons Percent
All Processing
Green Peas 4
Tomatoes 5
Total 4 5
483,9009,402,010
9,885,910
461,59012,836,020
13,297,610
461,59012,583,840
13,045,430
499,92010,487,420
10,987,340
10984
84 1 Includes acreage from major brokers. 2 Percent calculated excluding AR, MO, OK, and SC for 1999. 3 Percent calculated excluding LA, MN, NJ, and OR for 1999. 4 Percent calculated excluding PA and TN for 1999. 5 Percent calculated excluding DE and MD for 1999.

Vegetables Agricultural Statistics BoardJuly 2000 15 NASS, USDA
Processing Vegetables: Area Planted, Production, and ExpectedUtilization by Crop, United States, 1998-2000
(Metric Units)
UtilizationandCrop
Area Planted
1998Total
1999 2000Contract 1Total Contract 1
Hectares Hectares Hectares Hectares
All Processing
Snap Beans Sweet Corn Cucumbers for Pickles Green Peas Tomatoes
Total
Canning 2
Snap Beans Sweet Corn Cucumbers for Pickles Green Peas Tomatoes
Total Canning
Freezing 2
Snap Beans Sweet Corn Green Peas
Total Freezing
84,420196,840
42,880121,000122,440
567,590
55,200108,210
42,88051,500
122,440
380,240
29,22088,63069,510
187,350
88,390191,580
43,350116,450145,330
585,100
61,620105,180
43,35049,290
145,330
404,780
26,77086,40067,150
180,320
84,670191,460
34,950116,450143,260
570,790
59,110105,100
34,95049,290
143,260
391,720
25,55086,36067,150
179,070
83,970190,200
35,080122,340121,410
553,000
56,080110,120
35,08054,630
121,410
377,320
27,88080,09067,700
175,680
Production
1998Total
1999 2000Contract 1Total Contract 1
Metric Tons Metric Tons Metric Tons Metric Tons
All Processing
Green Peas Tomatoes
Total
438,9808,529,320
8,968,300
418,75011,644,580
12,063,330
418,75011,415,810
11,834,550
453,5209,513,980
9,967,500 1 Includes acreage from major brokers. 2 Utilization may not add to total crop because of rounding.

Vegetables Agricultural Statistics BoardJuly 2000 16 NASS, USDA
Snap Beans for Processing: Area Planted by Stateand Utilization, United States, 1998-2000
Stateand
Utilization
Area Planted Contract2000 as
% of 19991998Total
1999 2000Contract 1Total Contract 1
Acres Acres Acres Acres Percent
ILINMINYORPAWI
Oth Sts 2 3
US 3
Canning 3
Freezing 3
14,7004,300
21,50021,20023,3006,800
66,900
49,900
208,600
136,400
72,200
14,5004,700
28,00021,50023,1008,400
66,200
52,010
218,410
152,270
66,140
14,2004,700
26,00021,50023,1008,400
64,200
47,110
209,210
146,070
63,140
15,0006,800
22,00022,10023,0006,000
72,200
40,380
207,480
138,580
68,900
10614585
10310071
112
100
103
100
109 1 Includes acreage from major brokers. 2 1998 - AR, CA, DE, FL, GA, MD, MN, MO, NJ, NC, OH, OK, TN, TX, VA, and WA.
1999 - AR, CA, DE, FL, GA, MD, MN, MO, NJ, NC, OH, OK, SC, TN, TX, VA, andWA.2000 - CA, DE, FL, GA, MD, MN, NC, NJ, OH, TN, TX, and VA.
3 Percent calculated excluding AR, MO, OK, and SC for 1999.

Vegetables Agricultural Statistics BoardJuly 2000 17 NASS, USDA
Sweet Corn for Processing: Area Planted by Stateand Utilization, United States, 1998-2000
Stateand
Utilization
Area Planted Contract2000 as
% of 19991998Total
1999 2000Contract 1Total Contract 1
Acres Acres Acres Acres Percent
IDILMNNY 2
ORPAWAWI
Oth Sts 3 4
US
Canning
Freezing
16,80014,600
131,90042,00037,4003,100
101,500111,600
27,500
486,400
267,400
219,000
15,80016,600
127,40033,10044,2002,800
99,400107,100
27,000
473,400
259,900
213,500
15,80016,400
127,40033,00044,2002,800
99,400107,100
27,000
473,100
259,700
213,400
20,20018,600
134,200
35,6002,500
99,50094,400
65,000
470,000
272,100
197,900
128113105
8189
10088
108
99
105
93 1 Includes acreage from major brokers. 2 Not published to avoid disclosure of individual operations. 2000 data included in other states. 3 1998 - DE, IA, MD, NJ, TN and VA.
1999 - DE, IA, MD, NJ, and TN.2000 - DE, IA, MD, NJ, NY, and TN.
4 Percent calculated with NY added to others states for 1999.
Vegetables Agricultural Statistics BoardJuly 2000 18 NASS, USDA
Cucumbers for Pickles: Area Planted by Stateand United States, 1998-2000
State
Area Planted Contract2000 as
% of 19991998Total
1999 2000 Contract 1
Total Contract 1 Early Late AllAcres Acres Acres Acres Acres Acres Percent
CACO 2
FLINMINCOHSCTXWI
Oth Sts 3 4
US 4
4,600160
7,1002,100
27,00018,2003,0002,1009,9004,300
27,510
105,970
4,500
6,8001,800
27,00017,2002,7001,700
10,2004,000
31,230
107,130
4,500
3,7001,800
23,0008,0002,7001,6007,5003,800
29,770
86,370
*
3,7001,200
23,00010,5002,5003,0001,7004,500
24,590
74,690
*
2,300
800
5,300
3,600
12,000
*
6,0001,200
23,00011,3002,5003,0007,0004,500
28,190
86,690
16267
10014193
18893
118
106
104* Not published to avoid disclosure of individual operations. 1 Includes acreage from major brokers. 2 Estimate discontinued in 1999. 3 1998-1999 - AL, DE, GA, LA, MD, MA, MN, MO, NJ, NY, OR, VA, and WA.
2000 - AL, CA, DE, GA, MD, MA, MO, and VA. 4 Percent calculated excluding LA, MN, NJ, and OR for 1999.

Vegetables Agricultural Statistics BoardJuly 2000 19 NASS, USDA
Green Peas for Processing: Area Planted, Harvested, Yield and Productionby State and Utilization, United States, 1998-2000
Stateand
Utilization
Area Planted Contract2000 as
% of 19991998Total
1999 2000Contract 1Total Contract 1
Acres Acres Acres Acres Percent
MNNYORWAWI
Oth Sts 2 3
US 3
Canning 3
Freezing 3
88,00019,60031,30056,40057,400
46,300
299,000
127,250
171,750
91,10015,50035,80053,30046,800
45,240
287,740
121,800
165,940
91,10015,50035,80053,30046,800
45,240
287,740
121,800
165,940
93,80016,50033,90061,00052,100
45,000
302,300
135,000
167,300
10310695
114111
105
106
111
102
Area Harvested
1998Total
1999 Indicated2000
Contract 1Total Contract 1
Acres Acres Acres Acres
MNNYORWAWI
Oth Sts 2
US
72,90017,50030,60055,10053,600
44,200
273,900
81,40014,90035,40052,30043,700
43,940
271,640
81,40014,90035,40052,30043,700
43,940
271,640
83,30015,80032,80061,00049,100
41,300
283,300
Yield per Acre Production
1998Total
1999Total
Indicated2000
Contract 11998Total
1999 Indicated2000
Contract 1Total Contract 1
Tons Tons Tons Tons Tons Tons Tons
MNNYORWAWI
Oth Sts 2
US
1.622.201.612.001.72
1.72
1.77
1.512.131.351.881.86
1.80
1.70
1.652.001.601.951.70
1.84
1.76
118,25038,50049,260
109,95092,130
75,810
483,900
122,84031,73047,85098,43081,430
79,310
461,590
122,84031,73047,85098,43081,430
79,310
461,590
137,45031,60052,480
118,95083,470
75,970
499,920 1 Includes acreage from major brokers. 2 1998-1999 - CA, DE, ID, IL, IA, ME, MD, MI, NJ, PA, and TN.
2000 - CA, DE, ID, IL, IA, ME, MD, MI, and NJ. 3 Percent calculated excluding PA and TN for 1999.

Vegetables Agricultural Statistics BoardJuly 2000 20 NASS, USDA
Tomatoes for Processing: Area Planted and Productionby State and United States, 1998-2000
State
Area Planted Contract2000 as
% of 19991998Total
1999 2000Contract 1Total Contract 1
Acres Acres Acres Acres Percent
CAINMIOHPA 2
Oth Sts 3 4 5
US 5
282,0007,2002,6006,7001,300
2,760
302,560
337,0007,3002,9007,9001,600
2,420
359,120
332,0007,3002,8007,9001,600
2,410
354,010
282,0007,3002,4005,500
2,800
300,000
851008670
94
85
Production Contract2000 as
% of 19991998Total
1999 2000Contract 1Total Contract 1
Tons Tons Tons Tons Percent
CAINMIOHPA 2
Oth Sts 3 4 5
US 5
8,892,800156,20090,000
169,09033,800
60,120
9,402,010
12,239,300215,14087,000
212,32031,500
50,760
12,836,020
11,990,270215,14084,000
212,32031,500
50,610
12,583,840
10,000,000196,02072,000
146,600
72,800
10,487,420
83918669
128
84 1 Includes acreage from major brokers. 2 Not published to avoid disclosure of individual operations. 2000 data included in other states. 3 1998 - DE, MD, NJ, NY, and TX.
1999 - DE, MD, NJ, NY, and VA.2000 - NJ and PA.
4 Percent calculated with PA added to other states for 1999. 5 Percent calculated excluding DE and MD for 1999.

Vegetables Agricultural Statistics BoardJuly 2000 21 NASS, USDA
Snap Beans: Processors contracted 207,480 acres for harvest in 2000, up 3 percent from the previousyear’s comparable states. Canning acreage, at 138,580 acres, is virtually unchanged from last year forcomparable states. Area contracted for freezing, at 68,900 acres, is up 9 percent from 1999. TheMichigan crop is progressing normally and no disease problems have been reported. New York growersare behind due to excessive rain and wet fields but expect to deliver on most of their contracts. Pennsylvania was able to plant ahead of schedule and growing conditions have been good although morerain and warm weather is needed.
Sweet Corn: Processors contracted 470,000 acres for harvest in 2000, down 1 percent from last year. Canning acreage, at 272,100 acres, is up 5 percent from 1999. Area contracted for freezing, at197,900 acres, is down 7 percent from last year. Idaho is progressing as expected under warm, dryconditions. Heavy rains in the lower third of Wisconsin delayed some planting of later season sweetcorn.
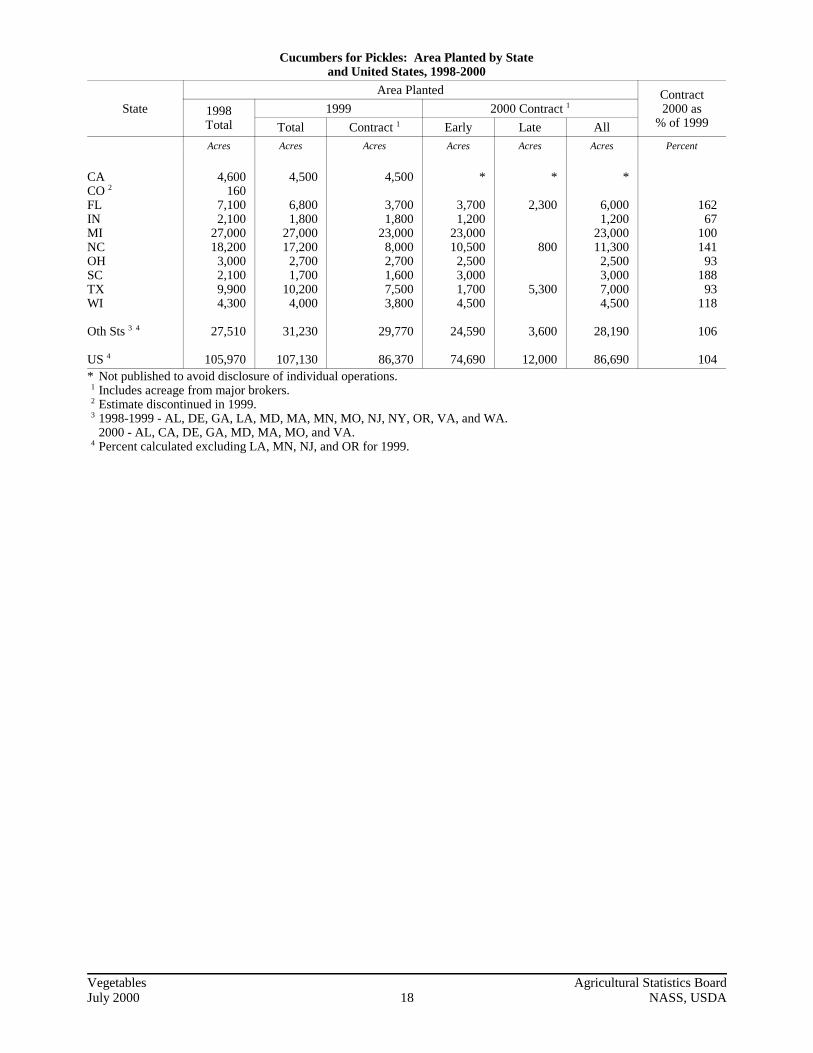
Cucumbers for Pickles: Pickle processors contracted 86,690 acres for harvest in 2000, up 4 percentfrom last year for comparable states. Warm spring weather in California has enhanced maturity andgrowth as harvest is underway with good quality reported. North Carolina conditions have been dry andhot causing growers to expect a late harvest.
Green Peas: Production is forecast at 499,920 tons, up 9 percent from last year’s comparable states. Area for harvest, at 283,300 acres, is up 5 percent from 1999 for comparable states. The expected yieldof 1.76 tons per acre is 0.06 tons more than a year ago. Area contracted for planting, at 302,300 acres, isup 6 percent from 1999 for comparable states. Area contracted for canning, at 135,000 acres, is up11 percent from last year’s comparable states. Area contracted for freezing, at 167,300 acres, is2 percent more than in 1999 for comparable states. Minnesota had some acreage drowned out byexcessive rain, but a cool spring has allowed for a very nice looking early pea crop. Harvest of earlyspring peas has begun in Wisconsin. Some areas have muddy conditions, making harvest tough, butwell-drained acreage is looking good.
Tomatoes: Contracted production is forecast at 10.5 million tons, down 16 percent from last year’scomparable states. Area contracted, at 300,000 acres, is down 15 percent from 1999 for comparablestates. In California, the tomato crop is in good condition and harvest is expected to begin between thelast week of June and the first week in July. The Michigan crop is developing well with adequatemoisture. Ohio growers are two weeks behind on planting this year due to rainy conditions.

Vegetables Agricultural Statistics BoardJuly 2000 22 NASS, USDA
IndexFresh Market
PageBy Crops Area Harvested by Season . . . . . . . . . . . . . . . . . . . . . . . . . . . . . . . . . . . . . . . . . . . . . . . . . . . . . . 2
Harvested Acres of Selected Vegetables, Melons and Dual Purpose Crops
Beans, Snap . . . . . . . . . . . . . . . . . . . . . . . . . . . . . . . . . . . . . . . . . . . . . . . . . . . . . . . . . . . . . . . . 4 Broccoli . . . . . . . . . . . . . . . . . . . . . . . . . . . . . . . . . . . . . . . . . . . . . . . . . . . . . . . . . . . . . . . . . . . 4 Cabbage . . . . . . . . . . . . . . . . . . . . . . . . . . . . . . . . . . . . . . . . . . . . . . . . . . . . . . . . . . . . . . . . . . . 4 Cantaloups . . . . . . . . . . . . . . . . . . . . . . . . . . . . . . . . . . . . . . . . . . . . . . . . . . . . . . . . . . . . . . . . . . 4 Carrots . . . . . . . . . . . . . . . . . . . . . . . . . . . . . . . . . . . . . . . . . . . . . . . . . . . . . . . . . . . . . . . . . . . . 4 Cauliflower . . . . . . . . . . . . . . . . . . . . . . . . . . . . . . . . . . . . . . . . . . . . . . . . . . . . . . . . . . . . . . . . . 4 Celery . . . . . . . . . . . . . . . . . . . . . . . . . . . . . . . . . . . . . . . . . . . . . . . . . . . . . . . . . . . . . . . . . . . . . . 5 Corn, Sweet . . . . . . . . . . . . . . . . . . . . . . . . . . . . . . . . . . . . . . . . . . . . . . . . . . . . . . . . . . . . . . . . . 5 Cucumbers . . . . . . . . . . . . . . . . . . . . . . . . . . . . . . . . . . . . . . . . . . . . . . . . . . . . . . . . . . . . . . . . . . 5 Eggplant . . . . . . . . . . . . . . . . . . . . . . . . . . . . . . . . . . . . . . . . . . . . . . . . . . . . . . . . . . . . . . . . . . . . 5 Honeydew Melons . . . . . . . . . . . . . . . . . . . . . . . . . . . . . . . . . . . . . . . . . . . . . . . . . . . . . . . . . . . . 5 Lettuce, Head . . . . . . . . . . . . . . . . . . . . . . . . . . . . . . . . . . . . . . . . . . . . . . . . . . . . . . . . . . . . . . . . 5 Onions, . . . . . . . . . . . . . . . . . . . . . . . . . . . . . . . . . . . . . . . . . . . . . . . . . . . . . . . . . . . . . . . . . . . . 10 Peppers, Bell . . . . . . . . . . . . . . . . . . . . . . . . . . . . . . . . . . . . . . . . . . . . . . . . . . . . . . . . . . . . . . . . 5 Strawberries . . . . . . . . . . . . . . . . . . . . . . . . . . . . . . . . . . . . . . . . . . . . . . . . . . . . . . . . . . . . . . . . . 9 Tomatoes . . . . . . . . . . . . . . . . . . . . . . . . . . . . . . . . . . . . . . . . . . . . . . . . . . . . . . . . . . . . . . . . . . . 6 Watermelons . . . . . . . . . . . . . . . . . . . . . . . . . . . . . . . . . . . . . . . . . . . . . . . . . . . . . . . . . . . . . . . . 6
ProcessingBy Crops Area Planted and Production. . . . . . . . . . . . . . . . . . . . . . . . . . . . . . . . . . . . . . . . . . . . . . . . . . . 14
Principal Vegetables
Beans, Snap . . . . . . . . . . . . . . . . . . . . . . . . . . . . . . . . . . . . . . . . . . . . . . . . . . . . . . . . . . . . . . . . 16 Corn, Sweet . . . . . . . . . . . . . . . . . . . . . . . . . . . . . . . . . . . . . . . . . . . . . . . . . . . . . . . . . . . . . . . . 17 Cucumbers for Pickles . . . . . . . . . . . . . . . . . . . . . . . . . . . . . . . . . . . . . . . . . . . . . . . . . . . . . . . . 18 Peas, Green . . . . . . . . . . . . . . . . . . . . . . . . . . . . . . . . . . . . . . . . . . . . . . . . . . . . . . . . . . . . . . . . . 19 Tomatoes . . . . . . . . . . . . . . . . . . . . . . . . . . . . . . . . . . . . . . . . . . . . . . . . . . . . . . . . . . . . . . . . . . 20

The next "Vegetables" report will be released at 3 p.m. ET on September 8, 2000.
The United States Department of Agriculture (USDA) prohibits discrimination in all its programs on the basis ofrace, color, national origin, gender, religion, age, disability, political beliefs, sexual orientation, and marital orfamily status. (Not all prohibited bases apply to all programs.) Persons with disabilities who require alternativemeans for communication of program information (braille, large print, audiotape, etc.) should contact the USDA’sTARGET Center at 202-720-2600 (voice and TDD).
To file a complaint of discrimination, write USDA, Director, Office of Civil Rights, Room 326-W, WhittenBuilding, 14th and Independence Avenue, SW, Washington, D.C., 20250-9410, or call 202-720-5964 (voice orTDD). USDA is an equal opportunity provider and employer.
ACCESS TO REPORTS!!
For your convenience, there are several ways to obtain NASS reports, data products, and services:
INTERNET ACCESS
All NASS reports are available free of charge on the worldwide Internet. For access, connect to the Internet andgo to the NASS Home Page at: http://www.usda.gov/nass/. Select “Today’s Reports” or Publications and thenReports by Calendar or Publications and then Search, by Title or Subject.
E-MAIL SUBSCRIPTION
There are two options for subscribing via e-mail. All NASS reports are available by subscription free of chargedirect to your e-mail address. 1) Starting with the NASS Home Page at http://www.usda.gov/nass/, click onPublications, then click on the Subscribe by E-mail button which takes you to the page describing e-maildelivery of reports. Finally, click on Go to the Subscription Page and follow the instructions. 2) If you do NOThave Internet access, send an e-mail message to: [email protected]. In the body of themessage type the word: list.
AUTOFAX ACCESS
NASSFax service is available for some reports from your fax machine. Please call 202-720-2000, using thehandset attached to your fax. Respond to the voice prompts. Document 0411 is a list of available reports.
- - - - - - - - - - - - - - - - - - - - - - - - - - - - - - - - - PRINTED REPORTS OR DATA PRODUCTS
CALL OUR TOLL-FREE ORDER DESK: 800-999-6779 (U.S. and Canada)Other areas, please call 703-834-0125 FAX: 703-834-0110
(Visa, MasterCard, check, or money order acceptable for payment.) - - - - - - - - - - - - - - - - - - - - - - - - - - - - - - - - - -
ASSISTANCE
For assistance with general agricultural statistics or further information about NASS or its products or services,contact the Agricultural Statistics Hotline at 800-727-9540, 7:30 a.m. to 4:00 p.m. ET, or e-mail:[email protected].