Embed Size (px)
Citation preview
Journal of Biomechanics 31 (1998) 867—871
Technical Note
Variation of arterial compliance within the cardiac pressure pulse
B.A. MacWilliams*, A.H. Hoffman, B.J. Savilonis
Mechanical Engineering Department, Worcester Polytechnic Institute, Worcester, MA 01609, U.S.A.
Received in final form 10 June 1998
Abstract
Past investigations of in vivo arterial behavior have concentrated on determining material properties based upon the maximum andminimum pressure and diameter measured over a pulse cycle. A new in vivo technique, based upon continuous measurement ofpressure and flow, has been developed to study arterial compliance throughout the pulse cycle. Compliance in the abdominal aorta ofrats showed different behavior during the rising and falling portion of the pressure pulse. Previous investigations of canine arterieswhich used different methods are consistent with these findings. This study demonstrates the utility of a new measurement techniqueand shows some trends in compliance within the pulse cycle which have neither been revealed by static tests nor by dynamic testswhich focused on pulse averaged values. ( 1998 Elsevier Science Ltd. All rights reserved.
Keywords: Artery; Mechanics; Viscoelasticity; Pulse
1. Introduction
In vivo, blood vessels are continuously subjected totime-varying loads, yet few studies have focused on theseconditions. Previous investigators have computed pulseaveraged elastic and viscoelastic moduli by measuringmaximum and minimum pressure and external diameter,and determining the internal diameter by assuming in-compressibility (Peterson et al., 1960; Patel et al., 1963;Gow and Taylor, 1968; Cox, 1975; Brant et al., 1988). Invivo measurements of pressure and flow have also beenused to study pulse wave propagation (Milnor andNichols, 1975; Busse et al., 1979).
Two prior studies have examined arterial compliancewithin a pulse. Drues and Young (1989) introduced an invitro method to determine arterial properties using netflow measurements. Static tests showed that caninecarotid arteries became less compliant (stiffer) with in-creasing pressure. Dynamic tests, with sinusoidal varyingpressure P(t), showed that the artery became more com-pliant with increasing pressure. During the portion of the
* Corresponding author. Present address: Shriners Hospitals forChildren-IntermountainUnit, Movement Analysis Laboratory, FairfaxRoad at Virginia Street, Salt Lake City, UT 84103—4399, U.S.A. Tel.:801-536-3800; fax: 801-536-3782; e-mail: [email protected]
pulse where dP/dt was negative, compliance increasedwith falling pressure. In our laboratory, Keating et al.(1991) developed an in vivo adaptation of this method todetermine area compliance in rat abdominal aortae.These in vivo results in a different species exhibited thesame qualitative trends as found by Drues and Young(1989). Both studies revealed arterial compliance that wasnot predicted by static tests and had not been examinedin previous dynamic tests. Our goal was to study in vivoarterial compliance within the pulse cycle using experi-mental methods that improved upon those of Keatinget al. (1991).
2. Materials and methods
Compliance (CA) is defined as the change in vessel
cross-sectional area (A) caused by a change in pressure(P). In pulsatile flow, compliance is time (t) dependent
CA"
LA/Lt
LP/Lt. (1)
When a straight cylindrical tube with internal radiusr is subjected to an internal pressure change dP theradius will increase by dr. Continuity of mass can be usedto relate the area change to the difference between inflow
0021-9290/98/$19.00 ( 1998 Elsevier Science Ltd. All rights reserved.P I I : S 0 0 2 1 - 9 2 9 0 ( 9 8 ) 0 0 0 9 5 - 5

Fig. 1. Schematic of experimental setup. Flow probes were located on a straight segment of the artery between the ilio-lumbar arteries and thecommon iliac bifurcation. The pressure probe was introduced through one iliac artery. w"4 mm, d"6—8 mm.
and outflow (Q). For an incompressible fluid
LQ
Lx"!
LA
Lt"!2nr
dr
dt. (2)
Combining Eqs. (1) and (2) yields
CA"!
LQ/Lx
LP/Lt. (3)
Considering two flow probes located at positions1 and 2 separated by a distance *x, Eq. (3) can be writtenin finite difference form to evaluate C
Aat time step k,
CkA"
(Qk2!Qk
1)2*t
(Pk`11
!Pk~11
)*x. (4)
Assuming a constant segment length, radial wall dis-placements can be calculated from Eqs. (2) and (4)
*rki"
rk`1i
!rk~1i
2"
(Qk2!Qk
1)*t
2nrki*x
. (5)
Studies were conducted using male Wistar rats(300—380g) maintained and tested in accordance withrecommendations in the Guide for the Care and ºse of¸aboratory Animals and the guidelines of the AnimalCare Advisory Committee of the University of Mass-achusetts Medical School. Pressure and flow data wereobtained from two animals anesthetized with ether in-haled through a nose cone. Proximal and distal flow rateswere measured simultaneously in the section of abdom-inal aorta located between the ilio-lumbar branches andiliac bifurcation (Fig. 1) using doppler ultrasound probes(Transonic Systems Inc.; Probe d2SB102). An approx-imately 15 mm length of aorta was separated from thevena cava, and tissue at each probe site was dissectedaround the circumference to allow the probes to beinstalled, creating a nearly untethered vessel segment.The probe body did not contact the vessel surface dir-ectly, and vessel expansion was resisted only by thedeformation of an electrolytic gel used to conduct theultrasound signal. Pressure was measured with a strain
gauge catheter pressure transducer (Millar Mikro-TipTM
Catheter Transducer) introduced through the left iliacartery and positioned near to or slightly protruding intothe aorta adjacent to the distal flow probe. A secondorder B-spline function which minimized the predictedmean square error (Woltring et al., 1987) was applied tothe raw data signals. Integration of the flow signalsindicated that volumes differed slightly ((5%). To sat-isfy mass conservation a constant was added to theproximal values. The maximum in vivo external radius(D
.!9) was measured with an electronic caliper under the
conditions at which pressure and flow were measured.After the data were collected, the animal was sacrificed,the flow probes removed, and an in vivo vessel segmentlength (¸
0) was marked and measured. The segment was
excised and the length (¸%9) was measured. A thin slice
from the segment center was cut and photographed un-der a microscope. The image was used to determine theexcised wall internal (d
%9) and external (D
%9) diameters.
Assuming incompressibility and negligible changes of theintact vessel length (¸
0"¸
.!9), the maximum internal
radius (r.!9
) can be found from
r.!9
"
1
2SD2.!9
!(D2%9!d2
%9)¸
%9¸0
. (6)
The predicted radius is obtained by summing r.!9
and*rk
i. Compliance and internal radius were calculated us-
ing Eqs. (4)—(6).
3. Results
Pressure and flow data exhibited characteristic pat-terns in each animal (Fig. 2). All signals began witha sharp rise to the peak value, after which pressuredropped off more gradually than flow. Animal d1’s pulserate (2.5 Hz) was lower than that of Animal d2 (4.0 Hz).There were only slight pulse to pulse signal variations.Noise was apparent, particularly in the flow signals
868 B.A. MacWilliams et al. / Journal of Biomechanics 31 (1998) 867—871
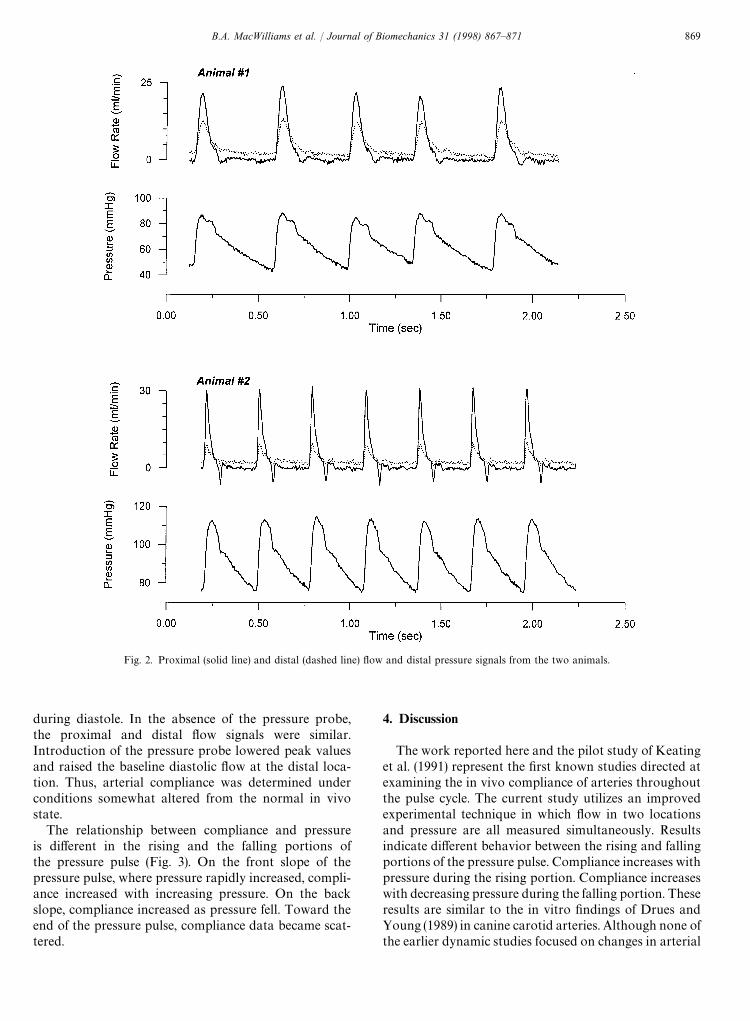
Fig. 2. Proximal (solid line) and distal (dashed line) flow and distal pressure signals from the two animals.
during diastole. In the absence of the pressure probe,the proximal and distal flow signals were similar.Introduction of the pressure probe lowered peak valuesand raised the baseline diastolic flow at the distal loca-tion. Thus, arterial compliance was determined underconditions somewhat altered from the normal in vivostate.
The relationship between compliance and pressureis different in the rising and the falling portions ofthe pressure pulse (Fig. 3). On the front slope of thepressure pulse, where pressure rapidly increased, compli-ance increased with increasing pressure. On the backslope, compliance increased as pressure fell. Toward theend of the pressure pulse, compliance data became scat-tered.
4. Discussion
The work reported here and the pilot study of Keatinget al. (1991) represent the first known studies directed atexamining the in vivo compliance of arteries throughoutthe pulse cycle. The current study utilizes an improvedexperimental technique in which flow in two locationsand pressure are all measured simultaneously. Resultsindicate different behavior between the rising and fallingportions of the pressure pulse. Compliance increases withpressure during the rising portion. Compliance increaseswith decreasing pressure during the falling portion. Theseresults are similar to the in vitro findings of Drues andYoung (1989) in canine carotid arteries. Although none ofthe earlier dynamic studies focused on changes in arterial
B.A. MacWilliams et al. / Journal of Biomechanics 31 (1998) 867—871 869

Fig. 3. Radius and compliance measurements calculated from a single representative pulse of the experimental data.
behavior within the pulse cycle, data published by Patelet al. (1963) are sufficient to calculate compliance. Theirdata, collected using entirely different methods from thecanine abdominal aorta, show compliance trends similarto our work (Fig. 4).
The observations of increasing compliance during therising portion of the pressure pulse appear to be contraryto the general observations of static pressure inflationtests, which have typically been performed over a largerange of pressures and show nonlinear behavior. However,nonlinear effects may be small over the comparativelynarrow physiological range (Weizsacker and Pinto, 1988).
Analytical models were used to characterize the mater-ial behavior of the artery. For an elastic cylinder sub-jected to an internal pressure P(t), the compliance curvehas the same shape as P(t): the compliance increases withincreasing pressure and decreases with decreasing pres-sure (MacWilliams, 1992). On the front slope of thepressure pulse (positive dP/dt), the rat aorta exhibitsdeformations similar to linear elastic behavior. Thus,although arteries are viscoelastic, the rapid rise in thepressure pulse results in near elastic behavior. On therapidly falling back slope (negative dP/dt), viscoelasticeffects predominate causing the radius to fall more slowlythan the pressure. MacWilliams (1992) showed thatsimple viscoelastic models based upon the correspond-ence principle reasonably predict the behavior shown inFig. 3.
The pressure probe-artery interface of electrolytic gel isless likely to alter vessel stiffness as opposed to directlymeasuring the outside diameter of the vessel as a functionof time. The viscoelastic properties of the gel were inde-pendently determined and found not to influence theamplitude or phase of the vessel diameter. The smalldiameter of the rat aorta influenced the precision of theresults. Ideally the pressure probe would be placed be-tween the flow probes; a Taylor series analysis predictederrors of approximately 5% in Eq. (4) resulting from thedistal shift in the pressure measurement. Introduction ofthe pressure probe altered the normal flow pattern andmay have influenced the calculated compliance. Whilethis created a departure from the normal state, the pres-sure, flow and heart rate fell within the broad range of invivo conditions (Altman and Dittmer, 1974). These effectswould be lessened in larger vessels.
Our data are also consistent with other studies. The‘pressure-strain’ modulus has been used to describe arter-ial behavior (Patel et al., 1963),
E1"
*Pr
*r. (7)
Using the systolic/diastolic pressure variation, E1
valuesof 16.5 and 21.2 kPa were obtained for the two animals(Table 1). At the mean pressures of each animal, the dataof Demiray et al. (1988) predict E
1"30 and 50 kPa,
870 B.A. MacWilliams et al. / Journal of Biomechanics 31 (1998) 867—871

Fig. 4. (A) Results from pressure and radius data published by Patel etal. (1963) for a dog aorta. (B) Compliance calculated from a finitedifference form of Eqs. (2) and (3).
Table 1Results from the current study (1 and 2) compared with static results ofDemiray (estimated from published graphs) at pressures correspondingto the mean pressures found in Animal d1(3) and Animal d2(4).Ranges of data are given as systolic/diastolic. The subscript m denotesthe mean value. E
1is the ‘pressure modulus’ (Eq. 7)
Study P P.
r r.
E1
(mmHg) (mmHg) (mm) (mm) (kPa)
1. Animal d1 86/43 63 0.91/0.63 0.78 16.52. Animal d2 113/76 91 0.98/0.76 0.87 21.23. Demiray 63 0.76 30
(1998)4. Demiray 91 0.82 50
(1998)
respectively, based on static tests. Since pressure in Ani-mal d1 is lower than in Animal d2, it is expected that E
1would also be lower due to the nonlinear properties.
In summary, examination of in vivo arterial behaviorduring individual cardiac cycles reveals behavior differ-ent from that reported in static tests. Previous dynamictests have concentrated on determining parameters, suchas the pressure modulus, that are based upon measuredbounds over one cycle. When one cycle is examined indetail, compliance increases with pressure during the
rapidly rising (positive dP/dt) portion of the pressurepulse. In addition, compliance increases with decreasingpressure when dP/dt is negative. Prior work by Druesand Young (1989) and Patel et al. (1963) support thesefindings. The results presented here for two animals dem-onstrate the feasibility of this experimental method.Additional studies are needed to further examine compli-ance behavior within the cardiac pressure pulse.
Acknowledgements
The authors wish to thank their collaborators from theUniversity of Massachusetts Medical Center: GuidoMajno, M.D., Isabelle Joris, Ph.D., Thomas Zand, M.D.,and John Nunnari, M.A.. This work was supported byGrants HL 25973 and HL 33529 from the NationalHeart, Lung and Blood Institute.
Reference
Altman, P.L., Dittmer, D.S., 1974. Biology Data Book. FASEB,Bethesda, MD.
Brant, A.M., Shah, S.S., Rodgers, V.G., Hoffmeister, J., Herman, I.M.,Kormos, R.L., Borovetz, H.S., 1988. Biomechanics of the arterial wallunder simulated flow conditions. Journal of Biomechanics 21(2),107—113.
Busse, R., Bauer, R.D., Schabert, A., Summa, Y., Wetterer, E., 1979. Animproved method for determination of the pulse transmission char-acteristics of arteries in vivo. Circulation Research 44, 630—636.
Cox, R.H., 1975. Pressure dependence of the mechanical properties ofarteries in vivo. American Journal of Physiology 229(5), 1371—1375.
Demiray, H., Weizsacker, H.W., Pascale, K., Erbay, H.A., 1988.A stress—strain relation for a rat abdominal aorta. Journal of Bi-omechanics 21(5), 369—374.
Drues, M.E., Young, D.F., 1989. Prediction of arterial compliance frompressure and flow waveforms. Biomedical Science Instrumentation25, 233—238.
Gow, B.S., Taylor, M.G., 1968. Measurement of viscoelastic propertiesof arteries in the living dog. Circulation Research 23(1), 111—122.
Keating, P., MacWilliams, B.A., Hoffman, A.H., Savilonis, B.J., 1991. Invivo determination of arterial compliance. In: Proceedings of theASME Biomechanics Symposium, Ohio State University, Columbus,OH. ASME Press, New York, pp. 251—253.
MacWilliams, B.A., 1992. Arterial mechanics and atherosclerosis. Ph.D.Dissertation, Worcester Polytechnic Institute, Worcester, MA.
Milnor, W.R., Nichols, W.W., 1975. A new method of measuring propa-gation coefficients and characteristic impedance of blood vessels.Circulation Research 36, 631—639.
Patel, D.J., DeFreitas, F.M., Greenfield, J.C., Fry, D.L., 1963. Relation-ship of radius to pressure along the aorta in living dogs. Journal ofApplied Physiology 18, 1111—1117.
Peterson, L.H., Roderick, E.J., Parnell, J., 1960. Mechanical propertiesof arteries in vivo. Circulation Research 8, 622—639.
Weizsacker, H.W., Pinto, J.G., 1988. Isotropy and anisotropy of thearterial wall. Journal of Biomechanics 21(6), 477—487.
Woltring, H.J., de Lange, A., Kauer, J.M.G., Huiskes, R., 1987. Instan-taneous helical axis estimation via natural cross-validated splines. In:Bergmann, G. (Ed.), Biomechanics: Basic and Applied Research.Proceedings of the 5th Meeting of the European Society of Bio-mechanics, Berlin, 1986. Martinus Nijhoff, Dordrecht, NL, pp.121—128.
B.A. MacWilliams et al. / Journal of Biomechanics 31 (1998) 867—871 871