Embed Size (px)
Citation preview

This article was downloaded by: [National Science Library]On: 13 November 2012, At: 16:03Publisher: Taylor & FrancisInforma Ltd Registered in England and Wales Registered Number: 1072954 Registered office: Mortimer House,37-41 Mortimer Street, London W1T 3JH, UK
Atmosphere-OceanPublication details, including instructions for authors and subscription information:http://www.tandfonline.com/loi/tato20
Variation Features of the Mindanao Eddy from ArgoDataQilong Zhang a , Hongwei Liu a b , Hui Zhou a & Dongmei Zheng ca Institute of Oceanology, Chinese Academy of Sciences, Qingdao, 266071, ShandongProvince, Chinab University of Chinese Academy of Sciences, Beijing, 100039, Chinac Marine Environmental Forecasting Central Station of Liaoning Province, Shenyang, 110001,Liaoning Province, ChinaVersion of record first published: 12 Nov 2012.
To cite this article: Qilong Zhang, Hongwei Liu, Hui Zhou & Dongmei Zheng (2012): Variation Features of the Mindanao Eddyfrom Argo Data, Atmosphere-Ocean, DOI:10.1080/07055900.2012.742855
To link to this article: http://dx.doi.org/10.1080/07055900.2012.742855
PLEASE SCROLL DOWN FOR ARTICLE
Full terms and conditions of use: http://www.tandfonline.com/page/terms-and-conditions
This article may be used for research, teaching, and private study purposes. Any substantial or systematicreproduction, redistribution, reselling, loan, sub-licensing, systematic supply, or distribution in any form toanyone is expressly forbidden.
The publisher does not give any warranty express or implied or make any representation that the contentswill be complete or accurate or up to date. The accuracy of any instructions, formulae, and drug doses shouldbe independently verified with primary sources. The publisher shall not be liable for any loss, actions, claims,proceedings, demand, or costs or damages whatsoever or howsoever caused arising directly or indirectly inconnection with or arising out of the use of this material.

Variation Features of the Mindanao Eddy from Argo Data
Qilong Zhang1,*, Hongwei Liu1,2, Hui Zhou1 and Dongmei Zheng3
1Institute of Oceanology, Chinese Academy of Sciences, Qingdao 266071, Shandong Province,China
2University of Chinese Academy of Sciences, Beijing 100039, China3Marine Environmental Forecasting Central Station of Liaoning Province, Shenyang 110001,
Liaoning Province, China
[Original manuscript received 11 March 2011; accepted 3 August 2012]
ABSTRACT Based on monthly mean Argo profiler float data from 2004 to 2008 and monthly mean sea surfaceheight and current velocity data from the Simple Ocean Data Assimilation (SODA) reanalysis for the period 1958–2007, the three-dimensional structure of the Mindanao Eddy (ME), its seasonal and interannual variability, and itsimpact on the thermohaline structure are analyzed. In addition, the displacement of the ME centre and its relationto ocean circulations are also discussed. The results showed that the ME spreads vertically from about 600 dbdepth upward to about 40 db depth. In addition to its strong seasonal variation, the strength of the ME displaysstrong interannual variability resulting from the interannual variability in the North Equatorial Current (NEC),the North Equatorial Counter Current (NECC) and the Mindanao Current (MC). The meridional movement ofthe centre of the ME has strong seasonal and interannual variability, and the zonal movement has a strong sea-sonal variation. The meridional movement is associated with the meridional displacement of the interfacebetween the NECC and the NEC, whereas the zonal movement is associated with the zonal displacement of theinterface between the MC and the northward branch of the NECC. The ME variability can greatly affect thepattern of the thermohaline structure in the local upper ocean. When the eddy is strong, the cold and low salinitywater within it moves vigorously upward from the deep layer; the thermocline shoals significantly; the subsurfacehigh salinity water shows a large decrease; and the upper mixed layer becomes thinner, and vice versa.
RÉSUMÉ [Traduit par la rédaction] En nous basant sur les données mensuelles moyennes des flotteurs profileursArgo pour la période de 2004 à 2008 et sur les données mensuelles moyennes de hauteur de la surface de la mer etde vitesses vectorielles du courant fournies par les réanalyses SODA (Simple Ocean Data Assimilation) pour lapériode de 1958 à 2007, nous analysons la structure tridimensionnelle du remous de Mindanao, sa variabilitésaisonnière et interannuelle et son impact sur la structure thermohaline. De plus, nous discutons du déplacementdu centre du remous de Mindanao et de sa relation avec les circulations océaniques. Les résultats ont montré que leremous s’étend verticalement vers le haut à partir d’une profondeur de 600 db jusqu’à une profondeur d’environ40 db. En plus de sa forte variabilité saisonnière, la force du remous de Mindanao affiche une forte variabilitéinterannuelle résultant de la variabilité interannuelle dans le courant nord-équatorial (NEC), le contre-courantnord-équatorial (NECC) et le courant de Mindanao (MC). Le mouvement méridien du centre du centre duremous de Mindanao affiche une forte variabilité saisonnière et interannuelle et le mouvement zonal possèdeune forte variabilité saisonnière. Le mouvement méridien est lié au déplacement méridien de l’interface entre leNECC et le NEC alors que le mouvement zonal est lié au déplacement zonal de l’interface entre le MC et lebras allant vers le nord du NECC. La variabilité du remous de Mindanao peut grandement modifier laconfiguration de la structure thermohaline dans les couches supérieures locales de l’océan. Quand le remousest fort, l’eau froide et de faible salinité qu’il renferme se déplace vigoureusement vers le haut à partir de lacouche profonde; la thermocline s’élève de façon marquée; les eaux de subsurface de forte salinité affichentune diminution importante; et la couche de mélange supérieure devient plus mince, et inversement.
KEYWORDS Mindanao Eddy; thermohaline structure; Argo; seasonal and interannual variability
1 Introduction
The western equatorial Pacific Ocean, particularly the south-ernmost Philippine Sea, has attracted much attention fromresearchers because it plays a key role in the establishment
of the El Niño-Southern Oscillation (ENSO) and may alsobe an important part of the so-called “great conveyor belt”caused by the Indonesian Throughflow (ITF). The MindanaoEddy (ME) and the Halmahera Eddy (HE) and low latitude
*Corresponding author’s email: [email protected]
ATMOSPHERE-OCEAN iFirst article, 2012, 1–13 http://dx.doi.org/10.1080/07055900.2012.742855Canadian Meteorological and Oceanographic Society
Dow
nloa
ded
by [
Nat
iona
l Sci
ence
Lib
rary
] at
16:
03 1
3 N
ovem
ber
2012
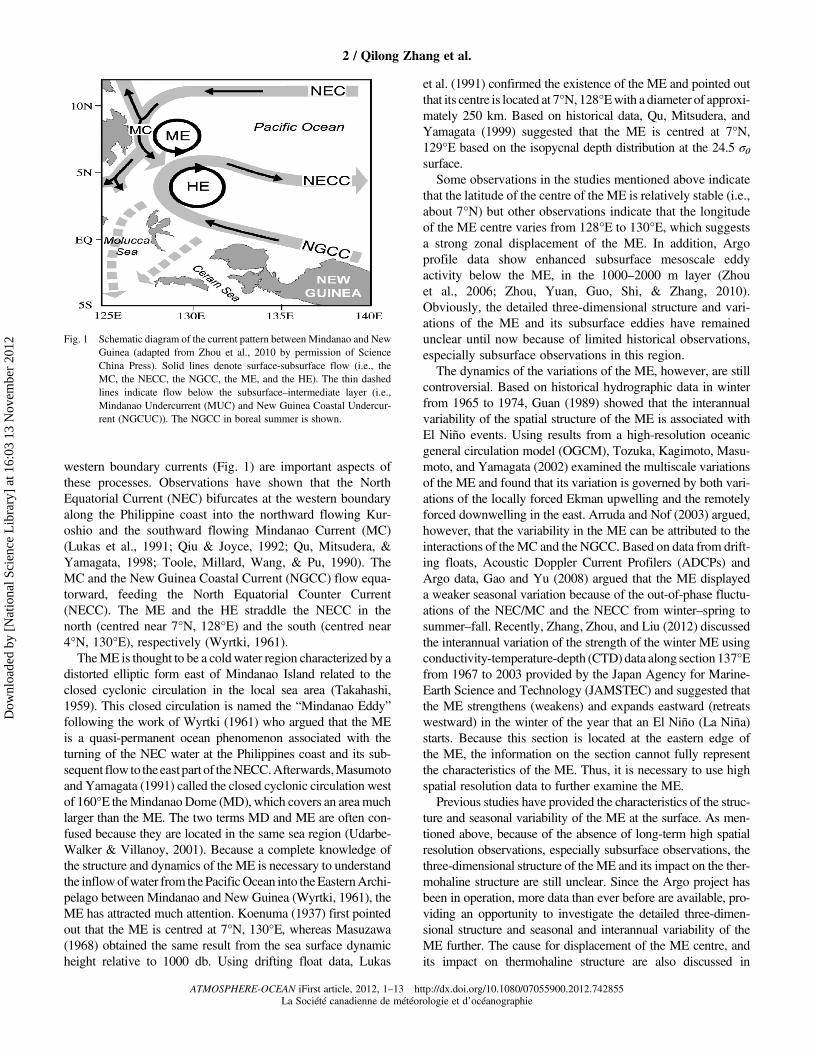
western boundary currents (Fig. 1) are important aspects ofthese processes. Observations have shown that the NorthEquatorial Current (NEC) bifurcates at the western boundaryalong the Philippine coast into the northward flowing Kur-oshio and the southward flowing Mindanao Current (MC)(Lukas et al., 1991; Qiu & Joyce, 1992; Qu, Mitsudera, &Yamagata, 1998; Toole, Millard, Wang, & Pu, 1990). TheMC and the New Guinea Coastal Current (NGCC) flow equa-torward, feeding the North Equatorial Counter Current(NECC). The ME and the HE straddle the NECC in thenorth (centred near 7°N, 128°E) and the south (centred near4°N, 130°E), respectively (Wyrtki, 1961).TheME is thought to be a coldwater region characterized by a
distorted elliptic form east of Mindanao Island related to theclosed cyclonic circulation in the local sea area (Takahashi,1959). This closed circulation is named the “Mindanao Eddy”following the work of Wyrtki (1961) who argued that the MEis a quasi-permanent ocean phenomenon associated with theturning of the NEC water at the Philippines coast and its sub-sequent flow to the east part of theNECC.Afterwards,Masumotoand Yamagata (1991) called the closed cyclonic circulation westof 160°E theMindanao Dome (MD), which covers an area muchlarger than the ME. The two terms MD and ME are often con-fused because they are located in the same sea region (Udarbe-Walker & Villanoy, 2001). Because a complete knowledge ofthe structure and dynamics of the ME is necessary to understandthe inflowofwater from the PacificOcean into theEasternArchi-pelago between Mindanao and New Guinea (Wyrtki, 1961), theME has attracted much attention. Koenuma (1937) first pointedout that the ME is centred at 7°N, 130°E, whereas Masuzawa(1968) obtained the same result from the sea surface dynamicheight relative to 1000 db. Using drifting float data, Lukas
et al. (1991) confirmed the existence of the ME and pointed outthat its centre is located at 7°N, 128°Ewith a diameter of approxi-mately 250 km. Based on historical data, Qu, Mitsudera, andYamagata (1999) suggested that the ME is centred at 7°N,129°E based on the isopycnal depth distribution at the 24.5 σθsurface.
Some observations in the studies mentioned above indicatethat the latitude of the centre of the ME is relatively stable (i.e.,about 7°N) but other observations indicate that the longitudeof the ME centre varies from 128°E to 130°E, which suggestsa strong zonal displacement of the ME. In addition, Argoprofile data show enhanced subsurface mesoscale eddyactivity below the ME, in the 1000–2000 m layer (Zhouet al., 2006; Zhou, Yuan, Guo, Shi, & Zhang, 2010).Obviously, the detailed three-dimensional structure and vari-ations of the ME and its subsurface eddies have remainedunclear until now because of limited historical observations,especially subsurface observations in this region.
The dynamics of the variations of the ME, however, are stillcontroversial. Based on historical hydrographic data in winterfrom 1965 to 1974, Guan (1989) showed that the interannualvariability of the spatial structure of the ME is associated withEl Niño events. Using results from a high-resolution oceanicgeneral circulation model (OGCM), Tozuka, Kagimoto, Masu-moto, and Yamagata (2002) examined the multiscale variationsof the ME and found that its variation is governed by both vari-ations of the locally forced Ekman upwelling and the remotelyforced downwelling in the east. Arruda and Nof (2003) argued,however, that the variability in the ME can be attributed to theinteractions of theMC and the NGCC. Based on data from drift-ing floats, Acoustic Doppler Current Profilers (ADCPs) andArgo data, Gao and Yu (2008) argued that the ME displayeda weaker seasonal variation because of the out-of-phase fluctu-ations of the NEC/MC and the NECC from winter–spring tosummer–fall. Recently, Zhang, Zhou, and Liu (2012) discussedthe interannual variation of the strength of the winter ME usingconductivity-temperature-depth (CTD) data along section 137°Efrom 1967 to 2003 provided by the Japan Agency for Marine-Earth Science and Technology (JAMSTEC) and suggested thatthe ME strengthens (weakens) and expands eastward (retreatswestward) in the winter of the year that an El Niño (La Niña)starts. Because this section is located at the eastern edge ofthe ME, the information on the section cannot fully representthe characteristics of the ME. Thus, it is necessary to use highspatial resolution data to further examine the ME.
Previous studies have provided the characteristics of the struc-ture and seasonal variability of the ME at the surface. As men-tioned above, because of the absence of long-term high spatialresolution observations, especially subsurface observations, thethree-dimensional structure of the ME and its impact on the ther-mohaline structure are still unclear. Since the Argo project hasbeen in operation, more data than ever before are available, pro-viding an opportunity to investigate the detailed three-dimen-sional structure and seasonal and interannual variability of theME further. The cause for displacement of the ME centre, andits impact on thermohaline structure are also discussed in
Fig. 1 Schematic diagram of the current pattern between Mindanao and NewGuinea (adapted from Zhou et al., 2010 by permission of ScienceChina Press). Solid lines denote surface-subsurface flow (i.e., theMC, the NECC, the NGCC, the ME, and the HE). The thin dashedlines indicate flow below the subsurface–intermediate layer (i.e.,Mindanao Undercurrent (MUC) and New Guinea Coastal Undercur-rent (NGCUC)). The NGCC in boreal summer is shown.
2 / Qilong Zhang et al.
ATMOSPHERE-OCEAN iFirst article, 2012, 1–13 http://dx.doi.org/10.1080/07055900.2012.742855La Société canadienne de météorologie et d’océanographie
Dow
nloa
ded
by [
Nat
iona
l Sci
ence
Lib
rary
] at
16:
03 1
3 N
ovem
ber
2012
order to understand better the thermohaline structure patternvariability in the upper northwestern Pacific Ocean.
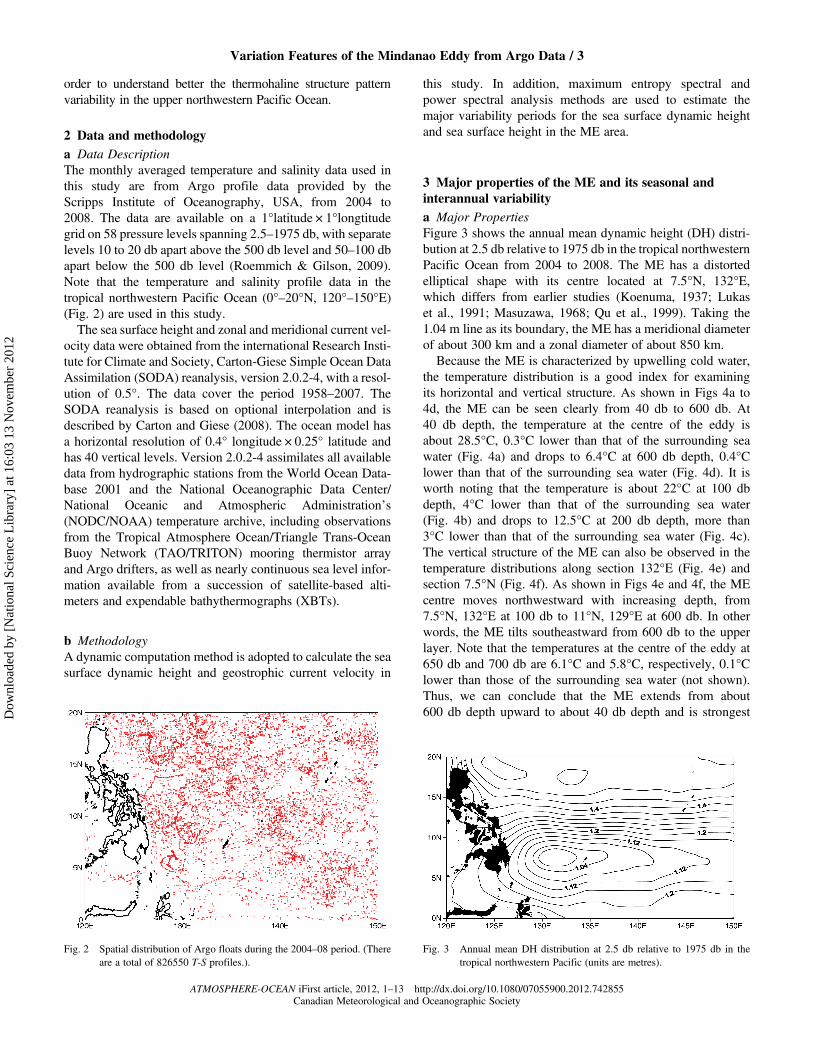
2 Data and methodologya Data DescriptionThe monthly averaged temperature and salinity data used inthis study are from Argo profile data provided by theScripps Institute of Oceanography, USA, from 2004 to2008. The data are available on a 1°latitude × 1°longtitudegrid on 58 pressure levels spanning 2.5–1975 db, with separatelevels 10 to 20 db apart above the 500 db level and 50–100 dbapart below the 500 db level (Roemmich & Gilson, 2009).Note that the temperature and salinity profile data in thetropical northwestern Pacific Ocean (0°–20°N, 120°–150°E)(Fig. 2) are used in this study.The sea surface height and zonal and meridional current vel-
ocity data were obtained from the international Research Insti-tute for Climate and Society, Carton-Giese Simple Ocean DataAssimilation (SODA) reanalysis, version 2.0.2-4, with a resol-ution of 0.5°. The data cover the period 1958–2007. TheSODA reanalysis is based on optional interpolation and isdescribed by Carton and Giese (2008). The ocean model hasa horizontal resolution of 0.4° longitude × 0.25° latitude andhas 40 vertical levels. Version 2.0.2-4 assimilates all availabledata from hydrographic stations from the World Ocean Data-base 2001 and the National Oceanographic Data Center/National Oceanic and Atmospheric Administration’s(NODC/NOAA) temperature archive, including observationsfrom the Tropical Atmosphere Ocean/Triangle Trans-OceanBuoy Network (TAO/TRITON) mooring thermistor arrayand Argo drifters, as well as nearly continuous sea level infor-mation available from a succession of satellite-based alti-meters and expendable bathythermographs (XBTs).
b MethodologyA dynamic computation method is adopted to calculate the seasurface dynamic height and geostrophic current velocity in
this study. In addition, maximum entropy spectral andpower spectral analysis methods are used to estimate themajor variability periods for the sea surface dynamic heightand sea surface height in the ME area.
3 Major properties of the ME and its seasonal andinterannual variabilitya Major PropertiesFigure 3 shows the annual mean dynamic height (DH) distri-bution at 2.5 db relative to 1975 db in the tropical northwesternPacific Ocean from 2004 to 2008. The ME has a distortedelliptical shape with its centre located at 7.5°N, 132°E,which differs from earlier studies (Koenuma, 1937; Lukaset al., 1991; Masuzawa, 1968; Qu et al., 1999). Taking the1.04 m line as its boundary, the ME has a meridional diameterof about 300 km and a zonal diameter of about 850 km.
Because the ME is characterized by upwelling cold water,the temperature distribution is a good index for examiningits horizontal and vertical structure. As shown in Figs 4a to4d, the ME can be seen clearly from 40 db to 600 db. At40 db depth, the temperature at the centre of the eddy isabout 28.5°C, 0.3°C lower than that of the surrounding seawater (Fig. 4a) and drops to 6.4°C at 600 db depth, 0.4°Clower than that of the surrounding sea water (Fig. 4d). It isworth noting that the temperature is about 22°C at 100 dbdepth, 4°C lower than that of the surrounding sea water(Fig. 4b) and drops to 12.5°C at 200 db depth, more than3°C lower than that of the surrounding sea water (Fig. 4c).The vertical structure of the ME can also be observed in thetemperature distributions along section 132°E (Fig. 4e) andsection 7.5°N (Fig. 4f). As shown in Figs 4e and 4f, the MEcentre moves northwestward with increasing depth, from7.5°N, 132°E at 100 db to 11°N, 129°E at 600 db. In otherwords, the ME tilts southeastward from 600 db to the upperlayer. Note that the temperatures at the centre of the eddy at650 db and 700 db are 6.1°C and 5.8°C, respectively, 0.1°Clower than those of the surrounding sea water (not shown).Thus, we can conclude that the ME extends from about600 db depth upward to about 40 db depth and is strongest
Fig. 2 Spatial distribution of Argo floats during the 2004–08 period. (Thereare a total of 826550 T-S profiles.).
Fig. 3 Annual mean DH distribution at 2.5 db relative to 1975 db in thetropical northwestern Pacific (units are metres).
Variation Features of the Mindanao Eddy from Argo Data / 3
ATMOSPHERE-OCEAN iFirst article, 2012, 1–13 http://dx.doi.org/10.1080/07055900.2012.742855Canadian Meteorological and Oceanographic Society
Dow
nloa
ded
by [
Nat
iona
l Sci
ence
Lib
rary
] at
16:
03 1
3 N
ovem
ber
2012

at 100 db depth. Based on climatological current velocity data,Gao and Yu (2008) pointed out that the ME weakens at around450 m depth and disappears, whereas using Argo data fromMay 2007, Zhang et al. (2012) found that the vertical rangeof the ME is between 50 m and 500 m; this differs somewhatfrom our results.It is worth noting that the vertical structure of salinity in the
ME is a little complicated. The salinity is slightly higher(34.6–34.8 (practical salinity scale used)) between 100 db
and 200 db depth but decreases to 34.5 at around 220 dbdepth (not shown). Guan (1989) pointed out that NorthPacific Intermediate Water (NPIW), characterized byminimum salinity (about 34.5), flows into the Celebes Seawith the MC and spreads between 200 m and 300 m depthto east of Mindanao Island and north of 4°–5°N, respectively.In fact, after entering the western ocean, the NPIW flowssouthward as far as the southern tip of Mindanao along thewestern boundary (Qu et al., 1999).
Fig. 4 Annual mean temperature distribution at different depths and sections (a) at 40 db depth, (b) at 100 db depth, (c) at 200 db depth, (d) at 600 db depth,(e) along section 132°E, and (f) along section 7.5°N.
4 / Qilong Zhang et al.
ATMOSPHERE-OCEAN iFirst article, 2012, 1–13 http://dx.doi.org/10.1080/07055900.2012.742855La Société canadienne de météorologie et d’océanographie
Dow
nloa
ded
by [
Nat
iona
l Sci
ence
Lib
rary
] at
16:
03 1
3 N
ovem
ber
2012
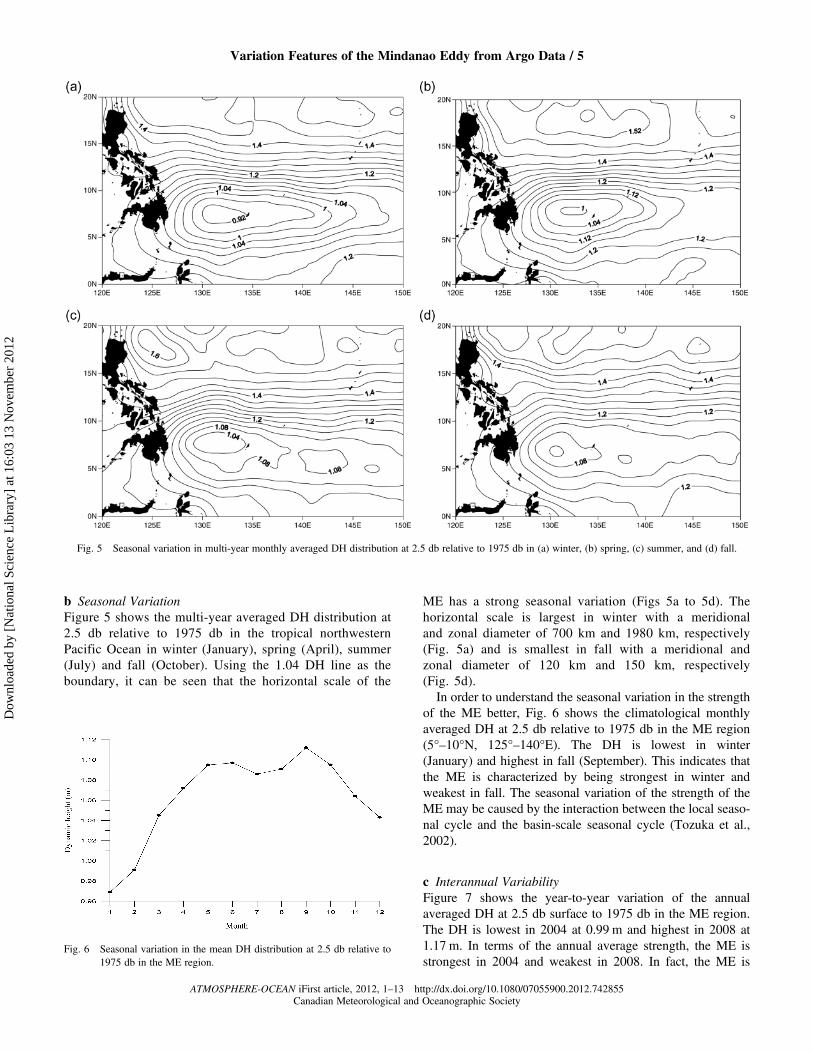
b Seasonal VariationFigure 5 shows the multi-year averaged DH distribution at2.5 db relative to 1975 db in the tropical northwesternPacific Ocean in winter (January), spring (April), summer(July) and fall (October). Using the 1.04 DH line as theboundary, it can be seen that the horizontal scale of the
ME has a strong seasonal variation (Figs 5a to 5d). Thehorizontal scale is largest in winter with a meridionaland zonal diameter of 700 km and 1980 km, respectively(Fig. 5a) and is smallest in fall with a meridional andzonal diameter of 120 km and 150 km, respectively(Fig. 5d).
In order to understand the seasonal variation in the strengthof the ME better, Fig. 6 shows the climatological monthlyaveraged DH at 2.5 db relative to 1975 db in the ME region(5°–10°N, 125°–140°E). The DH is lowest in winter(January) and highest in fall (September). This indicates thatthe ME is characterized by being strongest in winter andweakest in fall. The seasonal variation of the strength of theME may be caused by the interaction between the local seaso-nal cycle and the basin-scale seasonal cycle (Tozuka et al.,2002).
c Interannual VariabilityFigure 7 shows the year-to-year variation of the annualaveraged DH at 2.5 db surface to 1975 db in the ME region.The DH is lowest in 2004 at 0.99 m and highest in 2008 at1.17 m. In terms of the annual average strength, the ME isstrongest in 2004 and weakest in 2008. In fact, the ME is
Fig. 5 Seasonal variation in multi-year monthly averaged DH distribution at 2.5 db relative to 1975 db in (a) winter, (b) spring, (c) summer, and (d) fall.
Fig. 6 Seasonal variation in the mean DH distribution at 2.5 db relative to1975 db in the ME region.
Variation Features of the Mindanao Eddy from Argo Data / 5
ATMOSPHERE-OCEAN iFirst article, 2012, 1–13 http://dx.doi.org/10.1080/07055900.2012.742855Canadian Meteorological and Oceanographic Society
Dow
nloa
ded
by [
Nat
iona
l Sci
ence
Lib
rary
] at
16:
03 1
3 N
ovem
ber
2012

strongest in January 2005 at 0.92 m and weakest in June 2008at 1.21 m (not shown).Figure 8 shows the interannual variability in mean DH
anomaly (DHA) in the ME region after using a 5-monthrunning mean filter. The DHA exhibits two peaks and twovalleys between 2004 and 2008. The two peaks occur in
April 2006 (0.06 m) and May 2008 (1.20 m), respectively,while the valleys appear in May 2004 (−0.09 m) andDecember 2006 (−0.07 m), respectively. This indicates thatthe ME has a strong quasi-biennial oscillation (QBO). Themaximum entropy spectral analysis shows that the spectralvalue of the time series without using the filtering process isbiggest near the 26-month period. In other words, the MEhas a strong QBO.
To understand the interannual variability of the strength ofthe ME better, we derive a time series of sea surface heightanomalies (SSHAs) in the ME region (6°–9°N, 128°–133°E)based on the SODA monthly averaged sea surface heightfrom 1958 to 2007. As shown in Fig. 9, the SSHA exhibitsstriking interannual variability closely associated withENSO. The negative SSHA values (<−0.10 m) all appearduring El Niño events except for 1959, whereas the positivevalues (>0.15 m) all occur during La Niña events. A powerspectral analysis shows that the leading periods of the SSHAare 5.3 years and quasi-biennial, similar to those of ENSO.
In order to examine the evolution of the strength of the MEduring ENSO, we conduct a composite analysis of the SSHA
Fig. 8 Interannual variability in the mean DH anomaly at 2.5 db relative to 1975 db in the ME region.
Fig. 7 Interannual variability in the mean DH at 2.5 db relative to 1975 db inthe ME region.
Fig. 9 Interannual variation in SSHA in the ME region.
6 / Qilong Zhang et al.
ATMOSPHERE-OCEAN iFirst article, 2012, 1–13 http://dx.doi.org/10.1080/07055900.2012.742855La Société canadienne de météorologie et d’océanographie
Dow
nloa
ded
by [
Nat
iona
l Sci
ence
Lib
rary
] at
16:
03 1
3 N
ovem
ber
2012

in the ME region during 13 El Niño events (1963, 1965, 1968,1972, 1976, 1979, 1982, 1986, 1991, 1993, 1994, 1997 and2002) and 9 La Niña events (1964, 1967, 1970, 1973, 1974,1984, 1988, 1995 and 1999) occurring since 1958. An eventprocessed using composite analysis is termed a compositeevent, hereinafter, and the year when the El Niño (La Niña)starts is set to Y(0); the years before and after the El Niño(La Niña) year are Y(−1) and Y(+1), respectively. The compo-site results are shown in Fig. 10. The SSHA has a small posi-tive value in the year before a composite El Niño event occursbut becomes negative at the beginning of the event year(January) and reaches a minimum in November thenbecomes positive in June of the following year. On the otherhand, the SSHA has a small negative value in the yearbefore a composite La Niña event occurs but becomes positiveat the beginning of the event year (March) and reaches amaximum in September and a minimum in June of the follow-ing year.In short, the strength of the ME exhibits striking interannual
variability closely related to ENSO. That is, during an El Niño(La Niña) event, the sea surface height (SSH) or the DH in theME region all decrease (increase), meaning that the MEstrengthens (weakens), which is consistent with previousstudies (Guan, 1989; Tozuka et al., 2002).Tozuka et al. (2002) suggested that the interannual variation
of the strength of the ME is governed by variations in both theEkman upwelling forced locally and the downwelling forcedremotely in the eastern Pacific Ocean. Because the ME islocated near the NEC, the MC and the NECC, we should,therefore, examine the impacts of the NEC, MC, and NECCon the ME on an interannual time scale to find the possiblecause of the interannual variability of the ME. The volumetransports of the NEC, MC and NECC are all calculatedusing an integral method based on the monthly averagecurrent velocity values from the SODA data. The processfor computing the volume transports is explained in thefollowing.The volume transports derived by integrating westward
flowing velocities in the upper 500 m between 8°N and
20°N along section 130°E represent the NEC transport,while the volume transports derived by integrating eastwardflowing velocities in the upper 500 m between 1°N and 8°Nrepresent the NECC transport. The MC volume transport isobtained by integrating the southward flowing velocities inthe upper 750 m between Mindanao Island and 130°E alongsection 8°N.
The calculations show that the climatological annualtransports for the NEC, the NECC, and the MC are −48.5 Sv,39.3 Sv, and −18.9 Sv (1 Sv = 106 m3 s−1), respectively, similarto those of previous studies (Chu, Li, & Fan, 2003; Johnson &McPhaden, 1999; Lukas et al., 1991; Qu et al., 1998; Wang,Zhang, Hu, & Seidel, 2001).
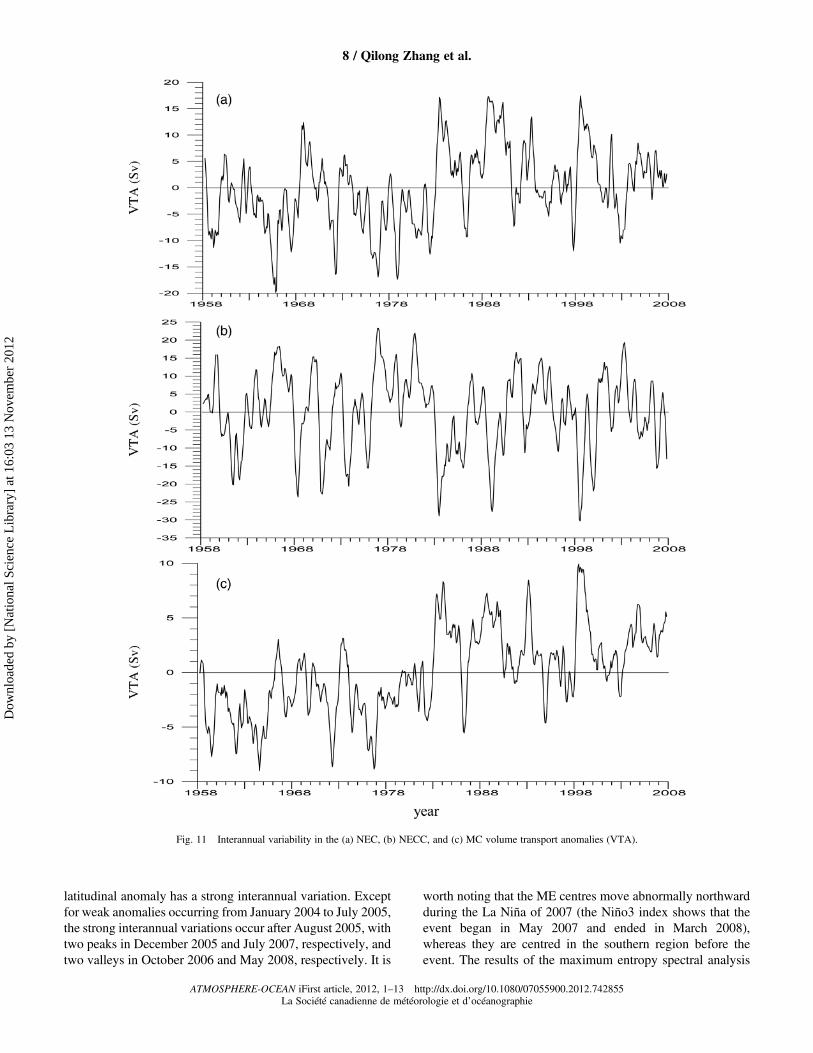
Figure 11 shows the interannual variability in the NEC, theNECC and the MC transport anomalies. The NEC transportdisplays strong interannual variability with leading periodsof 5 years and quasi-biennial (Fig. 11a). Similar to the NEC,the NECC also exhibits strong interannal variability in itstransport anomaly (Fig. 11b) and has leading periods of1 year, quasi-biennial and 3.2 years. As shown in Fig. 11c,the MC has a lower interannual amplitude because themaximum (minimum) transport anomaly is approximately10 Sv (−9 Sv) in 1999 (1964). However, the interannual varia-bility trends are similar to those of the NEC and the NECCwith leading periods of 5, 0.5 and 2.9 years. The cross-corre-lation analysis indicates that there are close correlationsbetween SSHAs in the ME area and the NEC, NECC andMC transport with a peak coefficient of 0.48, −0.63 and0.49, respectively, at the zero lag, significant at the 99% con-fidence level. This indicates that the interannual variability ofthe strength of the ME may be caused by the interannual varia-bility of the NEC, NECC and MC. When these currents are allstrong, the ME draws much kinetic energy from them andstrengthens, and vice versa.
4 Displacement of the ME centre and the oceancirculations
The displacement of the ME centre is currently unclearbecause of sparse data. Therefore, we analyzed the displace-ment of the ME centre statistically based on the monthlymean DH distribution at 2.5 db surface relative to 1975 dbfrom 2004 to 2008. As shown in Fig. 12, the centre of theME displays strong meridional and zonal movements. In thezonal direction, the centres are located on the west side(between 129° and 134°E) most of the time except for someindividual months (e.g., April–June 2004 and March andNovember 2005) when it is located on the east side (east of136.5°E). In the meridional direction, the centre’s locationvaries between 6.5°N and 8.5°N in most months, occasionallyshifting further north (9°–9.2°N) or south (5.9°–6.2°N) insome months.
To understand the year-to-year displacements of the MEcentre better, we show the latitudinal (Fig. 13) and longitudi-nal anomalies (Fig. 14) of the ME centre after processing witha 5-month running mean filter. As shown in Fig. 13, the
Fig. 10 Composite of the sea surface height anomaly in the ME region. Thesolid line indicates the composite El Niño event; the dashed line indi-cates the composite La Niña event.
Variation Features of the Mindanao Eddy from Argo Data / 7
ATMOSPHERE-OCEAN iFirst article, 2012, 1–13 http://dx.doi.org/10.1080/07055900.2012.742855Canadian Meteorological and Oceanographic Society
Dow
nloa
ded
by [
Nat
iona
l Sci
ence
Lib
rary
] at
16:
03 1
3 N
ovem
ber
2012
latitudinal anomaly has a strong interannual variation. Exceptfor weak anomalies occurring from January 2004 to July 2005,the strong interannual variations occur after August 2005, withtwo peaks in December 2005 and July 2007, respectively, andtwo valleys in October 2006 and May 2008, respectively. It is
worth noting that the ME centres move abnormally northwardduring the La Niña of 2007 (the Niño3 index shows that theevent began in May 2007 and ended in March 2008),whereas they are centred in the southern region before theevent. The results of the maximum entropy spectral analysis
Fig. 11 Interannual variability in the (a) NEC, (b) NECC, and (c) MC volume transport anomalies (VTA).
8 / Qilong Zhang et al.
ATMOSPHERE-OCEAN iFirst article, 2012, 1–13 http://dx.doi.org/10.1080/07055900.2012.742855La Société canadienne de météorologie et d’océanographie
Dow
nloa
ded
by [
Nat
iona
l Sci
ence
Lib
rary
] at
16:
03 1
3 N
ovem
ber
2012

also shows that there are quasi-biennial and quasi-annualoscillations (according to the spectral value) in the meridionaldisplacement of the ME centre. Thus, it can be seen that the
ME centre has strong meridional movements at both seasonaland interannual time scales.
The longitudinal anomaly of the ME centre exhibits a sig-nificant variation (Fig. 14), but the trend is obviously differentfrom that of the latitudinal anomaly. Prior to early 2006, thelongitudinal anomalies are larger and basically positive (i.e.,the ME centres move eastward), whereas after early 2006,the longitudinal anomalies are relatively smaller and basicallynegative (i.e., the centres move westward). Especially duringthe La Niña of 2007, the ME centres were all located in thewestern part. The maximum entropy spectral analysis showsthat the major periods of the longitudinal anomaly are8.8 months and 4.7 months, respectively. This indicates thatthe ME centre has an obvious zonal movement on a seasonalscale.
In summary, the ME centre displays strong meridional andzonal movement during 2004 and 2008, but it moves mostlynorthwestward during the La Niña of 2007. The cause for
Fig. 12 Scatter diagram for the ME centre from 2004 to 2008: 1 indicates2004, 2 indicates 2005, 3 indicates 2006, 4 indicates 2007, and5 indicates 2008.
Fig. 13 Interannual variations in the latitudinal anomaly of the ME centre (solid line) and the interface between the NEC and the NECC (dashed line) along section132°E.
Fig. 14 Interannual variation in the longitudinal anomaly of the ME centre (solid line) and the interface between MC and the northward branch of the NECC(dashed line) along section 7.5°N.
Variation Features of the Mindanao Eddy from Argo Data / 9
ATMOSPHERE-OCEAN iFirst article, 2012, 1–13 http://dx.doi.org/10.1080/07055900.2012.742855Canadian Meteorological and Oceanographic Society
Dow
nloa
ded
by [
Nat
iona
l Sci
ence
Lib
rary
] at
16:
03 1
3 N
ovem
ber
2012

this movement, however, is unclear. This issue will now bediscussed further.The above analysis suggests that the interannual variability
of the strength of the ME is associated with the interannualvariability of the NECC, NEC and MC. Therefore, analyzingthe relationship between these three currents and the MEcentre will be helpful in understanding the cause for the displa-cement of the ME centre.Because the ME is centred at 7.5°N, 132°E, we show the
annual mean geostrophic current velocity distribution alongsection 132°E. As shown in Fig. 15, the NEC (dashed lines)is located north of approximately 7.6°N, while the NECC(solid lines) is located south of the section, quite similar tothe results of Qu and Lukas (2003) along section 130°E.Obviously, the interface (the zero current velocity line) ofthe two currents is located around 7.6°N at the sea surface,then gradually moves northward at increasing depths. Inother words, the interface between the two currents is veryclose to the ME centre near 7.5°N. It seems to indicate thatthe meridional movement of the ME centre may be relatedto that of the interface between the two currents. Figure 13shows the latitudinal anomaly of the interface between theNEC and the NECC from 2004 to 2008 (dashed line). Theinterannual variation in the interface latitudinal anomaly isconsistent with that of the ME centre latitudinal anomaly.That is, when the interface moves northward, the ME centrealso shifts northward, and vice versa. The maximum entropyspectral analysis indicates that the variation periods of theinterface latitude anomaly are quasi-biennial and quasi-annual, similar to those of the ME centre. The correlationanalysis shows that the correlation coefficient between themis 0.91 at the zero lag, significant at the 99% confidencelevel. In other words, the meridional displacements of theME centre may be primarily caused by the meridional move-ments of both the NEC and the NECC.Tozuka et al. (2002) and Chu et al. (2003) pointed out that
part of the NECC flows from south to north (the NECC
northward branch) and feeds into the NEC on the easternside of the ME. Figure 16 shows the annual mean geostrophiccurrent velocity distribution along section 7.5°N. The MC(dashed lines) is located approximately west of 131°E, whilethe NECC northward branch (solid lines) is located between131°E and 135°E. Obviously, the interface (the zero geos-trophic current velocity line) between these two currents islocated near 131°E at the sea surface then gradually moveswestward with increasing depth, indicating that the multi-year averaged longitude of the interface between these twocurrents is closer to that of the ME centre. This means thatthe zonal displacement of the ME centre may be related tothe zonal movement of both the MC and the northwardbranch of the NECC. Figure 14 shows the interannual variabil-ity in the longitudinal anomaly of the interface between theMC and the NECC northward branch from 2004 to 2008(dashed line). The variation trend is consistent with that ofthe longitudinal anomaly of the ME centre. When the interfacemoves eastward, the ME centre will also move eastward andvice versa. From the maximum entropy spectral analysis, theleading periods of the interface of the longitudinal anomalyare 8.7 months and 4.6 months, similar to those of the longi-tudinal anomaly of the ME centre. The correlation analysisshows that the correlation coefficient between them is 0.95at the zero lag, significant at the 99% confidence level. Thatis, the zonal displacement of the ME centre may be primarilycaused by that of the MC and the northward branch of theNECC.
5 Impact of the ME on thermohaline structures
Zhang et al. (2012) analyzed the impact of the ME on the ther-mohaline structure in the local sea region based on tempera-ture and salinity data along section 137°E during the winterof 1998 and 2000 and suggested that the ME has a strongimpact on the local thermohaline structure. Because thesection is far from the ME centre, located at 7.5°N, 132°E;
Fig. 15 Annual mean geostrophic current velocity along section 132°E (units are cm s−1; the zero velocity surface is at 1000 db).
10 / Qilong Zhang et al.
ATMOSPHERE-OCEAN iFirst article, 2012, 1–13 http://dx.doi.org/10.1080/07055900.2012.742855La Société canadienne de météorologie et d’océanographie
Dow
nloa
ded
by [
Nat
iona
l Sci
ence
Lib
rary
] at
16:
03 1
3 N
ovem
ber
2012

however, the impact of the ME on the thermohaline structurecannot be fully determined using only the data from thatlocation. Thus, it is necessary to use Argo profile data whichhas a relatively high resolution to discuss this issue further.From the above analysis we know that the ME is strongestin January 2005 and weakest in June 2008. Therefore, wewill discuss the impact of the ME on the thermohaline struc-tures during those particular two months.Figure 17 shows the distributions of the temperature and
salinity along section 132°E in January 2005. The shoalingof isotherm contours from 500 db depth near 7.5°N producesa strong thermocline between 50 and 200 db. Thus, the 20°Cisothermal line rises to about 100 db depth, and the thicknessof the upper mixed layer becomes obviously thinner, at onlyabout 50 db (Fig. 17a).The salinity distribution (Fig. 17b) in January 2005 is sig-
nificantly different from the temperature distribution. The
salinity is lower above 50 db between the equator and 15°N(S < 34.4) but higher below 300 db. High salinity regionssouth of 7°N (S > 35.3) and north of 9°N (S > 35.0) are thefront edges of the South and North Pacific subtropical highsalinity water, respectively, while NPIW (S < 34.3) upwellsas it flows southward, and its edge (34.5 isohaline) reachesalmost 200 db near 7°N, thinning the upper high salinitywater (S > 34.7) (only 50 db thick), thus preventing theNorth Pacific subtropical high salinity water from spreadingsouthward.
The temperature and salinity structures along section 132°Ein June 2008, when the ME is weak, are shown in Fig. 18. Theupwelling of the isotherm lines near 7.5°N is obviouslyweaker and the 20°C isotherm line is located near 150 db.Thus, the upper mixed layer becomes obviously thicker witha thickness of about 100 db (Fig. 18a). Meanwhile, the lowsalinity water (S < 34.5) becomes thicker (about 100 db)
Fig. 16 Annual mean geostrophic current velocity distribution along section 7.5°N (units are cm s−1; the zero velocity surface is at 1000 db).
Fig. 17 Distribution of (a) temperature and (b) salinity along section 132°E in January 2005.
Variation Features of the Mindanao Eddy from Argo Data / 11
ATMOSPHERE-OCEAN iFirst article, 2012, 1–13 http://dx.doi.org/10.1080/07055900.2012.742855Canadian Meteorological and Oceanographic Society
Dow
nloa
ded
by [
Nat
iona
l Sci
ence
Lib
rary
] at
16:
03 1
3 N
ovem
ber
2012

between 5°N and 10°N, while the thickness of the high salinitywater (S > 34.6) also thickens to about 80 db (Fig. 18b). Thesouthward flowing and upwelling of the intermediate layerlow salinity water of the North Pacific becomes weaker, andits edge only reaches 270 db near 8°N, aiding the southwardspread of the subtropical high salinity water (S > 34.9) in theNorth Pacific.As mentioned above, the ME greatly affects the local
thermohaline structure. When the eddy is strong, the coldand low salinity water within it moves vigorously upwardfrom the deep layer, the thermocline shoals significantly,and the upper mixed layer becomes thinner and vice versa.So, the 20°C isotherm line rises to about 50 db during theperiod when the ME is strong (e.g., January 2005) which ishigher than when it is weak (e.g., June 2008).
6 Conclusions. The ME is located in the region 6°–9°N, 127°–138°E. Itsannual mean meridional and zonal diameters are 300 kmand 850 km, respectively. The vertical extent of the eddyis between 40 and 600 db. The eddy is characterized bybeing strongest in winter and weakest in fall. The MEstrength has striking interannual variability associatedwith ENSO events, whereas this interannual variabilitymay be caused by the interannual variability of the NEC,the NECC and the MC.
. The ME also has strong seasonal and interannual variabilityin the meridional movement of its central position but onlystrong seasonal variability in its zonal movement. Thismovement is mainly related to the variation of the surround-ing currents. The meridional movement may be associatedwith the meridional displacement of the interface betweenthe NECC and the NEC, while the zonal movement maybe associated with the zonal displacement of the interfacebetween the MC and the northward branch of the NECC.
. The ME has a large effect on the local thermohaline struc-ture. When the eddy is strong, the cold and low salinitywater within the eddy moves vigorously upward from thedeep layer, the thermocline shoals significantly, the thick-ness of the high salinity water and the upper mixed layerboth become thinner and vice versa. So, the 20°C isothermline rises to about 50 db during the period when the ME isstrong, which is higher than when it is weak.
Acknowledgements
This work was supported by the National Basic ResearchProgram of China 973 project (contract number:2007CB816002, 2012CB417402), the innovative key projectof the Chinese Academy of Sciences (KZCXZ-YW-201)and the Fund of the Key Laboratory of Global Change andMarine-Atmospheric Chemistry, SOA (GCMAC2010).
ReferencesArruda, W., & Nof, D. (2003). The Mindanao and Halmahera eddies—twineddies induced by nonlinearities. Journal of Physical Oceanography, 33,2815–2830.
Carton, J. A., & Giese, B. S. (2008). A reanalysis of ocean climate usingsimple ocean data assimilation (SODA). Monthly Weather Review, 136(8), 2999–3017.
Chu, P. C., Li, R. F., & Fan, C. W. (2003). Determination of the currentsystem on isopycnal surface between Mindanao and New Guinea fromGDEM. Chinese Journal of Oceanology and Limnology, 21(3),193–213.
Gao, L. D., & Yu, W. D. (2008). Observations and analysis on seasonal vari-ation of western boundary currents and eddy structures in the western
Fig. 18 Distribution of (a) temperature and (b) salinity along section 132°E in June 2008.
12 / Qilong Zhang et al.
ATMOSPHERE-OCEAN iFirst article, 2012, 1–13 http://dx.doi.org/10.1080/07055900.2012.742855La Société canadienne de météorologie et d’océanographie
Dow
nloa
ded
by [
Nat
iona
l Sci
ence
Lib
rary
] at
16:
03 1
3 N
ovem
ber
2012

Pacific Ocean of the low latitudes. Advances in Marine Science, 26(3),317–325. (in Chinese with English abstract).
Guan, B. X. (1989). Variation of the Mindanao Eddy and its relation toEl Niño. Oceanologia et Limnologia Sinica, 20(2), 131–137. (in Chinesewith English abstract).
Johnson, G. C., & McPhaden, M. J. (1999). Interior pycnocline flow from thesubtropical to the equatorial Pacific Ocean. Journal of PhysicalOceanography, 29, 3071–3089.
Koenuma, K. (1937). On the hydrography of the southwestern part of theNorth Pacific and the Kuroshio. Part I: General oceanographic features ofthe region. The Imperial Marine Observatory Kobe, Japan, 6(1), 279–332.
Lukas, R., Firing, E., Hacker, P., Richardson, P. L., Collins, C. A., Fine, R., &Gammon, R. (1991). Observations of the Mindanao Current during theWestern Equatorial Pacific Ocean circulation study. Journal ofGeophysical Research, 96, 7089–7104.
Masumoto, Y., & Yamagata, T. (1991). On the origin of a mode ENSO in thewestern Pacific. Journal of the Meteorological Society of Japan, 69, 197–207.
Masuzawa, J. (1968). Second cruise for CSK, Ryofu Maru, January to March1968. Oceanographic Magazine, 20, 173–185.
Qiu, B., & Joyce, T. M. (1992). Interannual variability in the mid and low-lati-tude western North Pacific. Journal of Physical Oceanography, 22,1062–1079.
Qu, T., & Lukas, R. (2003). The bifurcation of the North Equatorial Current inthe Pacific. Journal of Physical Oceanography, 33, 5–18.
Qu, T.,Mitsudera, H., &Yamagata, T. (1998). On thewestern boundary currentsin the Philippine Sea. Journal of Geophysical Research, 103, 7537–7548.
Qu, T., Mitsudera, H., & Yamagata, T. (1999). A climatology of the circula-tion and water mass distribution near the Philippine coast. Journal ofPhysical Oceanography, 29, 1488–1505.
Roemmich, D., & Gilson, J. (2009). The 2004–2008 mean and annual cycle oftemperature, salinity, and steric height in the global ocean from the Argoprogram. Progress in Oceanography, 8, 81–100.
Takahashi, T. (1959). Hydrographical researches in the western equatorialPacific. Memoirs of Faculty of Fisheries Kagoshima Univiversiuty, 7,141–147.
Toole, J. M., Millard, R. C., Wang, Z., & Pu, S. (1990). Observations of thePacific North Equatorial Current bifurcation at the Philippine Coast.Journal of Physical Oceanography, 20, 307–318.
Tozuka, T., Kagimoto, T., Masumoto, Y., & Yamagata, T. (2002). Simulatedmultiscale variations in the western tropical Pacific: The Mindanao Domerevisited. Journal of Physical Oceanography, 32, 1338–1359.
Udarbe-Walker, M. J. B., & Villanoy, C. L. (2001). Structure of potentialupwelling areas in the Philippines. Deep-Sea Research, 48, 1499–1518.
Wang, F., Zhang, P., Hu, D. X., & Seidel, H. (2001). The tropical PacificOcean circulations and their seasonal variations. Chinese ScienceBulletin, 46(23), 1998–2002. (in Chinese).
Wyrtki, K. (1961). Physical oceanography of the southeast Asian waters.NAGA Report 2, Scripps Inst. of Oceanogr., University of California,San Diego, La Jolla, CA.
Zhang, Q. L., Zhou, H., & Liu, H. W. (2012). Interannual variability in theMindanao Eddy and its impact on thermohaline structure pattern. ActaOceanologica Sinica. doi:10.1007/s13131-012-0247-3 (in press).
Zhou, H., Xu, J. P., Guo, P. F., Shi, M. C., Liu, Z. H., & Li, Y. F. (2006). Astudy on an anticyclonic eddy east of Mindanao observed by an Argo pro-filing float. Journal of Tropical Oceanography, 25(6), 8–14.
Zhou, H., Yuan, D. L., Guo, P. F., Shi, M. C., & Zhang, Q. L. (2010). Meso-scale circulation at the intermediate-depth east of Mindanao. Science China,53(3), 432–440. doi:10.1007/s11430-009-0196-7
Variation Features of the Mindanao Eddy from Argo Data / 13
ATMOSPHERE-OCEAN iFirst article, 2012, 1–13 http://dx.doi.org/10.1080/07055900.2012.742855Canadian Meteorological and Oceanographic Society
Dow
nloa
ded
by [
Nat
iona
l Sci
ence
Lib
rary
] at
16:
03 1
3 N
ovem
ber
2012