Embed Size (px)
Citation preview
Variance Estimation:Drawing Statistical Inferences from IPUMS-International Census Data
Lara L. Cleveland
IPUMS-International
November 14, 2010
Havana, Cuba
Overview Characteristics of Complex Samples
Public Use Census Data IPUMS-International Census Samples
Adjusting for Sampling ErrorAssessment StrategyResultsRecommendations and Future Work
The IPUMS projects are funded by the National Science Foundation and the National Institutes of Health
Overview Characteristics of Complex Samples
Public Use Census Data IPUMS-International Census Samples
Adjusting for Sampling ErrorAssessment StrategyResultsRecommendations and Future Work
The IPUMS projects are funded by the National Science Foundation and the National Institutes of Health
Public Use Census Microdata
Publicly available census microdata often derive from complex samples.
HOWEVER,
social science researchers commonly apply methods designed for simple random samples.
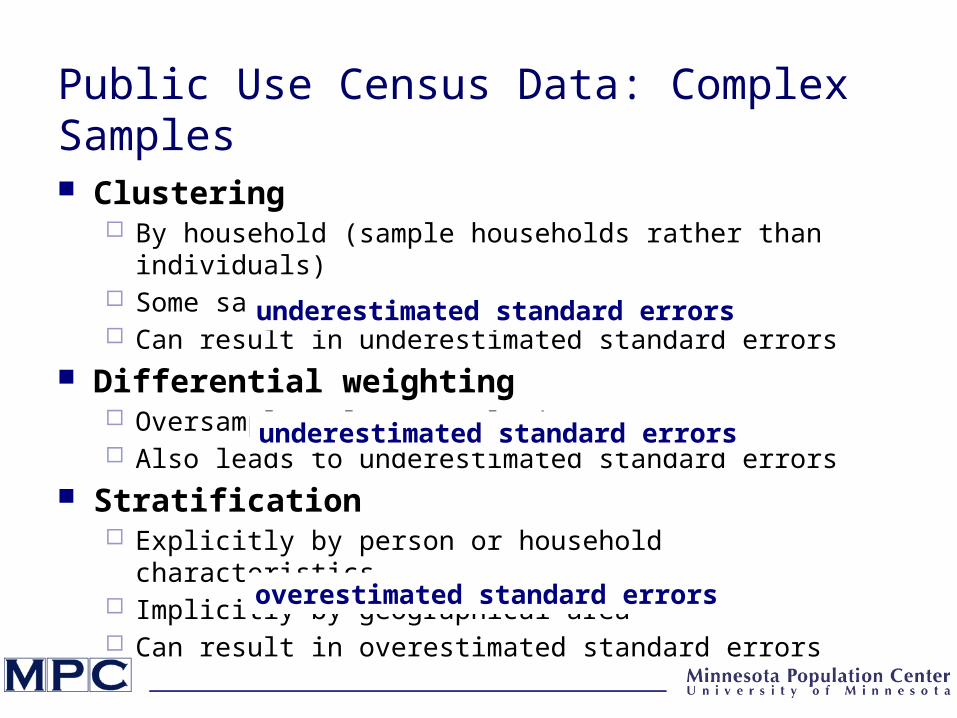
Public Use Census Data: Complex Samples
Clustering By household (sample households rather than individuals) Some samples geographically clustered Can result in underestimated standard errors
Differential weighting Oversample select populations Also leads to underestimated standard errors
Stratification Explicitly by person or household characteristics Implicitly by geographical area Can result in overestimated standard errors
underestimated standard errors
underestimated standard errors
overestimated standard errors
IPUMS-I Data Processing
Data received varies in quality, detail and extent of documentation
3 Sampling ProcessesCountry-produced public use sampleSample drawn by partner country to IPUMS-I
specificationsFull count data sampled by IPUMS-I
Samples Drawn by IPUMS-I
High density (typically 10% samples) Household samples
Clustered by household Systematic sample (every nth household)
Typically geographic sorting – presumed here Implicit geographic stratification
Uniformly weighted (self-weighting)
Variance Estimation: Data Quality Assessment/Improvement
As researchers and data usersAssess accuracy of the dataCalculate precise estimates
As data custodians and disseminatorsDistribute quality data samplesCreate tools to facilitate research
Overview Characteristics of Complex Samples
Public Use Census Data IPUMS-International Census Samples
Adjusting for Sampling ErrorAssessment StrategyResultsRecommendations and Future Work
The IPUMS projects are funded by the National Science Foundation and the National Institutes of Health
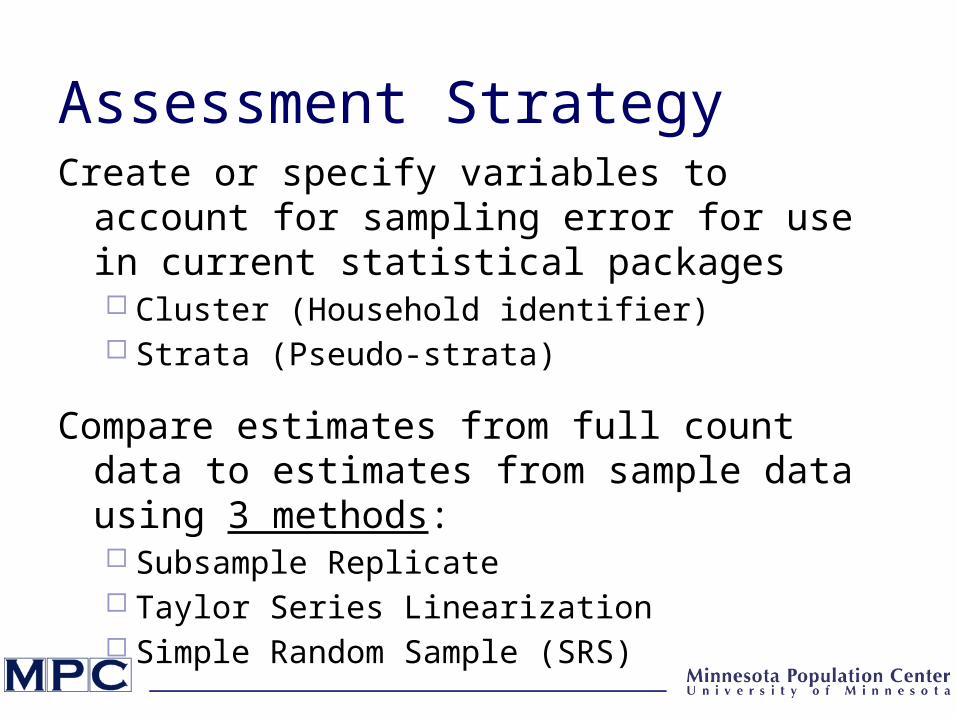
Assessment StrategyCreate or specify variables to account for sampling
error for use in current statistical packages Cluster (Household identifier) Strata (Pseudo-strata)
Compare estimates from full count data to estimates from sample data using 3 methods: Subsample Replicate Taylor Series Linearization Simple Random Sample (SRS)
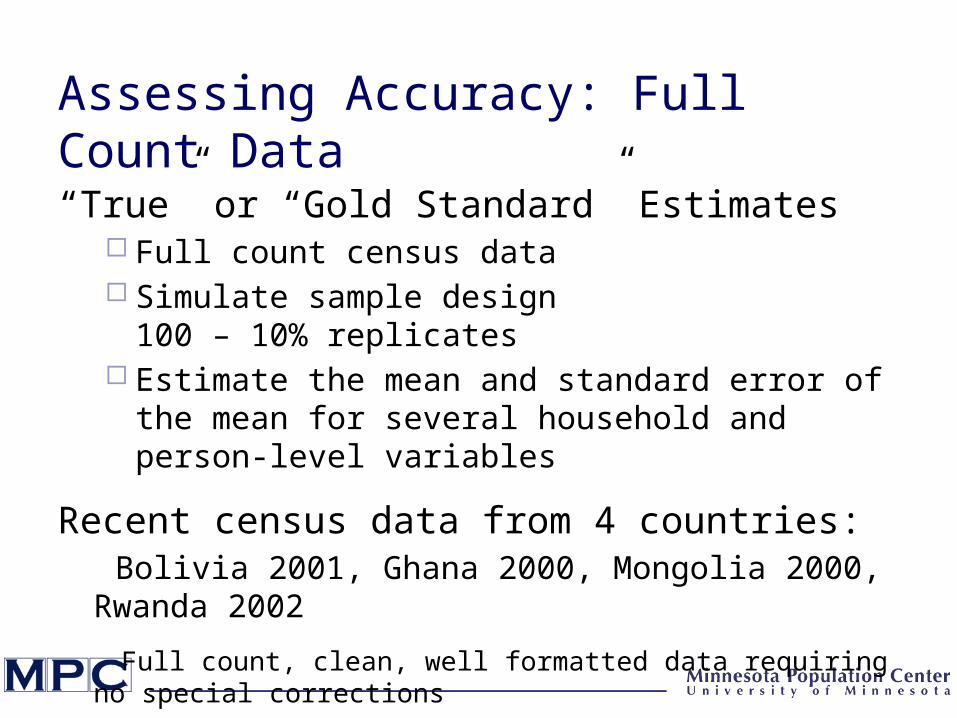
Assessing Accuracy: Full Count Data
“True” or “Gold Standard” Estimates Full count census data Simulate sample design
100 – 10% replicates Estimate the mean and standard error of the mean for
several household and person-level variables
Recent census data from 4 countries: Bolivia 2001, Ghana 2000, Mongolia 2000, Rwanda 2002
Full count, clean, well formatted data requiring no special corrections
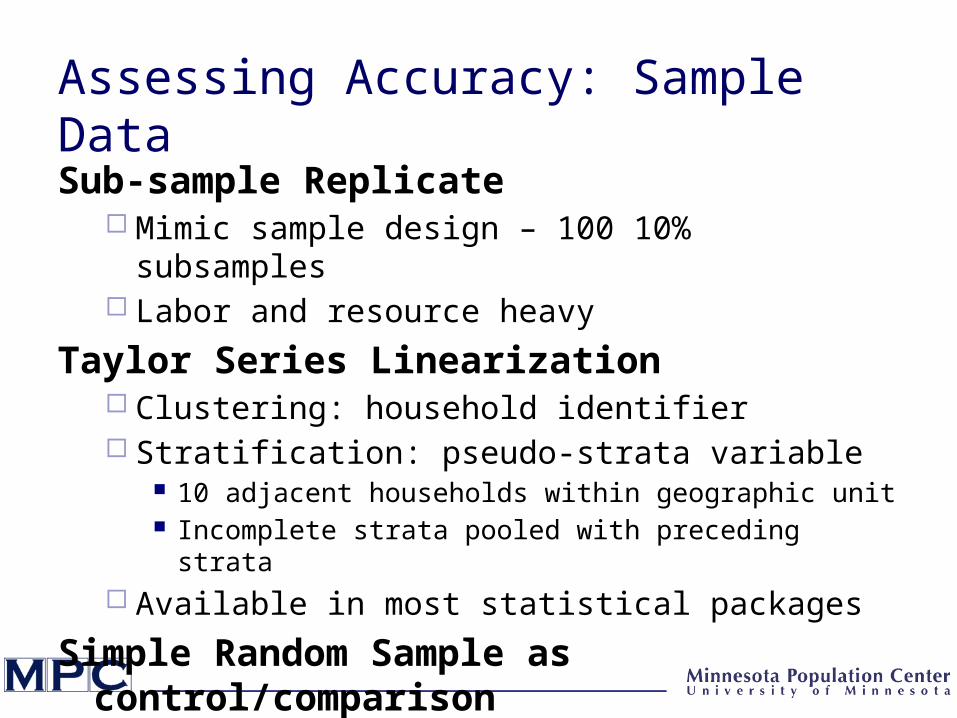
Assessing Accuracy: Sample Data
Sub-sample Replicate Mimic sample design – 100 10% subsamples Labor and resource heavy
Taylor Series Linearization Clustering: household identifier Stratification: pseudo-strata variable
10 adjacent households within geographic unit Incomplete strata pooled with preceding strata
Available in most statistical packages
Simple Random Sample as control/comparison

Overview Characteristics of Complex Samples
Public Use Census Data IPUMS-International Census Samples
Adjusting for Sampling ErrorAssessment StrategyResultsRecommendations and Future Work
The IPUMS projects are funded by the National Science Foundation and the National Institutes of Health
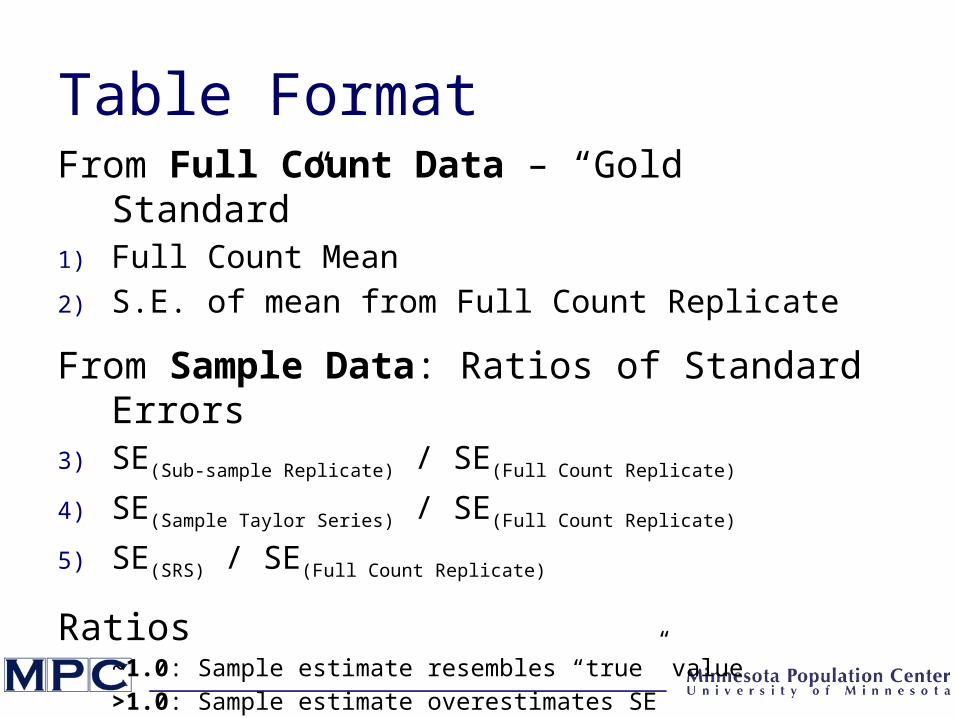
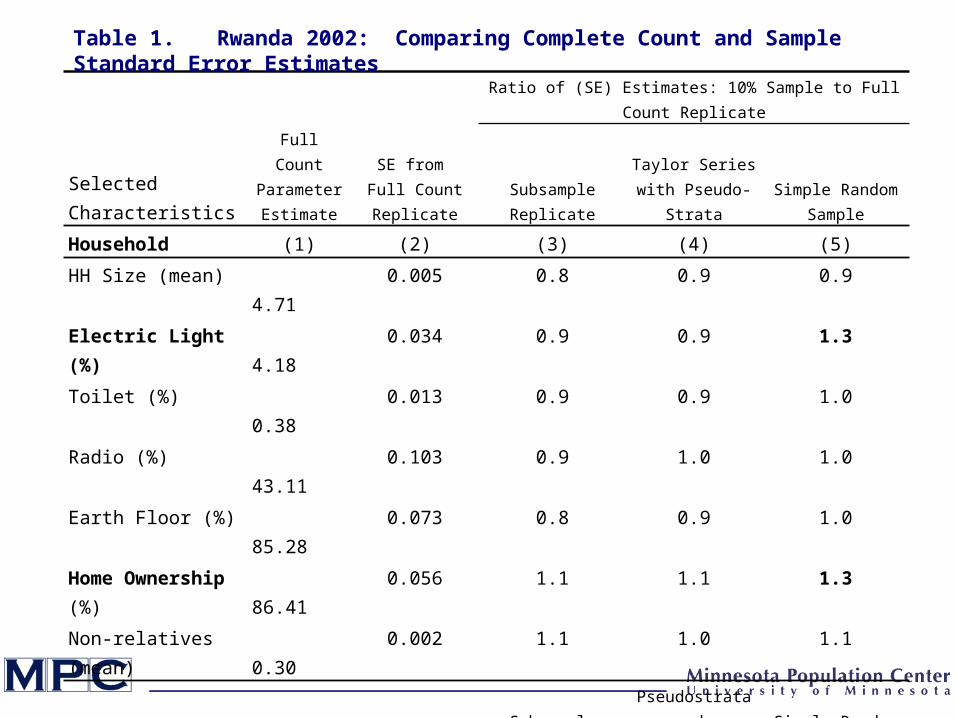
Table FormatFrom Full Count Data – “Gold Standard”1) Full Count Mean
2) S.E. of mean from Full Count Replicate
From Sample Data: Ratios of Standard Errors3) SE(Sub-sample Replicate) / SE(Full Count Replicate)
4) SE(Sample Taylor Series) / SE(Full Count Replicate)
5) SE(SRS) / SE(Full Count Replicate)
Ratios~1.0: Sample estimate resembles “true” value
>1.0: Sample estimate overestimates SE
<1.0: Sample estimate underestimates SE
Full Count Parameter Estimate
SE from Full Count Replicate
Ratio of (SE) Estimates: 10% Sample to Full Count Replicate
Selected Characteristics Subsample Replicate
Taylor Series with Pseudo-Strata
Simple Random Sample
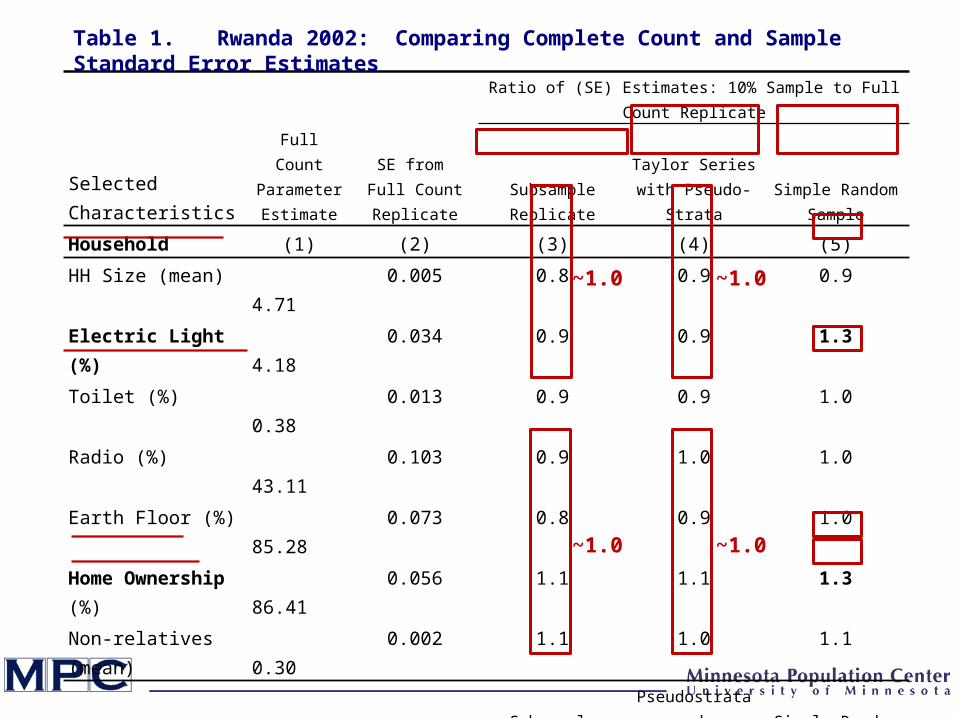
Household (1) (2) (3) (4) (5)
HH Size (mean) 4.71 0.005 0.8 0.9 0.9
Electric Light (%) 4.18 0.034 0.9 0.9 1.3
Toilet (%) 0.38 0.013 0.9 0.9 1.0
Radio (%) 43.11 0.103 0.9 1.0 1.0
Earth Floor (%) 85.28 0.073 0.8 0.9 1.0
Home Ownership (%) 86.41 0.056 1.1 1.1 1.3
Non-relatives (mean) 0.30 0.002 1.1 1.0 1.1
Person Subsample ReplicatePseudostrata and
HH ClusterSimple Random
Sample
Age (mean) 20.77 0.015 0.9 1.0 1.1
Sex (%) 46.81 0.045 0.9 1.0 1.1
Religion Catholic (%) Protestant (%)
46.69 26.16
0.1000.077
1.01.1
1.01.1
0.50.6
Married (%) 17.64 0.039 0.9 1.0 1.0
Literate (%) 39.75 0.060 0.9 0.9 0.8
Employed (%) 40.94 0.048 0.9 0.9 1.0
Table 1. Rwanda 2002: Comparing Complete Count and Sample Standard Error Estimates
~1.0
~1.0 ~1.0
~1.0
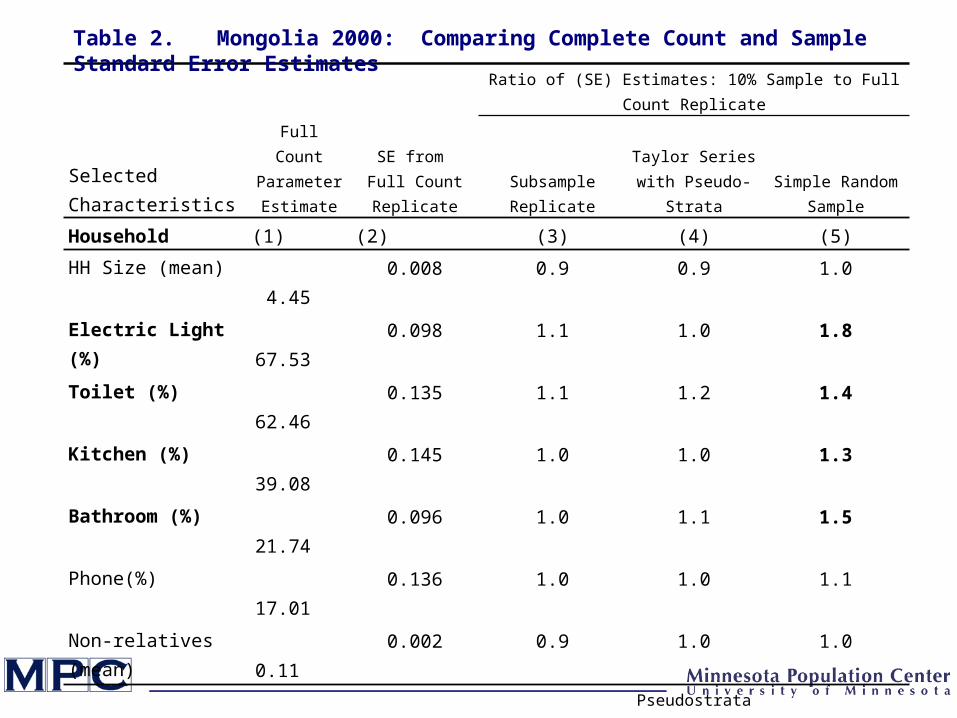
Full Count Parameter Estimate
SE from Full Count Replicate
Ratio of (SE) Estimates: 10% Sample to Full Count Replicate
Selected Characteristics Subsample Replicate
Taylor Series with Pseudo-Strata
Simple Random Sample
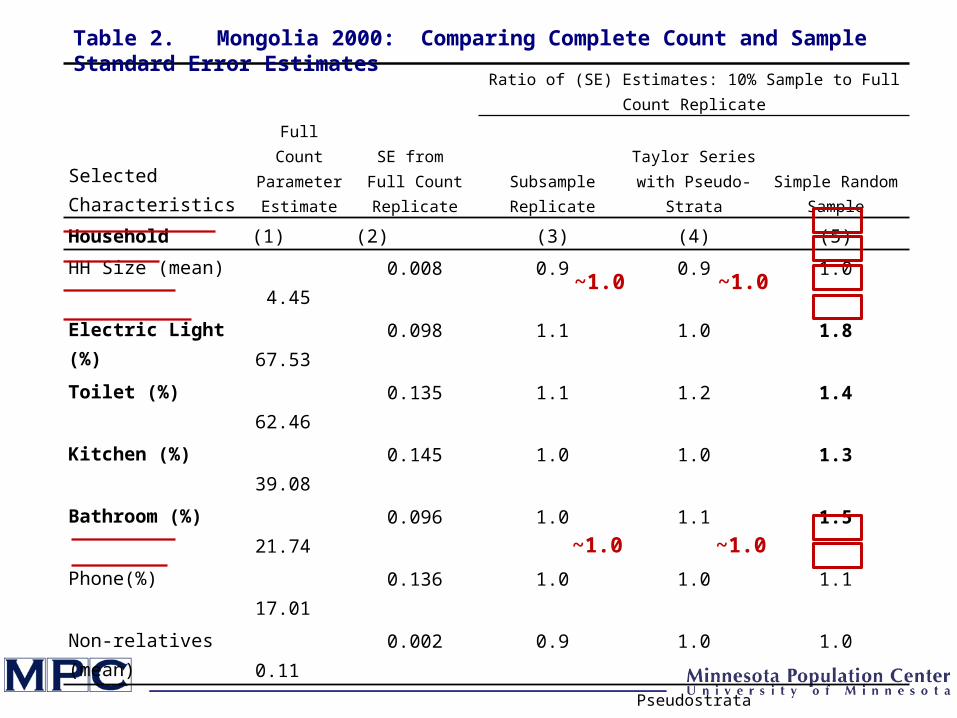
Household (1) (2) (3) (4) (5)
HH Size (mean) 4.45 0.008 0.9 0.9 1.0
Electric Light (%) 67.53 0.098 1.1 1.0 1.8
Toilet (%) 62.46 0.135 1.1 1.2 1.4
Kitchen (%) 39.08 0.145 1.0 1.0 1.3
Bathroom (%) 21.74 0.096 1.0 1.1 1.5
Phone(%) 17.01 0.136 1.0 1.0 1.1
Non-relatives (mean) 0.11 0.002 0.9 1.0 1.0
Person Subsample ReplicatePseudostrata and
HH ClusterSimple Random
Sample
Age (mean) 24.57 0.034 1.0 1.0 1.0
Sex (%) 49.47 0.078 0.9 1.0 1.2
Ethnicity Khalkh (%) Kazak (%)
81.59 4.28
0.1110.047
0.91.0
1.01.1
0.60.8
Married (%) 32.33 0.081 0.9 1.0 1.1
Literate (%) 81.56 0.071 1.1 1.0 1.0
Employed (%) 32.47 0.095 0.9 0.9 0.9
Table 2. Mongolia 2000: Comparing Complete Count and Sample Standard Error Estimates
~1.0
~1.0 ~1.0
~1.0
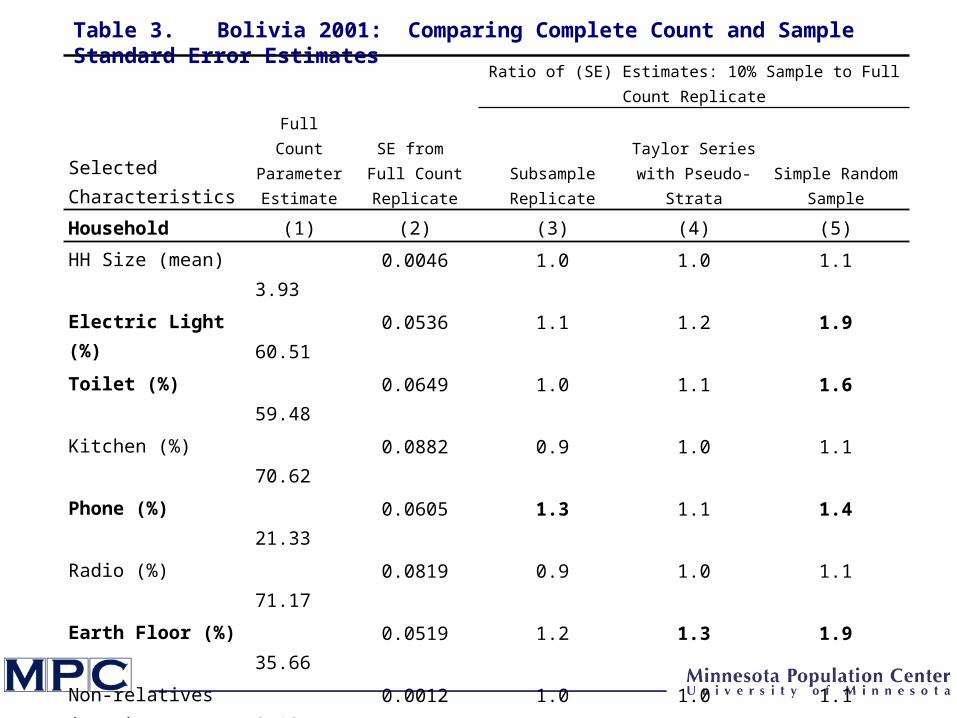
Full Count Parameter Estimate
SE from Full Count Replicate
Ratio of (SE) Estimates: 10% Sample to Full Count Replicate
Selected Characteristics Subsample Replicate
Taylor Series with Pseudo-Strata
Simple Random Sample
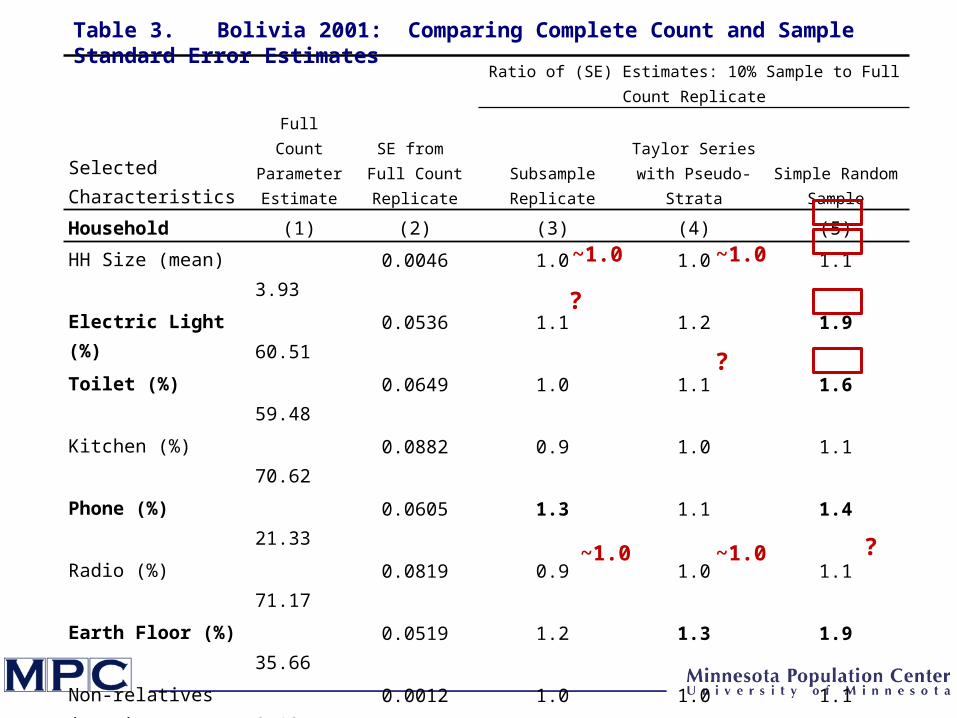
Household (1) (2) (3) (4) (5)
HH Size (mean) 3.93 0.0046 1.0 1.0 1.1
Electric Light (%) 60.51 0.0536 1.1 1.2 1.9
Toilet (%) 59.48 0.0649 1.0 1.1 1.6
Kitchen (%) 70.62 0.0882 0.9 1.0 1.1
Phone (%) 21.33 0.0605 1.3 1.1 1.4
Radio (%) 71.17 0.0819 0.9 1.0 1.1
Earth Floor (%) 35.66 0.0519 1.2 1.3 1.9
Non-relatives (mean) 0.19 0.0012 1.0 1.0 1.1
Person Subsample P-S and Cluster Simple Random
Age (mean) 24.70 0.0004 1.0 1.1 1.0
Sex (%) 49.84 0.0024 0.9 0.9 1.1
Ethnicity Quechua (%) Aymara (%)
30.69 25.19
0.00530.0047
1.00.8
1.00.9
0.80.8
Married (%) 26.09 0.0023 0.9 1.0 1.0
Literate (%) 74.99 0.0025 0.9 0.9 0.9
Employed (%) 34.37 0.0022 1.1 1.1 1.0
Table 3. Bolivia 2001: Comparing Complete Count and Sample Standard Error Estimates
?
?
?
~1.0 ~1.0
~1.0 ~1.0
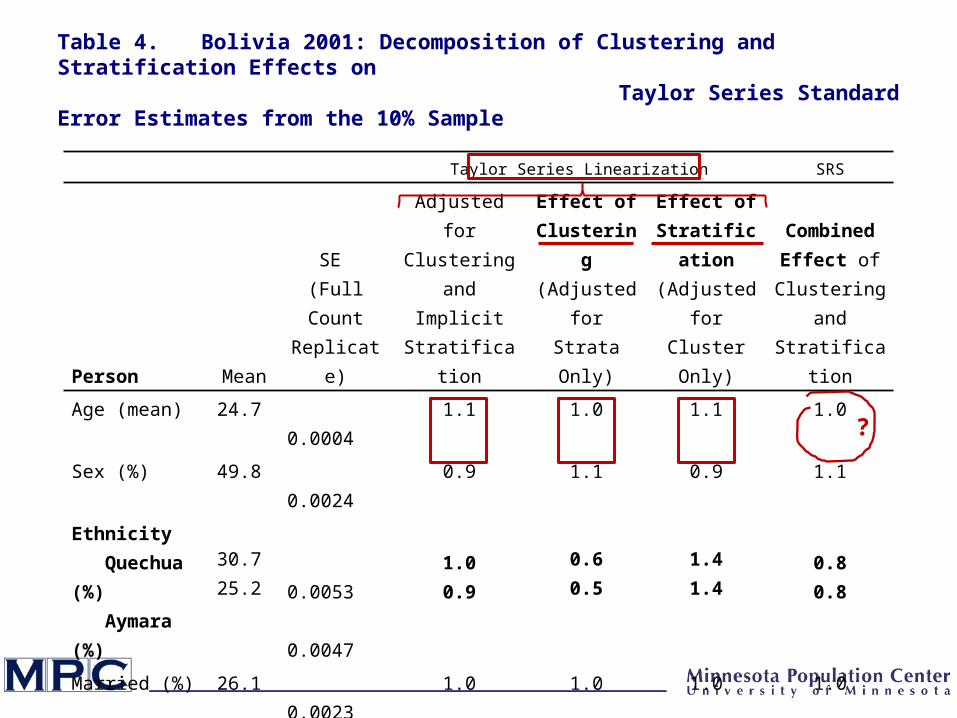
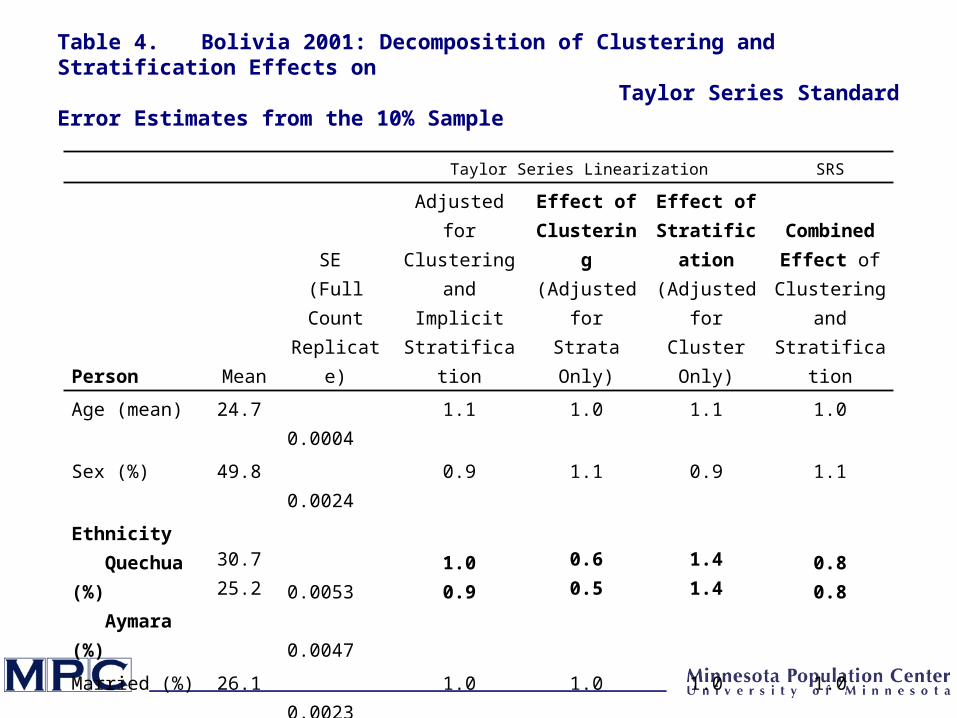
Taylor Series Linearization SRS
Person Mean
SE (Full Count Replicate)
Adjusted for Clustering and
Implicit Stratification
Effect of Clustering
(Adjusted for Strata Only)
Effect of Stratification (Adjusted for Cluster
Only)
Combined Effect of
Clustering and Stratification
Age (mean) 24.7 0.0004 1.1 1.0 1.1 1.0
Sex (%) 49.8 0.0024 0.9 1.1 0.9 1.1
Ethnicity Quechua (%) Aymara (%)
30.725.2
0.0053 0.0047
1.00.9
0.60.5
1.41.4
0.80.8
Married (%) 26.1 0.0023 1.0 1.0 1.0 1.0
Literate (%) 75.0 0.0025 0.9 0.9 1.0 0.9
Worked (%) 34.4 0.0022 1.1 1.0 1.2 1.0
Table 4. Bolivia 2001: Decomposition of Clustering and Stratification Effects on Taylor Series Standard Error Estimates from the 10% Sample
?
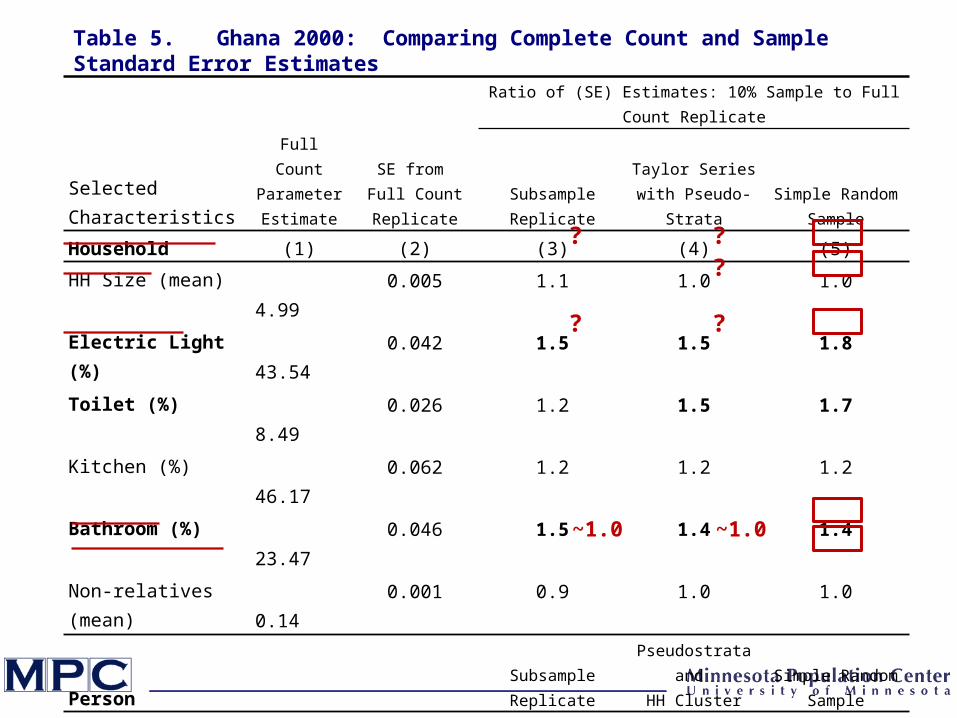
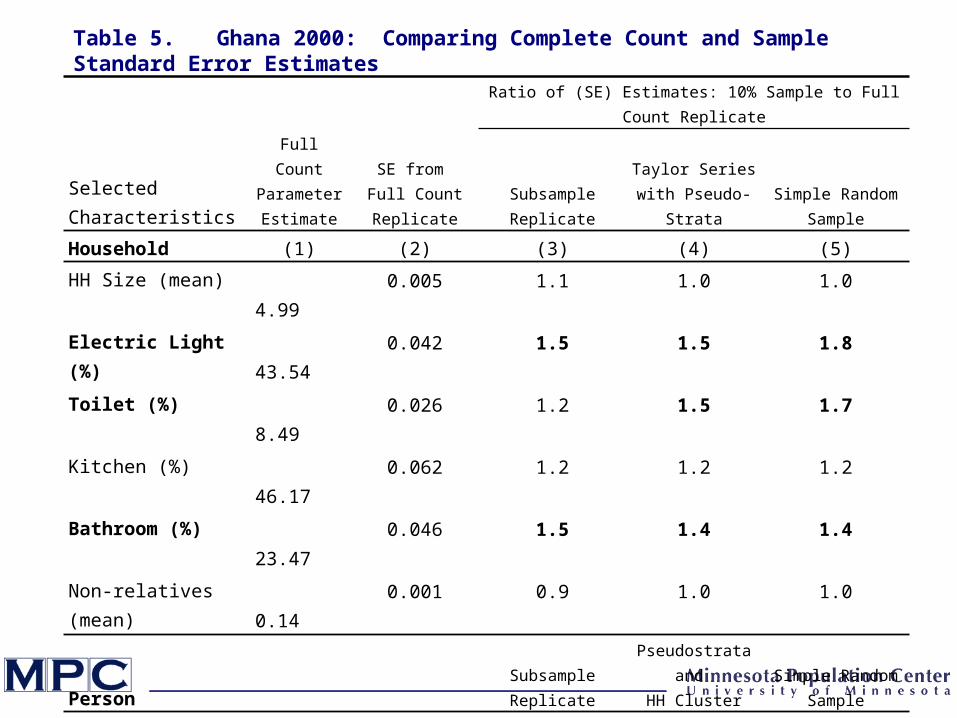
Full Count Parameter Estimate
SE from Full Count Replicate
Ratio of (SE) Estimates: 10% Sample to Full Count Replicate
Selected Characteristics Subsample Replicate
Taylor Series with Pseudo-Strata
Simple Random Sample
Household (1) (2) (3) (4) (5)
HH Size (mean) 4.99 0.005 1.1 1.0 1.0
Electric Light (%) 43.54 0.042 1.5 1.5 1.8
Toilet (%) 8.49 0.026 1.2 1.5 1.7
Kitchen (%) 46.17 0.062 1.2 1.2 1.2
Bathroom (%) 23.47 0.046 1.5 1.4 1.4
Non-relatives (mean) 0.14 0.001 0.9 1.0 1.0
Person Subsample ReplicatePseudostrata and
HH ClusterSimple Random
Sample
Age (mean) 23.90 0.013 1.0 1.1 1.0
Sex (%) 49.48 0.035 1.0 1.0 1.0
Ethnicity Akan (%) Mole-dagbani (%)
45.2815.25
0.0660.051
0.91.0
1.01.0
0.50.5
Married (%) 29.28 0.029 1.2 1.2 1.1
Literate (%) 34.00 0.038 1.0 1.1 0.9
Employed (%) 42.44 0.038 1.3 1.1 0.9
Table 5. Ghana 2000: Comparing Complete Count and Sample Standard Error Estimates
~1.0 ~1.0
?
? ??
?

Overview Characteristics of Complex Samples
Public Use Census Data IPUMS-International Census Samples
Adjusting for Sampling ErrorAssessment StrategyResultsRecommendations and Future Work
The IPUMS projects are funded by the National Science Foundation and the National Institutes of Health
Recommendations: Clustering
Many research projects need not worry Subpopulations that rely on only one person per HH
(e.g., fertility, aging, some work-related studies)
Design research to select a single person from the household
Use household identifier in stat packages Future: Variable that includes identifier for
geographic clustering as needed
Recommendations: Stratification
Most researchers need no modificationStratification increases precisionEstimates are conservative
If concerned, use pseudo-strata Investigations of weak relationshipsFor some sub-population studies
Future: Pseudo-strata variable to specify information about implicit stratification
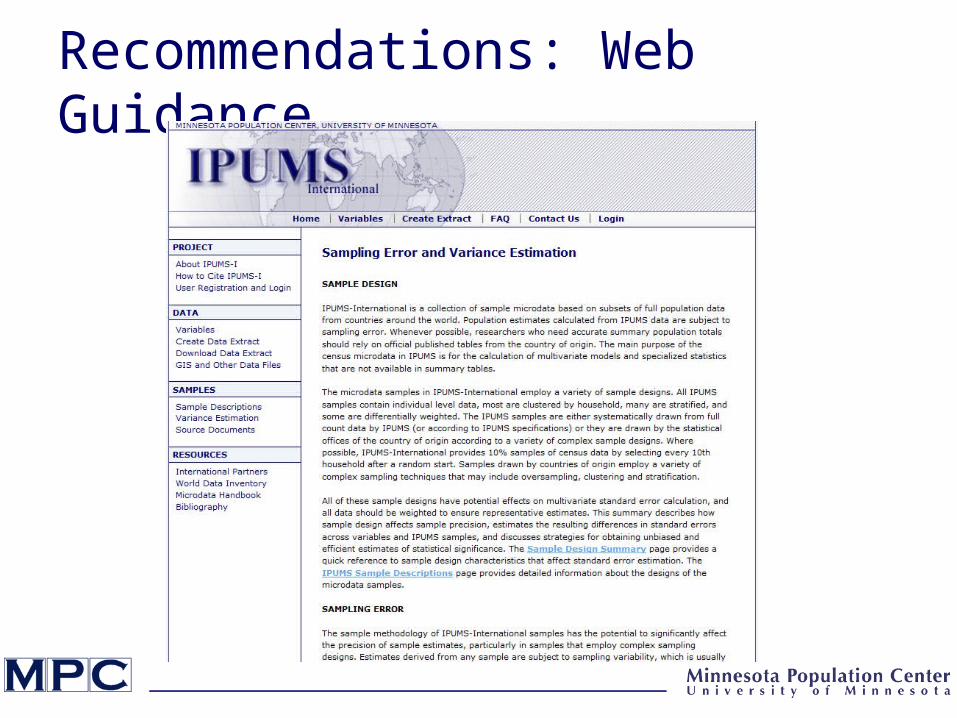
Recommendations: Web Guidance

Recommendations: Web Guidance
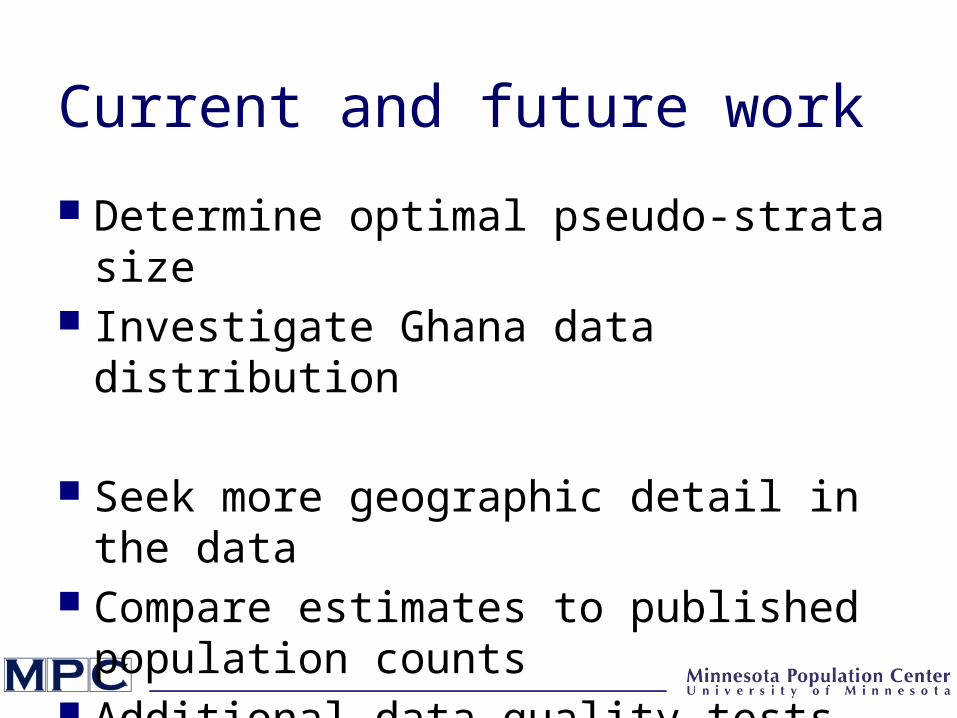
Current and future work
Determine optimal pseudo-strata size Investigate Ghana data distribution
Seek more geographic detail in the data Compare estimates to published
population counts Additional data quality tests
Thank you!
Questions?
Lara L. ClevelandIPUMS International
Minnesota Population Center
University of Minnesota
50 Willey Hall
225 – 19th Avenue South
Minneapolis, MN 55455
Full Count Parameter Estimate
SE from Full Count Replicate
Ratio of (SE) Estimates: 10% Sample to Full Count Replicate
Selected Characteristics Subsample Replicate
Taylor Series with Pseudo-Strata
Simple Random Sample
Household (1) (2) (3) (4) (5)
HH Size (mean) 4.71 0.005 0.8 0.9 0.9
Electric Light (%) 4.18 0.034 0.9 0.9 1.3
Toilet (%) 0.38 0.013 0.9 0.9 1.0
Radio (%) 43.11 0.103 0.9 1.0 1.0
Earth Floor (%) 85.28 0.073 0.8 0.9 1.0
Home Ownership (%) 86.41 0.056 1.1 1.1 1.3
Non-relatives (mean) 0.30 0.002 1.1 1.0 1.1
Person Subsample ReplicatePseudostrata and
HH ClusterSimple Random
Sample
Age (mean) 20.77 0.015 0.9 1.0 1.1
Sex (%) 46.81 0.045 0.9 1.0 1.1
Religion Catholic (%) Protestant (%)
46.69 26.16
0.1000.077
1.01.1
1.01.1
0.50.6
Married (%) 17.64 0.039 0.9 1.0 1.0
Literate (%) 39.75 0.060 0.9 0.9 0.8
Employed (%) 40.94 0.048 0.9 0.9 1.0
Table 1. Rwanda 2002: Comparing Complete Count and Sample Standard Error Estimates
Full Count Parameter Estimate
SE from Full Count Replicate
Ratio of (SE) Estimates: 10% Sample to Full Count Replicate
Selected Characteristics Subsample Replicate
Taylor Series with Pseudo-Strata
Simple Random Sample
Household (1) (2) (3) (4) (5)
HH Size (mean) 4.45 0.008 0.9 0.9 1.0
Electric Light (%) 67.53 0.098 1.1 1.0 1.8
Toilet (%) 62.46 0.135 1.1 1.2 1.4
Kitchen (%) 39.08 0.145 1.0 1.0 1.3
Bathroom (%) 21.74 0.096 1.0 1.1 1.5
Phone(%) 17.01 0.136 1.0 1.0 1.1
Non-relatives (mean) 0.11 0.002 0.9 1.0 1.0
Person Subsample ReplicatePseudostrata and
HH ClusterSimple Random
Sample
Age (mean) 24.57 0.034 1.0 1.0 1.0
Sex (%) 49.47 0.078 0.9 1.0 1.2
Ethnicity Khalkh (%) Kazak (%)
81.59 4.28
0.1110.047
0.91.0
1.01.1
0.60.8
Married (%) 32.33 0.081 0.9 1.0 1.1
Literate (%) 81.56 0.071 1.1 1.0 1.0
Employed (%) 32.47 0.095 0.9 0.9 0.9
Table 2. Mongolia 2000: Comparing Complete Count and Sample Standard Error Estimates
Full Count Parameter Estimate
SE from Full Count Replicate
Ratio of (SE) Estimates: 10% Sample to Full Count Replicate
Selected Characteristics Subsample Replicate
Taylor Series with Pseudo-Strata
Simple Random Sample
Household (1) (2) (3) (4) (5)
HH Size (mean) 3.93 0.0046 1.0 1.0 1.1
Electric Light (%) 60.51 0.0536 1.1 1.2 1.9
Toilet (%) 59.48 0.0649 1.0 1.1 1.6
Kitchen (%) 70.62 0.0882 0.9 1.0 1.1
Phone (%) 21.33 0.0605 1.3 1.1 1.4
Radio (%) 71.17 0.0819 0.9 1.0 1.1
Earth Floor (%) 35.66 0.0519 1.2 1.3 1.9
Non-relatives (mean) 0.19 0.0012 1.0 1.0 1.1
Person Subsample P-S and Cluster Simple Random
Age (mean) 24.70 0.0004 1.0 1.1 1.0
Sex (%) 49.84 0.0024 0.9 0.9 1.1
Ethnicity Quechua (%) Aymara (%)
30.69 25.19
0.00530.0047
1.00.8
1.00.9
0.80.8
Married (%) 26.09 0.0023 0.9 1.0 1.0
Literate (%) 74.99 0.0025 0.9 0.9 0.9
Employed (%) 34.37 0.0022 1.1 1.1 1.0
Table 3. Bolivia 2001: Comparing Complete Count and Sample Standard Error Estimates
Taylor Series Linearization SRS
Person Mean
SE (Full Count Replicate)
Adjusted for Clustering and
Implicit Stratification
Effect of Clustering
(Adjusted for Strata Only)
Effect of Stratification (Adjusted for Cluster
Only)
Combined Effect of
Clustering and Stratification
Age (mean) 24.7 0.0004 1.1 1.0 1.1 1.0
Sex (%) 49.8 0.0024 0.9 1.1 0.9 1.1
Ethnicity Quechua (%) Aymara (%)
30.725.2
0.0053 0.0047
1.00.9
0.60.5
1.41.4
0.80.8
Married (%) 26.1 0.0023 1.0 1.0 1.0 1.0
Literate (%) 75.0 0.0025 0.9 0.9 1.0 0.9
Worked (%) 34.4 0.0022 1.1 1.0 1.2 1.0
Table 4. Bolivia 2001: Decomposition of Clustering and Stratification Effects on Taylor Series Standard Error Estimates from the 10% Sample
Full Count Parameter Estimate
SE from Full Count Replicate
Ratio of (SE) Estimates: 10% Sample to Full Count Replicate
Selected Characteristics Subsample Replicate
Taylor Series with Pseudo-Strata
Simple Random Sample
Household (1) (2) (3) (4) (5)
HH Size (mean) 4.99 0.005 1.1 1.0 1.0
Electric Light (%) 43.54 0.042 1.5 1.5 1.8
Toilet (%) 8.49 0.026 1.2 1.5 1.7
Kitchen (%) 46.17 0.062 1.2 1.2 1.2
Bathroom (%) 23.47 0.046 1.5 1.4 1.4
Non-relatives (mean) 0.14 0.001 0.9 1.0 1.0
Person Subsample ReplicatePseudostrata and
HH ClusterSimple Random
Sample
Age (mean) 23.90 0.013 1.0 1.1 1.0
Sex (%) 49.48 0.035 1.0 1.0 1.0
Ethnicity Akan (%) Mole-dagbani (%)
45.2815.25
0.0660.051
0.91.0
1.01.0
0.50.5
Married (%) 29.28 0.029 1.2 1.2 1.1
Literate (%) 34.00 0.038 1.0 1.1 0.9
Employed (%) 42.44 0.038 1.3 1.1 0.9
Table 5. Ghana 2000: Comparing Complete Count and Sample Standard Error Estimates