Embed Size (px)
Citation preview

Variability in the Geometric Accuracy of Additively Manufactured Test Parts A.L. Cooke and J.A. Soons
National Institute of Standards and Technology* Gaithersburg, MD, USA
Abstract This paper describes the results of a study on the variability in the geometric accuracy of a metal test part manufactured by several service providers using either an electron beam or laser beam powder bed thermal fusion process. The part was a circle-diamond-square test part with an inverted cone that is used to evaluate the performance of five-axis milling machines. The study was conducted to aid development of standardized parameters and test methods to specify and evaluate the performance of additive manufacturing systems. Without standards for performance characterization, it is difficult to match system capabilities with part requirements and ensure consistent and predictable part quality across systems, operators, and manufacturing facilities.
Introduction There are many additive manufacturing (AM) system vendors with various types of AM systems on the market. No standards exist for the unambiguous specification, comparison, and evaluation of AM system performance. This makes it difficult to match machine/process capabilities with part requirements and ensure consistent and predictable results across systems, operators, and manufacturing facilities. There are many aspects of system performance to consider, such as processing speed, part accuracy, surface finish, maximum part size, minimum feature size, feasibility of overhang features, and part material properties. This paper focuses on part accuracy.
Standards for machine tool performance evaluation [1-4] are used by industry for machine selection, process planning, and quality control of machined parts. The standards define parameters that summarize key aspects of machine performance and test methods to assess these parameters. The standards are required to specify mutual obligations and methods of verification between users and vendors; to analyze machine capability, in particular regarding the expected errors of manufactured parts; to unambiguously compare the performance of machines; and to monitor, diagnose, and improve machine performance. The standards also enable vendors to demonstrate the effects of any product improvements, and can serve to set explicit targets for product development. The performance tests in machine tool standards can be parametric or composite. Parametric tests address one error source at a time and are often based on the application of instruments and reference artifacts to directly measure the error. An example of a parametric test is the application of a laser interferometer to measure the positioning error of a machine tool axis. In order to fully evaluate a machine, numerous parametric tests have to be performed. Composite tests, on the other hand, address multiple error sources at the same time. Composite tests, such as the machining of complex test parts, enable quicker performance evaluations, but it is more difficult to use the test results to fully characterize each contributing error source. Results of composite tests are therefore more difficult to generalize to arbitrary tasks and typically do not provide the level of detail required for error compensation.
* This work is an official contribution of the National Institute of Standards and Technology and is not subject to copyright in the United States. Commercial equipment and materials are identified in order to adequately specify certain procedures. In no case does such identification imply recommendation or endorsement by the National Institute of Standards and Technology, nor does it imply the materials or equipment are necessarily the best available for the purpose.
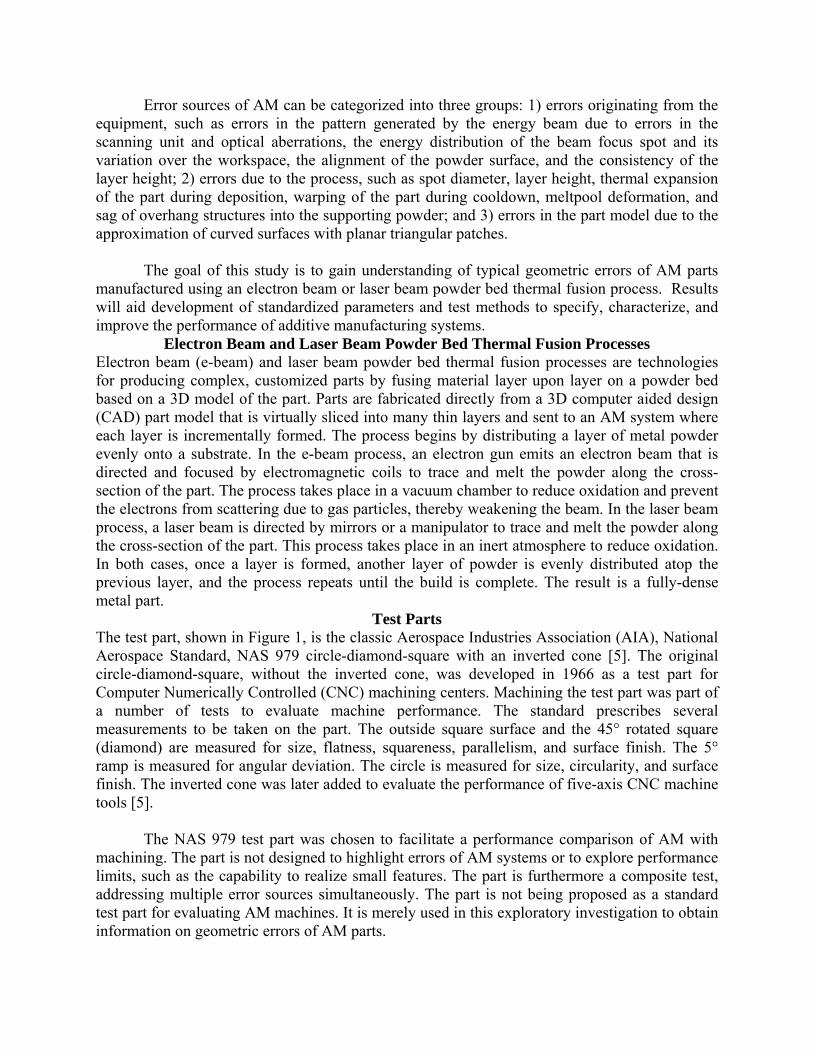
Error sources of AM can be categorized into three groups: 1) errors originating from the equipment, such as errors in the pattern generated by the energy beam due to errors in the scanning unit and optical aberrations, the energy distribution of the beam focus spot and its variation over the workspace, the alignment of the powder surface, and the consistency of the layer height; 2) errors due to the process, such as spot diameter, layer height, thermal expansion of the part during deposition, warping of the part during cooldown, meltpool deformation, and sag of overhang structures into the supporting powder; and 3) errors in the part model due to the approximation of curved surfaces with planar triangular patches.
The goal of this study is to gain understanding of typical geometric errors of AM parts manufactured using an electron beam or laser beam powder bed thermal fusion process. Results will aid development of standardized parameters and test methods to specify, characterize, and improve the performance of additive manufacturing systems.
Electron Beam and Laser Beam Powder Bed Thermal Fusion Processes Electron beam (e-beam) and laser beam powder bed thermal fusion processes are technologies for producing complex, customized parts by fusing material layer upon layer on a powder bed based on a 3D model of the part. Parts are fabricated directly from a 3D computer aided design (CAD) part model that is virtually sliced into many thin layers and sent to an AM system where each layer is incrementally formed. The process begins by distributing a layer of metal powder evenly onto a substrate. In the e-beam process, an electron gun emits an electron beam that is directed and focused by electromagnetic coils to trace and melt the powder along the cross-section of the part. The process takes place in a vacuum chamber to reduce oxidation and prevent the electrons from scattering due to gas particles, thereby weakening the beam. In the laser beam process, a laser beam is directed by mirrors or a manipulator to trace and melt the powder along the cross-section of the part. This process takes place in an inert atmosphere to reduce oxidation. In both cases, once a layer is formed, another layer of powder is evenly distributed atop the previous layer, and the process repeats until the build is complete. The result is a fully-dense metal part.
Test Parts The test part, shown in Figure 1, is the classic Aerospace Industries Association (AIA), National Aerospace Standard, NAS 979 circle-diamond-square with an inverted cone [5]. The original circle-diamond-square, without the inverted cone, was developed in 1966 as a test part for Computer Numerically Controlled (CNC) machining centers. Machining the test part was part of a number of tests to evaluate machine performance. The standard prescribes several measurements to be taken on the part. The outside square surface and the 45° rotated square (diamond) are measured for size, flatness, squareness, parallelism, and surface finish. The 5° ramp is measured for angular deviation. The circle is measured for size, circularity, and surface finish. The inverted cone was later added to evaluate the performance of five-axis CNC machine tools [5].
The NAS 979 test part was chosen to facilitate a performance comparison of AM with machining. The part is not designed to highlight errors of AM systems or to explore performance limits, such as the capability to realize small features. The part is furthermore a composite test, addressing multiple error sources simultaneously. The part is not being proposed as a standard test part for evaluating AM machines. It is merely used in this exploratory investigation to obtain information on geometric errors of AM parts.

A total of ten test parts were manufactured and then measured on a coordinate measuring machine (CMM). Five parts were manufactured using an e-beam, and will be referred to as e-beam parts. The other five parts were manufactured using a laser beam, and will be denoted as laser parts. All parts were manufactured by service providers, who were instructed to make the part without post-processing of any kind. For each process, two parts were made by the same machine but in different batches. The parts were manufactured on a base plate with the XY-plane parallel to the powder bed surface. Table 1 shows the manufacturing parameters for each part. Information regarding the scan speed of the e-beam or laser was not provided consistently by all manufacturers, so it is not present in the table. Test part B4 was solid, whereas the other test parts were built as hollow shells with a wall thickness of 3 mm. The laser parts were built with thin-walled support structures, which were not removed. The lack of post processing includes the customary heat treatment and hot isostatic pressing (HIPping) to relieve residual stresses and eliminate voids within the material. Since the parts were removed from the base plate, some deformation occurred to relieve the residual stresses. The support structures in the laser parts prevented some of this deformation.
Table 1: Manufacturing parameters for each test part
Process Test Part Material
Number of Parts
Layer Thickness
(m) E-Beam A1 Ti-6Al-4V 1 100
A2 Ti-6Al-4V 1 100 A3 Ti-6Al-4V 1 100 A4 Ti-6Al-4V 2 100
Laser B1 17-4 Stainless Steel 1 40 B2 17-4 Stainless Steel 2 30 B3 17-4 Stainless Steel 1 20 B4 15-5 Stainless Steel 1 20
(a)
Figure 1: Circle-diamond-square with inverted cone: (a) Isometric view, (b) Top view; the height of the test part is approximately 35 mm
(b)
≈ 100 mm
≈ 100 mm Diamond
Circle
Square Inverted
Cone
5° Ramp
Y
X

Results and Discussion A CMM was used to measure thousands of points on the features of interest using a contact scanning probe with a radius of 1.5 mm. The CMM was accurate to within ±5 m for the measured part features. The part errors are calculated relative to the STL computer model of the part to avoid contamination of the results with errors due to the geometry approximation by the STL model. This study only enables performance comparisons between parts made by the same process. Parts made by different processes are difficult to compare, because the e-beam parts are all made of Ti-6Al-4V whereas the laser parts are made of stainless steel. Ti-6Al-4V and stainless steels 17-4 and 15-5 have differences in material properties, such as thermal expansion and thermal conductivity, that affect process errors. Additionally, the process parameters vary greatly between the two processes. The e-beam parts were manufactured using a larger layer size and, most likely, a larger spot size, indicating more aggressive process conditions. Also, the laser parts have support structures that reduce the effects of residual stresses on the part geometry.
The first comparison addresses the circularity and size of the circle. The highlighted portion of the test part shown in Figure 2 denotes the area of comparison. With the CMM, three scans were taken along the circumference of the circle at three different heights, and the size errors and circularity (peak to valley, PV) are compared in Table 2. A range, corresponding to four times the standard deviation s of the circularity data, is also provided in the table because the PV result is strongly affected by local peaks in the data. One type of peak was observed on many features for both the laser and e-beam parts. It corresponds to small, spherical protrusions of material.
Table 2: Mean radius error and circularity for the e-beam and laser parts Mean Radius
Error Circularity Process Test Part
Peak to Valley 4s (mm) (mm) (mm)
A1 -0.130 0.322 0.240 A2 0.157 0.249 0.204 A3 -0.602 0.214 0.185
E-Beam
A4 -0.095 0.352 0.282 B1 -0.084 0.156 0.060 B2 0.043 0.094 0.089 B3 0.006 0.095 0.077
Laser
B4 -0.010 0.121 0.058
Figure 2: Highlight of the area of comparison

Figure 3 shows the form and size errors of two parts made by the same machine using the same process parameters. The results indicate a relatively high degree of repeatability, providing opportunities for compensation.
The circularity errors of test parts A1-A4 and B1-B3, shown in Figures 4 and 5, have a similar cloverleaf pattern which is not present in part B4. This is probably because part B4 is a solid part, and the others are shells with a 3 mm wall thickness. The cloverleaf pattern is consistent with the inward bended shape observed for the side surfaces of the square, and seems to be due to thermally induced strains. The resulting circularity error is larger for the e-beam parts, probably due to the lack of support structures, more aggressive process conditions, and the different part material. The cloverleaf pattern was not observed for the cone feature. Test parts A3 and A4 show an elliptical error component in the circularity plot with major axes at 45º, which is indicative of a squareness error between the X- and Y-axes of the generated pattern.
Figure 6(a) displays the squareness error, expressed as an angle, between the front and left surface of the square. The large squareness error in part A4 is consistent, but significantly larger, than the squareness component present in the circularity plot. The false-color surface error plot of part A4 in Figure 6(b) shows relatively large surface errors within a triangular patch on each of the planes used for the squareness evaluation. These surface errors result in a large squareness error, and are consistent with an error in the machine’s interpretation of the STL part model.
Figure 3: The average of the three error traces around the circular section of two parts made on the same system: (a) E-beam system and (b) Laser system.
(a) (b)
E-Beam
Laser
Part 1
Part 2

A1 A2
A3 A4
Mean radius error: -0.130 mm Circularity (Peak to Valley): 0.322 mm
Mean radius error: 0.157 mm Circularity (Peak to Valley): 0.249 mm
Mean radius error: -0.602 mm Circularity (Peak to Valley): 0.214 mm
Mean radius error: -0.095 mm Circularity (Peak to Valley): 0.352 mm
Figure 4: The average of three error traces around the circular section of the e-beam parts. Note that the plots have different scales.

B1 B2
B4
Mean radius error: -0.084 mm Circularity (Peak to Valley): 0.156 mm
Mean radius error: 0.043 mm Circularity (Peak to Valley): 0.094 mm
Mean radius error: 0.006 mm Circularity (Peak to Valley): 0.095 mm
Mean radius error: -0.010 mm Circularity (Peak to Valley): 0.121 mm
Figure 5: The average of three error traces around the circular section of the laser parts. Note that the plots have different scales.
B3

Figure 7 depicts size errors of each part along the X-, Y-, and Z-axes. Each size is calculated as the distance along a line through the center of the circle between best-fit planes through the measured points. For each part, size errors along the X- and Y-axes are similar in magnitude and sign. Along the Z-axis, most parts are undersized.
Figure 7: Size errors along (a) the X-axis, (b) the Y-axis, and (c) the Z-axis; (d) diagram indicating the evaluated size error along the Z-Axis.
(d)
(b) (a)
(c)
Figure 6: (a) Squareness error between the front and left surface of the square for each test part; (b) False-color representation of the surface errors of part A4.
(a)
mm
Triangular areas
(b)

Figures 8 and 9 display the top views of the false-color surface error plots of the test parts. In these plots, each dot represents the measured error at a point on the part in the direction of the local surface normal. Positive errors indicate the presence of excess material. The parts are aligned along planes through the part origin (Figure 10). It is evident from these plots that there are errors in the position of all the features. This is most easily seen for the inverted cone. The sloped surfaces on the side of the part show a periodic straightness error whose wavelength is approximately equal to the layer height divided by the sine of the slope angle. The amplitude was smaller than the slope-corrected layer height, in part due to the filtering action of the probe sphere.
Figure 8: Top views of the false-color surface error plots of the e-beam parts.
A1
mm
A2
mm
A3
mm
A4
mm

Figure 10: Location of the part origin.
Origin
Figure 9: Top views of the false-color surface error plots of the laser parts
B1
mm
B2
mm
B3
mm
B4
mm

The large errors observed for part A3 are mainly due to a constant scaling or magnification error in the XY-plane, a constant scaling error in the Z-direction, and, to a lesser extent, by a squareness error between the X- and Y-axes. Figure 11 shows the reduction of the observed part errors when these error components are removed. The parameters describing the error components were simultaneously estimated through least-squares minimization of the residual part errors. This example shows the potential of using test parts to obtain machine or process compensation parameters. However, for a compensation model to be valid for arbitrary parts, care has to be taken to avoid contamination of the estimated model parameters with part-specific process errors. Special test part designs, such as a grid pattern, can aid in this effort.
Figure 11: Errors of part A3 before and after error compensation: Top view of false-color error plot (a) Before and (d) After; Average of the three error traces around the circular section (b) Before and (e) After; Histogram of the surface errors (c) Before and (f) After.
mm
mm
(b) (a) (c)
(e) (d) (f)

Conclusions In this study, we analyzed the geometric accuracy of ten metal test parts manufactured by several service providers using either an electron beam or laser beam powder bed thermal fusion process. The study only enables comparisons between parts made by the same process. Although the nature of the study precludes generic conclusions, we can make the following observations: Overall, the observed errors of the AM parts are significantly larger than those of typical
machined parts, even for the solid part, by at least an order of magnitude. However, this difference is likely to be smaller for heat-treated and HIPped parts.
Errors seem to have a high level of repeatability, providing opportunities for compensation strategies.
Errors of parts made by different machines show common patterns that may be due to the process, i.e., would occur even if the equipment were perfect. Thermal effects, including deformations due to residual stresses, are most likely the cause.
Heat treatment and careful consideration of thermal effects seem essential to obtain part accuracy, especially for thin-walled parts without support structures.
Given the nature of the AM process, test parts may play an important role in standards for performance characterization. Instrumented tests may be difficult for a powder bed thermal fusion machine, but they may be more feasible for deposition type AM machines.
Future Work The relatively large magnitude of process errors requires the careful consideration of support structures and post process heat treatment, such as HIPping, in future studies, especially for those involving thin-walled parts. Also, it will be necessary to fabricate test parts under controlled conditions to evaluate variations in part geometry with respect to process parameters. Furthermore, it is necessary to design test parts that cater to the capabilities and error sources of AM and that facilitate separation of equipment and process errors, thus enabling the unambiguous assessment of machine performance and the development of predictive process models.
References [1] ANSI/ASME B5.54 – Methods for Performance Evaluation of Computer Numerically
Controlled Machining Centers, 2005. [2] ANSI/ASME B5.57 – Methods for Performance Evaluation of Computer Numerically
Controlled (CNC) Lathes and Turning Centers, 1998. [3] ISO 230 – Test Code for Machine Tools. [4] ISO 10791 – Test Conditions for Machining Centres. [5] AIA/NAS, NAS 979 Uniform Cutting Tests - NAS Series Metal Cutting Equipment
Specifications, 1969.