Embed Size (px)
Citation preview

DESIGN AND OPTIMIZATION OF ADDITIVELY MANUFACTURED
HEAT SINK AND HEAT SPREADER FOR MICROELECTRONICS
COOLING
By,
Aditya Krishna Ganesh Ram
Presented to the Faculty of the Graduate School of
The University of Texas at Arlington
in partial fulfillment of the requirements
for the degree of
MASTER OF SCIENCE IN MECHANICAL ENGINEERING
THE UNIVERSITY OF TEXAS AT ARLINGTON
August 2019

II
Copyright © by Aditya Krishna Ganesh Ram 2019
All Rights Reserved

III
ACKNOWLEDGEMENT
I would like to express my sincere gratitude to Dr. Ankur Jain for giving me an opportunity to
work in his group. His help me in developing a mindset that is needed for doing research is highly
appreciated. My heartfelt thanks to Darshan Ravoori Babu for providing a constant support
throughout my work in the lab. His help and contribution were significant in the heat sink work
as a team member.
I also thank Dr. Robert Taylor and Dr. Miguel Amaya for their time to review my work as
committee members that helped me in shaping this report. Dr. Taylor’s help along with his student
Amogh Taraikar in my studies over Topology Optimization methods were significant.
My heartfelt thanks also goes to Dr. Joshua Gess and Dr. Naveenan Thiagarajan for their help in
testing the heat sink and manufacturing the heat sink respectively as part of the ASME Heat sink
design competition.
All these works would not have been made possible with the support of all my Lab members
especially Mohammad Parhizi whose help in using Ansys cfx is highly appreciated, Swapnil
Suryakant Salvi and Hardikkumar Prajapati for insightful discussions. Last but not the least I
thank my mom-Mrs.Aruna, dad-Mr.Ganesh Ram and all other family members for their constant
support no matter what and my friends who also has their contribution in shaping me to whom I
am now. I am very grateful to my uncle Ganesh Vijayaraghavan for his time and sincere efforts
throughout my Masters.
August 8, 2019

IV
ABSTRACT
DESIGN AND OPTIMIZATION OF ADDITIVELY MANUFACTURED
HEAT SINK AND HEAT SPREADER FOR MICROELECTRONICS
COOLING
Aditya Krishna Ganesh Ram, MS
The University of Texas at Arlington
Supervising Professor: Dr. Ankur Jain
High performance cooling is a critical requirement for modern microprocessors that generate
large amounts of non-uniformly distributed heat. Metal heat spreaders and heat sinks have been
traditionally used for thermal management. While the design of these components has
traditionally been restricted by manufacturability, in recent years, additive manufacturing has
offered the capability to manufacture almost any design. This work analyzes and optimizes the
performance of an additively manufactured heat sink and heat spreader. Computational heat
transfer simulations were carried out to understand the variation of chip temperature and pressure
drop for various designs. Discussion of key findings include the thermal performance
improvement by doing a parametric study on the designs, both in heat sink and heat spreader. The
features that were important in either of the designs for a better cooling were given an emphasis.
The changes in design that were needed to be made for a successful print of the heat sink using
Direct Metal Laser Sintering (DMLS) are presented.
V
TABLE OF CONTENTS
ACKNOWLEDGEMENT .......................................................................................................................III
ABSTRACT .............................................................................................................................................. IV
TABLE OF CONTENTS.......................................................................................................................... V
TABLE OF FIGURES ........................................................................................................................... VII
CHAPTER 1 ............................................................................................................................................... 1
INTRODUCTION...................................................................................................................................... 1
CHAPTER 2 ............................................................................................................................................... 4
THERMAL MANAGEMENT OF MICRO-ELECTRONICS .............................................................. 4
2.1 Heat Sink Based Thermal Management solution: ...................................................................... 5
2.1.1 Thermal Resistance: ........................................................................................................... 7
2.1.2 Material: ............................................................................................................................. 8
2.1.3 Surface Area: ..................................................................................................................... 8
2.1.4 Pressure Drop: ................................................................................................................... 8
2.2 Commonly used setup: ............................................................................................................... 9
CHAPTER 3 ............................................................................................................................................. 10
METAL ADDITIVE MANUFACTURING........................................................................................... 10
3.1 History: ..................................................................................................................................... 10
3.2 Capability: ................................................................................................................................ 11
3.2.1 Solid-state sintering: ........................................................................................................ 11
3.2.2 Liquid phase sintering: ..................................................................................................... 12
3.2.3 Chemically Induced Sintering: ........................................................................................ 12
3.2.4 Full Melting: .................................................................................................................... 12
3.3 Direct Metal Laser Sintering: ................................................................................................... 12
3.4 Design Constraints: .................................................................................................................. 14
CHAPTER 4 ............................................................................................................................................. 16
HEAT SINK DESIGN PROCESS .......................................................................................................... 16
4.1 Calculation of Figure of Merit: ................................................................................................. 16
4.2 Flow Resistance Consideration: ............................................................................................... 17
4.3 Resistance to heat transfer consideration: ................................................................................. 18
4.4 Number of fins and the gap between them: .............................................................................. 18
4.5 Design trade-offs between thermal resistance and manufacturability: ..................................... 20
CHAPTER 5 ............................................................................................................................................. 23

VI
THEORETICAL ANALYSIS OF THE HEAT SINK .......................................................................... 23
5.1 Ansys cfx solver: ...................................................................................................................... 23
5.2 Laminar Fluid Model: ............................................................................................................... 24
5.2.1 Continuity Equation: ........................................................................................................ 24
5.2.2 Momentum Equations: ..................................................................................................... 24
5.2.3 Energy Equation: ............................................................................................................. 24
5.3 Turbulence model: .................................................................................................................... 25
5.3.1 k-𝜺 model: ........................................................................................................................ 25
5.4 Setup: ........................................................................................................................................ 26
5.5 Boundary Conditions: ............................................................................................................... 27
5.6 Flow Observation: .................................................................................................................... 28
5.7 Meshing: ................................................................................................................................... 29
5.8 Simulations setup: .................................................................................................................... 30
5.9 Post Processing: ........................................................................................................................ 30
5.10 Thermal Analysis results: ......................................................................................................... 31
CHAPTER 6 ............................................................................................................................................. 33
EXPERIMENTAL ANALYSIS OF THE HEAT SINK ....................................................................... 33
6.1 Experimental Setup: ................................................................................................................. 33
6.1.1 Temperature Measurement: ............................................................................................. 34
6.1.2 Pressure Measurement: .................................................................................................... 34
6.2 Results: ..................................................................................................................................... 35
6.3 Comparison of Theoretical and Experimental Results: ............................................................ 35
6.4 Flow Model Comparison: ......................................................................................................... 36
CHAPTER 7 ............................................................................................................................................. 37
HEAT SPREADER DESIGN PROCESS .............................................................................................. 37
7.1 Design Process: ........................................................................................................................ 37
7.2 Design Parameters: ................................................................................................................... 38
Chapter 8 .................................................................................................................................................. 39
THEORETICAL ANALYSIS OF THE HEAT SPREADER .............................................................. 39
8.1 Setup: ........................................................................................................................................ 39
8.2 Boundary Conditions: ............................................................................................................... 40
8.3 Flow Observation: .................................................................................................................... 40
8.4 Thermal Analysis Results: ........................................................................................................ 42
CONCLUSION ........................................................................................................................................ 45
References ................................................................................................................................................. 47

VII
TABLE OF FIGURES
Figure 2.1: Conventional air-cooled thermal management system 6 Figure 2.3: Conduction and convective resistance 8 Figure 2.4: Conventional heat sink[13] 9 Figure 3.1: Direct Metal Laser Sintering (DMLS)[21] 13 Figure 3.2: Effects of different feature angles[23] 15 Figure 3.3: Support required for different orientation of the same part 15 Figure 3.4: Orientation of the part with the raster[24] 15 Figure 4.1: Bezier curve formation 17 Figure 4.2: Final bezier curve 17 Figure 4.3: Final designed heat sink 19 Figure 4.4: Printed heat sink 19 Figure 4.5:Model sink for wavelength analysis 20 Figure 4.6: Final Heat sink fin feature angle 21 Figure 4.7: Maximum temperature of model heat sink vs feature angle 21 Figure 5.1: Analysis setup 26 Figure 5.2: Analysis setup with the boundary conditions 27 Figure 5.3: Using Laminar Fluid flow model 28 Figure 5.4: Using k-𝜀 model 29 Figure 5.5: Thermal analysis contour for the heat sink 31 Figure 5.6: Thermal analysis contour for conventional heat sink 32 Figure 5.7: Final design Thermal Analysis Plot 32 Figure 6.1: Experimental setup assumed from the guidelines data 33 Figure 6.2: Thermocouple hole 34 Figure 6.3: Streamline comparison for both Laminar and turbulent model 36 Figure 7.1: Heat spreader design 37 Figure 7.2: Heat spreader dimensions at the cross section 38 Figure 8.1: Boundary conditions for the environment 39 Figure 8.2: Boundary conditions to the heat spreader 40 Figure 8.3: Flow streamline for 1.2 mm air gap 41 Figure 8.4:Flow streamlines for 1 mm air gap 41 Figure 8.5: Flow streamlines for 0.8 mm airgap 42 Figure 8.6: Thermal contour plot – side view 42 Figure 8.7: Thermal contour plot for the top and bottom plate 42 Figure 8.8: Temperature at hot spot by varying plate thickness with respect to air gap 43 Figure 8.9:Variation of hot spot temperature for plate thickness 43 Figure 8.10:Temperature variation with air gap 44
1
CHAPTER 1
INTRODUCTION
With additive manufacturing (AM), also called direct digital manufacturing (DDM), being
developed for a wide variety of materials, its freedom of designs is being tapped continuously in
almost every field of interest. Initially developed only for the use of polymers in manufacturing
parts additively using the fused deposition modelling (FDM), different processes had been
developed such as vat photopolymerization, material jetting, powder bed fusion, etc. to suit
different materials for additively manufactured parts. The increase in cost required for the
additional tooling to manufacture complex designs using conventional manufacturing methods
can be eliminated using additive manufacturing [1]
In this thesis a heat sink based thermal management solution has been attempted to optimize and
improve performance using the freedom available in designing the heat sink for additive
manufacturing. As the component density increases in a semiconductor device, design
optimization has been considered for improvement, to serve as a solution for increase in cooling
performance required. Additive manufacturing has been found and proved by many researchers
to be one of the solutions for manufacturing complex designs [2] that are suggested to perform
well than the plate fin sinks that are currently manufactured by conventional manufacturing
methods.
Optimization of the heat sink design was carried out based on the design guidelines proposed for
a competition organized by ASME. The primary objective of the optimization was to bring down
the figure of merit which relates thermal performance and power required for forced convection.
In search of a better design compared to the conventional plate finned design, reduction in thermal

2
resistance and flow resistance was given utmost importance. Therefore, looking for designs that
increases the overall surface area of the sink, wavy finned designs were used and studied based
on its advantage in improvement of thermal performance reported by Sikka et al. [3]. The main
factors considered by them to adopt wavy fin heat sink design was to explore the fact that
waviness will deflect the flow and impingement on the fin surface and the boundary layer could
be interrupted. They concluded that at higher flow rates of forced convection, wavy finned design
proved to be better performing than other designs that are conventionally manufactured such as
diagonal, serpentine and corrugated finned designs that were compared experimentally. Wang et
al[4] investigated performance improvement of wavy finned and straight finned channels
computationally. They concluded that wavy channels interrupt the boundary layers in a periodic
fashion which improves the heat transfer performance. They also found that the Nusselt number
for wavy finned channels are higher than the plate fin arrangement which is related directly to
heat transfer due to convection and conduction [4]. It has also been proved that the designs such
as that of a winglet, generates vortices in the flow improving the air side heat transfer
performance, from the theoretical analysis performed by Jain et al [5]. Similarly, punched
winglets over a fin were proved to provide improvement in the overall heat transfer [6].
After the development of metal additive manufacturing, heat sinks that were manufactured
additively were of interest, as complex designs can be manufactured with ease. Looking on the
surface quality, products manufactured using direct metal laser sintering (DMLS) had a certain
amount of roughness when compared to the smooth surfaces generated by conventional
manufacturing methods. It has been reported that this roughness makes the flow over the surface
more circulatory in nature inducing turbulence when compared to the smooth surfaces and hence
thermal performance improvement is obtained. A 73% improvement in convective heat transfer
has been reported because of the induced roughness [7]. Wong et al manufactured various

3
complex heat sink designs which demonstrated the capability of selective laser melting (SLM)
and also compared their performance over heat transfer and pressure drop experimentally [8].
Microchannel heat sinks for micro-sized devices, are thought to have their roots from the idea
proposed and the analysis made by Tuckerman and Pease in 1981 [9]. They used silicon etching
to manufacture those heat sinks. They experimentally evaluated the performance of having
rectangular channels in heat sinks and concluded that the use of high aspect ratio channels reduce
thermal resistance with coolant viscosity determining the minimum channel width that can be
used. After that numerous studies were performed on microchannel heat sinks for different
coolants. Govindraj has assessed the principle of Electrowetting on dielectric(EWOD) by forcing
dielectric fluids with the help of electric field, making the droplet pass through the hotspot for
cooling [10]
Different manufacturing procedures such as Silicon etching, Diamond machining, wire cutting
etc. have been used to manufacture sinks. Currently, the capability of Additive Manufacturing in
making heat sinks comparable to those sizes are being evaluated actively [11]. Here, one such
product that can act as both heat spreader and heat sink for localized hotspot cooling applications
with microchannel structure has been investigated.

4
CHAPTER 2
THERMAL MANAGEMENT OF MICRO-ELECTRONICS
The working principle of a semiconductor depends directly on the temperature. The electron
transport on which the device works, varies at different temperature levels. Higher temperatures
will cause failure of the device which is undesirable especially when the device is meant to work
on critical technologies. For example, a semiconductor device that manages the components that
help in the working of an engine of a rocket carrying astronauts to the moon, cannot fail because
it puts the lives of the astronauts in danger. It is noted that, among all the failures of electronic
devices 50% are due to unsuitable temperatures created by the operation of those devices [12] It
has been found that, for every 2° C increase in the device temperature, its reliability decreases by
10%. Hence, impact of temperature on the reliability of a semi-conductor device has been taken
up seriously. The main goal of thermal management is classified to obtain desirable performance
from the device and to increase its reliability, thus, preventing its failures.
According to L.T Yeh, the factors that need to be considered while designing a thermal
management system for a semi-conductor device are, [12]
1. Performance in reducing the temperature of the device
2. Manufacturability of the parts used in the system
3. Maintainability of the system
4. Compatibility of the system with the environment under use
5. Total cost including the manufacturing and operation cost
Currently, the maximum limit of temperature reached for a semi-conductor device used by U.S.
Air Force and Navy was 105° C. [12]

5
Developments in the micro-electronics industry have given rise to implementation of several
transistors within a small area of the device. Although the rise in temperature of a single transistor
has been reduced when compared to those of the past, as the density of transistors increases the
overall temperature of the device increases. Sometimes, because of the complexity involved in
designing a device, the temperature distribution over a device may not be uniform which gives
rise to hot spots in the device. This greatly reduces the performance and reliability of the device.
Although there are different kinds of thermal management systems such as air-cooling and liquid
cooling, widely used low temperature control systems uses air-cooling. In an air-cooled thermal
management setup, air is forced through heat sink or a heat exchanger that picks up the heat from
an electronic device. In a liquid cooled thermal management solution, a liquid coolant passes
through a heat exchanger to pick up the heat. Liquid cooling is used mostly in high power, high
performance applications or technologies which are used for prolonged period.
2.1 Heat Sink Based Thermal Management solution:
The purpose of a heat sink has been to supply the necessary cooling to keep the device
temperatures down. It is a widely used method to control the temperature of a device where
heating is an issue. Higher temperatures will make it detrimental for the device by damaging the
device either by melting the device or causing an explosion to the device due to a chain reaction
of effects that might happen in a device. The reason for it is that, devices usually comprise of a
mix of different components which react differently to higher temperatures. Apart from the above
said effects there are also other reasons such as a change in working physics of the device.

6
Figure 2. 1: Conventional air-cooled thermal management system
A heat sink works to transfer the heat from the device whose temperature must be kept in control
to a working fluid. In most of the cases, the working fluid is air. There are different ways in which
air is a cooling solution. One is by natural convection and other is by forced convection. To clarify
the difference between natural and forced convection, in the former air will not be forced by any
external source whereas in the later air will be forced using an external device. Most of the cases
the external device will be a fan. Usually in microelectronic cooling, heat sinks are not the ones
that directly pick up the heat from the device and transfer it to air. Heat spreader forms as a
medium to transfer the heat from device to the sink.
As the size of a microelectronic chip reduces, the need for better performing cooling solutions
will become highly important as the effective surface area that will be available for us to pick up
heat from the chip will be minimized. The focus of this thesis was to make use of the thermal
management solution through heat sink effectively to remove heat. Hence, the only way we can
optimize the sink for better cooling performance is to take advantage of the freedom in design.
The design also has a direct effect on the manufacturing process that can be used.

7
Heat sinks have been a better way to raise the surface area of a micro-sized chip by the ability for
it to spread the heat and cool it down using natural or forced convection. Here I discuss the study
performed to propose a heat sink that is better in performing thermally. Few of the important
considerations in designing a heat sink are:
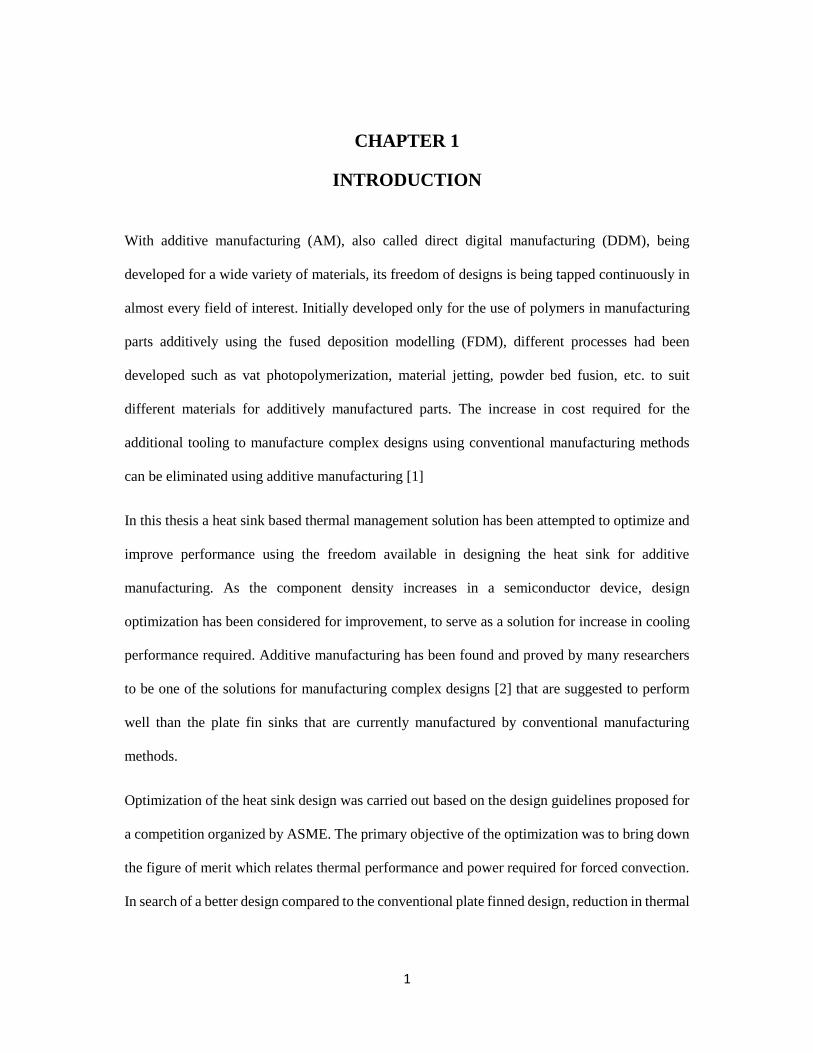
2.1.1 Thermal Resistance:
Thermal Resistance of a heat sink is the resistance offered for the heat to flow from the device
that is cooled by the air either stationary or forced, depending on the type of cooling adopted. An
air-cooled heat sink comprises of two types of resistance, conduction or spreading resistance and
convective resistance. Spreading resistance refers to the resistance offered by the base of the sink
that sits over the microelectronic device to absorb the heat from the device and spread it to the
sink, whereas convective resistance refers to the resistance offered by the fluid to pick up heat.
𝐶𝑜𝑛𝑑𝑢𝑐𝑡𝑖𝑣𝑒 𝑇ℎ𝑒𝑟𝑚𝑎𝑙 𝑅𝑒𝑠𝑖𝑠𝑖𝑡𝑎𝑛𝑐𝑒 =𝑙
𝑘𝐴
𝐶𝑜𝑛𝑣𝑒𝑐𝑡𝑖𝑣𝑒 𝑇ℎ𝑒𝑟𝑚𝑎𝑙 𝑅𝑒𝑠𝑖𝑠𝑡𝑎𝑛𝑐𝑒 =1
ℎ𝐴
Where,
k = Thermal conductivity of the material,
A = Area of heat transfer
h = Convective heat transfer co-efficient
l = Distance through which heat must transfer
8
Figure 2. 2: Conduction and convective resistance
2.1.2 Material:
Material of the heat sink plays a major role in determining the thermal performance of the heat
sink. Commonly used heat sink material is aluminum. There are heat sinks available in copper
too which has higher thermal conductivity. Apart from these there are heat sinks made by a
composition of metals to obtain desired properties for the sink. Thermal resistance is inversely
proportional to the thermal conductivity of the material.
By intuition, as the thermal conductivity increases the ease of transferring the heat to the material
also increases which means the resistance to heat transfer decreases.
2.1.3 Surface Area:
As known, a heat sink increases the surface area available for convection to take place which
reduces the temperature. Therefore, a higher surface area reduces the effort that needs to be put
in for the heat to be transferred to the fluid. Hence surface area determines another main feature
of a heat sink.
2.1.4 Pressure Drop:
In forced convective heat transfer, important factor that needs to be considered to keep up total
cost that goes into thermal management system is the pressure drop. Apart from the cost of the

9
heat sink there is the cost of operating the fan to cool the heat sink that adds up to the total cost.
As the pressure drop across the heat sink increases, the power required to keep the fan running to
supply the same amount of heat increases. Hence, the accounting for the electricity cost in
supplying more power to the fan increases the overall cost. Therefore, it is clear that in the case
of a conventional plate fin heat sink, increasing the number of fins will increase the surface area
but also increases the pressure drop. Thus, finding a sweet spot for a heat sink between the surface
area for a lower resistance and having a lower pressure drop by providing the required thermal
performance is necessary.
Figure 2. 3: Conventional heat sink[13]
2.2 Commonly used setup:
General heat sink based cooling strategies involve transfer of heat from the device to the sink
through a heat spreader as discussed before. In order to ensure proper contact between surfaces
of heat spreader with heat sink and the device from which heat needs to be picked up thermal
interface material will be used. Proper contact of the heat sink surface with the surface of the
electronic device is necessary mainly to reduce the resistance to heat transfer. The air gaps at the
contact interface depends on the roughness of each surfaces which are contact. Air gaps and voids
increase the thermal resistance as air has less thermal conductivity than the solids in contact.
Hence in order to make sure the surfaces are in tight contact; surface roughness must be very low,
and a thermal pad can be used. Thermal pads generally fill in the voids over the surfaces that is
placed above and below it to ensure a high contact.

10
CHAPTER 3
METAL ADDITIVE MANUFACTURING
Additive manufacturing (AM) which by name refers to the way of manufacturing by material
addition differs from the conventional way of subtractive manufacturing technologies such as
CNC, Milling, Lathe, etc. It has evolved from a method used for prototyping a part which was
then referred as rapid prototyping to final product batch manufacturing. Once used to check form,
fit, functions and for visualization, additive manufacturing is currently used to manufacture end
parts that are not be able to be manufactured conventionally. Hence, the term rapid prototyping
was debatable and hence ASTM prefers to use the term Additive Manufacturing [14]. Although
additive manufacturing initially was developed for polymers and not for manufacturing parts
using metals, later it was developed to support various materials such as metals[15], Biological
cells[16], etc by inventing various new methods. One of which is widely used as Sintering also
known as Selective Laser Sintering (SLS) [17].
3.1 History:
The current metal AM technology had its root starting from 1984 when its development started
and got patented at 1986 by Dekard [18]. After that Ralf Larson developed the process for
Electron beam as the source for sintering which was patented on 1993 as electron beam melting
(EBM) [18]. Another key year was 2000 when ultrasonic vibrations were made as a source by
Dawn White[18]. Currently, the most widely used process is Direct Metal Laser Sintering
(DMLS) which works on the principle of sintering same as SLS. These processes are said to use
full melting though the processes were developed with partial melting and hence they were called
sintering. The main difference between SLS and DMLS is that former was developed for polymer
and ceramics with the later for metals. Currently, EOS has the licenses for both the processes
11
discussed above. Arcam AB has the license for EBM and Solidica has it for ultrasonic
welding.[18]
3.2 Capability:
The two main metal AM processes are selective laser melting (SLM) and DMLS. The SLM works
by melting the powders completely to fuse two particles together whereas DMLS partially melts
the particle as necking occurs at the interface of the particles. Necking is a phenomenon where
the outer surfaces of each particle fuses and not the complete particles. The former is said to be
best suited for pure metal powders and the latter for metal alloy powders[19].
There are four different sintering processes available. They are:
1. Solid-state sintering
2. Liquid phase sintering
3. Chemically induced sintering
4. Full melting
3.2.1 Solid-state sintering:
Solid state sintering is carried out by raising the temperature of the powder area where the part
layer needs to be manufactured. This induces the surface fusion of neighboring particles by
inducing the phenomenon of necking. The process is called sintering because the process is
carried out at a temperature slightly less than the melting point temperature of the particles hence
it won’t melt the particles completely.
There are several important parameters which determines the quality and speed of the sintering
process. One of which is the sintering temperature maintained and other is the time period for
which the sintering temperature is maintained for it to happen. Either of these factors affect the
quality of the sintering process.

12
3.2.2 Liquid phase sintering:
This is a widely used method to ensure proper bonding of the metal particle. It usually constitutes
a mixture of the metal particles with the binder particles. The process is carried out such that the
binder particles will be melted completely which helps in making the metal or ceramic particles
in contact with each other so that its surface fuses and bonds together. This is made possible by
raising the temperature of the metal-binder or ceramic-binder mixture to the meting point of
binder which will usually be selected such that it is less than that of the melting point of ceramic
or metal. This process is also called partial melting as the part of the mixture gets melted and
made to flow between the particles of the metal or ceramic powder.
3.2.3 Chemically Induced Sintering:
This type of sintering works with the help of an exothermic chemical reaction. The mixture of
metal powder when raised to certain temperature induces chemical reaction, the byproduct of
which binds the metal particles together.
3.2.4 Full Melting:
In full melting, the metal particles are melted to a thickness greater than a layer thickness and
then allowed to solidify. This is proved to form very strongly bonded structures. Some unique
properties are said to be observed due to the quicker melting and solidification cycle adopted
which are desirable than some of the best conventional manufacturing processes.[14].
Currently, processes such as EFAB (Electrochemical Fabrication) which had been developed
sometime recently are being explored. They are said to have capabilities to manufacture products
with feature sizes of 10𝜇𝑚[20].
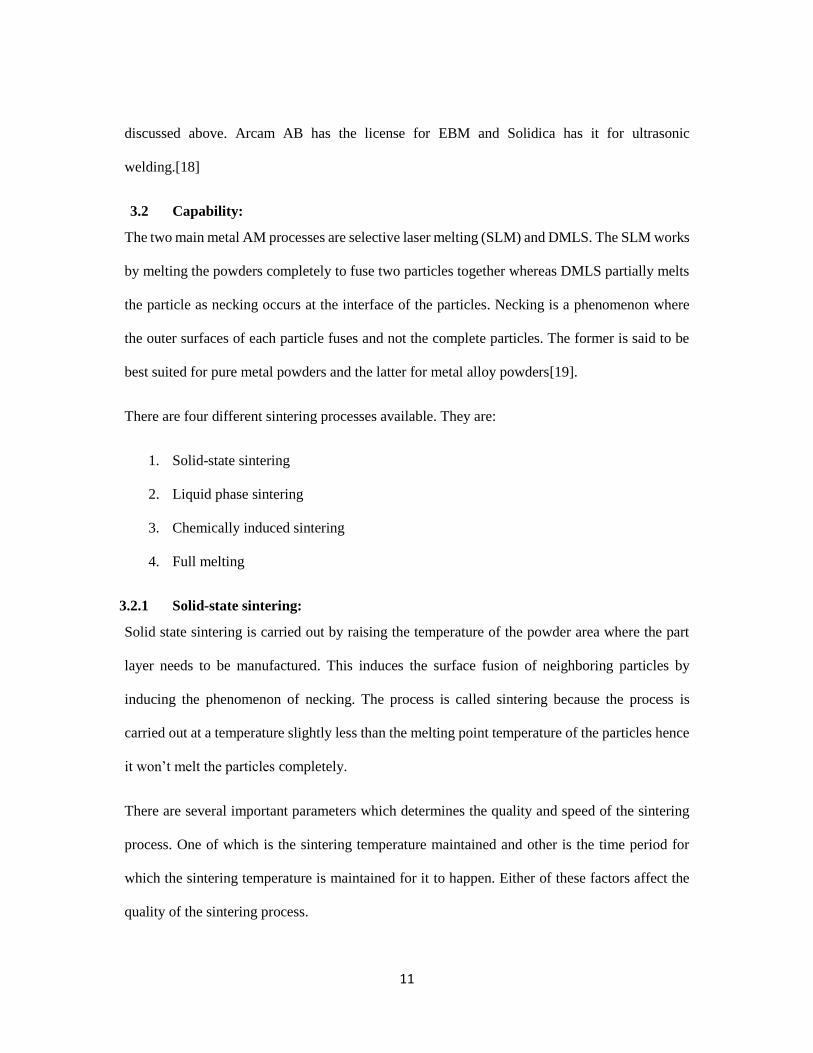
3.3 Direct Metal Laser Sintering:
The heat sink which was tested experimentally was manufactured using this process. The
schematic of the process is as shown in the figure

13
Figure 3. 1: Direct Metal Laser Sintering (DMLS)[21]
The re-coater spreads the first layer of the metal powder over the bed, a laser source is then
concentrated over the areas of the powder where the part needs to be developed through. After
the layer is built by fusing the all the powder particles at that area, the re-coater again spreads the
next layer of the powder over it following which laser is focused in the areas where powder
solidification is required. The process is continued until the final part is made out of the metal
powder[19].

14
3.4 Design Constraints:
The way in which a part is manufactured using DMLS imposes some constraints to the design
process which needs to be adopted for us to obtain a successful print. The important constraints
are the minimum angle [22]of any feature with the horizontal, sharp edges protruding from any
layer of the part with respect to the longest edge of the re-coater, length of any overhanging
features, corners over any area of the part, orientation of the part with the bed, change in area
along the build direction
i) Minimum angle of any feature with the horizontal is important because, as the angle with
the horizontal decreases the support for the new layer from the previous layer will be
lower resulting in a failure to print the feature.
ii) Any sharp edge present at a manufactured layer will take a large amount of stress for that
surface area from the re-coater hence it may break when the re-coater spreads a new layer
of the powder.
iii) Overhanging features require support for it to be freely supported by a wall. Moreover,
in a DMLS process, removal of support structure takes longer time for processing and
costs higher.
iv) Sharp corners are prone to cracks, ultimately the final part may break.
v) The orientation of the part at which it is built from the plate with respect to the longest
edge of the re-coater also plays a vital role. If there is any parallel edge with the re-coater's
longest edge, the part will be subjected to larger stress due to the higher surface area in
contact with each other than when the part is 5° or 10° tilted to the longer edge of the re-
coater.
vi) Along the direction of the build which is perpendicular to the build plate the area change
should be smooth enough for the process to produce successful prints.

15
Figure 3. 2: Effects of different feature angles[23]
Figure 3. 3: Support required for different orientation of the same part
Figure 3. 4: Orientation of the part with the raster[24]

16
CHAPTER 4
HEAT SINK DESIGN PROCESS
The heat sink design was made for the overall figure of merit to be low enough, the relation of
which, was mentioned below. As can been seen by the relation, lowering the resistance of both
heat transfer and fluid flow will help in keeping the figures low. The design adaptation
incorporated to reduce both the resistances is discussed below.
4.1 Calculation of Figure of Merit:
The formula for figure of merit given in the competition guidelines organized by ASME for an
additively manufactured heat sink and based on which the design optimization was done goes
by,
𝐹𝑂𝑀 = 1(𝑇𝑜𝑡𝑎𝑙 𝐶𝑜𝑠𝑡. (𝑇𝑇𝐶 − 𝑇𝑎𝑚𝑏)3)⁄
Where,
𝑇𝑇𝐶 = 𝑇𝑒𝑚𝑝𝑒𝑟𝑎𝑡𝑢𝑟𝑒 𝑚𝑒𝑎𝑠𝑢𝑟𝑒𝑑 𝑏𝑦 𝑡ℎ𝑒 𝑡ℎ𝑒𝑟𝑚𝑜𝑐𝑜𝑢𝑝𝑙𝑒 𝑎𝑡 𝑡ℎ𝑒 𝑐𝑒𝑛𝑡𝑒𝑟 𝑜𝑓 𝑡ℎ𝑒 ℎ𝑒𝑎𝑡 𝑠𝑖𝑛𝑘
𝑇𝑎𝑚𝑏 = 𝐴𝑚𝑏𝑖𝑒𝑛𝑡 𝑡𝑒𝑚𝑝𝑒𝑟𝑎𝑡𝑢𝑟𝑒
Relations for Total cost is given as,
𝑇𝑜𝑡𝑎𝑙 𝐶𝑜𝑠𝑡 = $ℎ𝑒𝑎𝑡 𝑠𝑖𝑛𝑘 + $𝑝𝑢𝑚𝑝𝑒𝑑 𝑎𝑖𝑟
$𝑝𝑢𝑚𝑝𝑒𝑑 𝑎𝑖𝑟 = 𝑃. 𝑡.$
𝑘𝑊ℎ
𝑃 = �̇�. ∆𝑝
And,
$
𝑘𝑊ℎ = $0.12
Cost of Heat sink = $60/kg
Provided operating time = 20,000 hrs

17
4.2 Flow Resistance Consideration:
Resistance to fluid flow increases pressure drop across the heat sink and increases the cost of
pumping air. The design feature that helps in reducing the flow resistance in the proposed design
is the curved surface of the sink that acts as deflector for the 90° deflection of the cooling air flow.
The curve comprising the curvature was adopted by the Bezier curve with 5 equally spaced
control points along an ‘L’. For simplicity, the number of control points has been kept 5 although
more than 5 points can be had. Further investigation over having a curve with more control points
were not made. Another reason for having 5 control points is to reduce the material that goes
under the curved surface and the perpendicular walls. Higher the curvature lesser will be the
material that is needed to support the curvature.
Figure 4. 1: Bezier curve formation
Figure 4. 2: Final bezier curve
18
4.3 Resistance to heat transfer consideration:
One of the main design criteria for a heat sink is the resistance it offers to pick up the heat from
the surface that needs to be cooled. Be it a conduction or a convection resistance, it is directly
proportional to the surface area as discussed in the preceding chapters. The resistance to
conduction or spreading resistance was not able to be worked on because of various constraints
by the guidelines. The only resistance that can be reduced is the convection resistance. Increasing
the surface area that encounters the fluid will help doing that. Therefore, wavy fins which
increases the surface area of the fin compared to the plate fins has been adopted. The waviness
was introduced perpendicular to the flow direction. This also helps in channelizing the fluid
through the 90° turn. While implementing a wavy fin, boundary layer will also get interrupted
whose effects were of interest with a belief that it could enhance the heat transfer rate [3]. The
wave length of the wave that forms the fin was selected based on the additive manufacturing
constraint. It is suggested to keep the minimum angle of inclination for any feature in the part to
be more than 35° for a successful print and good surface finish and to be printed without a support
[25]. For the safer side, the wave of the amplitude for which the minimum feature angle is greater
than 45° was selected.
4.4 Number of fins and the gap between them:
The gap between fins were selected based on two criteria, one is the additive manufacturing
constraint of minimum gap for a successful print and the other is the implementation of boundary
layer principle. Upon calculating the thermal boundary layer for flat plates, at the entrance region
of the sink the thickness was 1 mm and at the exit region it is 2.5 mm. Therefore, a gap of 2 mm
between the fins were fixed at the top of the sink considering the boundary layer effect from both
the fins. Easy removal of metal powders from the sink after the manufacturing using DMLS

19
process were also considered to fix it as 2 mm. A gap of 5 mm was kept at the bottom of sink
where the air exits the sink.
Figure 4. 3: Final designed heat sink
Figure 4. 4: Printed heat sink

20
4.5 Design trade-offs between thermal resistance and manufacturability:
The wavelength of the wave that forms the cross section of the fin has a greater effect over the
thermal resistance of the sink. Decreasing the wavelength increases the overall surface area for a
given height of the fin and hence it will bring the resistance down. The vice versa happens when
the wavelength decreases. But selecting the right wavelength also required the consideration for
manufacturability.
Figure 4. 5:Model sink for wavelength analysis
In the figure, the angle under consideration is depicted. One of the manufacturing constraints is
the angle of the feature with respect to the horizontal along the build direction. Hence, wavelength
had to be selected based on the minimum feature angle it fetches.

21
Figure 4. 6: Final Heat sink fin feature angle
Effect of thermal resistance for different wavelength corresponding the above said angle has been
shown below. To study that, a miniature heat sink model with only 2 fins has been analyzed with
the same setup but with different wavelength wave. The maximum temperature for each of the
heat sink has been mapped with respect to the angle of the feature with the horizontal.
Figure 4. 7: Maximum temperature of model heat sink vs feature angle

22
Clearly, a lower angled feature of fin with the horizontal is better but from the perspective of
getting the design manufacture safe we fixed it to around 53° for minimum angle of the fin feature.
This gives an example of trade-offs between heat transfer resistance and manufacturability that
arise while using metal additive manufacturing for heat sinks.

23
CHAPTER 5
THEORETICAL ANALYSIS OF THE HEAT SINK
Theoretical analysis was performed in Ansys cfx. Theoretical model was created with solid
domain for heat sink and fluid domain for air through the heat sink.
5.1 Ansys cfx solver:
The most widely used CFD solvers such as Fluent, Phoenics, Star – CD, CFX use finite volume
method for the finite difference formulation. It is a pressure-based solver. Another commonly
used solver is a density-based solver. The main difference between a pressure and density-based
solver depends on the way in which each solver solves the set of equations. In a pressure-based
solver, the equations are solved one by one to find different variables whereas, in a density-based
solver all the equations are solved simultaneously. The currently used pressure based Navier
stokes solver is based on the model proposed by Rhie and Chow [26]. The disadvantage of using
a density-based solver is found to be the fact that it does not perform well at times where Mach
number tends to zero. It becomes difficult to calculate pressure when there is no density for
incompressible flow, that is when pressure based solver was developed [27]. The Pressure based
CFD solver solves it in a sequential manner A general CFD solver works on the principle of
conservation of the laws of physics, such as:
1. Conserving the mass of the fluid
2. Conserving the momentum based on Newton’s second law
3. Conserving the energy

24
5.2 Laminar Fluid Model:
Navier-Stokes equation works best for understanding the fluid flow and energy transfer in the
fluids by applying all the above conservation laws. The set of unsteady Navier-Stokes equations
are as follows[28],
5.2.1 Continuity Equation:
𝜕𝜌
𝜕𝑡+
𝜕(𝜌𝑢)
𝜕𝑥+
𝜕(𝜌𝑣)
𝜕𝑦+
𝜕(𝜌𝑤)
𝜕𝑧= 0
5.2.2 Momentum Equations:
𝜕(𝜌𝑢)
𝜕𝑡+
𝜕(𝜌𝑢2)
𝜕𝑥+
𝜕(𝜌𝑢𝑣)
𝜕𝑦+
𝜕(𝜌𝑢𝑤)
𝜕𝑧= −
𝜕𝜌
𝜕𝑥+
1
𝑅𝑒[𝜕𝜏𝑥𝑥
𝜕𝑥+
𝜕𝜏𝑥𝑦
𝜕𝑦+
𝜕𝜏𝑥𝑧
𝜕𝑧]
𝜕(𝜌𝑣)
𝜕𝑡+
𝜕(𝜌𝑣2)
𝜕𝑦+
𝜕(𝜌𝑢𝑣)
𝜕𝑥+
𝜕(𝜌𝑣𝑤)
𝜕𝑧= −
𝜕𝜌
𝜕𝑦+
1
𝑅𝑒[𝜕𝜏𝑥𝑦
𝜕𝑥+
𝜕𝜏𝑦𝑦
𝜕𝑦+
𝜕𝜏𝑦𝑧
𝜕𝑧]
𝜕(𝜌𝑢)
𝜕𝑡+
𝜕(𝜌𝑤2)
𝜕𝑧+
𝜕(𝜌𝑤𝑣)
𝜕𝑦+
𝜕(𝜌𝑢𝑤)
𝜕𝑥= −
𝜕𝜌
𝜕𝑧+
1
𝑅𝑒[𝜕𝜏𝑥𝑧
𝜕𝑥+
𝜕𝜏𝑧𝑦
𝜕𝑦+
𝜕𝜏𝑧𝑧
𝜕𝑧]
5.2.3 Energy Equation:
𝜕𝐸
𝜕𝑡+
𝜕(𝑢𝐸)
𝜕𝑥+
𝜕(𝑣𝐸)
𝜕𝑦+
𝜕(𝑤𝐸)
𝜕𝑧
= −𝜕(𝑢𝑝)
𝜕𝑥−
𝜕(𝑣𝑝)
𝜕𝑦−
𝜕(𝑤𝑝)
𝜕𝑧−
1
𝑅𝑒 𝑃𝑟[𝜕𝑞𝑥
𝜕𝑥+
𝜕𝑞𝑦
𝜕𝑦+
𝜕𝑞𝑧
𝜕𝑧]
+1
𝑅𝑒[
𝜕
𝜕𝑥(𝑢𝜏𝑥𝑥 + 𝑣𝜏𝑥𝑦 + 𝑤𝜏𝑥𝑧) +
𝜕
𝜕𝑦(𝑢𝜏𝑥𝑦 + 𝑣𝜏𝑦𝑦 + 𝑤𝜏𝑦𝑧) +
𝜕
𝜕𝑥(𝑢𝜏𝑥𝑧
+ 𝑣𝜏𝑦𝑧 + 𝑤𝜏𝑧𝑧)]
The laminar fluid flow model of the cfx uses the above unsteady Navier-Stokes equations to
analyze the flow. The turbulent flow model matched well with the experimental results than the
above discussed Laminar flow model. Analyzing the flow streamlines of both the models also
25
proved the discontinuities in laminar flow model in capturing the eddies as discussed by Anderson
[29].
5.3 Turbulence model:
Many models have been developed that captures the turbulence streamlines one of which is
Reynolds-averaged Navier-Stokes (RANS) equations. There are other models which discuss
solving additional equations apart from the set of RANS equation to solve the effects of
turbulence such as Mixing Length model, k-𝜀 model, Spalart-Allmaras model, k-𝜔 model,
Algebraic stress model, Reynolds stress equation model(RSM), etc. Among these the widely used
models are the mixing length model and k-𝜀 model. In ANSYS cfx only k-𝜀 model was found for
analyzing fluid flow model.
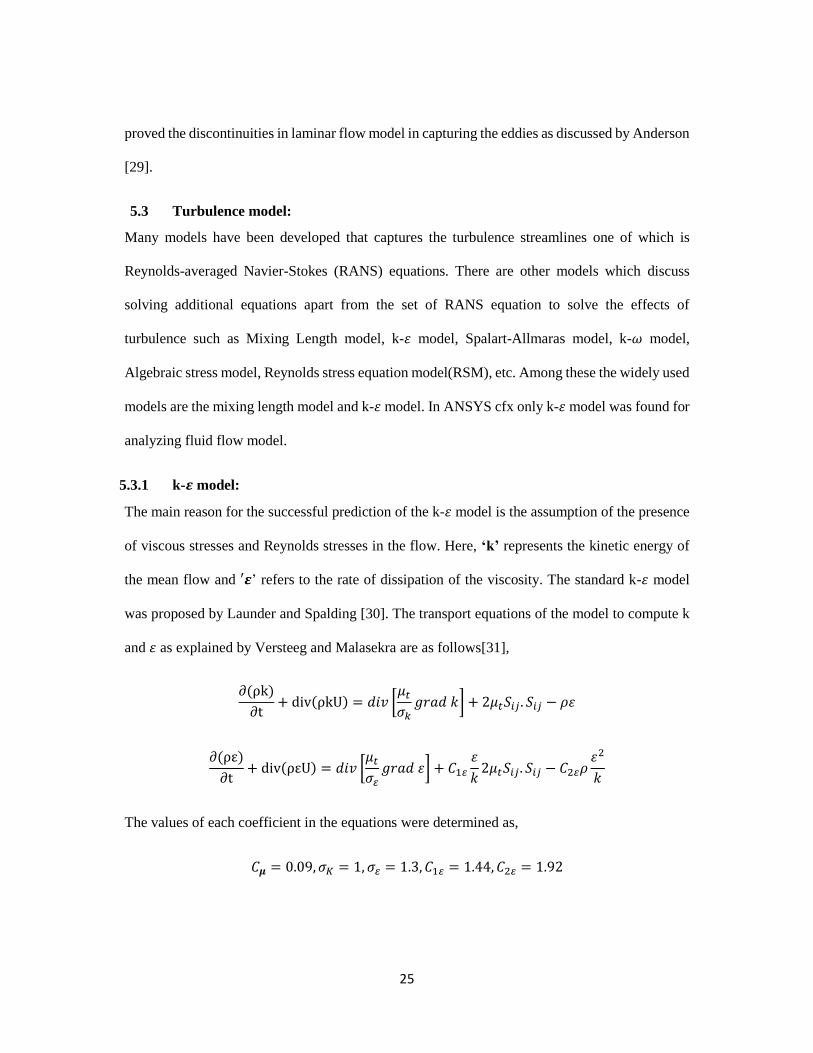
5.3.1 k-𝜺 model:
The main reason for the successful prediction of the k-𝜀 model is the assumption of the presence
of viscous stresses and Reynolds stresses in the flow. Here, ‘k’ represents the kinetic energy of
the mean flow and ′𝜺’ refers to the rate of dissipation of the viscosity. The standard k-𝜀 model
was proposed by Launder and Spalding [30]. The transport equations of the model to compute k
and 𝜀 as explained by Versteeg and Malasekra are as follows[31],
∂(ρk)
∂t+ div(ρkU) = 𝑑𝑖𝑣 [
𝜇𝑡
𝜎𝑘𝑔𝑟𝑎𝑑 𝑘] + 2𝜇𝑡𝑆𝑖𝑗. 𝑆𝑖𝑗 − 𝜌𝜀
∂(ρε)
∂t+ div(ρεU) = 𝑑𝑖𝑣 [
𝜇𝑡
𝜎𝜀𝑔𝑟𝑎𝑑 𝜀] + 𝐶1𝜀
𝜀
𝑘2𝜇𝑡𝑆𝑖𝑗. 𝑆𝑖𝑗 − 𝐶2𝜀𝜌
𝜀2
𝑘
The values of each coefficient in the equations were determined as,
𝐶𝝁 = 0.09, 𝜎𝐾 = 1, 𝜎𝜀 = 1.3, 𝐶1𝜀 = 1.44, 𝐶2𝜀 = 1.92

26
These values for each co-efficient were compared with those of the default model values of
ANSYS cfx and both were same.
This model was also noted to fit well to analyze confined flow where Reynolds shear stresses
should also be taken into account [31]. Also, mentioning the disadvantages of the model, it was
mentioned not to work well in weak shear layers of the flow. Both the Laminar flow model and
the k-𝜀 models were compared and the best model whose results matched with the experimental
results of the heat sink were also discussed below.
5.4 Setup:
A geometry like the experimental setup as shown in figure 6.1 was created in design modeler. A
fluid domain simulating the fluid flow over the elbow duct of the flow bench setup was created.
The sink design was placed at the corner of the domain while the analysis had been carried out.
Basically, the heat sink is placed such that it is immersed inside the fluid.
Figure 5. 1: Analysis setup
The heat sink design was imported directly as parasolid file from solidworks. Instead of importing
the whole duct geometry into design modeler. A fluid domain was created to simulate air flow

27
through the heat sink along the L- shaped path. Apart from the heat sink, two solid domains had
been created to simulate both thermal pad and copper block that constitute the experimental setup.
The heat sink’s performance is being tested by placing it over a copper block which simulates the
device whose rise in temperature must be taken care of. A thermal interface material is said to be
used to ensure proper contact of the heat sink with the copper block. Hence a solid domain for it,
is created so as to fit between copper block and the heat sink. The heat sink material was given as
a material with thermal conductivity 152.8 W/mK as specified by the guidelines which
corresponded to the material A357 that was said to be used for manufacturing the sink. A thermal
conductivity of 10 W/mK was used for the thermal interface material. The copper block thermal
conductivity was used as 400 W/mK which was taken from the guidelines.
5.5 Boundary Conditions:
Figure 5. 2: Analysis setup with the boundary conditions
Inlet air is applied at the top of the fluid domain represented by arrow marks pointing the fluid
domain as shown in the figure. The properties of the air were assumed to be 21° C at 100 CFM

28
and were supplied as 0.0558 kg/s mass flow rate for the unit restrictions in cfx with corresponding
fluid properties at 21° C. The outlet for the fluid domain is provided at the bottom of the domain
represented by blue double headed arrow marks as shown in the figure 5.2, as an opening
boundary condition. A heat flux of 1 W/cm2 was applied at the bottom of the copper solid domain
to simulate the real testing conditions. The heat flux reaches the heat sink bottom through the
copper block and TIM as shown in the figure 2.1.
5.6 Flow Observation:
Figure 5. 3: Using laminar fluid flow model

29
Figure 5. 4: Using k-𝜀 model
As can be seen from the flow streamlines of laminar model and turbulence model, the eddies near
the bottom of the sink were not captured exactly by the laminar model whereas k-𝜀 model
captured it. The velocity streamline plot are found to be one of the effective ways to check the
correctness of a theoretical model [29]. It was also noted that k-𝜀 model predicted the values
better, when it was compared with the experimental results, than the laminar model.
5.7 Meshing:
The mesh was generated by Ansys cfx’s auto mesh feature. The setting was kept as medium with
the special consideration for mesh around the curves and straight edges by selecting proximity
and curvature in the mesh setting. Prismatic element was used for all the domains.

30
5.8 Simulations setup:
The governing equations that were solved were for mass, momentum and energy. The energy
equation solves for the heat transfer in the system. All the sink models, were simulated using
laminar fluid flow model, although it was not found to be the best model when the experimental
results are compared. For uniformity in analysis, laminar model was used throughout. The thermal
energy equations setting was used further for both fluid domain and solid domain. The number of
iterations which was fixed were 500 but almost all the models seemed to converge before it passes
250th iteration. The convergence criteria as RMS value for residues was fixed as 1×e−7.
Although 1×e−4 itself is a better value when it comes to fixing a convergence criterion, for better
accuracy it was set to be much lower.
5.9 Post Processing:
As the temperature is to be measured from the center of the base part of the sink using a
thermocouple inserted through the base, a point is created at the center of the base part of
dimension 50 mm x 50 mm x 8 mm. The temperature at that specific point is found out for all the
designs in the iteration and compared against each other. The pressure difference is said to be
measured across the heat sink by the difference between the pressures calculated near the inlet to
the sink and the outlet of the sink along the duct. So, theoretically the pressure difference was
calculated by creating a plane in the fluid domain along the duct near the inlet and outlet region
of the sink. The pressure is calculated by determining the area average of the pressure along those
planes and the difference in pressure between the average value in the inlet plane to the average
value in the outlet plane.

31
5.10 Thermal Analysis results:
Figure 5. 5: Thermal analysis contour for the heat sink
As can be seen in the results, the temperature was uniformly spread over the heat sink. This proves
the uniformity of the temperature distribution over the heat sink. The temperature of the heat sink
at the center of the base, where thermocouple was placed in the experiments, was 305.27 K or
32.12° C and the pressure drop for the heat sink was found to be 84.139 Pa. The contour plot for
conventional design as seen in the figure below tells that the temperature for the sink was 309.35
K or 36.2° C which is 4° C higher than the proposed sink design. The better performance of the
proposed heat sink attributes to increase in surface area when compared to the flat plate fins and
better air mixing than the conventional one. Comparing the pressure drop, wavy fin design had
higher pressure drop which was around 84.14 Pa theoretically when compared to 74.47 Pa for the
conventional design. The pressure drop for each heat sink was obtained by calculating the
difference in pressure obtained between average values of pressure found at the planes indicated
as pressure inlet and pressure outlet in the figure 5.2

32
Figure 5. 6: Thermal analysis contour for conventional heat sink
The final heat sink was developed by implementing all the Design for Additive Manufacturing
constraints, when analyzed had a maximum temperature of 306.6 K or 33.44° C. The rise in
temperature is attributed to the increase in thermal conductive resistance due to additional
material added by filleting the edges where the fin touches the sink surface. The thermal analysis
plots of which are attached below.
Figure 5. 7: Final design Thermal Analysis Plot

33
CHAPTER 6
EXPERIMENTAL ANALYSIS OF THE HEAT SINK
Experimental analysis was performed at Oregon State University, Corvallis under the guidance
of Dr. Joshua Gess. An image description of the setup was given in the guidelines. The complete
dimension such as length of each duct were not given. The assumed model for experimental
analysis from the description is shown in the figure below. Image at the right shows the
dimensions of the envelope in which heat sink will be placed as specified in the document.
Figure 6. 1: Experimental setup assumed from the guidelines data
6.1 Experimental Setup:
The setup consists of a elbow duct whose material was not specified. But that is not of concern
as the duct is just functioning to determine a path for air flow through the heat sink. Literature
survey has shown researchers using perspex, wood, etc as duct [32][33][34].The uniform heating

34
for the base of the heat flux was made possible through the copper block, whereas a guard heater
was widely used for other experimental testing setups for various other heat sink tests[32][7][3].
A thermal insulation should have been provided whose material was not specified, such that it
wraps around the copper block [35][36]. Some of the insulation materials that were used include,
Foam, mineral wool, etc.
6.1.1 Temperature Measurement:
The maximum temperature rise in the heat sink is of primary importance. Usually the temperature
at the bottom of the heat sink where the sink touches the device is of utmost importance as it is
that interface that will experience higher temperatures among all other areas of the heat sink. A
through hole was asked to be provided at the base of the heat sink by the guidelines so as to allow
the temperature at the center of the heat sink base be measured using a K-type thermocouple.
Literature survey suggested having more than 1 thermocouple covering various points along the
heat sink base. The average temperature readings from those thermocouples were usually
considered under study [8][37] but the area of the heat sink base reported by those articles were
bigger compared to that of the proposed heat sink base.
Figure 6. 2: Thermocouple hole
6.1.2 Pressure Measurement:
The pressure drop across the heat sink is of consideration as it contributes to the total cost of
operating the thermal management system. As flow resistance increase the pressure drop, the
power required to push air increases. The pressure of the air at a point just before entering the
Hole for Thermocouple

35
heat sink and the pressure of the air at a point just after leaving the heat sink was assumed from
the guidelines to be measured to calculate the pressure difference across the heat sink. Although
details about the method used to measure pressures at those mentioned points were not specified
in the guidelines, literature survey suggested using pressure transducers greatly but a low-cost
setup can be made using a differential manometer. Measurement of pressure was not discussed at
all in the guidelines. Referring to various technical articles regarding this, researchers use pressure
tappings along the duct at the planes at which pressure measurement is desired [32]–[34]. Usually,
for a bigger cross section duct than that used here, they used more than 1 tapping and pressure
transducers to obtain pressure along the flow at more than 1 point at a single plane of
measurement.
6.2 Results:
The results for the pressure drop and temperature values from the experiments carried by Dr.
Joshua Gess and team at Oregon sState uUniversity are,
Experimental results
Temperature at the center of the heat sink base 32.99˚C
Pressure drop measured upstream and downstream the heat
sink
82.1172 Pa
6.3 Comparison of Theoretical and Experimental Results:
The corresponding values of temperatures and pressure drop calculated theoretically at the
locations where it was found out experimentally are attached below. A comparison of those values
by laminar and k-𝜀 model with the experimental ones have been made. From the comparison, the

36
values as predicted by k-𝜀 model matched well with the experimental values than the laminar
model.
From the inference made above, it can be proved that turbulence region occurs along the fluid
flow region and because of that flow restrictions happen. As eddies are formed in the turbulence
region, it acts as resistance for the flow and therefore the pressure drop also increases across the
heat sink in k-𝜀 model when compared with the laminar model.
Experimental
results
Theoretical
results with
Laminar model
Theoretical
results with k-
є model
Temperature at the center of the
heat sink base
32.99˚C 33.44 ˚C 33.43 ˚C
Pressure drop between upstream
and downstream the heat sink
82.1172 Pa 64.53 Pa 70.7 Pa
6.4 Flow Model Comparison:
Figure 6. 3: Streamline comparison for both Laminar and turbulent model
It can be clearly seen from both the streamlines that, k-𝜀 model captures the turbulence eddies
whereas laminar model doesn’t, and it can be further proved that k-𝜀 model should be used for
performance prediction in this heat sink.
37
CHAPTER 7
HEAT SPREADER DESIGN PROCESS
The main purpose of coming up with the proposed heat spreader design is the need for hotspot
cooling in microelectronics applications. As micro-scale devices become more and more
complicated, various hot spots occur over the device. An attempt to solve the problem using the
design of the heat spreader in forced air-cooling application was made. Since, additive
manufacturing proves to provide freedom in design, its capability was tapped by the design.
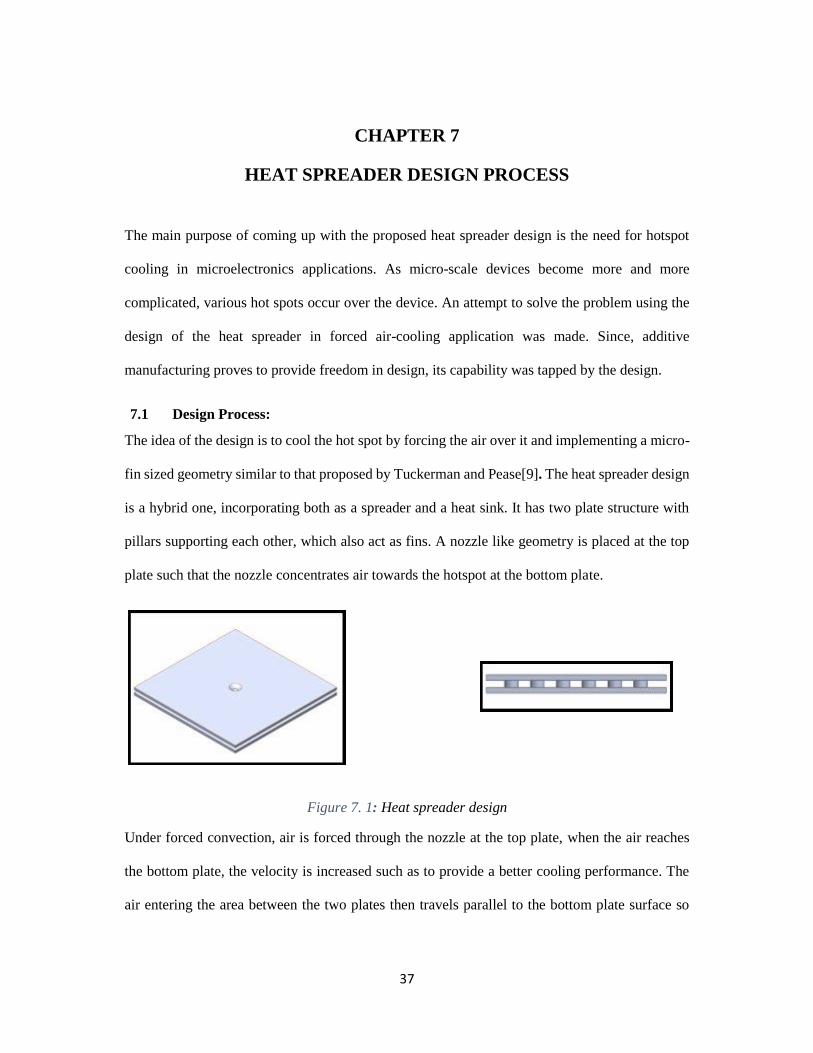
7.1 Design Process:
The idea of the design is to cool the hot spot by forcing the air over it and implementing a micro-
fin sized geometry similar to that proposed by Tuckerman and Pease[9]. The heat spreader design
is a hybrid one, incorporating both as a spreader and a heat sink. It has two plate structure with
pillars supporting each other, which also act as fins. A nozzle like geometry is placed at the top
plate such that the nozzle concentrates air towards the hotspot at the bottom plate.
Figure 7. 1: Heat spreader design
Under forced convection, air is forced through the nozzle at the top plate, when the air reaches
the bottom plate, the velocity is increased such as to provide a better cooling performance. The
air entering the area between the two plates then travels parallel to the bottom plate surface so

38
that it picks up heat from it. The current design considers that a hotspot of 2 mm X 2 mm occurs
at the center of the base plate and the rest of the surface experiences a lower heat flux. Hence, the
air enters at higher velocity at the hotspot cools it down and then travels between the plates to
pick up heat from other areas along the plates, pillars and then leave the heat spreader from all
the sides.
7.2 Design Parameters:
The total thickness of the spreader was fixed to be 2 mm. The spreader covers an area of 30 X 30
mm surface for cooling. The thickness of the bottom and top plate was kept as 0.63 mm and the
air gap was fixed to 0.75 mm, so was the height of the fins. The diameter of the nozzle is 1 mm
at the outlet and a taper of 55 degree towards the inlet is provided as an arbitrary dimension. 36
pillars of 2.2 mm diameter cylinder placed in an equally spaced fashion.
Figure 7. 2: Heat spreader dimensions at the cross section

39
Chapter 8
THEORETICAL ANALYSIS OF THE HEAT SPREADER
All the theoretical simulations were carried in the same platform as that of the heat sink that is
the Ansys cfx. Laminar fluid flow model was used to perform simulation.
8.1 Setup:
Figure 8. 1: Boundary conditions for the environment
A cfx setup was created in design modeler, to simulate air being forced by an 80 mm diameter
fan above the spreader at a distance of 8 mm over a 30 mm X 30 mm heat spreader. So, the
environment which is atmospheric air is provided as a box of 100 X 100 X 10 mm dimensions as
a fluid domain. The heat spreader which forms a solid domain imported as a parasolid file format
into the design modeler was placed such that it sits inside the box covering a centered area of 30
X 30 mm in one of those larger surfaces. The other larger surface has a centered area of 80 mm
diametric circle with a 3 mm protrusion of fluid domain from the surface to simulate a fan.
Air Inlet
Air Outlet

40
8.2 Boundary Conditions:
Air flow was imitated by providing the surface common to the fluid domain for fan and the
environment at the rate of 0.0558 kg/s at 25° C represented by black single-headed arrow marks
facing the fluid domain as shown in figure 8.1. The outlet for that air was given as all four sides
of the environmental fluid domain as an opening boundary condition at 25° C and 0 atm pressure
represented by double headed blue arrow marks. There are two different heat fluxes applied to
the bottom of the spreader, one for hot spot represented by red arrows and other for the rest of the
spreader area represented by black arrows as shown in figure 8.2
Figure 8. 2: Boundary conditions to the heat spreader
Same as the governing equations used for heat sink testing, the equations used for heat spreader
analysis was mass, momentum and energy equations.
8.3 Flow Observation:
As can be seen, the air entering the gap between fins tends to circulate near the hot spot area
because of immediate obstruction to the flow. This increases the heat transfer co-efficient near
the hotspot area which is an advantage of having a nozzle right above the hot spot. Detailed
analysis, by comparing the streamlines for different air gaps will be made in section 8.4.

41
Figure 8.3: Flow streamline for 1.2 mm air gap
Figure 8.4:Flow streamlines for 1 mm air gap

42
Figure 8.5: Flow streamlines for 0.8 mm airgap
8.4 Thermal Analysis Results:
Figure 8.6: Thermal contour plot – side view
Figure 8.7: Thermal contour plot for the top and bottom plate

43
Figure 8. 8: Temperature at hot spot by varying plate thickness with respect to air gap
Figure 8.9:Variation of hot spot temperature for plate thickness

44
Air Gap (mm)
Figure 8. 10:Temperature variation with air gap
As can be seen from the plots, the higher contrast in color contours for the bottom and top plate
shows that most of the heat is taken away by air by the time heat reaches the top plate. Also, from
figures 8.3-8.5, as the air gap reduces the circulations happening near the hotspot reduces giving
rise to lower mixing of air when air gap reduces. Therefore, a decreasing trend in the thermal
performance is seen from the results attached when the air gap is reduced (figure 8.10). When
plate thickness is increased, the thermal resistance by conduction or spreading resistance increases
and thermal performance of the spreader reduces. Therefore, an increasing trend in temperature
is seen in the set of simulations where plate thickness alone is varied (figure 8.9). From figure 8.8
when the plate thickness is increased with respect to the reducing air gap, the temperature at
hotspot raises, because of increase in conductive resistance. Apart from that, as the plate thickness
is increased by reducing the air gap, air circulation reduces giving rise to a net increase in the
maximum temperature.

45
CONCLUSION
Although optimizing a heat sink design for AM seems to provide much independence in the
design, design for AM principles must be carefully implemented for successful printing. Here,
heat sink models have been analyzed theoretically with laminar and a turbulent fluid flow models
and the best model among those which gave good agreement to the experimental values have
been found. One major limitation on which the study has been made is that the complete actual
dimensions of the experimental setup was not available. So, based on the visual examination an
approximate length of the duct was assumed. Other details on the data collection systems and the
pressure measurement system was also not available. Though the proposed design is made self-
supporting, complex designs require support structures that increases the total cost of
manufacturing especially when DMLS process is used. If micro-channels are manufactured using
the powder bed fusion processes, minimum channel widths also need to be optimized for the
powder to be removed through them effectively.
The main purpose of the study includes thermal performance improvement of the heat sink
manufactured by DMLS than the conventional heat sink. Key conclusions made were, heat sink
performance can be greatly improved because of the independence in designing a heat sink for
additive manufacturing. Once a preliminary design is made, the design had to go through a careful
study for compliance with the design for additive manufacturing principles. Therefore, additive
manufacturing proves to be a good manufacturing technique for thermal management of micro-
electronics and can be implemented. One major drawback of using additive manufacturing for
heat sinks is the manufacturing cost. Currently as conventional sinks are available at prices of
under $50, the one which we made was estimated to be around $1400. Making the AM process
more cost friendly needs to be worked on in a parallel fashion for it to be widely implemented for

46
manufacturing heat sinks. The manufacturing cost versus the performance improvement were not
evaluated in this study. But lowering the process costs will make AM to be easily adopted for
manufacturing high performance-heat sinks at a larger scale. Here the sinks were made self-
supporting, so no support structures were needed for printing it. Whereas some complex designs
require usage of support structures. In that case, cost for removing support structures and post
processing adds up to the manufacturing cost. Current techniques for removing support structures
poses higher costs. Studies to reduce the costs for support structure removal is identified as a
potential area for cost reduction.
Methods such as ‘Thermal Topology Optimization’ has been a suggested method for optimizing
heat sinks[38][1]. It works based on a FEM (Finite Element Methods) analysis of the model then
finding the best structure by adding material in different areas of the model and analyzing it in an
iterative fashion. The best structure of the model which conducts heat faster among the models
analyzed for a given volume constraint will be suggested as the best one. Many groups have
attempted to develop their own code for thermal topology optimization that can support the use
of thermal convection in the model[39][40]. Apart from that different methods have also been
attempted[41]. Though those methods seem to be promising, usage of a CAE package for
topology optimization, here Altair Hypemesh Optistruct was studied with reference to Xueyong
et al[42]. It was concluded that, the package can perform structural topology optimization better
than the thermal optimization, as convection which is critical for heat sinks was not supported by
it at the time of my evaluation. Indirect ways to help it support convection could be studied by
implementing some self-developed codes using Tcl/Tk into it.

47
References
[1] S. N. Reddy K., V. Maranan, T. W. Simpson, T. Palmer, and C. J. Dickman,
“Application of Topology Optimization and Design for Additive Manufacturing
Guidelines on an Automotive Component,” Proc. ASME 2016 Int. Des. Eng. Tech. Conf.
Comput. Inf. Eng. Conf., pp. 1–10, 2016.
[2] D. W. Rosen, “Design for additive manufacturing: a method to explore unexplored
regions of the design space,” 18th Annu. Solid Free. Fabr. Symp., pp. 402–415, 2007.
[3] K. K. Sikka, K. E. Torrance, C. U. Scholler, and P. I. Salanova, “Heat sinks with fluted
and wavy plate fins in natural and low-velocity forced convection,” IEEE Trans.
Components Packag. Technol., vol. 25, no. 2, pp. 283–292, 2002.
[4] Q.-W. Wang, M. Lin, M. Zeng, and L. Tian, “Computational analysis of heat transfer
and pressure drop performance for internally finned tubes with three different
longitudinal wavy fins,” Heat Mass Transf., vol. 45, no. 2, pp. 147–156, 2008.
[5] A. Jain, G. Biswas, and D. Maurya, “Winglet-type vortex generators with common-flow-
up configuration for fin-tube heat exchangers,” Numer. Heat Transf. Part A Appl., vol.
43, no. 2, pp. 201–219, Feb. 2003.
[6] X. Du, L. Feng, L. Li, L. Yang, and Y. Yang, “Heat transfer enhancement of wavy
finned flat tube by punched longitudinal vortex generators,” Int. J. Heat Mass Transf.,
vol. 75, pp. 368–380, 2014.
[7] L. Ventola et al., “Rough surfaces with enhanced heat transfer for electronics cooling by
direct metal laser sintering,” Int. J. Heat Mass Transf., vol. 75, pp. 58–74, 2014.
[8] M. Wong, I. Owen, C. J. Sutcliffe, and A. Puri, “Convective heat transfer and pressure
losses across novel heat sinks fabricated by Selective Laser Melting,” Int. J. Heat Mass
Transf., vol. 52, no. 1–2, pp. 281–288, 2009.
[9] D. B. Tuckerman and R. F. W. Pease, “High-performance heat sinking for VLSI,” IEEE
Electron Device Lett., vol. 2, no. 5, pp. 126–129, 1981.
[10] G. S. Bindiganavale, “Study of Hotspot Cooling for Integrated Circuits using
Electrowetting on Dielectric Digital Microfluidic System,” The University of Texas at
Arlington, 2015.
[11] S. Tsopanos, C. J. Sutcliffe, and I. Owen, “The Manufacture of Micro Cross-Flow Heat
Exchangers by Selective Laser Melting,” Proc. 5th Int. Conf. Enhanc. Compact Ultra-
Compact Heat Exch. Sci. Eng. Technol., no. September, pp. 410–417, 2005.
[12] A. Yeh Lian-Tua, A. Chu RC, and R. Janna WS, “Thermal Management of
Microelectronic Equipment: Heat Transfer Theory, Analysis Methods, and Design
Practices. ASME Press Book Series on Electronic Packaging,” Appl. Mech. Rev., vol.
56, no. 3, pp. B46–B48, May 2003.
[13] T. Cool, “Bonded Fin Heat Sinks.” [Online]. Available:

48
https://thermocoolcorp.com/project/bonded-fins/.
[14] I. Gibson, D. W. Rosen, and B. Stucker, Additive Manufacturing Technologies: Rapid
Prototyping to Direct Digital Manufacturing. Springer, 2010.
[15] D. Herzog, V. Seyda, E. Wycisk, and C. Emmelmann, “Additive manufacturing of
metals,” Acta Mater., vol. 117, pp. 371–392, Sep. 2016.
[16] D. L. D. Bourell, J. J. Beaman, M. C. Leu, and D. W. Rosen, “A brief history of additive
manufacturing and the 2009 roadmap for additive manufacturing: looking back and
looking ahead,” US-Turkey Work. Rapid Technol., pp. 5–11, 2009.
[17] R. Sreenivasan and D. L. Bourell, “Sustainability study in selective laser sintering - An
energy perspective,” in EPD Congress 2010 - Held During TMS 2010 Annual Meeting
and Exhibition, 2010.
[18] W. J. Sames, F. A. List, S. Pannala, R. R. Dehoff, and S. S. Babu, “The metallurgy and
processing science of metal additive manufacturing,” Int. Mater. Rev., vol. 61, no. 5, pp.
315–360, Jul. 2016.
[19] G. Jones, “DMLS - Simply explained,” all3dp.com, 2019. [Online]. Available:
https://all3dp.com/2/direct-metal-laser-sintering-dmls-simply-explained/.
[20] A. Cohen, R. Chen, U. Frodis, M. Wu, and C. Folk, “Microscale metal additive
manufacturing of multi‐component medical devices,” Rapid Prototyp. J., vol. 16, no. 3,
pp. 209–215, Apr. 2010.
[21] “Laser Beam Melting principle with machine scheme,” Fraunhofer IWU.
[22] J. Kranz, D. Herzog, and C. Emmelmann, “Design guidelines for laser additive
manufacturing of lightweight structures in TiAl6V4,” J. Laser Appl., vol. 27, no. S1, p.
S14001, 2015.
[23] “An Introduction to Designing for Metal 3D Printing,” solidworks blog. .
[24] “3D Metal Printing Basics - Introduction to DMLS (Direct Metal Laser Sintering)
Technology,” metalprinting.hu. .
[25] R. Ranjan, R. Samant, and S. Anand, “Integration of Design for Manufacturing Methods
With Topology Optimization in Additive Manufacturing,” J. Manuf. Sci. Eng., vol. 139,
no. 6, pp. 61007–61014, Jan. 2017.
[26] C. M. RHIE and W. L. CHOW, “Numerical study of the turbulent flow past an airfoil
with trailing edge separation,” AIAA J., vol. 21, no. 11, pp. 1525–1532, Nov. 1983.
[27] C. M. RHIE, “Pressure-based Navier-Stokes solver using the multigrid method,” AIAA
J., vol. 27, no. 8, pp. 1017–1018, Aug. 1989.
[28] NASA Glen Research Center, “Navier Stokes Equation,” NASA. [Online]. Available:
https://www.grc.nasa.gov/www/k-12/airplane/nseqs.html.
[29] J. D. Anderson, Computational Fluid Dynamics : The Basics with Applications. McGraw
Hill Education, 1995.

49
[30] B. E. Launder and D. B. Spalding, “The numerical computation of turbulent flows,”
Comput. Methods Appl. Mech. Eng., vol. 3, no. 2, pp. 269–289, Mar. 1974.
[31] H. Versteeg and W. Malalasekra, An Introduction to Computational Fluid Dynamics:
The Finite Volume Method Approach. Pearson, 1996.
[32] B. A. Jubran, M. A. Hamdan, and R. M. Abdualh, “Enhanced Heat Transfer, Missing
Pin, and Optimization for Cylindrical Pin Fin Arrays,” J. Heat Transfer, vol. 115, no. 3,
pp. 576–583, Aug. 1993.
[33] M. A. Tahat, R. F. Babus’Haq, and S. D. Probert, “Forced steady-state convections from
pin-fin arrays,” Appl. Energy, vol. 48, no. 4, pp. 335–351, Jan. 1994.
[34] S. Naik, S. D. Probert, and M. J. Shilston, “Forced-convective steady-state heat transfers
from shrouded vertical fin arrays, aligned parallel to an undisturbed air-stream,” Appl.
Energy, vol. 26, no. 2, pp. 137–158, Jan. 1987.
[35] K. L. Kirsch and K. A. Thole, “Pressure loss and heat transfer performance for
additively and conventionally manufactured pin fin arrays,” Int. J. Heat Mass Transf.,
vol. 108, pp. 2502–2513, 2017.
[36] C. K. Stimpson, J. C. Snyder, K. A. Thole, and D. Mongillo, “Roughness Effects on
Flow and Heat Transfer for Additively Manufactured Channels,” J. Turbomach., vol.
138, no. 5, p. 051008, 2016.
[37] M. Wong, I. Owen, and C. J. Sutcliffe, “Pressure Loss and Heat Transfer Through Heat
Sinks Produced by Selective Laser Melting,” Heat Transf. Eng., vol. 30, no. 13, pp.
1068–1076, Nov. 2009.
[38] E. M. Dede, S. N. Joshi, and F. Zhou, “Topology Optimization, Additive Layer
Manufacturing, and Experimental Testing of an Air-Cooled Heat Sink,” J. Mech. Des.,
vol. 137, no. 11, pp. 111403–111409, Oct. 2015.
[39] Y. Joo, I. Lee, and S. J. Kim, “Topology optimization of heat sinks in natural convection
considering the effect of shape-dependent heat transfer coefficient,” Int. J. Heat Mass
Transf., vol. 109, pp. 123–133, 2017.
[40] J. Alexandersen, N. Aage, C. S. Andreasen, and O. Sigmund, “Topology optimisation
for natural convection problems,” Int. J. Numer. Methods Fluids, vol. 76, no. 10, pp.
699–721, Dec. 2014.
[41] L. Cheng, J. Liu, and A. C. To, “Concurrent lattice infill with feature evolution
optimization for additive manufactured heat conduction design,” Struct. Multidiscip.
Optim., vol. 58, no. 2, pp. 511–535, 2018.
[42] X. Qu, N. Pagaldipti, R. Fleury, and J. Saiki, “Thermal Topology Optimization in
OptiStruct Software,” in 17th AIAA/ISSMO Multidisciplinary Analysis Optimization
Conference, 2016, no. June.


![EVALUATION OF AN ADDITIVELY MANUFACTURED TOOLING …...fiber reinforced materials for industrial autoclave processes [2]. Further additively manufactured sacrificial cores that are](https://img.dokumen.tips/doc/110x75/61109e35380ac776af22c6b6/evaluation-of-an-additively-manufactured-tooling-fiber-reinforced-materials.jpg)