Embed Size (px)
Citation preview
Vapor-Liquid Equilibria for the Carbon Dioxide + Pentane andCarbon Dioxide + Toluene Systems
Katsumi Tochigi,* Kunihisa Hasegawa, Norihiro Asano, and Kazuo Kojima
Department of Industrial Chemistry, College of Science and Technology, Nihon University, 1-8 Surugadai,Kanda, Chiyoda-ku, Tokyo 101, Japan
Vapor-liquid equilibrium data have been measured for the systems carbon dioxide + pentane at (310.15,333.15, and 363.15) K and carbon dioxide + toluene at 323.15 K and 333.15 K. The experimental datahave been correlated by the Peng-Robinson equation of state with one interaction parameter. In addition,the group pair parameters relating to CH2 + CO2 and ArCH + CO2 in the PRASOG group contributionmodel are determined.
Introduction
Carbon dioxide is frequently found in naturally occurringhydrocarbon reservoirs and has been widely used as thesolvent in supercritical fluid extraction. To predict thephase equilibria in such systems, a group contributionmethod called PRASOG has been proposed by the authors(Tochigi et al., 1998). The high-pressure vapor-liquidequilibria (VLE) data are required to determine the grouppair parameters relating to the CO2 group.
This paper reports the measurement of vapor-liquidequilibria for the systems carbon dioxide + pentane at(310.15, 333.15, and 363.15) K and carbon dioxide +toluene at 323.15 K and 333.15 K. The VLE data werecorrelated using the Peng-Robinson (1976) equation ofstate, and the group pair parameters relating to CH2 +CO2 and CO2 + ArCH in the PRASOG group contributionmethod are reported.
Experimental Section
Apparatus. A schematic diagram of experimental ap-paratus is shown in Figure 1. The apparatus is similar tothat used by Sako et al. (1991) and Tsuji and Hongo (1994)and is a static-type apparatus composed of three parts, theequilibrium cell, the vapor-liquid sampling system, andthe analyzing system.
The experimental equipment was designed to permit thedetermination of equilibrium phase compositions in atemperature range from about room temperature to 393K at pressures to 14.7 MPa. In the equilibrium system,the cell has an internal capacity of about 500 cm3 and isequipped with a Pyrex glass bull’s-eye window to observethe interface between phases. The equilibrium cell andsampling system are in a thermostated air bath.
Composition analyses of vapor and liquid samples weredone with a Shimadzu gas chromatograph type GC-8APTequipped with a thermal conductivity cell. Porapak QSwas used as the column packing, and helium as the carriergas. The composition was determined using the relativearea method with an accuracy within (0.005 mole fraction.
Procedure. Pentane or toluene was placed in theequilibrium cell, and CO2 was added to the desired pres-sure. After confirmation that the pressure in the equilib-rium cell was constant, the temperature and pressure weremeasured. At that time, small samples in the vapor and
liquid phases were removed using the sampling valves andintroduced into the sampling system. In the samplingsystem, each sample was vaporized at decreasing pressureby the use of a vapor-liquid circulating pumps. After allthe samples were evaporated, a constant volume samplewas sampled through a six-direction valve and introducedinto the gas chromatograph, and the composition of eachsample was determined.
The equilibrium temperature was measured with acalibrated platinum resistance thermometer (Pt100O) withan accuracy of (0.03 K. A standard resistance thermom-eter (Chino Co., model R 800-2, Japan), which is based onITS-90, was used for this calibration. The equilibriumpressure was measured using a calibrated Bourdon tubepressure gauge with an accuracy within (0.15% F. S. (fullscale) (about 37 kPa).
Materials. Special-grade pentane and toluene of 99.6mol % purity were supplied by Wako Pure Chem. Co. Ltd.
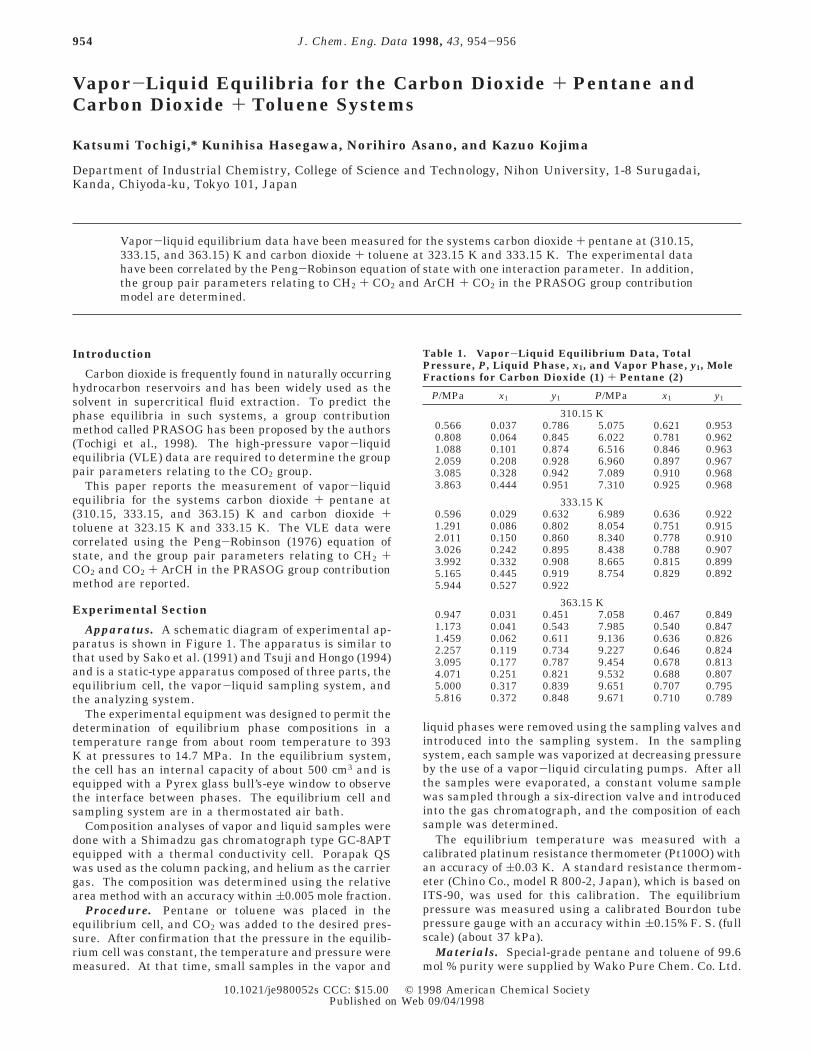
Table 1. Vapor-Liquid Equilibrium Data, TotalPressure, P, Liquid Phase, x1, and Vapor Phase, y1, MoleFractions for Carbon Dioxide (1) + Pentane (2)
P/MPa x1 y1 P/MPa x1 y1
310.15 K0.566 0.037 0.786 5.075 0.621 0.9530.808 0.064 0.845 6.022 0.781 0.9621.088 0.101 0.874 6.516 0.846 0.9632.059 0.208 0.928 6.960 0.897 0.9673.085 0.328 0.942 7.089 0.910 0.9683.863 0.444 0.951 7.310 0.925 0.968
333.15 K0.596 0.029 0.632 6.989 0.636 0.9221.291 0.086 0.802 8.054 0.751 0.9152.011 0.150 0.860 8.340 0.778 0.9103.026 0.242 0.895 8.438 0.788 0.9073.992 0.332 0.908 8.665 0.815 0.8995.165 0.445 0.919 8.754 0.829 0.8925.944 0.527 0.922
363.15 K0.947 0.031 0.451 7.058 0.467 0.8491.173 0.041 0.543 7.985 0.540 0.8471.459 0.062 0.611 9.136 0.636 0.8262.257 0.119 0.734 9.227 0.646 0.8243.095 0.177 0.787 9.454 0.678 0.8134.071 0.251 0.821 9.532 0.688 0.8075.000 0.317 0.839 9.651 0.707 0.7955.816 0.372 0.848 9.671 0.710 0.789
954 J. Chem. Eng. Data 1998, 43, 954-956
10.1021/je980052s CCC: $15.00 © 1998 American Chemical SocietyPublished on Web 09/04/1998

Carbon dioxide gas having a purity of 99.99+ mol % wassupplied from Showa Tansan Co. Ltd. All reagents wereused without further purification.
Experimental Results
Carbon Dioxide + Pentane. The measurements weremade at 310.15 K, for which literature values have beenreported, and at 333.15 K and 363.15 K. The experimentalVLE data are given in Table 1 and are representedgraphically in Figure 2. Figure 2 shows the agreementbetween the experimental data and the literature valuesat 310.9, 310.5, and 311.59 K by Besserer and Robinson(1973), Sako et al. (1986), and Cheng et al. (1989). Theaverage absolute deviations of total pressure are 3.4, 10.1,and 4.7%.
Carbon Dioxide + Toluene. Measurement were madeat 323.15 K, where literature values have been reported,
and at 333.15 K. The experimental data are given in Table2 and shown in Figure 3. Figure 3 shows also theagreement between the experimental and literature valuesby Fink and Hershey (1990). The average absolute devia-tion of total pressure is 3.2%.
Figure 1. Schematic diagram of experimental apparatus.
Figure 2. Experimental vapor-liquid equilibria for the carbondioxide (1) + pentane (2) system: 4, Cheng et al. (1989); 0, Sakoet al. (1986); ], Besserer and Robinson (1973); b, this work (310.15K); 2, this work (333.15 K); 9, this work (363.15 K); s, PR EOS+ k12.
Figure 3. Experimental vapor-liquid equilibria for the carbondioxide (1) + toluene (2) system: O, Fink et al. (1990); b, this work(323.15 K); 2, this work (333.15 K); s, PR EOS + k12.
Table 2. Vapor-Liquid Equilibrium Data, TotalPressure, P, Liquid Phase, x1, and Vapor Phase, y1, MoleFractions for Carbon Dioxide (1) + Toluene (2)
P/MPa x1 y1 P/MPa x1 y1
323.15 K1.080 0.080 0.965 5.501 0.408 0.9922.073 0.150 0.986 6.906 0.573 0.9863.261 0.237 0.991 8.200 0.800 0.9884.634 0.349 0.988 8.630 0.866 0.981
333.15 K1.634 0.109 0.979 7.533 0.556 0.9823.129 0.210 0.986 9.018 0.702 0.9824.215 0.278 0.981 9.885 0.889 0.9766.019 0.418 0.982
Journal of Chemical and Engineering Data, Vol. 43, No. 6, 1998 955
Discussion
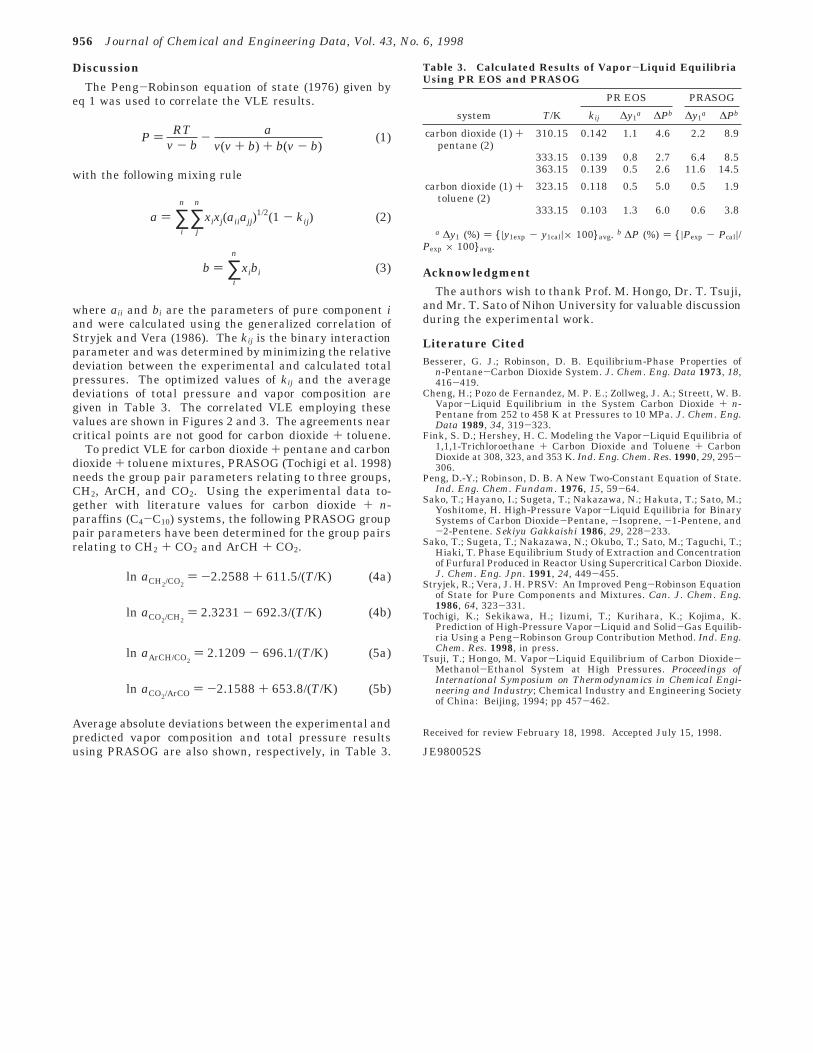
The Peng-Robinson equation of state (1976) given byeq 1 was used to correlate the VLE results.
with the following mixing rule
where aii and bi are the parameters of pure component iand were calculated using the generalized correlation ofStryjek and Vera (1986). The kij is the binary interactionparameter and was determined by minimizing the relativedeviation between the experimental and calculated totalpressures. The optimized values of kij and the averagedeviations of total pressure and vapor composition aregiven in Table 3. The correlated VLE employing thesevalues are shown in Figures 2 and 3. The agreements nearcritical points are not good for carbon dioxide + toluene.
To predict VLE for carbon dioxide + pentane and carbondioxide + toluene mixtures, PRASOG (Tochigi et al. 1998)needs the group pair parameters relating to three groups,CH2, ArCH, and CO2. Using the experimental data to-gether with literature values for carbon dioxide + n-paraffins (C4-C10) systems, the following PRASOG grouppair parameters have been determined for the group pairsrelating to CH2 + CO2 and ArCH + CO2.
Average absolute deviations between the experimental andpredicted vapor composition and total pressure resultsusing PRASOG are also shown, respectively, in Table 3.
Acknowledgment
The authors wish to thank Prof. M. Hongo, Dr. T. Tsuji,and Mr. T. Sato of Nihon University for valuable discussionduring the experimental work.
Literature CitedBesserer, G. J.; Robinson, D. B. Equilibrium-Phase Properties of
n-Pentane-Carbon Dioxide System. J. Chem. Eng. Data 1973, 18,416-419.
Cheng, H.; Pozo de Fernandez, M. P. E.; Zollweg, J. A.; Streett, W. B.Vapor-Liquid Equilibrium in the System Carbon Dioxide + n-Pentane from 252 to 458 K at Pressures to 10 MPa. J. Chem. Eng.Data 1989, 34, 319-323.
Fink, S. D.; Hershey, H. C. Modeling the Vapor-Liquid Equilibria of1,1,1-Trichloroethane + Carbon Dioxide and Toluene + CarbonDioxide at 308, 323, and 353 K. Ind. Eng. Chem. Res. 1990, 29, 295-306.
Peng, D.-Y.; Robinson, D. B. A New Two-Constant Equation of State.Ind. Eng. Chem. Fundam. 1976, 15, 59-64.
Sako, T.; Hayano, I.; Sugeta, T.; Nakazawa, N.; Hakuta, T.; Sato, M.;Yoshitome, H. High-Pressure Vapor-Liquid Equilibria for BinarySystems of Carbon Dioxide-Pentane, -Isoprene, -1-Pentene, and-2-Pentene. Sekiyu Gakkaishi 1986, 29, 228-233.
Sako, T.; Sugeta, T.; Nakazawa, N.; Okubo, T.; Sato, M.; Taguchi, T.;Hiaki, T. Phase Equilibrium Study of Extraction and Concentrationof Furfural Produced in Reactor Using Supercritical Carbon Dioxide.J. Chem. Eng. Jpn. 1991, 24, 449-455.
Stryjek, R.; Vera, J. H. PRSV: An Improved Peng-Robinson Equationof State for Pure Components and Mixtures. Can. J. Chem. Eng.1986, 64, 323-331.
Tochigi, K.; Sekikawa, H.; Iizumi, T.; Kurihara, K.; Kojima, K.Prediction of High-Pressure Vapor-Liquid and Solid-Gas Equilib-ria Using a Peng-Robinson Group Contribution Method. Ind. Eng.Chem. Res. 1998, in press.
Tsuji, T.; Hongo, M. Vapor-Liquid Equilibrium of Carbon Dioxide-Methanol-Ethanol System at High Pressures. Proceedings ofInternational Symposium on Thermodynamics in Chemical Engi-neering and Industry; Chemical Industry and Engineering Societyof China: Beijing, 1994; pp 457-462.
Received for review February 18, 1998. Accepted July 15, 1998.
JE980052S
P ) RTv - b
- av(v + b) + b(v - b)
(1)
a ) ∑i
n
∑j
n
xixj(aiiajj)1/2(1 - kij) (2)
b ) ∑i
n
xibi (3)
ln aCH2/CO2) -2.2588 + 611.5/(T/K) (4a)
ln aCO2/CH2) 2.3231 - 692.3/(T/K) (4b)
ln aArCH/CO2) 2.1209 - 696.1/(T/K) (5a)
ln aCO2/ArCO ) -2.1588 + 653.8/(T/K) (5b)
Table 3. Calculated Results of Vapor-Liquid EquilibriaUsing PR EOS and PRASOG
PR EOS PRASOG
system T/K kij ∆y1a ∆Pb ∆y1
a ∆Pb
carbon dioxide (1) +pentane (2)
310.15 0.142 1.1 4.6 2.2 8.9
333.15 0.139 0.8 2.7 6.4 8.5363.15 0.139 0.5 2.6 11.6 14.5
carbon dioxide (1) +toluene (2)
323.15 0.118 0.5 5.0 0.5 1.9
333.15 0.103 1.3 6.0 0.6 3.8
a ∆y1 (%) ) {|y1exp - y1cal|× 100}avg. b ∆P (%) ) {|Pexp - Pcal|/Pexp × 100}avg.
956 Journal of Chemical and Engineering Data, Vol. 43, No. 6, 1998