Embed Size (px)
Citation preview

© 2021 Valmont® Industries, Inc.
Valmont Industries, Inc. Second Quarter Earnings Presentation
July 22, 2021

Disclosure Regarding Forward-Looking Statements
These slides contain (and the accompanying oral discussion will contain) “forward-looking statements” within the meaning of the Private Securities Litigation Reform Act of 1995. Such statements involve known and unknown risks, uncertainties and other factors that could cause the actual results of the Company to differ materially from the results expressed or implied by such statements, including general economic and business conditions, conditions affecting the industries served by the Company and its subsidiaries including the continuing and developing effects of COVID-19 including the effects of the outbreak on the general economy and the specific economic effects on the Company’s business and that of its customers and suppliers, competitor responses to the Company’s products and services, the overall market acceptance of such products and services, the integration of acquisitions and other factors disclosed in the Company’s periodic reports filed with the Securities and Exchange Commission. Consequently, such forward-looking statements should be regarded as the Company’s current plans, estimates and beliefs. The Company does not undertake and specifically declines any obligation to publicly release the results of any revisions to these forward-looking statements that may be made to reflect any future events or circumstances after the date of such statements or to reflect the occurrence of anticipated or unanticipated events.
July 22, 20212 | Valmont Industries, Inc. | 2Q 2021 Earnings Presentation

| Valmont Industries, Inc. | 2Q 2021 Earnings PresentationJuly 22, 20213
STEVE KANIEWSKIPRESIDENT & CHIEF EXECUTIVE OFFICER
2Q 2021 Segment Sales and Segment Summaries
July 22, 2021 | Valmont Industries, Inc. | 2Q 2021 Earnings Presentation4
Significant Irrigation and Utility Support Structures Revenue Growth
• Sales growth was led by higher volumes due to increasing demand for renewable energy generation, strong broad-based demand from ongoing investments in grid hardening and modernization, and increased pricing
• Sales growth in wireless communication products and components slightly offset by anticipated lower North American transportation market volumes
• Higher global lighting and transportation sales as pricing improved in all regions
• Higher sales in wireless communication structures and components driven by 5G buildouts, small cell integrated products and components, and favorable pricing
• Improving end-market demand, favorable pricing and currency impacts
• Commenced operations at new greenfield Coatings facility near Pittsburgh, PA, which aligns well with Valmont’s ESG principles while serving the growing demand for new infrastructure in this region
• Sales growth across all markets, including 35%+ growth in technology sales
• Global: Higher volumes and favorable pricing • North America: Strong volume from improved
market fundaments and net farm income projections
• International: Sales growth driven by ongoing delivery of Egypt project, European market demand and record sales in Brazil; recently awarded $20M+ of additional projects from new customers in African market
SEGMENT SUMMARIES
TOTAL 2Q 2021 SALES: $894.6M
$267.9M $269.4M $98.2M $282.0MUtility Support
Structures Engineered Support
Structures Coatings Irrigation
N.A.: $156.1M | International: $125.9M
29.9% of Sales 30.1% of Sales 11.0% of Sales 31.5% of Sales
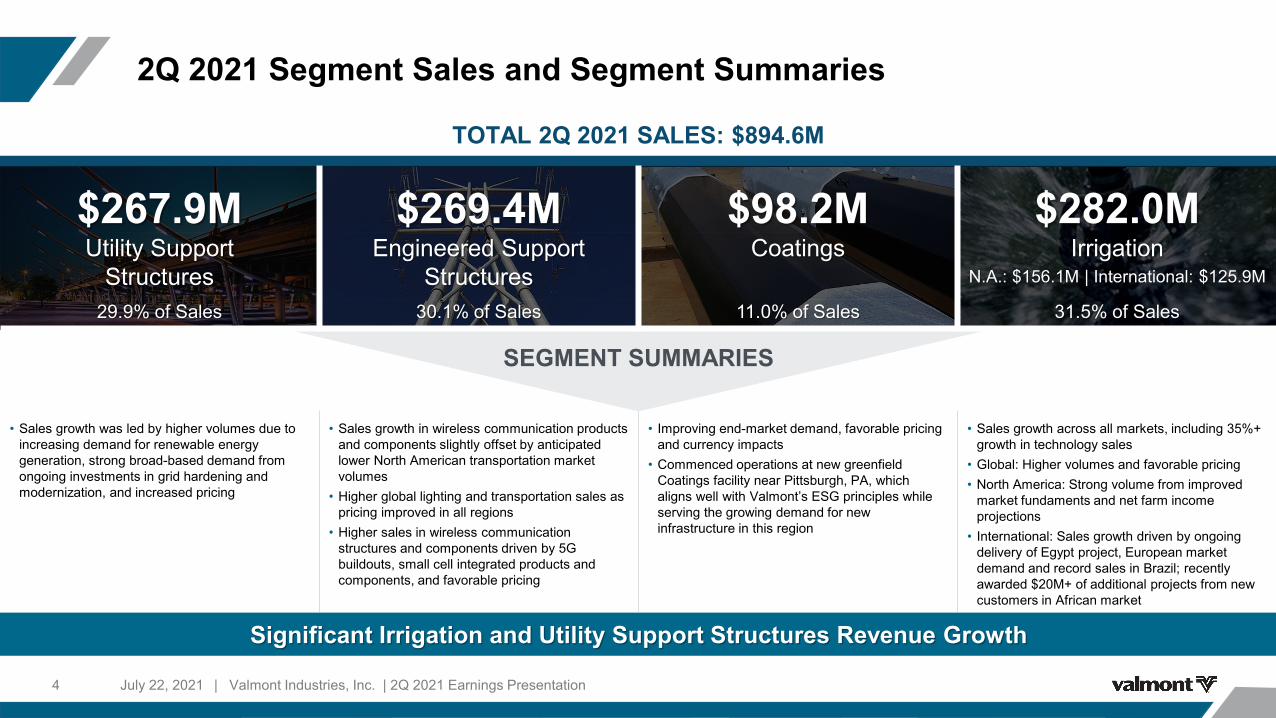
Prospera Technologies Update:Continuing to Expand Our Irrigation Technology Leadership
5
Finding New Ways to Use Less Inputs in Order to Achieve Higher Crop Yields
July 22, 2021 | Valmont Industries, Inc. | 2Q 2021 Earnings Presentation
Strong Value Proposition• Accelerating innovation through investments in recurring revenue services • Expect recurring revenue sales to grow to 50%+ per year over next 3-5 years• Expect acquisition to be accretive to the segment beginning in 2023
Unique Technology• Highly-differentiated solution focused on in-season crop performance that is
able to go beyond traditional irrigated acres• Used on 5,300+ fields today on a variety of crops including corn, soybeans,
potatoes, wheat, onions, alfalfa and tomatoes
Entrepreneurial Spirit and Key Talent Additions• 100 highly-talented and motivated employees, including experts in data science
and machine-learning
Key Stats
Founded 2014
Headquarters Austin, TX
R&D Center Tel Aviv, Israel
Transaction Details
Price $300M
Financing Cash + RevolvingCredit Facility
Closed May 2021
Award-winning, Global Leader in AI and Machine-Learning

6 July 22, 2021 | Valmont Industries, Inc. | 2Q 2021 Earnings Presentation
“Class of One” Industry-Recognized Status
Accelerated Growth and New Product Innovations in Solar Business
Total Projects Awarded in 2Q 2021 ($72M)
Valmont Solar Solutions - Utility
• Awarded projects totaling $47M in 2Q 2021• 30+ orders for the North American Market over past 18 months• Completed several sunbelt region projects
Valmont Solar Solutions - Agriculture
• Awarded 3 Ag solar projects in 2Q 2021 equating to $25M• Launching in North America this fall at Husker Harvest Days• Collaborating with the Utility solar team and world-class Valley dealer network• Delivering integrated solutions to support ag players in their markets

ESG Excellence as a Foundation
7
ESG Continues to be a Strategic Priority with the Mindset of Conserving Resources and Improving Life
| Valmont Industries, Inc. | 2Q 2021 Earnings PresentationJuly 22, 2021
Reiterating Our 2021 Investor Day ESG Initiatives
ENVIRONMENTALSustainably building upon a foundation focused on managing risks and improving efficiencies
ISS Quality Score
Previous Today
6 2
SOCIALEmpowering our workforce, customers and communities
ISS Quality Score
Previous Today
6 3
GOVERNANCEOperating ethically and managing oversight through open collaboration
ISS Quality Score
Previous Today
2 2
Recent Recognition of Our ESG Efforts – Improvement in ISS Quality Scores

AVNER APPLBAUMEVP & CHIEF FINANCIAL OFFICER
| Valmont Industries, Inc. | 2Q 2021 Earnings PresentationJuly 22, 20218

2Q 2021 Financial Summary
July 22, 2021 | Valmont Industries, Inc. | 2Q 2021 Earnings Presentation9
Sales Operating Income Diluted EPSGAAP Adjusted1 GAAP Adjusted1
29.9% 90.2% 38.4% 172.6% 53.0%
• Record second quarter sales; significantly higher in Irrigation and Utility Support Structures
• Record global backlog of more than $1.34B, reflecting strong market demand
• Operating income growth driven by:‒ Higher volumes in Irrigation‒ Improved operating performance including
record quarterly results for Engineered Support Structures
• Strong operating income and a more favorable adj. tax rate of 22.5% realized through the execution of certain tax planning strategies
• GAAP results for 2020 include a $16.6 million goodwill & tradename impairment ($0.77 per share)
$M, except for per share amounts
$82.6
$43.4
$90.9
$65.7
2021 2020 2021 2020
$894.6
$688.8
2021 2020
$2.89
$1.06
$3.06
$2.00
2021 2020 2021 2020
1Please see Reg G reconciliation of GAAP sales, operating income, net earnings and EPS to Adjusted figures at end of document.

Sales Operating Income15.8% GAAP Adjusted1
2Q 2021 Results | Utility Support Structures
10
($M) Key Statistics2020 Sales $ 231.3
Intersegment Sales (2.8)
Volume 28.6
Pricing/Mix 8.5
Acquisitions/Divestiture -
Currency Translation 2.3
2021 Sales $ 267.9
$267.9 $231.3
2021 2020
COMMENTARY• Higher volumes due to increasing demand for renewable energy generation and utilities’ continued investments in grid resiliency• Strong volumes, increased pricing and improved operational performance more than offset by ongoing impact of rapidly rising raw material costs –
could not yet be recovered through pricing mechanisms
July 22, 2021 | Valmont Industries, Inc. | 2Q 2021 Earnings Presentation
$15.0 $21.7 $21.2
$25.3
2021 2020 2021 2020
1Please see Reg G reconciliation of GAAP sales, operating income, net earnings and EPS to Adjusted figures at end of document.

Sales Operating Income1
6.3%
2Q 2021 Results | Engineered Support Structures
July 22, 2021 | Valmont Industries, Inc. | 2Q 2021 Earnings Presentation11
($M)
$269.4 $253.4
2021 2020
$31.9
$4.8
$22.9
2021 2020 2020 Adj.
COMMENTARY• Record sales and operating income, led by a focus on pricing actions, cost optimization, and the benefits of previous restructuring actions• Operations teams continue to drive performance improvement across the segment through improved productivity and product quality, and better
ship-complete and on-time (SCOT) delivery metrics• Higher wireless communication structures and components sales and commercial lighting sales offset lower volumes in North American
transportation markets
Key Statistics2020 Sales $ 253.4
Intersegment Sales (4.5)
Volume (2.4)
Pricing/Mix 11.4
Acquisitions/Divestiture -
Currency Translation 11.5
2021 Sales $ 269.4
1Please see Reg G reconciliation of GAAP sales, operating income, net earnings and EPS to Adjusted figures at end of document.

2Q 2021 Results | Coatings
July 22, 2021 | Valmont Industries, Inc. | 2Q 2021 Earnings Presentation12
($M)
COMMENTARY• Sales increase was driven by an improving macro-environment compared to last year, favorable pricing and FX• Higher volumes, favorable pricing and operational efficiencies more than offset the impact of raw material cost inflation
Key Statistics2020 Sales $ 80.0
Intersegment Sales 3.2
Volume 6.0
Pricing/Mix 5.1
Acquisitions/Divestiture 0.1
Currency Translation 3.8
2021 Sales $ 98.2
Sales Operating Income1
22.7%
$98.2 $80.0
2021 2020
$14.7
$10.1 $10.4
2021 2020 2020 Adj.
1Please see Reg G reconciliation of GAAP sales, operating income, net earnings and EPS to Adjusted figures at end of document.

Sales Operating Income1
57.6% 144.0%
2Q 2021 Results | Irrigation
July 22, 202113
($M)
$42.0 $42.9
$22.4
2021 2021 Adj 20202021 2020
$156.1 $125.9
$99.0
$51.6
North America International
COMMENTARY• Strong global agricultural market fundamentals continue to drive positive farmer sentiment• In North America, strong market fundamentals and improved net farm income projections contributed to sales growth• Ongoing deliveries of the large Egypt project, and higher sales in Brazil and Europe led international sales growth• Significantly higher volumes and favorable pricing slightly offset by $3.1M of higher R&D expense for strategic technology growth investments,
including product development• 1H 2021 technology solutions sales of $50.0M grew 55.0% YoY
| Valmont Industries, Inc. | 2Q 2021 Earnings Presentation
Key Statistics2020 Sales $ 150.6
Intersegment Sales 0.3
Volume 89.7
Pricing/Mix 38.6
Acquisitions/Divestiture 1.1
Currency Translation 1.7
2021 Sales $ 282.0
1Please see Reg G reconciliation of GAAP sales, operating income, net earnings and EPS to Adjusted figures at end of document.

2Q 2021 Cash Flow Highlights
July 22, 2021 | Valmont Industries, Inc. | 2Q 2021 Earnings Presentation14
Positive Operating Cash Flow Despite Continued Inflationary Pressure
($M)
YTD6/26/2021
Net Cash Flows from Operating Activities $ 70.2
Net Cash Flows from Investing Activities (361.4)
Net Cash Flows from Financing Activities 90.1
Net Cash Flows from Operating Activities $ 70.2
Purchase of Property, Plant & Equipment (48.8)
Free Cash Flows $ 21.4
2Q Cash Flow | FCF Reconciliation Cash and Debt Highlights
$199.3M($188.0M ex-U.S.)
Cash at 6/26/2021
$860.9MTotal Long-term Debt at 6/26/2021

Balanced Approach to Capital Allocation
July 22, 2021 | Valmont Industries, Inc. | 2Q 2021 Earnings Presentation15
$49
$313
$22 $20
CapitalExpenditures
Acquisitions ShareRepurchases
Dividends
2021 YTD Capital Deployment: $404MCapital Expenditures
• 2021 CapEx expected to be $110M - $120M• Investments to support strategic growth initiatives and
Industry 4.0 advanced manufacturing
Acquisitions • Strategic fit + market expansion• Returns exceeding cost of capital within 3 years
ShareRepurchases
• Opportunistic approach, supported by FCF• Repurchased 42,150 shares in 2Q at an average price
of $248.47 per share• ~$126M remains on current authorization as of 6/26/21
Dividends• 11% dividend increase announced February 2021• Payout ratio target: 22% of earnings• Current payout: ~20%
Gro
win
g O
urB
usin
ess
Ret
urni
ng C
ash
to
Shar
ehol
ders

Strong Balance Sheet and Liquidity
July 22, 2021 | Valmont Industries, Inc. | 2Q 2021 Earnings Presentation16
Cash $199.3M
Total Debt (Long-term) $860.9M
Shareholders’ Equity $1,321.5M
Total Debt to Adj. EBITDA1 2.3x
Available Credit under Revolving Credit Facility2 $452.9M
Cash $199.3M
Total Available Liquidity $652.2M
AS OF JUNE 26, 2021
► Long-term debt of $860.9M, mostly fixed-rate, with long-dated maturities to 2044 and 2054
► Capital allocation strategy has not changed, and the primary focus is to maintain liquidity to support operations and maintain investment grade credit rating
− Purchased $10.5M of company stock in Q2, and $126.4M remains on current authorization
1 See slide 32 for calculation of Adjusted EBITDA and Leverage Ratio. 2 $600M Total Revolver less borrowings and Standby LC”s of $147M.
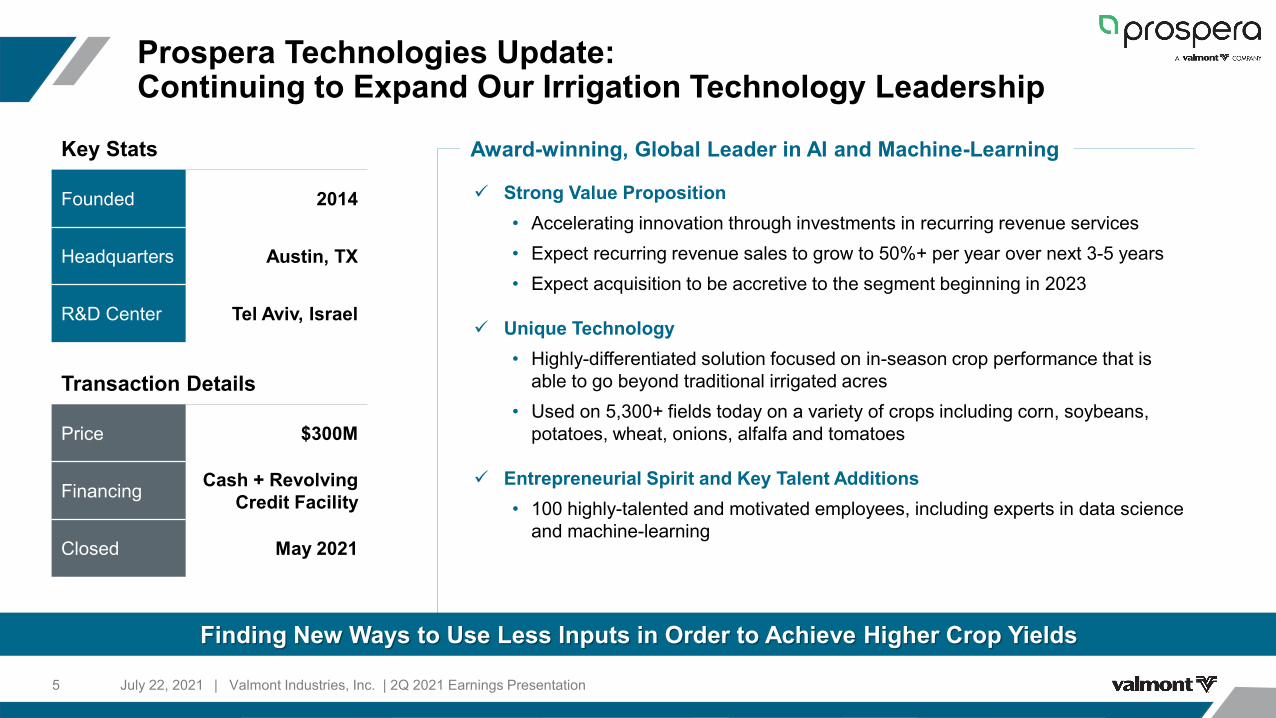
2Q 2021 / Full Year 2021 Outlook and Key Assumptions
17 | Valmont Industries, Inc. | 2Q 2021 Earnings PresentationJuly 22, 2021
PREVIOUSFY21 OUTLOOK1 KEY ASSUMPTIONS
• Favorable foreign currency translation impact of ~2% of Net Sales
• Expect 2H21 tax rate of ~25.0%; no tax law changes
• CapEx to be in the range of $110M - $120M to support strategic growth initiatives and Industry 4.0 advanced manufacturing initiatives
• No closures of large manufacturing facilities, workforce disruptions, or significant supply chain interruptions
9% – 14%Increase in Net Sales
YoY
1 Exclusive of potential future restructuring activities. 2 Please see Reg G reconciliation of GAAP sales, operating income, net earnings and EPS to Adjusted figures at end of document.
$9.30 – $10.00GAAP Diluted EPS
27% – 30%Increase in Irrigation Segment Sales YoY
16% – 19%Increase in Net Sales
YoY
$9.90 – $10.60GAAP Diluted EPS
45% – 50%Increase in Irrigation Segment Sales YoY
CURRENTFY21 OUTLOOK1
N/AAdj. Diluted EPS2
$10.40 – $11.10Adj. Diluted EPS2

2021 Segment Outlook
July 22, 2021 | Valmont Industries, Inc. | 2Q 2021 Earnings Presentation18
Positive Momentum Across all Businesses
USS • Expect quality of earnings to meaningfully improve in 3Q and 2H 2021 as pricing becomes more aligned with steel cost inflation• Strong backlog indicative of long-term market drivers of grid resiliency and the increasing use of renewable energy
ESS • Expect some short-term softness in North American transportation markets, and improved demand for commercial lighting• Demand for wireless communication structures and components remains strong; expect sales to grow 15% - 20%, in line with market
expectations
COATINGS • End-market demand correlates closely to general economic trends• Focusing on pricing excellence and providing value to customers
IRRIGATION
• Expect 45-50% sales growth YoY, based on global underlying ag fundamentals, the estimated timing of deliveries of the large Egypt project, and another record sales year in Brazil
• 3Q 2021 is a lower sales quarter due to normal business seasonality• Deliveries of the large project for Egypt began in 4Q 2020, which will affect YoY growth comparisons• Continue to raise prices to offset inflationary pressures
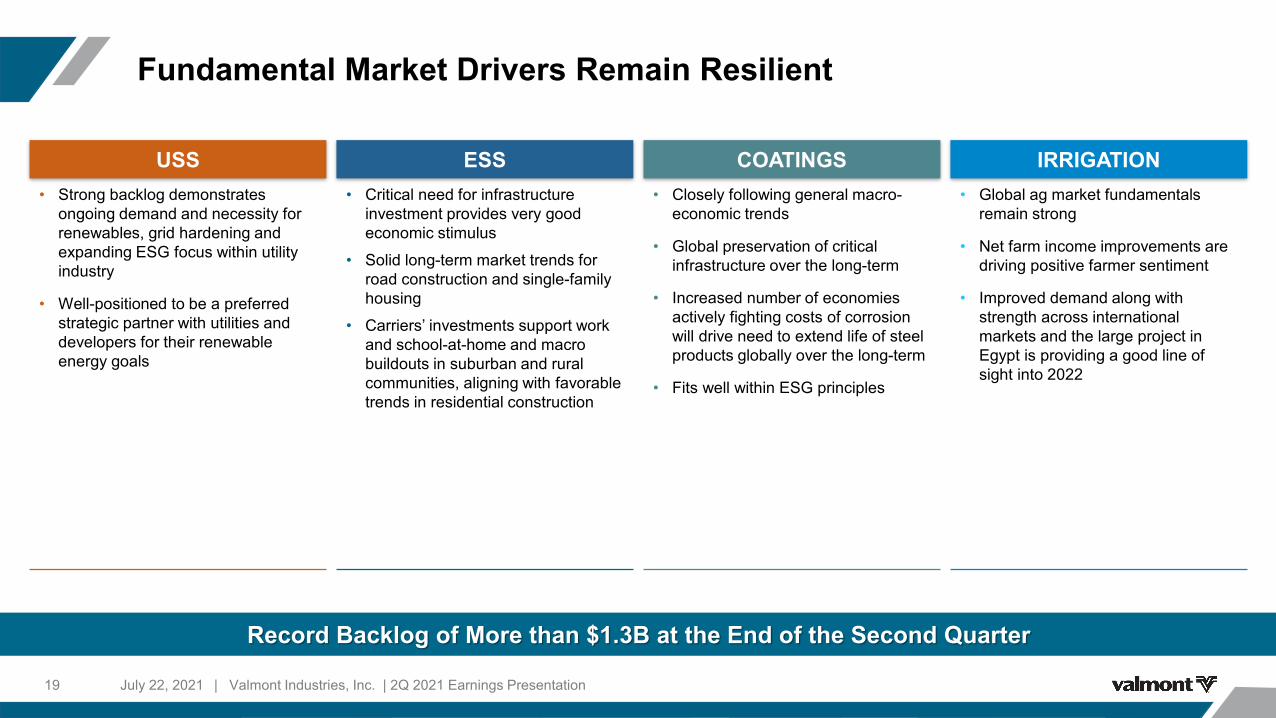
Fundamental Market Drivers Remain Resilient
19
Record Backlog of More than $1.3B at the End of the Second Quarter
| Valmont Industries, Inc. | 2Q 2021 Earnings PresentationJuly 22, 2021
COATINGS IRRIGATION• Closely following general macro-
economic trends
• Global preservation of critical infrastructure over the long-term
• Increased number of economies actively fighting costs of corrosion will drive need to extend life of steel products globally over the long-term
• Fits well within ESG principles
• Global ag market fundamentals remain strong
• Net farm income improvements aredriving positive farmer sentiment
• Improved demand along with strength across international markets and the large project in Egypt is providing a good line of sight into 2022
• Critical need for infrastructure investment provides very good economic stimulus
• Solid long-term market trends for road construction and single-family housing
• Carriers’ investments support work and school-at-home and macro buildouts in suburban and rural communities, aligning with favorable trends in residential construction
• Strong backlog demonstrates ongoing demand and necessity for renewables, grid hardening and expanding ESG focus within utility industry
• Well-positioned to be a preferred strategic partner with utilities and developers for their renewable energy goals
ESSUSS

Ability to navigate and capitalize on challenging market dynamics demonstrates the strength and sustainability of our business and long-term strategy, favorable end-market trends and strong price leadership in the marketplace
Remain focused on the execution of our strategy fueled by our dedicated and talented team of 10,000 employees and our differentiated business model
Accelerating growth through investments in innovation, technology and IoTthrough our acquisitions of Prospera Technologies and PivoTrac, which builds on our overall strategy to grow recurring revenue services
Summary
20
Poised and Well Positioned to Capture Growth and Drive Shareholder Value in the Future
| Valmont Industries, Inc. | 2Q 2021 Earnings PresentationJuly 22, 2021
01
02
03

Q&A
21 | Valmont Industries, Inc. | 2Q 2021 Earnings PresentationJuly 22, 2021

APPENDIX
22 | Valmont Industries, Inc. | 2Q 2021 Earnings PresentationJuly 22, 2021

2Q 2021 Financial Summary
23 | Valmont Industries, Inc. | 2Q 2021 Earnings PresentationJuly 22, 2021
Net Sales 2021 2020 Change YTD 2021 YTD 2020 Change
Utility Support Structures $ 267.9 $ 231.3 15.8% $ 521.0 $ 456.8 14.1%
Engineered Support Structures 269.4 253.4 6.3% 491.7 484.1 1.6%
Coatings 98.2 80.0 22.7% 191.4 168.1 13.9%Irrigation 282.0 150.6 87.2% 511.6 307.4 66.5%Intersegment Sales1 (22.9) (26.5) NM (46.2) (53.4) NM
Net Sales $ 894.6 $ 688.8 29.9% $ 1,669.5 $ 1,363.0 22.5%
Operating Income $ 82.6 $ 43.4 90.2% $ 159.8 $ 110.3 44.9%
Adjusted Operating Income2 $ 90.9 $ 65.7 38.4% $ 168.1 $ 132.6 26.8%
Net Income $ 62.1 $ 22.6 174.7% $ 117.1 $ 65.5 78.7%
Diluted Earnings Per Share (EPS) $ 2.89 $ 1.06 172.6% $ 5.46 $ 3.05 79.0%
Adjusted Diluted Earnings Per Share (EPS)2 $ 3.06 $ 2.00 53.0% $ 5.63 $ 3.99 41.1%
$M, except for per share amounts
.1Includes rounding 2Please see Reg G reconciliation of GAAP sales, operating income, net earnings and EPS to Adjusted figures at end of document.
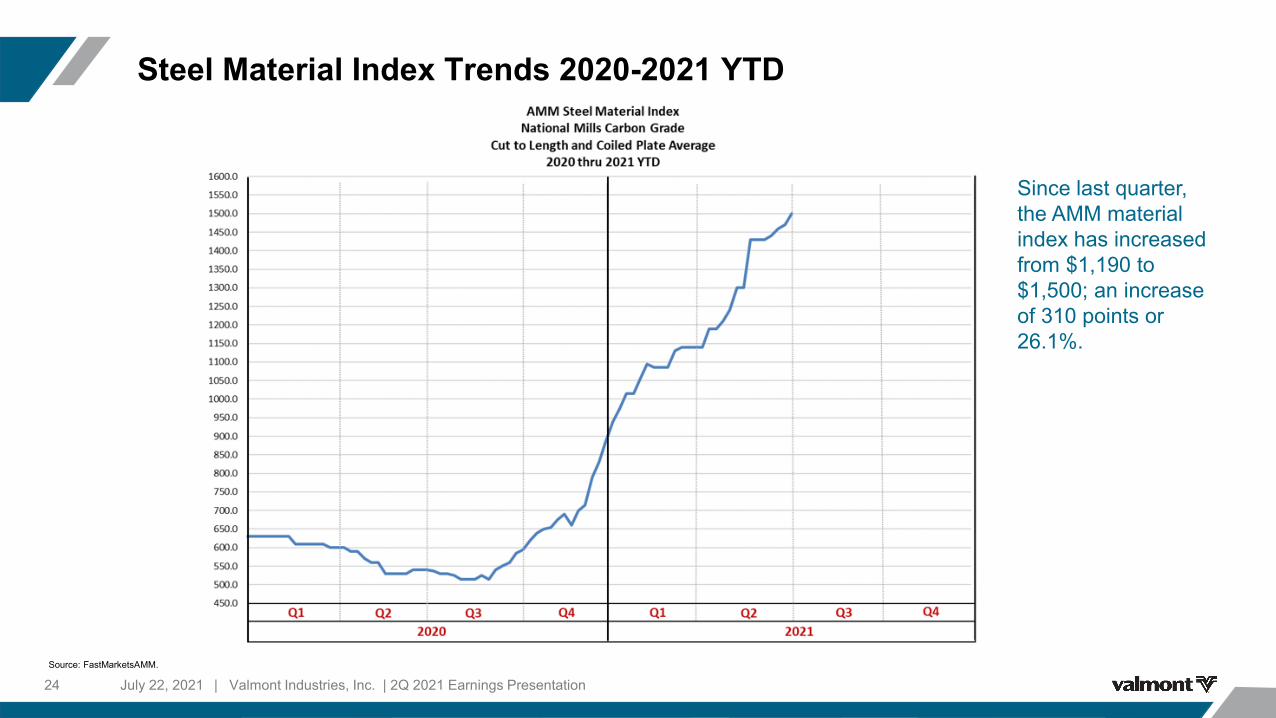
Steel Material Index Trends 2020-2021 YTD
24 | Valmont Industries, Inc. | 2Q 2021 Earnings PresentationJuly 22, 2021
Since last quarter, the AMM material index has increased from $1,190 to $1,500; an increase of 310 points or 26.1%.
Source: FastMarketsAMM.

State Transportation Investment Funding Measures
25 | Valmont Industries, Inc. | 2Q 2021 Earnings PresentationJuly 22, 2021
• State legislators in 44 states introduced 188 transportation funding measures in the first half of 2021
• Funding Approved in 2021 Legislative Session: $29,383,725,783
• One-time funding bills, including allocation of federal Covid-19 relief funds, were approved in twelve states for a total of $23.4 billion
Source: Transportation Investment Advocacy Center.

State Transportation Investment Funding Measures by Type
26 | Valmont Industries, Inc. | 2Q 2021 Earnings PresentationJuly 22, 2021Source: Transportation Investment Advocacy Center.

5G Adoption Forecast and Capex Spend Post-COVID
27 | Valmont Industries, Inc. | 2Q 2021 Earnings PresentationJuly 22, 2021Source: GSM Association.

U.S. Net Farm Income
July 22, 202128Source: USDA Farm Income Data, Updated February 5, 2021
10 11 13 12 1422
46
25
8371
4964
6861
75
86
0
20
40
60
80
100
120
140
2014 2015 2016 2017 2018 2019 2020F 2021F
Net Farm Income w/ Government Payments
Dir. Gov't Payments NFI, less Gov't Payments
93
76
62
82
($B)
82 83
121
111
| Valmont Industries, Inc. | 2Q 2021 Earnings Presentation

U.S. Net Cash Farm Income by Year
July 22, 2021 | Valmont Industries, Inc. | 2Q 2021 Earnings Presentation29Source: USDA, American Farm Bureau Federation
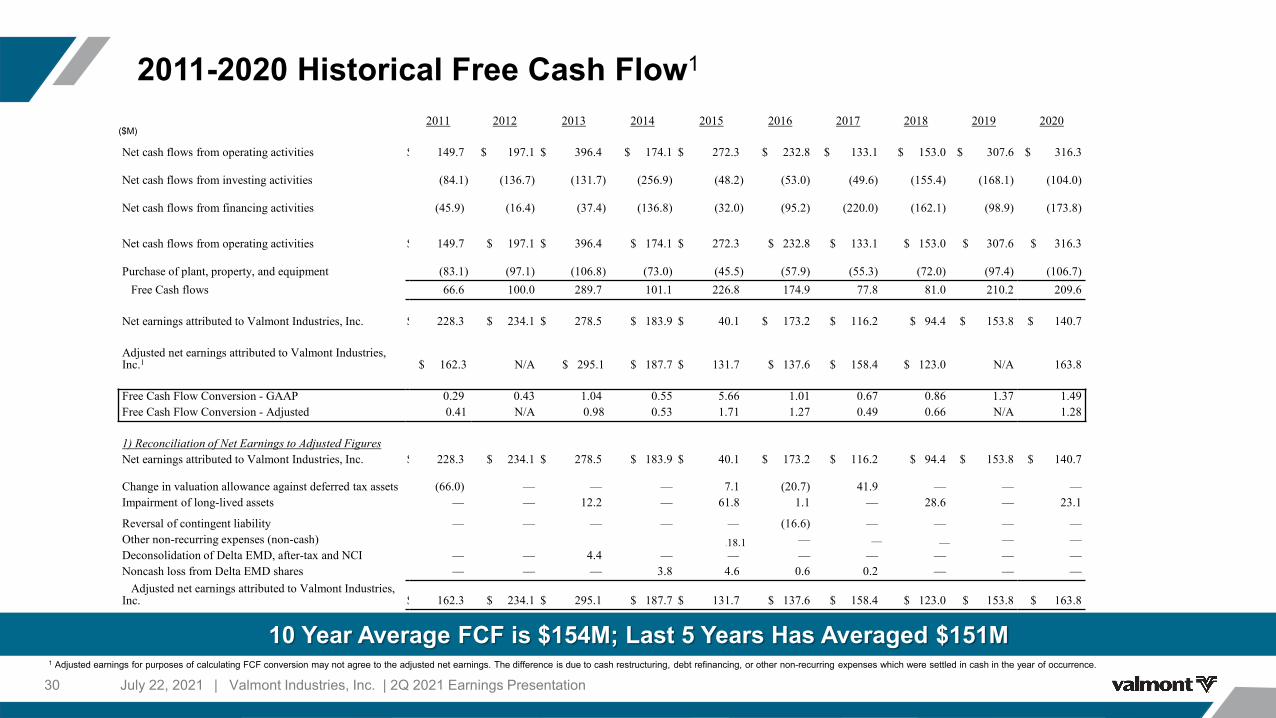
2011-2020 Historical Free Cash Flow1
July 22, 2021 | Valmont Industries, Inc. | 2Q 2021 Earnings Presentation30
10 Year Average FCF is $154M; Last 5 Years Has Averaged $151M
2011 2012 2013 2014 2015 2016 2017 2018 2019 2020
Net cash flows from operating activities $ 149.7 $ 197.1 $ 396.4 $ 174.1 $ 272.3 $ 232.8 $ 133.1 $ 153.0 $ 307.6 $ 316.3
Net cash flows from investing activities (84.1) (136.7) (131.7) (256.9) (48.2) (53.0) (49.6) (155.4) (168.1) (104.0)
Net cash flows from financing activities (45.9) (16.4) (37.4) (136.8) (32.0) (95.2) (220.0) (162.1) (98.9) (173.8)
Net cash flows from operating activities $ 149.7 $ 197.1 $ 396.4 $ 174.1 $ 272.3 $ 232.8 $ 133.1 $ 153.0 $ 307.6 $ 316.3
Purchase of plant, property, and equipment (83.1) (97.1) (106.8) (73.0) (45.5) (57.9) (55.3) (72.0) (97.4) (106.7)Free Cash flows 66.6 100.0 289.7 101.1 226.8 174.9 77.8 81.0 210.2 209.6
Net earnings attributed to Valmont Industries, Inc. $ 228.3 $ 234.1 $ 278.5 $ 183.9 $ 40.1 $ 173.2 $ 116.2 $ 94.4 $ 153.8 $ 140.7
Adjusted net earnings attributed to Valmont Industries, Inc.1 $ 162.3 N/A $ 295.1 $ 187.7 $ 131.7 $ 137.6 $ 158.4 $ 123.0 N/A 163.8
Free Cash Flow Conversion - GAAP 0.29 0.43 1.04 0.55 5.66 1.01 0.67 0.86 1.37 1.49Free Cash Flow Conversion - Adjusted 0.41 N/A 0.98 0.53 1.71 1.27 0.49 0.66 N/A 1.28
1) Reconciliation of Net Earnings to Adjusted FiguresNet earnings attributed to Valmont Industries, Inc. $ 228.3 $ 234.1 $ 278.5 $ 183.9 $ 40.1 $ 173.2 $ 116.2 $ 94.4 $ 153.8 $ 140.7
Change in valuation allowance against deferred tax assets (66.0) — — — 7.1 (20.7) 41.9 — — —Impairment of long-lived assets — — 12.2 — 61.8 1.1 — 28.6 — 23.1
Reversal of contingent liability — — — — — (16.6) — — — —Other non-recurring expenses (non-cash)
18.18.1 — — — — —Deconsolidation of Delta EMD, after-tax and NCI — — 4.4 — — — — — — —Noncash loss from Delta EMD shares — — — 3.8 4.6 0.6 0.2 — — —
Adjusted net earnings attributed to Valmont Industries, Inc. $ 162.3 $ 234.1 $ 295.1 $ 187.7 $ 131.7 $ 137.6 $ 158.4 $ 123.0 $ 153.8 $ 163.8
($M)
1 Adjusted earnings for purposes of calculating FCF conversion may not agree to the adjusted net earnings. The difference is due to cash restructuring, debt refinancing, or other non-recurring expenses which were settled in cash in the year of occurrence.

Years of rapid raw material cost inflation
GAAP 0.29X 0.43X 1.04X 0.55X 5.66X 1.01X 0.67X 0.86X 1.37X 1.49X
Adj. 0.41X N/A 0.98X 0.53X 1.71X 1.27X 0.49X 0.66X N/A 1.28X
2011 – 2020 Free Cash Flow1 ($M)
67 100
290
101
227
175
78 81
210 210
2011 2012 2013 2014 2015 2016 2017 2018 2019 2020
10-yr Avg. $154MGAAP 1.34XAdj. 0.91X
Historical FCF Conversion by Year1
Strong Free Cash Flow throughout the Cycle
31 | Valmont Industries, Inc. | 2Q 2021 Earnings PresentationJuly 22, 2021
1 We use the non-GAAP measure of FCF, which we define as GAAP net cash flows from operating activities reduced by capex. We believe that FCF is a useful performance measure for management and useful to investors as the basis for comparing our performance with other companies. Our measure of FCF may not be directly comparable to similar measures used by other companies.

Calculation of Adjusted EBITDA and Leverage Ratio
32 | Valmont Industries, Inc. | 2Q 2021 Earnings PresentationJuly 22, 2021
Certain of our debt agreements contain covenants that require us to maintain certain coverage ratios. Our Debt/Adjusted EBITDA may not exceed 3.5X Adjusted EBITDA (or 3.75X Adjusted EBITDA after certain material acquisitions) of the prior four quarters. See “Leverage Ratio “ below.
YTD26-Jun-21
Net earnings attributable to Valmont Industries, Inc. $ 192,281Interest expense 41,398Income tax expense 52,769Depreciation and amortization expense 86,372EBITDA 372,820Cash restructuring expenses 15,634 Impairment of goodwill and intangible assets -Impairment of property, plant, and equipment 1,493Adjusted EBITDA $ 389,947
Debt $ 895,955Leverage Ratio 2.30
Debt $ 895,955Cash 199,285Net Debt 696,670Leverage Ratio 1.79
($000s)

Summary of Effect of Significant Non-Recurring Items on Reported Results
33 | Valmont Industries, Inc. | 2Q 2021 Earnings PresentationJuly 22, 2021

Summary of Effect of Significant Non-Recurring Items on Reported Results
34 | Valmont Industries, Inc. | 2Q 2021 Earnings PresentationJuly 22, 2021

Summary of Effect of Significant Non-Recurring Items on Reported Results
35 | Valmont Industries, Inc. | 2Q 2021 Earnings PresentationJuly 22, 2021

Summary of Effect of Significant Non-Recurring Items on Reported Results
36 | Valmont Industries, Inc. | 2Q 2021 Earnings PresentationJuly 22, 2021

Regulation G Reconciliation of Forecasted GAAP and Adjusted Earnings
37 | Valmont Industries, Inc. | 2Q 2021 Earnings PresentationJuly 22, 2021