Embed Size (px)
Citation preview
Validation of suitable genes for normalization of diurnal geneexpression studies in Chenopodium quinoa
Nathaly Maldonado-Taipe1, Dilan Sarange1, Sandra Schmöckel2,3, Christian Jung1, Nazgol
Emrani1*
1Plant Breeding Institute, Christian-Albrechts-University of Kiel, Olshausenstr.40, D-24098 Kiel,
Germany
2King Abdullah University of Science and Technology (KAUST), Biological and Environmental
Sciences & Engineering Division (BESE), Thuwal, 23955-6900, Saudi Arabia
3Institute of Crop Science, University of Hohenheim, Fruwirthstr. 21, 70599 Stuttgart, Germany
* Correspondence:
Nazgol Emrani
Abstract
Quinoa depicts high nutritional quality and abiotic stress resistance attracting strong interest in the
last years. To unravel the function of candidate genes for agronomically relevant traits, studying
their transcriptional activities by RT-qPCR is an important experimental approach. The accuracy of
such experiments strongly depends on precise data normalization. To date, validation of potential
candidate genes for normalization of diurnal expression studies has not been performed in C.
quinoa. We selected eight candidate genes based on transcriptome data and literature survey,
including conventionally used reference genes. We used three statistical algorithms (BestKeeper,
geNorm and NormFinder) to test their stability and added further validation by a simulation-based
strategy. We demonstrated that using different reference genes, including those top ranked by
1
1
2
3
4
5
6
7
8
9
10
11
12
13
14
15
16
17
18
19
20
.CC-BY 4.0 International license(which was not certified by peer review) is the author/funder. It is made available under aThe copyright holder for this preprintthis version posted May 14, 2020. . https://doi.org/10.1101/2020.05.14.095786doi: bioRxiv preprint
stability, causes significant differences among the resulting diurnal expression patterns, and that
our novel approach overcomes failures related to stability-based selection of reference genes. Our
results show that isocitrate dehydrogenase enzyme (IDH-A) and polypyrimidine tract-binding
protein (PTB) are suitable genes to normalize diurnal expression data of two different quinoa
accessions. The validated reference genes obtained in this study will improve the accuracy of RT-
qPCR data normalization and facilitate gene expression studies in quinoa.
1 Introduction
Real time quantitative PCR (RT-qPCR) is a widely used method, which allows the study of gene
expression through quantification of nucleic acids. Normalization of RT-qPCR expression data can
be carried out using reference genes. Ideally, the reference gene expression should remain constant
or vary minimally in various tissues under the different experimental treatments. However, it has
been shown that the utility of the reference genes must be validated for different experimental
conditions [1-5], and that normalization against a non-validated reference gene can disprove
quantitative results [6]. Screening of an adequate reference gene can be performed by statistical
algorithms developed for this purpose. The most popular algorithms are geNorm [7], NormFinder
[8] and BestKeeper [9]. geNorm calculates an average expression stability, which is defined as the
average pairwise variation in a particular gene with all other potential reference genes; NormFinder
identifies stably expressed genes based on a mathematical model that enables the estimation of the
intra and inter-group variation of the sample set; and BestKeeper calculates the standard deviation
(SD) and a coefficient of variance (CV) as a measure of stability. Reference genes under different
experimental conditions have been found through the use of these algorithms for a variety of crops
such as lettuce [10], pea [4], barley [11], peach [3], maize [12], rice [13], pineapple [2] and others.
Many developmental processes are under the influence of the circadian clock. The circadian clock
genes supply information on the daily environmental changes and provide plants with the ability to
2
21
22
23
24
25
26
27
28
29
30
31
32
33
34
35
36
37
38
39
40
41
42
43
44
.CC-BY 4.0 International license(which was not certified by peer review) is the author/funder. It is made available under aThe copyright holder for this preprintthis version posted May 14, 2020. . https://doi.org/10.1101/2020.05.14.095786doi: bioRxiv preprint

regulate the time of consumption and production of energy. Thus, the circadian system
manipulation is a strategy for optimizing plant growth and yield and overcoming environmental
stress [14, 15]. The study of the circadian clock by diurnal gene expression through RT-qPCR
implies a careful and rigorous selection of reference genes. It has been shown that a reference gene
that has been qualified as stable could depict diurnal expression patterns. When such a gene is used
to normalize expression data, it causes considerable changes in the expression profiles of the target
genes [16].
Quinoa (Chenopodium quinoa Willd.) is a dicotyledonous annual species from the family
Amaranthaceae. It has an allotetraploid genome (1.39 Gb) presumably originating from the
diploid species Chenopodium pallidicaule (A-genome) and Chenopodium suecicum (B-genome)
[17]. Quinoa has high protein content and an exceptional balance between oil, protein and fat. It
also supplies balanced amounts of the amino acid lysine along with the other eight essential amino
acids [18]. This, together with its great adaptability to extreme climatic and soil conditions, conveys
significant potential for quinoa production expansion around the world [19]. To date, no reference
genes validation has been performed for diurnal expression studies in C. quinoa.
In this study, we aimed to select suitable reference genes for diurnal expression studies in C.
quinoa. For that, we selected eight candidate reference genes and used three statistical algorithms
(geNorm, NormFinder and BestKeeper) to test their stability. We performed further validation by
normalizing the expression data of the diurnally regulated DOUBLE B-BOX TYPE ZINC FINGER
(BBX19) [20] against each of the candidate reference genes followed by a comparison between the
obtained expression profiles and a model expression profile, which we refer to as “simulation”. This
work meticulously validated reference genes to facilitate and fortify diurnal gene expression
analysis in different accessions of C. quinoa.
2 Materials and Methods
3
45
46
47
48
49
50
51
52
53
54
55
56
57
58
59
60
61
62
63
64
65
66
67
68
.CC-BY 4.0 International license(which was not certified by peer review) is the author/funder. It is made available under aThe copyright holder for this preprintthis version posted May 14, 2020. . https://doi.org/10.1101/2020.05.14.095786doi: bioRxiv preprint

In the present work, we followed the Minimum Information for Publication of Quantitative Real-
Time PCR Experiments (MIQE) guidelines [21].
2.1 Plant material, growth conditions and tissue sampling
We considered two C. quinoa accessions from different origins for this experiment: a short day
Peruvian accession (CHEN-109; seed code: 170083), which flowered 69 days after sowing and a
Danish accession (Titicaca; seed code: 170191), which is adapted to long day conditions and
flowered 38 days after sowing. The seeds were kindly provided by Prof. Mark Tester, King
Abdullah University of Science and Technology, Saudi Arabia. One hundred plants per accession
were sown in 9 cm pots on February 16th, 2018. The plants grew in growth chamber under short
day conditions (8 h light at 22 °C, light intensity 120 µE). We performed diurnal sampling of leaves
from 5 plants/ accession (A and B samples) every two hours at BBCH 51 (inflorescence emergence
stage) [22]. Sampling was performed 24 days after sowing for CHEN-109 and 46 days after sowing
for Titicaca. A young leaf sample between 1.0 and 2.0 cm2 was obtained, placed in a 2 ml
Eppendorf tube and immersed into liquid nitrogen. Samples were kept at -70 °C until RNA
extraction.
2.2 RNA isolation and cDNA synthesis
Total RNA was extracted from three biological replicates of each accession for the Zeitgeber points
ZT-0, ZT-4, ZT-8, ZT-12, ZT-16, ZT-20 and ZT-24 using the NucleoSpin RNA Plant kit
(Macherey-Nagel, Düren, Germany). We performed a DNase I treatment (Thermo Fisher Scientific
Inc., Waltham, United States) for 30 min at 37 °C on the isolated RNA to eliminate DNA
contamination. To verify that DNA was removed, we carried out a standard PCR (annealing
temperature: 58 °C; 40 cycles) for the DNase treated RNA with specific primers designed in
intronic regions of BOLTING TIME CONTROL 1 (BTC1) (Gene ID: AUR62041615; Fw:
4
69
70
71
72
73
74
75
76
77
78
79
80
81
82
83
84
85
86
87
88
89
90
91
.CC-BY 4.0 International license(which was not certified by peer review) is the author/funder. It is made available under aThe copyright holder for this preprintthis version posted May 14, 2020. . https://doi.org/10.1101/2020.05.14.095786doi: bioRxiv preprint
GGAAGAAATCAAGGGTATTGACTCTAGAG, Rv:
GAACCATATACAAGCCTTTCTGAGAG). We controlled the RNA integrity through agarose gel
electrophoresis (1.5 %) and RNA concentration and purity were measured with a NanoDrop 2000
Spectrophotometer (Thermo Fisher Scientific Inc., Waltham, United States). An A260/A280 ratio
between 2.0 and 2.2 and an A260/A230 ratio higher than 1.7 indicated appropriate RNA quality.
Exemplary RNA agarose gels and the A260/A280 and A260/A230 ratios for the Titicaca accession are
presented in S1 Fig and S1 Table, respectively. We used the DNase-treated RNA to perform the
reverse transcription with the First Strand cDNA Synthesis Kit (Thermo Fisher Scientific Inc.,
Waltham, United States), according to the manufacturer’s instructions. We used the RNA
concentration obtained during the NanoDrop analysis to calculate the required volume of every
sample to load a final amount of 1 ug of RNA to the reverse transcription process. Later, we used
the products of the reverse transcription to perform a standard PCR (annealing temperature: 56 °C;
36 cycles; RAN-3 primers in Table 1) followed by agarose gel electrophoresis (2.0%) to verify the
success of the cDNA synthesis (S1 Fig). The synthesized cDNA was stored at -20 °C for further
use.
2.3 Selection of candidate reference genes
We made a literature survey to select potential candidate reference genes. The most commonly used
reference genes, preferably the ones that have been previously reported to be efficient in species of
the Amaranthacea family, were selected [16, 23, 24]. Afterwards, we validated this list of genes
based on the available C. quinoa transcriptome data [17] by selecting those genes, which were
stably expressed at least in two out of four stress conditions (low phosphate, salt, drought and heat)
for soil- and hydroponic-grown plants within root and shoot tissues (one-way ANOVA and Tukey’s
Multiple Comparison Test; α=0.05) (S2 Table S1 Table).
5
92
93
94
95
96
97
98
99
100
101
102
103
104
105
106
107
108
109
110
111
112
113
114
.CC-BY 4.0 International license(which was not certified by peer review) is the author/funder. It is made available under aThe copyright holder for this preprintthis version posted May 14, 2020. . https://doi.org/10.1101/2020.05.14.095786doi: bioRxiv preprint
We designed paralog-specific primer pairs for amplification of the candidate reference genes except
for GAPDH, whose primers were designed in a paralog-conserved region. We assessed the primer
quality with the OligoCalc program (http://biotools.nubic.northwestern.edu/OligoCalc.html). We
considered the next primer quality parameters: length (18-26 bp), similar melting temperature (50-
60 °C), amplicon length (100 -160 bp), GC content (>40 %) and lack of self-annealing and primer-
dimmer formation. To design the GAPDH primers, a Multiple Sequence Alignment of GAPDH
paralogs with CLC Main Workbench (QIAGEN Aarhus, Denmark) was performed with the
following parameters; gap open cost: 10, gap extension cost: 1, end gap cost: as any other and very
accurate alignment. We verified the specificity of the primers by standard PCR using DNA from the
Danish accession Titicaca followed by agarose gel electrophoresis. Moreover, we sent the products
of locus-specific primers for Sanger sequencing to the Institute for Clinical Molecular Biology
(IKMB, Kiel University) and the sequencing results were analyzed with CLC Main Workbench. A
further verification of the primer combinations specificity was made by examination of the RT-
qPCR melting curves using the Bio-Rad CFX Manager 3.1 software (Bio-Rad Laboratories GmbH,
Munich, Germany).
2.4 Quantitative real-time PCR (RT-qPCR) and determination of amplification
efficiency
We performed RT-qPCR with a Bio-Rad CFX96 Real-Time System, which has a built-in Bio-Rad
C1000 Thermal Cycler (Bio-Rad Laboratories GmbH, Munich, Germany) using Platinum SYBR
Green qPCR SuperMix-UDG with ROX (Invitrogen by Life Technologies GmbH, Darmstadt,
Germany). Every PCR reaction had a total volume of 20 µl:10 µl of Platinum SYBR Green qPCR
SuperMix-UDG, 1 µl of each forward and reverse primer (10 µg), 2 µl of diluted cDNA (1:20
dilution) and 6 µl of ddH2O. The amplification conditions were as follows: 95 °C for 3 min as initial
denaturation and 40 cycles of: 10 s at 95 °C, 20 s at primer pair annealing temperature and 30 s at
6
115
116
117
118
119
120
121
122
123
124
125
126
127
128
129
130
131
132
133
134
135
136
137
138
.CC-BY 4.0 International license(which was not certified by peer review) is the author/funder. It is made available under aThe copyright holder for this preprintthis version posted May 14, 2020. . https://doi.org/10.1101/2020.05.14.095786doi: bioRxiv preprint

72 °C. Recording of melting curves was performed from 60 °C to 95 °C every 0.5 °C to confirm
primer specificity and lack of primer dimmers. Three technical replicates per sample and per
negative control (water) were also loaded. We amplified cDNA dilution series (dilution factors 1:40
(twice), 1:20, 1:10 and 3:20) to generate standard curves for estimation of the correlation coefficient
(R2) and the amplification efficiency E=(10¿¿−1slope
−1)×100¿. The correlation coefficient (R2) is
given for the regression line of the log of the starting quantity (dilution determined; x axis) and the
corresponding Cq value (y axis). The standard curves for the reference gene and the target gene
BBX19 can be found in S2 Fig. Cq values were obtained by setting the baseline threshold to 100.
2.5 Gene stability analysis
We assessed the expression stability of the candidate genes by three algorithms: geNorm [7],
NormFinder [8] and BestKeeper [9]. The data used for these analyses were the averaged Cq value
of the three biological replicates (three technical replicates each) obtained for seven different
Zeitgeber points. For the determination of the stability by geNorm and NormFinder, transformation
of the raw Cq values into relative quantities (RQ) was performed as follows:
RQ=E−∆Cq
where, E represents the PCR efficiency and ΔCq for any given gene is the Cq value of each sample
subtracted from the lowest Cq value among all the samples for that gene. In contrast, for the
utilization of BestKeeper, the raw non-transformed Cq data were used, as required by the algorithm.
The geNorm algorithm calculates an average expression stability, M-value, which is defined as the
average pairwise variation in a particular gene with all other potential reference genes. This
software was also used to calculate the minimum number of genes required for normalization,
which is given by the pairwise variation as follows:
7
139
140
141
142
143
144
145
146
147
148
149
150
151
152
153
154
155
156
157
158
159
160
.CC-BY 4.0 International license(which was not certified by peer review) is the author/funder. It is made available under aThe copyright holder for this preprintthis version posted May 14, 2020. . https://doi.org/10.1101/2020.05.14.095786doi: bioRxiv preprint

V n/V n+1
where, Vn is the pair-wise variation of a given number of reference genes and Vn+1 is the pair-wise
variation produced when an extra reference gene is added to the analysis. Below the default cut-off
value of 0.15, all gene pairs were considered stable and the addition of an extra gene for
normalization was not required [7]. NormFinder identifies stably expressed genes based on a
mathematical model that enables the estimation of the intra and inter-group variation of the sample
set as a stability value (SV) [8]. In order to obtain the best combination of reference genes together
with its stability value and the intra and intergroup variations, we added group identifiers to
distinguish the expression data of CHEN-109 and Titicaca. In the case of BestKeeper, it helps in
selection of the best reference genes after the calculation of the standard deviation (SD) and a
coefficient of variance (CV) [9]. Following the algorithms protocols, we considered candidate
reference genes with the lowest M, SV and CV values as the most stably expressed genes.
2.6 Validation of the reference genes
To validate the reliability of the top ranked reference genes and to clarify the ambiguous results
given by the algorithms, we normalized the expression data of the diurnally regulated CqBBX19
gene [20] against each of the candidate genes. Additionally, we simulated the expected expression
patterns of the target gene. In the simulation, the Cq values of CqBBX19 for CHEN-109 and
Titicaca were normalized against a constant Cq value of 20, which represents an ideal reference
gene. Then, a comparison between the simulation and the obtained expression profiles of the target
gene was performed. A reference gene was not considered as suitable, when its normalization
results differed from the simulation. Number and position of peaks and the change of the expression
values between accessions (e.g., when an accession has a higher expression value compared to the
other in the simulation, the same feature should be depicted during the actual normalization) were
examined. To detect the differences between the obtained expression profiles and the simulation,
8
161
162
163
164
165
166
167
168
169
170
171
172
173
174
175
176
177
178
179
180
181
182
183
184
.CC-BY 4.0 International license(which was not certified by peer review) is the author/funder. It is made available under aThe copyright holder for this preprintthis version posted May 14, 2020. . https://doi.org/10.1101/2020.05.14.095786doi: bioRxiv preprint

we performed t-tests (α=0.05) at every Zeitgeber point between the accessions and one-way
ANOVA (α=0.05) for the number and position of peaks.
Expression levels for both accessions were determined by2−∆∆Cq method [25]. We designed the
primer combination for CqBBX19 (Table 1) according to the criteria mentioned above and its
specificity was assessed in the same way as the previously described for the reference genes primer
pairs.
3 Results
3.1 Selection of candidate genes
First, we performed a selection of candidate genes based on a literature survey. We preferentially
selected reference genes that have been validated in species of the Amaranthacea family [16, 23,
24]. Afterwards, we validated these genes with C. quinoa transcriptome data, where plants had been
grown under abiotic stress conditions [17]. We selected eight candidate reference genes (Table 1),
which were stably expressed in root and shoot tissues in at least two out of four stress conditions
(S2 Table S1 Table).
9
185
186
187
188
189
190
191
192
193
194
195
196
197
198
.CC-BY 4.0 International license(which was not certified by peer review) is the author/funder. It is made available under aThe copyright holder for this preprintthis version posted May 14, 2020. . https://doi.org/10.1101/2020.05.14.095786doi: bioRxiv preprint
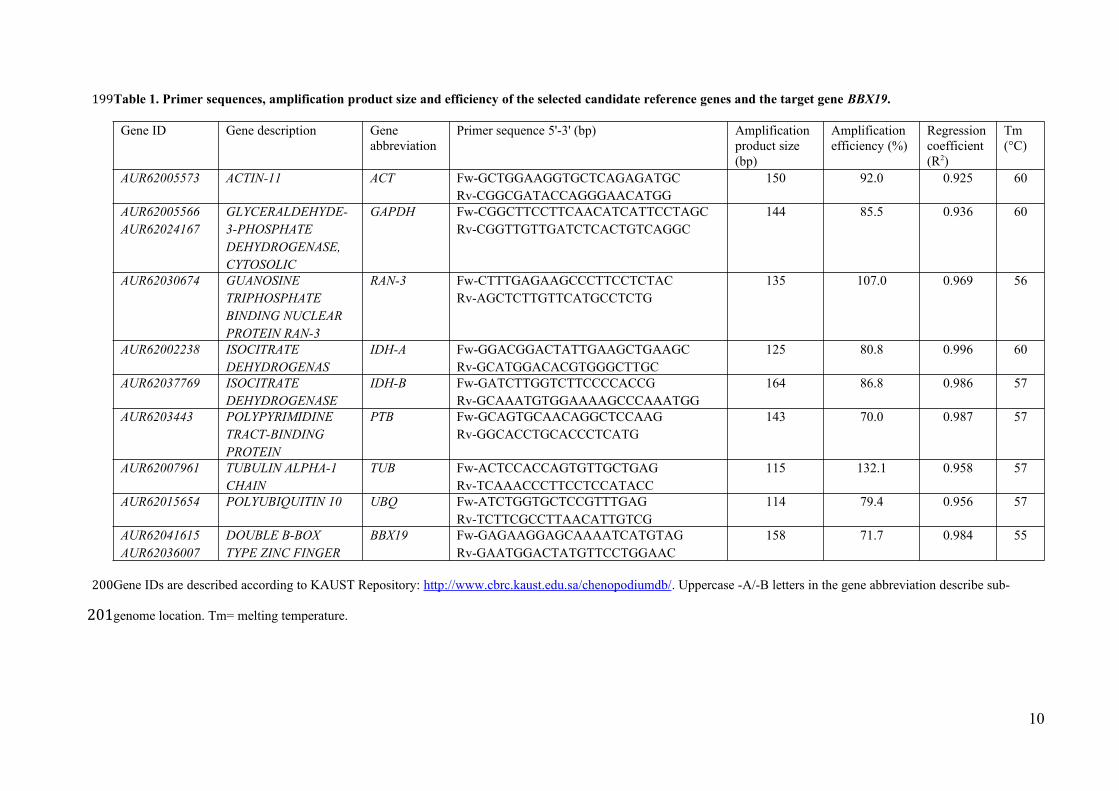
Table 1. Primer sequences, amplification product size and efficiency of the selected candidate reference genes and the target gene BBX19.
Gene ID Gene description Gene abbreviation
Primer sequence 5'-3' (bp) Amplification product size (bp)
Amplification efficiency (%)
Regressioncoefficient (R2)
Tm (°C)
AUR62005573 ACTIN-11 ACT Fw-GCTGGAAGGTGCTCAGAGATGCRv-CGGCGATACCAGGGAACATGG
150 92.0 0.925 60
AUR62005566AUR62024167
GLYCERALDEHYDE-3-PHOSPHATE DEHYDROGENASE, CYTOSOLIC
GAPDH Fw-CGGCTTCCTTCAACATCATTCCTAGCRv-CGGTTGTTGATCTCACTGTCAGGC
144 85.5 0.936 60
AUR62030674 GUANOSINE TRIPHOSPHATEBINDING NUCLEAR PROTEIN RAN-3
RAN-3 Fw-CTTTGAGAAGCCCTTCCTCTACRv-AGCTCTTGTTCATGCCTCTG
135 107.0 0.969 56
AUR62002238 ISOCITRATE DEHYDROGENAS
IDH-A Fw-GGACGGACTATTGAAGCTGAAGCRv-GCATGGACACGTGGGCTTGC
125 80.8 0.996 60
AUR62037769 ISOCITRATE DEHYDROGENASE
IDH-B Fw-GATCTTGGTCTTCCCCACCGRv-GCAAATGTGGAAAAGCCCAAATGG
164 86.8 0.986 57
AUR6203443 POLYPYRIMIDINE TRACT-BINDING PROTEIN
PTB Fw-GCAGTGCAACAGGCTCCAAGRv-GGCACCTGCACCCTCATG
143 70.0 0.987 57
AUR62007961 TUBULIN ALPHA-1 CHAIN
TUB Fw-ACTCCACCAGTGTTGCTGAGRv-TCAAACCCTTCCTCCATACC
115 132.1 0.958 57
AUR62015654 POLYUBIQUITIN 10 UBQ Fw-ATCTGGTGCTCCGTTTGAGRv-TCTTCGCCTTAACATTGTCG
114 79.4 0.956 57
AUR62041615AUR62036007
DOUBLE B-BOX TYPE ZINC FINGER
BBX19 Fw-GAGAAGGAGCAAAATCATGTAGRv-GAATGGACTATGTTCCTGGAAC
158 71.7 0.984 55
Gene IDs are described according to KAUST Repository: http://www.cbrc.kaust.edu.sa/chenopodiumdb/. Uppercase -A/-B letters in the gene abbreviation describe sub-
genome location. Tm= melting temperature.
10
199
200
201
.CC-BY 4.0 International license(which was not certified by peer review) is the author/funder. It is made available under aThe copyright holder for this preprintthis version posted May 14, 2020. . https://doi.org/10.1101/2020.05.14.095786doi: bioRxiv preprint

Then, we designed primer combinations and assessed their specificity by standard PCR, Sanger
sequencing and melting curve analysis. Out of 23 primer combinations, 16 primer pairs were
selected. The specificity of the primer combinations was demonstrated by the presence of a single
reaction product of the expected size (S3 Fig), the presence of a single peak in the RT-qPCR melting
curve (S4 Fig), and aligning the sequenced products to the reference sequence showing one peak per
nucleotide (S5 FigError: Reference source not found). Amplification efficiencies of the primer
combinations varied between 77.3 and 119.0 % with regression coefficients (R2) varying from 0.911
to 0.999 (Table 1).
3.2 Diurnal expression profiles of candidate genes
In a next step, we determined the expression profiles of the candidate genes by RT-qPCR and the
raw Cq values were used to quantify the expression levels. We choose two accessions from Peru
(CHEN-109) and Denmark (Titicaca), because of their different photoperiod sensitivity, which
might be related to its geographical origin [26]. We extracted RNA from samples taken during one
day at seven different time points for each accession. The expression range across all samples of the
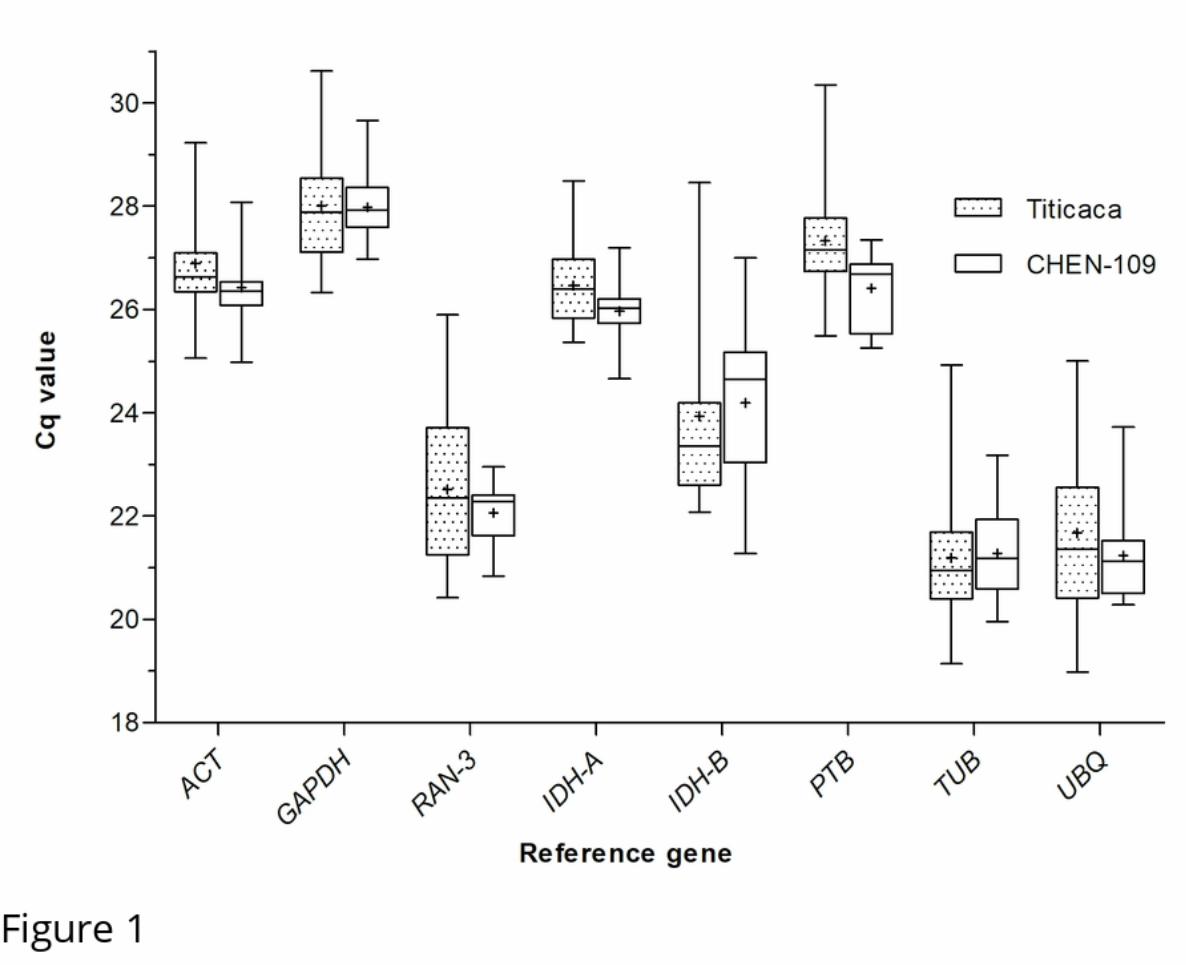
eight candidate genes was of 21.23≤Cq≤ 27.98 for CHEN-109 and of 21.19≤ Cq≤ 28.01 for Titicaca
(Fig 1). Unexpectedly, the expression profiles of some of the candidate genes across the samples
showed clear diurnal patterns for both accessions (Fig 2), implying a low transcript stability over the
day. For instance, in Titicaca IDH-B, GAPDH and ACT depicted a peak in their expression pattern at
ZT-20 (one-way ANOVA; α=0.05). Contrarily, in CHEN-109 the transcriptional activities of these
genes peaked at different time points (IDH-B at ZT-8) or displayed no diurnal regulation (e.g.
GAPDH) (one-way ANOVA; α=0.05).
Fig 1. Variation in Cq values of the candidate genes.
11
202
203
204
205
206
207
208
209
210
211
212
213
214
215
216
217
218
219
220
221
222
223
.CC-BY 4.0 International license(which was not certified by peer review) is the author/funder. It is made available under aThe copyright holder for this preprintthis version posted May 14, 2020. . https://doi.org/10.1101/2020.05.14.095786doi: bioRxiv preprint
12
Cq values were calculated as means of triplicate technical replicates across the 21 diurnal/circadian samples. The median
values are represented as lines across the box. The lower and the upper boundaries of each box represent the 25th and
75th percentile, respectively. Whiskers represent the maximum and minimum values. The mean is represented by crosses
inside the boxes.
Fig 2. Expression profiles of candidate genes.
Cq values from 21 samples (three technical replicates of three biological replicates) taken at seven different points of the
day for (A,C) Titicaca and (B,D) CHEN-109. Two groups of genes are represented: (A,B) high Cq value and (C,D) low
Cq value. The bar at the top indicates light (empty box) and dark (filled box) phases. The error bars represent the SEM
between biological replicates.
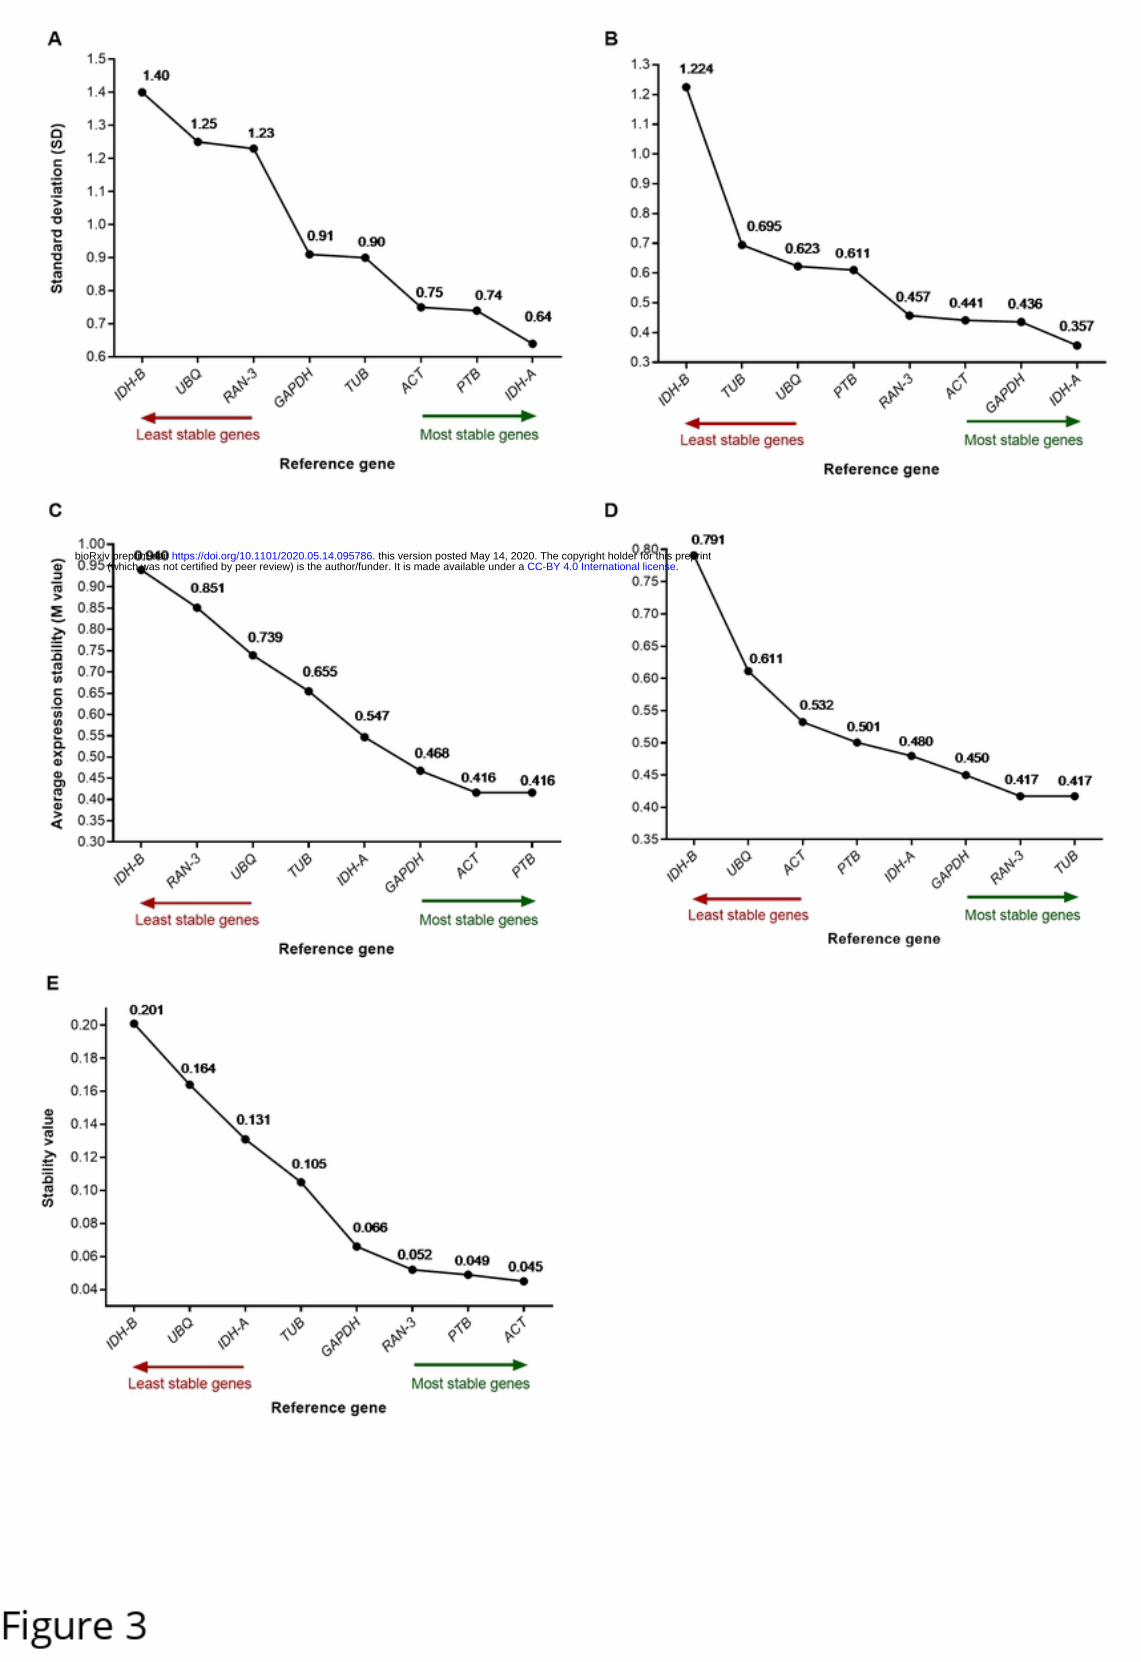
3.3 Expression stability of the candidate genes in two quinoa accessions
We assessed the stability of the candidate genes by three algorithms: geNorm [7], NormFinder [8]
and BestKeeper [9]. geNorm and BestKeeper placed PTB and IDH-A as the most stable genes for
normalization of Titicaca expression data. On the other hand, the same algorithms placed TUB and
IDH-A as the most stable genes for normalization of CHEN-109 expression data (Fig 3). NormFinder
determined the most suitable reference gene for the two sets of expression data, simultaneously
(Titicaca and CHEN-109), ranking ACT as the most suitable single gene and IDH-A together with
TUB as the best combination of genes (stability value 0.035) (Fig 3 and S6 Fig). Additionally, we
performed a pairwise variation analysis (cut-off value of 0.15) of the candidate genes for
determination of the appropriate number of reference genes by geNorm. The appropriate number of
genes required for normalization in this study was two (Fig 4).
224
225
226
227
228
229
230
231
232
233
234
235
236
237
238
239
240
241
242
243
.CC-BY 4.0 International license(which was not certified by peer review) is the author/funder. It is made available under aThe copyright holder for this preprintthis version posted May 14, 2020. . https://doi.org/10.1101/2020.05.14.095786doi: bioRxiv preprint
13
Fig 3. Expression stability ranking of the candidate genes.
Rankings were calculated by (A,B) BestKeeper, (C,D) geNorm and (E) NormFinder for two C. quinoa accessions: (A,C)
Titicaca and (B,D) CHEN-109. Stability values, SD and M values are shown for every gene. The most stable genes are
shown on the right side (green arrow) and the least stable genes on the left (red arrow).
Fig 4. Pairwise variation analysis of the candidate genes.
The analysis was performed by geNorm for determination of the appropriate number of reference genes. Below 0.15
(default cut-off value) all gene pairs were considered stable and the addition of a third gene for normalization is not
required. Vn is the pair-wise variation of a given number of reference genes and Vn+1 is the pair-wise variation produced
when an extra reference gene is added to the analysis.
3.4 Validation of selected reference genes for normalization of diurnal expression data
We performed a further validation of the candidate genes due to their diurnal expression patterns (Fig
2) and their dissimilarity in the rankings obtained from the algorithms (Fig 3). We used the diurnally
regulated gene CqBBX19 that shares sequence homology with BvBBX19, a major flowering time
regulator of sugar beet (Beta vulgaris L.) [20]. Because both species belong to the same plant family,
it is tempting to speculate that CqBBX19 has a similar function in quinoa. We normalized the
expression data of the diurnally regulated gene CqBBX19 against each of the candidate reference
genes. Furthermore, we carried out the normalization of CqBBX19 with a constant Cq value of 20, to
identify the expected expression patterns (simulation). As an outcome, normalizing CqBBX19
expression data against GAPDH, IDH-B, UBQ, TUB, ACT and RAN-3 resulted in expression patterns
that clearly differed from the simulation in number, shape and position of the expression peaks (Fig
5). For instance, expression patterns obtained for CHEN-109 by normalization against UBQ and ACT
depicted a peak at ZT-4, which is absent in the simulated expression pattern (one-way ANOVA;
α=0.05). A different effect of inaccurate normalization was seen for the pattern obtained with RAN-3,
which disregards peaks observed during the simulation (e.g. ZT-8 of Titicaca) (one-way ANOVA;
α=0.05). A critical assessment of the results showed that the normalization of the expression data
244
245
246
247
248
249
250
251
252
253
254
255
256
257
258
259
260
261
262
263
264
265
266
267
268
.CC-BY 4.0 International license(which was not certified by peer review) is the author/funder. It is made available under aThe copyright holder for this preprintthis version posted May 14, 2020. . https://doi.org/10.1101/2020.05.14.095786doi: bioRxiv preprint

14
against GAPDH alters the significant differences in the expression levels between accessions (at ZT-
4 and ZT-20; two-tailed t-test, α=0.05). On the other hand, the combination of the two best genes for
normalization in Titicaca determined by BestKeeper (IDH-A + PTB) exhibited analogous diurnal
expression patterns to the simulation. In conclusion, the geometric mean of IDH-A and PTB turned
out to be the best reference to normalize diurnal expression data in C. quinoa.
Fig 5. Simulation-based selection of putative reference genes.
Relative CqBBX19 expression normalized against each candidate gene, the combination of the two best genes for
normalization of Titicaca determined by BestKeeper (IDH-A + PTB) and a constant Cq value of 20 (Simulation) are
shown. The bar at the top indicates light (empty box) and dark (filled box) phases. Error bars represent the SEM of three
biological replicates.
Our results show that using different reference genes for normalization, including those top ranked by
stability, causes significant differences among the diurnal expression patterns of CqBBX19 for two
different C. quinoa accessions under short day conditions. We were able to find a suitable reference
for the normalization of our diurnal expression data through a novel approach, which avoids selection
of reference genes that produce false transcriptional profiles.
4 Discussion
RT-qPCR is a powerful tool to study gene expression, which allows the measurement of small
amounts of nucleic acids in a wide range of samples from numerous sources. Nevertheless, the
accuracy of RT-qPCR results strongly depends on accurate transcript normalization, which is very
frequently overlooked during the data assessment. Moreover, misled interpretations guided by
inaccurate results have been reported by using a single reference with no evidence that it is stably
expressed across all conditions [6]. Furthermore, finding a gene that is stably expressed through a 24
h cycle represents a challenge, because transcript abundance of thousands of genes interplay during
the day and conventionally used reference genes may show cyclic expression patterns [16]. In this
269
270
271
272
273
274
275
276
277
278
279
280
281
282
283
284
285
286
287
288
289
290
291
292
.CC-BY 4.0 International license(which was not certified by peer review) is the author/funder. It is made available under aThe copyright holder for this preprintthis version posted May 14, 2020. . https://doi.org/10.1101/2020.05.14.095786doi: bioRxiv preprint
15
study, we aimed to select suitable reference genes for diurnal expression studies to normalize
expression data from two different quinoa accessions. We selected eight candidate reference genes
(ACT, GAPDH, RAN-3, IDH-A, IDH-B, PTB, UBQ, TUB) based on C. quinoa transcriptome data
[17] and literature survey [16, 23, 24] and tested them for stability during the course of a day.
Through an approach based on the comparison between the expected expression pattern of the
target gene and the expression patterns obtained by normalization against the candidates, we
determined that a combination of IDH-A and PTB was the most suitable reference to normalize our
diurnal expression data. To date, this is the first report of a systematic analysis of reference genes
for normalization of gene expression data in diurnal studies in C. quinoa.
Housekeeping genes are typically used as reference genes because their transcript levels are assumed
stable during the execution of basic cellular functions. Nevertheless, the circadian regulatory
pathways involve complex and intricate processes [14, 27], in which a housekeeping gene can
undergo circadian regulation during the execution of its housekeeping function or the execution of a
different function coupled to a circadian pathway (e.g. light induced GAPDH response in corn
seedlings [28] and TUB carbon-induced diurnal response in Arabidopsis rosettes [29]. Furthermore,
the complexity of the circadian pathways is reflected in the total number of diurnally expressed genes
in plants, which varies widely from species to species. For instance, the percentage of rhythmic genes
in transcriptome datasets of Arabidopsis rosettes and rice seedlings is 37.1 % (14,019) and 33.2 %
(24,957), respectively [30]. In addition, the number of diurnally expressed genes highly depends on
the tissue and developmental stage [30, 31]. Therefore, it is expected that conventionally used
reference genes depict cyclic regulation, as it has been already illustrated for rice plants subjected to
circadian cycles of different temperature and day length conditions [16]. Additionally, the observed
differences in the expression profiles between Titicaca and CHEN-109 may be due to the origin-
related photoperiod sensitivity of the accessions [26]. Similar intra-species variations, where a gene
293
294
295
296
297
298
299
300
301
302
303
304
305
306
307
308
309
310
311
312
313
314
315
316
.CC-BY 4.0 International license(which was not certified by peer review) is the author/funder. It is made available under aThe copyright holder for this preprintthis version posted May 14, 2020. . https://doi.org/10.1101/2020.05.14.095786doi: bioRxiv preprint
16
which is stable in one experiment is unstable in another one, has been observed in peach [3], rice [13]
and petunia [32]. Ultimately, the described differences between accessions together with the
observed diurnal pattern of the expression profiles enhance the need for a rigorous expression
stability analysis. Moreover, when the validation of the reference genes is well performed, the use of
suitable reference genes reduces experimentally induced or inherent technical variations [6].
From the analysis of the stability of the candidate reference genes, we obtained contrasting results
using geNorm, NormFinder and BestKeeper. The variations we observed in the rankings across all
the algorithms are explicable as they use different statistical approaches. Ranking the reference genes
by pairwise comparison approaches (geNorm and BestKeeper) is problematic, since some genes may
have similar but not constant expression profiles and will be ranked as the most stable reference
genes irrespective of their expression stability [8]. The model-based algorithm NormFinder
intuitively adds two sources of variation (intra and intergroup). When two different groups depict
different expression profiles for the same candidate, the intergroup variation may mask the intragroup
variation. Consequently, a suitable reference gene could be poorly ranked despite of presenting a low
variation within groups. In this study, for instance, the expression profile of IDH-A was different for
CHEN-109 and Titicaca and occupied the position six in the ranking despite of its low variation
within accessions. Several studies have identified negligible to major differences in the stability
rankings of the same gene. RefFinder and RankAgreeg are commonly used tools to configure a
standard ranking for reference genes [3, 5, 11]. Here, we introduced a novel and straightforward
method to find suitable reference genes for normalization of diurnal expression data. The approach is
based on the normalization of the target gene expression data against a constant Cq value of 20,
which simulates the “ideal” reference gene with constant expression levels unaffected by
experimental factors [21]. A comparison between the simulated results and the normalized
expressions against the different candidate reference genes was performed only after the assessment
317
318
319
320
321
322
323
324
325
326
327
328
329
330
331
332
333
334
335
336
337
338
339
340
.CC-BY 4.0 International license(which was not certified by peer review) is the author/funder. It is made available under aThe copyright holder for this preprintthis version posted May 14, 2020. . https://doi.org/10.1101/2020.05.14.095786doi: bioRxiv preprint
17
of the expected target gene expression. The simulation is particularly useful to disregard inefficient
reference genes, whose resulting target gene expression patterns differed significantly from the
simulated pattern. This meticulous approach overcomes failures related to stability-based selection of
reference genes.
The results from geNorm pairwise variation showed that two reference genes are sufficient for
accurate normalization of our diurnal expression data. The diurnal expression patterns of our target
gene CqBBX19 normalized against CqIDH-A and CqPTB did not differ from the simulation pattern.
Therefore, CqIDH-A and CqPTB were suitable as reference genes and their geometric mean was
appropriate to normalize the diurnal expression of CqBBX19 [20]. IDH encodes for the isocitrate
dehydrogenase enzyme, whereas the PTB gene product is the Polypyrimidine Tract Binding protein
involved in pre-mRNA processing. An IDH ortholog in B. vulgaris, another member of the
Amaranthaceae family, was validated as suitable reference gene in the expression analyses of two
paralogs of the FLOWERING LOCUS T (FT) [24] and PBT was used as a reference gene in C.
quinoa to normalize the expression of saponin biosynthesis genes after methyl jasmonate treatment
[23]. In beet, BBX19 acts together with BOLTING TIME CONTROL 1 (BTC1) in the circadian
regulation of the flowering pathway [33] and shows diurnal regulation with an expression peak at
dawn [20] . Considering the close phylogenetic relationship between B. vulgaris and C. quinoa,
CqBBX19 might similarly regulate the flowering time in quinoa through photoperiod pathway. Thus,
the difference in the expression patterns of CqBBX19 between the accessions might be due to
difference in their response to photoperiod.
In the current study, commonly used reference genes were considered unstable because they resulted
in contrasting diurnal expression patterns of the target genes, which differed from the simulated
pattern. Moreover, reference genes selected based on quinoa transcriptome data18 showed unstable
expression pattern in our dataset, which emphasizes the fact that they should be further validated for
341
342
343
344
345
346
347
348
349
350
351
352
353
354
355
356
357
358
359
360
361
362
363
364
.CC-BY 4.0 International license(which was not certified by peer review) is the author/funder. It is made available under aThe copyright holder for this preprintthis version posted May 14, 2020. . https://doi.org/10.1101/2020.05.14.095786doi: bioRxiv preprint
18
different environmental conditions. GAPDH, ACT, UBQ, RAN-3 and TUB have been already shown
to be unsuitable as reference genes under certain experimental conditions [2, 4, 16]. The lack of
stability of some of the widely used reference genes could not be detected by the algorithms in
diurnal studies in rice [16]. Moreover, the use of some of these genes could misrepresent a non-
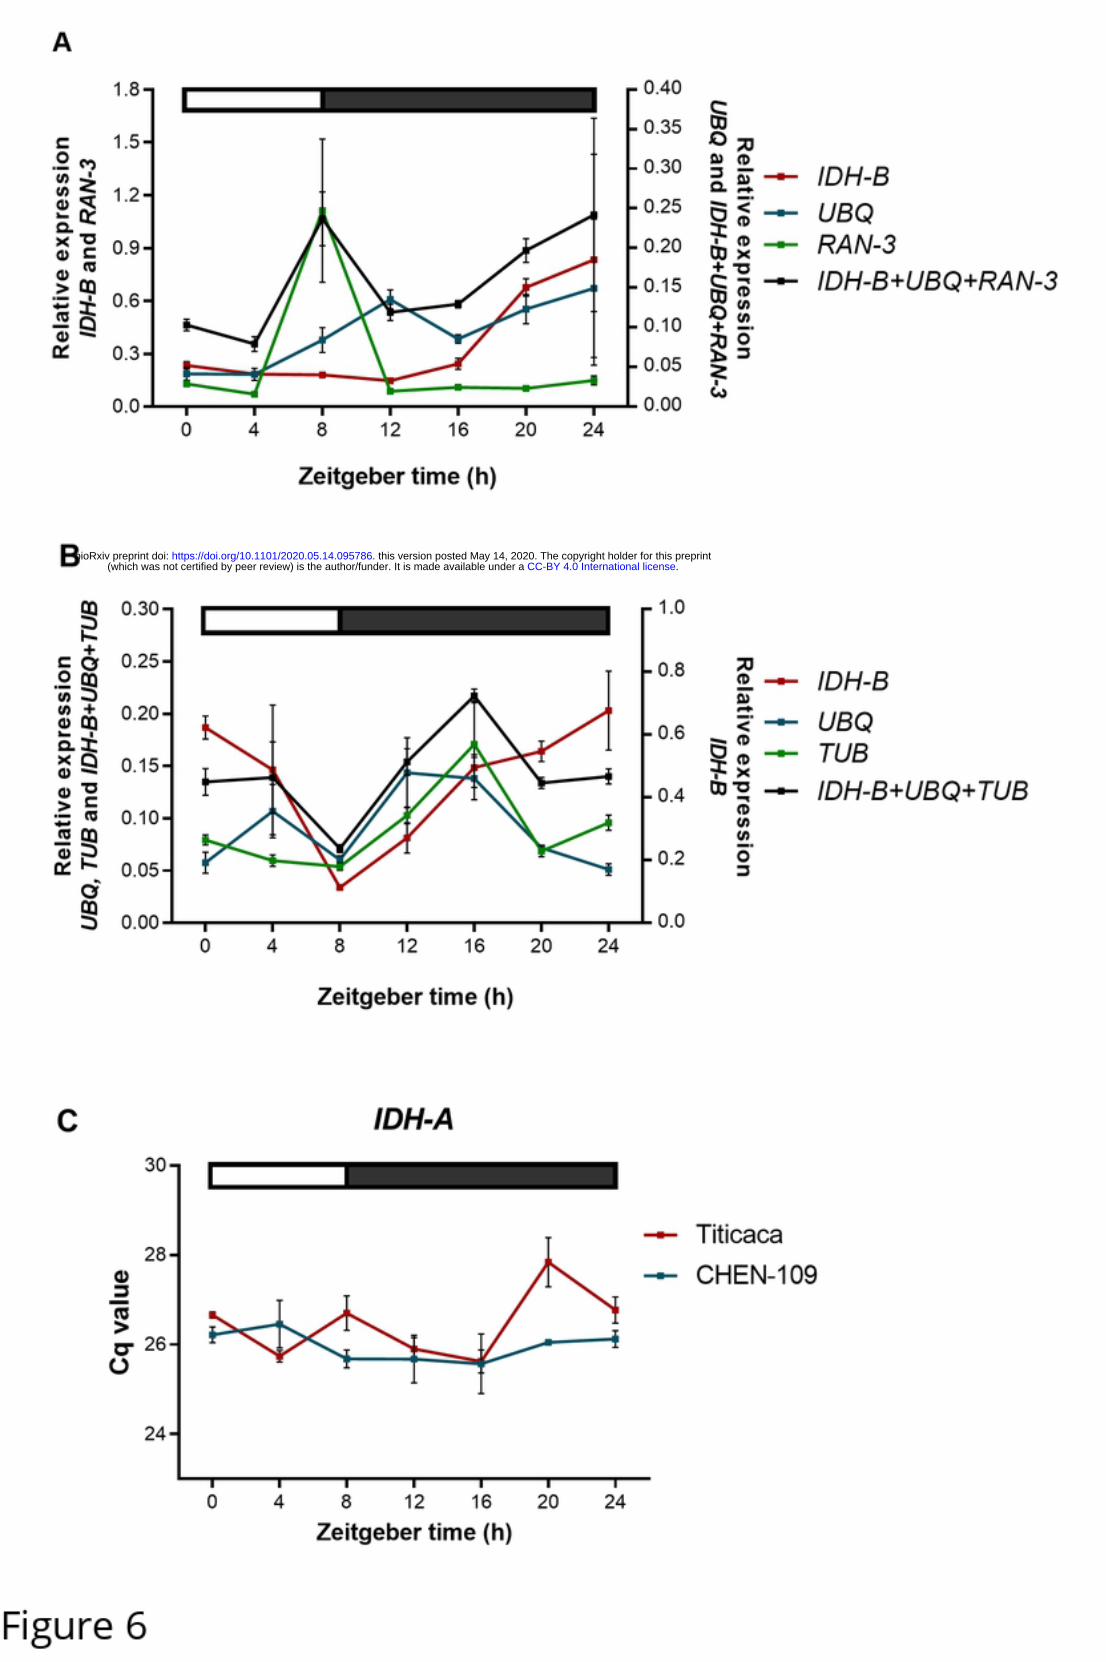
diurnal gene as diurnally regulated. To illustrate this, the three least stable reference genes
(BestKeeper) and their geometric mean were used to normalize IDH-A expression data (now treated
as target gene) (Fig 6). As a result, the stably expressed IDH-A (Fig 6C) acquired a diurnal fashion
(Fig 6A and Fig 6B), showing that the use of unsuitable reference genes greatly distorts the resulting
expression patterns.
Fig 6. Illustration of a non-diurnal gene misrepresented as diurnally regulated.
Relative IDH-A expression normalized with each of the three least stable reference genes according to BestKeeper and
their geometric mean for (A) Titicaca and (B) CHEN-109. Error bars represent the SEM between biological replicates.
(C) Expression profile of IDH-A (best reference gene according to BestKeeper), which did not show cyclic expression;
error bars represent standard error between biological replicates. The bar at the top indicates light (empty box) and dark
(filled box) phases.
As the conclusion of this study, we were able to find a suitable reference gene combination, CqIDH-
A and CqPTB, for the normalization of our diurnal expression data. Here we used a novel approach,
which is straightforward, meticulous and overcomes failures related to stability-based selection of
reference genes. Our results also showed that using different reference genes for normalization,
including those top ranked by stability, causes significant differences among the diurnal expression
patterns of CqBBX19 for two different accessions of C. quinoa under short day conditions. This
reinforces the fact that a more meticulous validation of reference genes is required for diurnal
studies. Thus, we recommend the use of the presented comparison-based approach along with the use
of the algorithms. In the future, the stable reference genes obtained in this study will significantly
365
366
367
368
369
370
371
372
373
374
375
376
377
378
379
380
381
382
383
384
385
386
387
388
.CC-BY 4.0 International license(which was not certified by peer review) is the author/funder. It is made available under aThe copyright holder for this preprintthis version posted May 14, 2020. . https://doi.org/10.1101/2020.05.14.095786doi: bioRxiv preprint

19
facilitate diurnal expression studies in quinoa by improving the accuracy of RT-qPCR data
normalization.
5 Acknowledgments
We thank Monika Bruisch for her support for conducting and sampling the climate chamber
experiment. Sequence analyses were carried out by the Institute for Clinical Molecular Biology
(IKMB, Kiel University). We thank Prof. Mark Tester (King Abdullah University of Science and
Technology) for providing the seeds used in our experiment.
6 References
1. Amorim LLB, Ferreira-Neto JRC, Bezerra-Neto JP, Pandolfi V, de Araújo FT, da Silva
Matos MK, et al. Cowpea and abiotic stresses: identification of reference genes for transcriptional
profiling by qPCR. Plant Methods. 2018;14(1):88. doi: 10.1186/s13007-018-0354-z.
2. Chen H, Hu B, Zhao L, Shi D, She Z, Huang X, et al. Differential Expression Analysis of
Reference Genes in Pineapple (Ananas comosus L.) during Reproductive Development and Response
to Abiotic Stress, Hormonal Stimuli. Tropical Plant Biol. 2019:1-11. doi: 10.1007/s12042-019-
09218-2.
3. Klumb EK, Rickes LN, Braga EJB, Bianchi VJ. Evaluation of stability and validation of
reference genes for real time PCR expression studies in leaves and roots of Prunus spp. rootstocks
under flooding. Sci Hort. 2019;247:310-9. doi: 10.1016/j.scienta.2018.12.036.
4. Knopkiewicz M, Wojtaszek P. Validation of reference genes for gene expression analysis
using quantitative polymerase chain reaction in pea lines (Pisum sativum) with different lodging
susceptibility. Ann Appl Biol. 2019;174(1):86-91. doi: doi:10.1111/aab.12475.
389
390
391
392
393
394
395
396
397
398
399
400
401
402
403
404
405
406
407
408
409
.CC-BY 4.0 International license(which was not certified by peer review) is the author/funder. It is made available under aThe copyright holder for this preprintthis version posted May 14, 2020. . https://doi.org/10.1101/2020.05.14.095786doi: bioRxiv preprint
20
5. Yan H, Zhang Y, Xiong Y, Chen Q, Liang H, Niu M, et al. Selection and Validation of Novel
RT-qPCR Reference Genes under Hormonal Stimuli and in Different Tissues of Santalum album. Sci
Rep,. 2018;8(1):17511. doi: 10.1038/s41598-018-35883-6.
6. Bustin S, Nolan T. Talking the talk, but not walking the walk: RT qPCR as a paradigm for ‐
the lack of reproducibility in molecular research. Eur J Clin Invest. 2017;47(10):756-74. doi:
10.1111/eci.12801.
7. Vandesompele J, De Preter K, Pattyn F, Poppe B, Van Roy N, De Paepe A, et al. Accurate
normalization of real-time quantitative RT-PCR data by geometric averaging of multiple internal
control genes. Genome Biol. 2002;3(7):research0034.1. doi: 10.1186/gb-2002-3-7-research0034.
8. Andersen CL, Jensen JL, Ørntoft TF. Normalization of Real-Time Quantitative Reverse
Transcription-PCR Data: A Model-Based Variance Estimation Approach to Identify Genes Suited for
Normalization, Applied to Bladder and Colon Cancer Data Sets. Cancer Res 2004;64(15):5245-50.
doi: 10.1158/0008-5472.can-04-0496.
9. Pfaffl MW, Tichopad A, Prgomet C, Neuvians TP. Determination of stable housekeeping
genes, differentially regulated target genes and sample integrity: BestKeeper–Excel-based tool using
pair-wise correlations. Biotechnology Lett. 2004;26(6):509-15. doi:
10.1023/b:bile.0000019559.84305.47.
10. Sgamma T, Pape J, Massiah A, Jackson S. Selection of reference genes for diurnal and
developmental time-course real-time PCR expression analyses in lettuce. Plant Methods.
2016;12(1):21. doi: 10.1186/s13007-016-0121-y.
410
411
412
413
414
415
416
417
418
419
420
421
422
423
424
425
426
427
428
429
.CC-BY 4.0 International license(which was not certified by peer review) is the author/funder. It is made available under aThe copyright holder for this preprintthis version posted May 14, 2020. . https://doi.org/10.1101/2020.05.14.095786doi: bioRxiv preprint
21
11. Zhang L, Zhang Q, Jiang Y, Li Y, Zhang H, Li R. Reference genes identification for
normalization of qPCR under multiple stresses in Hordeum brevisubulatum. Plant Methods.
2018;14(1):110.
12. Lin Y, Zhang C, Lan H, Gao S, Liu H, Liu J, et al. Validation of potential reference genes for
qPCR in maize across abiotic stresses, hormone treatments, and tissue types. PLoS One.
2014;9(5):e95445. doi: 10.1371/journal.pone.0095445.
13. Kim B-R, Nam H-Y, Kim S-U, Kim S-I, Chang Y-J. Normalization of reverse transcription
quantitative-PCR with housekeeping genes in rice. Biotechnol Lett. 2003;25(21):1869-72. doi:
10.1023/a:1026298032009.
14. Dakhiya Y, Hussien D, Fridman E, Kiflawi M, Green RM. Correlations between circadian
rhythms and growth in challenging environments. Plant Physiol. 2017:pp. 00057.2017. doi: 10.1104/
pp.17.00057.
15. Kim J, Kim H-S, Choi S-H, Jang J-Y, Jeong M-J, Lee S. The importance of the circadian
clock in regulating plant metabolism. Int J Mol Sci. 2017;18(12):2680. doi: 10.3390/ijms18122680.
16. Jain N, Vergish S, Khurana JP. Validation of house-keeping genes for normalization of gene
expression data during diurnal/circadian studies in rice by RT-qPCR. Sci Rep. 2018;8(1):3203. doi:
10.1038/s41598-018-21374-1.
17. Jarvis DE, Ho YS, Lightfoot DJ, Schmöckel SM, Li B, Borm TJ, et al. The genome of
Chenopodium quinoa. Nature. 2017;542(7641):307.
18. Abugoch LE, Romero N, Tapia CA, Silva J, Rivera M. Study of some physicochemical and
functional properties of quinoa (Chenopodium quinoa Willd) protein isolates. J Agric Food Chem.
2008;56(12):4745-50. doi: 10.1016/j.aoas.2015.10.007.
430
431
432
433
434
435
436
437
438
439
440
441
442
443
444
445
446
447
448
449
450
451
.CC-BY 4.0 International license(which was not certified by peer review) is the author/funder. It is made available under aThe copyright holder for this preprintthis version posted May 14, 2020. . https://doi.org/10.1101/2020.05.14.095786doi: bioRxiv preprint
22
19. Bazile D, Jacobsen S-E, Verniau A. The global expansion of quinoa: trends and limits. Front
Plant Sci. 2016;7:622. doi: 10.3389/fpls.2016.00622.
20. Dally N, Xiao K, Holtgräwe D, Jung C. The B2 flowering time locus of beet encodes a zinc
finger transcription factor. Proc Natl Acad Sci. 2014:201404829. doi: 10.1073/pnas.1404829111.
21. Bustin SA, Benes V, Garson JA, Hellemans J, Huggett J, Kubista M, et al. The MIQE
guidelines: minimum information for publication of quantitative real-time PCR experiments. Clin
Chem. 2009;55(4):611-22. doi: 10.1373/clinchem.2008.
22. Sosa Zuniga V, Brito V, Fuentes F, Steinfort U. Phenological growth stages of quinoa ‐
(Chenopodium quinoa) based on the BBCH scale. Ann Appl Biol. 2017;171(1):117-24. doi: 10.1111/
aab.12358.
23. Fiallos-Jurado J, Pollier J, Moses T, Arendt P, Barriga-Medina N, Morillo E, et al. Saponin
determination, expression analysis and functional characterization of saponin biosynthetic genes in
Chenopodium quinoa leaves. Plant Sci. 2016;250:188-97. doi: 10.1016/j.plantsci.2016.05.015.
24. Pin PA, Benlloch R, Bonnet D, Wremerth-Weich E, Kraft T, Gielen JJ, et al. An antagonistic
pair of FT homologs mediates the control of flowering time in sugar beet. Science.
2010;330(6009):1397-400. doi: 10.1126/science.1197004.
25. Schmittgen TD, Livak KJ. Analyzing real-time PCR data by the comparative CT method. Nat
Protoc. 2008;3(6):1101. doi: 10.1038/nprot.2008.73.
26. Jacobsen SE. The scope for adaptation of quinoa in Northern Latitudes of Europe. J Agron
Crop Sci. 2017;203(6):603-13. doi: 10.1111/jac.12228.
452
453
454
455
456
457
458
459
460
461
462
463
464
465
466
467
468
469
470
471
.CC-BY 4.0 International license(which was not certified by peer review) is the author/funder. It is made available under aThe copyright holder for this preprintthis version posted May 14, 2020. . https://doi.org/10.1101/2020.05.14.095786doi: bioRxiv preprint
23
27. Nagel DH, Kay SA. Complexity in the wiring and regulation of plant circadian networks.
Curr Biol 2012;22(16):R648-R57. doi: 10.1016/j.cub.2012.07.025.
28. Lillo C. Light induced circadian rhythms in NADP+ glyceraldehyde 3 phosphate ‐ ‐ ‐ ‐
dehydrogenase mRNA in corn seedlings. Biol Rhythm Res. 1993;24(1):65-71. doi:
10.1080/09291019309360196.
29. Usadel B, Bläsing OE, Gibon Y, Retzlaff K, Höhne M, Günther M, et al. Global transcript
levels respond to small changes of the carbon status during progressive exhaustion of carbohydrates
in Arabidopsis rosettes. Plant Physiol. 2008;146(4):1834-61. doi: 10.1104/pp.107.115592.
30. Ferrari C, Proost S, Janowski M, Becker J, Nikoloski Z, Bhattacharya D, et al. Kingdom-wide
comparison reveals the evolution of diurnal gene expression in Archaeplastida. Nat Commun.
2019;10(1):737. doi: 10.1038/s41467-019-08703-2.
31. Mangelsen E, Wanke D, Kilian J, Sundberg E, Harter K, Jansson C. Significance of Light,
Sugar, and Amino Acid Supply for Diurnal Gene Regulation in Developing Barley Caryopses. Plant
Physiol. 2010;153(1):14-33. doi: 10.1104/pp.110.154856.
32. Mallona I, Lischewski S, Weiss J, Hause B, Egea-Cortines M. Validation of reference genes
for quantitative real-time PCR during leaf and flower development in Petunia hybrida. BMC Plant
Biol. 2010;10(1):4. doi: 10.1186/1471-2229-10-4.
33. Dally N, Eckel M, Batschauer A, Höft N, Jung C. Two CONSTANS-LIKE genes jointly
control flowering time in beet. Sci Rep 2018;8(1):16120. doi: 10.1038/s41598-018-34328-4.
7 Supporting information
472
473
474
475
476
477
478
479
480
481
482
483
484
485
486
487
488
489
490
.CC-BY 4.0 International license(which was not certified by peer review) is the author/funder. It is made available under aThe copyright holder for this preprintthis version posted May 14, 2020. . https://doi.org/10.1101/2020.05.14.095786doi: bioRxiv preprint
24
S1 Table. A260/A280 and A260/A230 ratios of RNA isolated from diurnal leaf samples of the Titicaca accession.
S2 Table. Reference gene candidates obtained from cross validation of literature survey and C. quinoa shoot and root transcriptome data [17]. Selected genes were stably expressed at least in two out of four stress conditions in soil- and hydroponic-grown plants.
S1 Fig. RNA and cDNA quality control by electrophoresis.(A) 1.5% agarose gel of RNA isolated from leaf samples of the Titicaca accession; lanes 1 to 3: ZT-0, lanes 4 to 6: ZT-4, lanes 7 to 9: ZT-8, lanes 10 to 1, lanes 13 to 15: 2: ZT-12, lanes 13 to 15: ZT-16, lanes 16 to 18: ZT-20, lanes 19 to 21: ZT-24. Putative bands for 28S and 18S rRNA are indicated by arrows. Agarose gel was run for 40 min at 100 V (cropped gel). (B) 2.0% agarose gel of PCR products of cDNA synthesized from RNA leaf samples of Titicaca accession; lanes 1 to 3: ZT-0, lanes 4 to 6: ZT-4, lanes 7 to 9: ZT-8, lanes 10 to 1, lanes 13 to 15: 2: ZT-12, lanes 13 to 15: ZT-16, lanes 16 to 18: ZT-20,lanes 19 to 21: ZT-24. M: 50 bp ladder, PC: positive control, NC: water. Agarose gel was run for 30 min at 100 V (cropped gel).
S2 Fig. Standard curves of the selected candidate genes and the target gene BBX19. Dilution factors 1:40 (2x), 1:20, 1:10 and 3:20 were used.
S3 Fig. Amplification of PCR products of expected sizes for each of the candidate genes. Lane 1: ACT, lane 2: GAPDH, lane 3: IDH-B, lane 4: IDH-A, lane 5: PTB, lane 6: TUB, lane 7: UBQ, lane 8: RAN-3, NC:water, M: 50 bp ladder. 2.0 % agarose gel was run for 40 min at 100 V.
S4 Fig. Melting curves of the candidate genes. The curves were obtained from three technical replicates of three biological replicates (21 diurnal/circadian samples) for (A) CHEN-109 and (B) Titicaca.
S5 Fig. Verification of the primer combinations specificity by Sanger sequencing.Sequencing results of (A) ACT, IDH-A, IDH-B (B) PTB, UBQ, TUB and RAN-3. Sequences correspond to Titicaca accession aligned to the reference sequence (accession PI 614886) (Jarvis et al., 2017). Primers are annotated and coverage is shown (captions on the right side). Fw=sequenced with the forward primer, Rv=sequenced with the reverse primer.
S6 Fig. Reference gene candidates’ intergroup variation between Danish and Peruvian C. quinoa accessions.Variation was determined by NormFinder. Error bars represent the intragroup variation.
S1_raw_images. Full-length gels corresponding to cropped gels in (A) S1 Fig A and (B) S1 Fig B. Lanes labeled with an “X” in (B) correspond to different primer combinations tests for cDNA amplification by standard PCR. M: 50 bp ladder.
491
492493494
495496497498499500501502
503504
505506507
508509510
511512513514515
516517
518519
.CC-BY 4.0 International license(which was not certified by peer review) is the author/funder. It is made available under aThe copyright holder for this preprintthis version posted May 14, 2020. . https://doi.org/10.1101/2020.05.14.095786doi: bioRxiv preprint
.CC-BY 4.0 International license(which was not certified by peer review) is the author/funder. It is made available under aThe copyright holder for this preprintthis version posted May 14, 2020. . https://doi.org/10.1101/2020.05.14.095786doi: bioRxiv preprint

.CC-BY 4.0 International license(which was not certified by peer review) is the author/funder. It is made available under aThe copyright holder for this preprintthis version posted May 14, 2020. . https://doi.org/10.1101/2020.05.14.095786doi: bioRxiv preprint
.CC-BY 4.0 International license(which was not certified by peer review) is the author/funder. It is made available under aThe copyright holder for this preprintthis version posted May 14, 2020. . https://doi.org/10.1101/2020.05.14.095786doi: bioRxiv preprint

.CC-BY 4.0 International license(which was not certified by peer review) is the author/funder. It is made available under aThe copyright holder for this preprintthis version posted May 14, 2020. . https://doi.org/10.1101/2020.05.14.095786doi: bioRxiv preprint

.CC-BY 4.0 International license(which was not certified by peer review) is the author/funder. It is made available under aThe copyright holder for this preprintthis version posted May 14, 2020. . https://doi.org/10.1101/2020.05.14.095786doi: bioRxiv preprint
.CC-BY 4.0 International license(which was not certified by peer review) is the author/funder. It is made available under aThe copyright holder for this preprintthis version posted May 14, 2020. . https://doi.org/10.1101/2020.05.14.095786doi: bioRxiv preprint