Embed Size (px)
Citation preview

Date:Wed, 23 Apr 2003 From:"Dr Stephen A Bustin" To:"Renee Horner" Subject:Re: UK NA quantification meeting
Fab. Absolute vs relative is a great idea, although you must bear in mind that as conference organiser if I do not agree with any speaker's opinion they will be bundled off to the Tower of London. S.
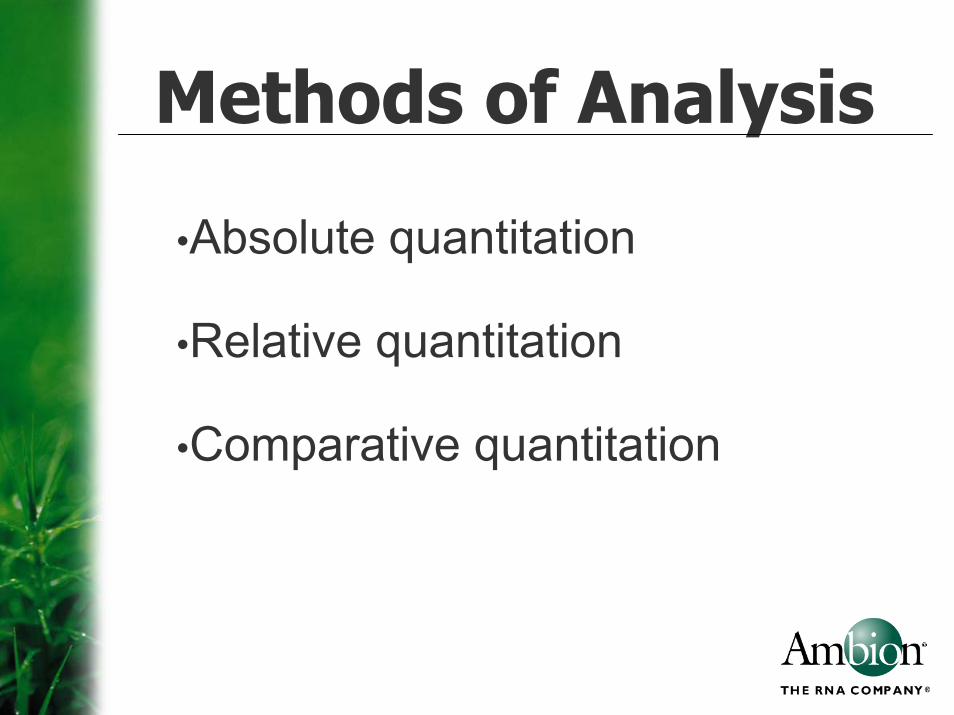
Methods of Analysis
•Absolute quantitation
•Relative quantitation
•Comparative quantitation

Why absolute quantitation?
• Gives a measure of copy number
• Viral load determination
• FDA filing
• Inter-lab comparisons
Why is absolute quantitation not currently feasible?
• There is no reliable method for preparing, quantitating and storing RNA standards
• No NIST traceable standards

Next Best Alternatives?
• Synthetic templates known to come up at a certain Ct value-“semi quantitative PCR”
Why relative quantitation?
• Does not require that you know the copy numbers for the standard curve• Can be used to determine fold increases and decreases in gene expression• There is no need to “over optimize” the efficiencies

What is needed for relative quantitation?
• Any sample that can be used as a comparison for other samples-“calibrator”• A serial dilution of the calibrator to give a standard curve in terms of 1x, 2x, 10x, etc
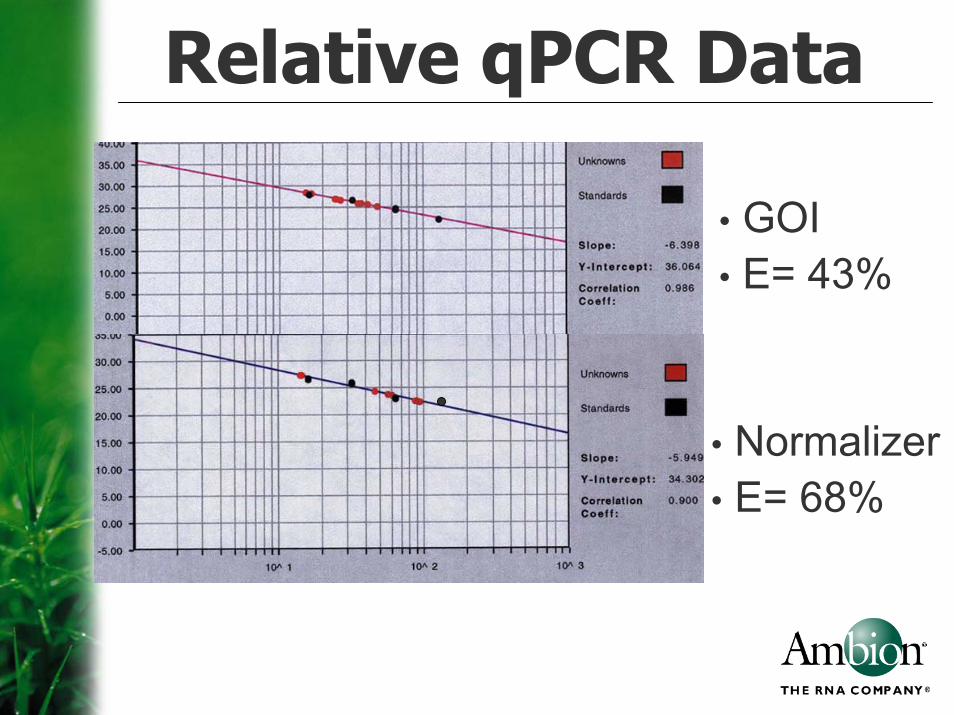
Relative qPCR Data
• GOI • E= 43%
• Normalizer• E= 68%
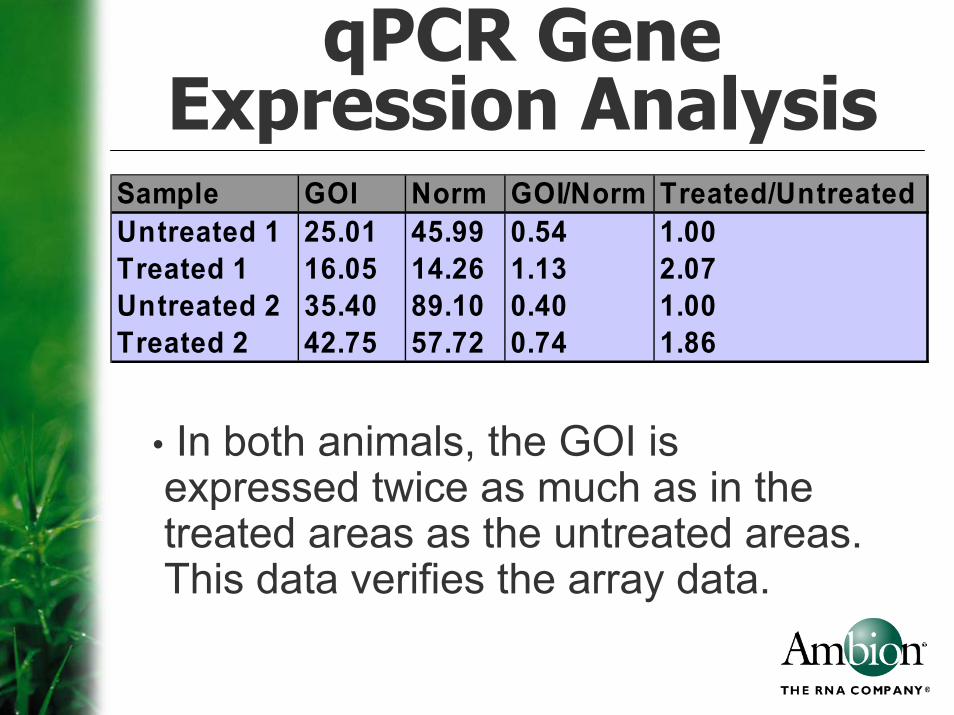
qPCR Gene Expression Analysis
Sample GOI Norm GOI/Norm Treated/UntreatedUntreated 1 25.01 45.99 0.54 1.00Treated 1 16.05 14.26 1.13 2.07Untreated 2 35.40 89.10 0.40 1.00Treated 2 42.75 57.72 0.74 1.86
• In both animals, the GOI is expressed twice as much as in the treated areas as the untreated areas. This data verifies the array data.
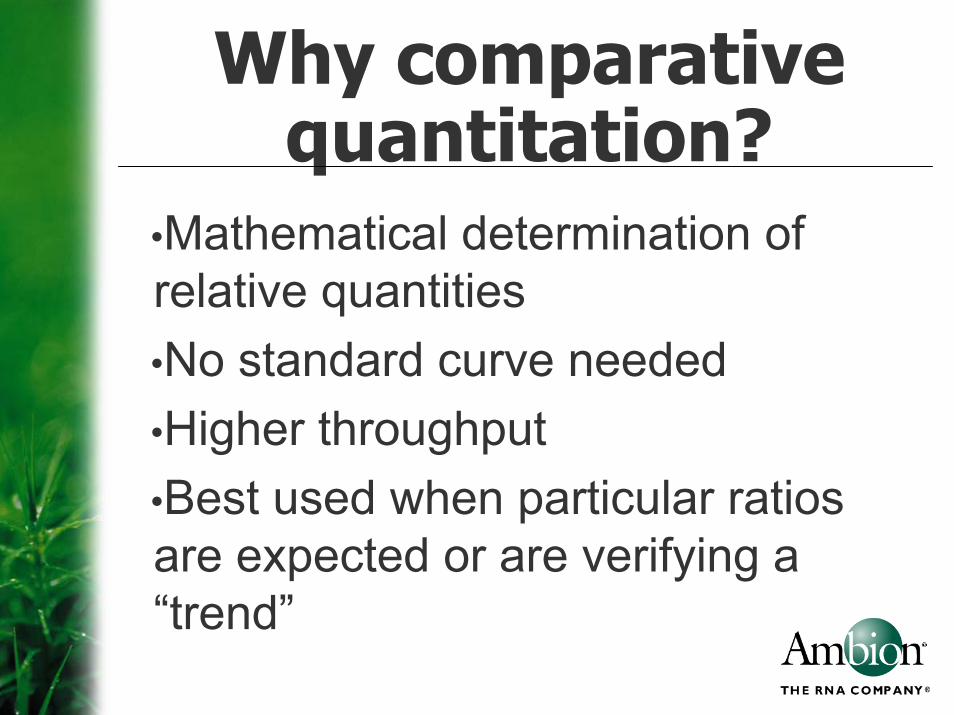
Why comparative quantitation?
•Mathematical determination of relative quantities•No standard curve needed•Higher throughput•Best used when particular ratios are expected or are verifying a “trend”

What is needed for comparative quantitation?
• Calibrator sample used as a 1x standard
• Samples that are prepared identically
• Ideally, if normalizing the results, your GOI and the normalizer will have the same efficiency
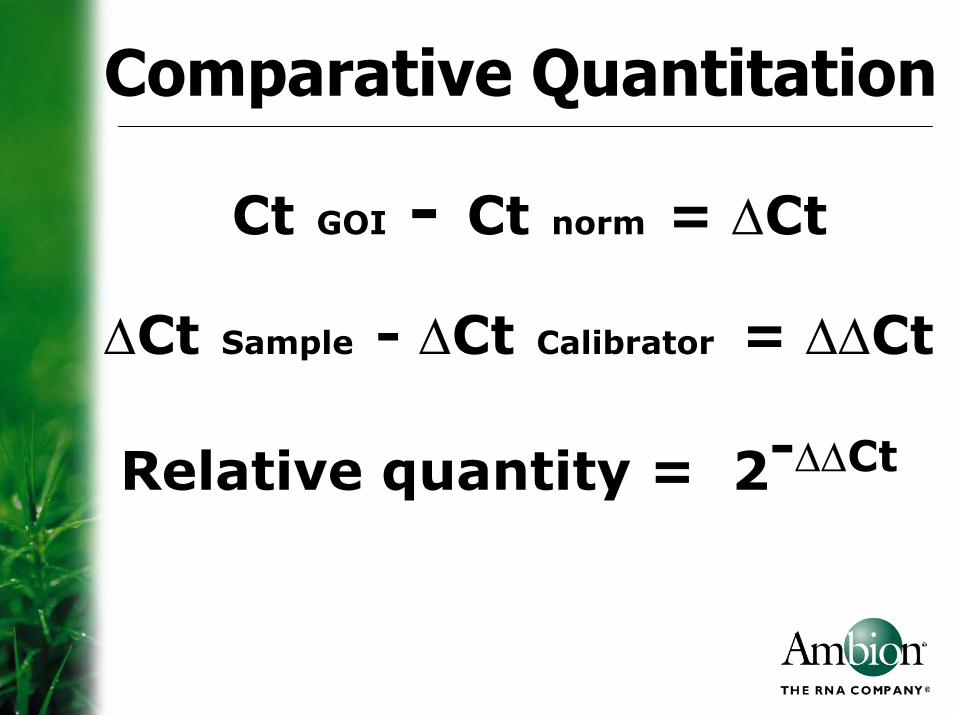
Comparative Quantitation
Ct GOI - Ct norm = ∆Ct
∆Ct Sample - ∆Ct Calibrator = ∆∆Ct
Relative quantity = 2-∆∆Ct
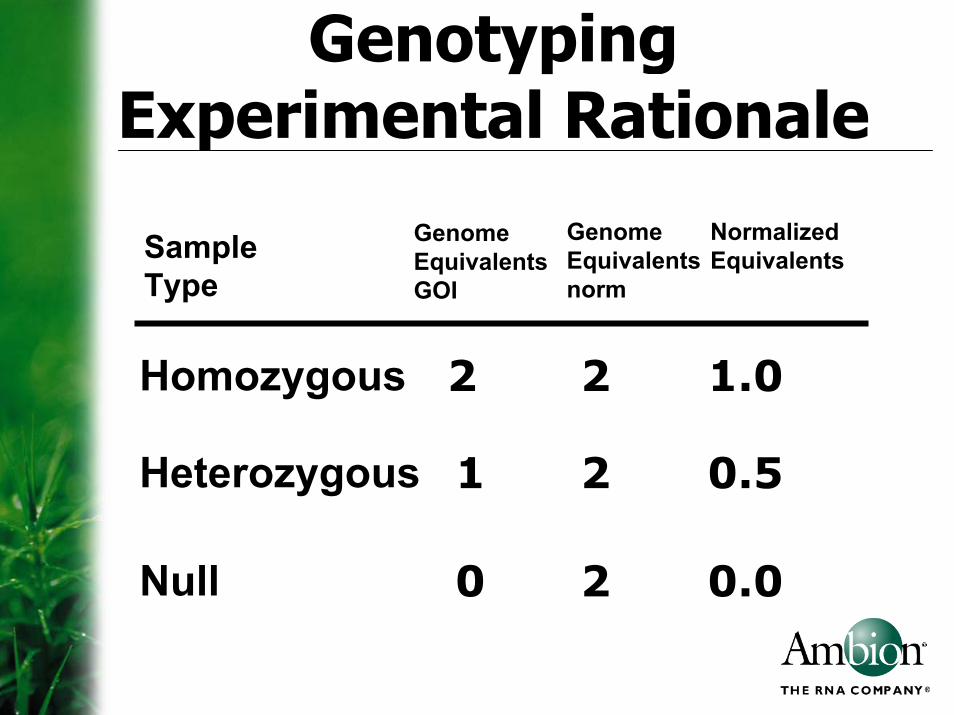
Genotyping Experimental Rationale
Genome Equivalents norm
Normalized Equivalents
Genome Equivalents GOI
Sample Type
Homozygous 2 2 1.0
Heterozygous 1 2 0.5
Null 20 0.0

qPCR Genotype AnalysisWell Dye Replicate Ct
E1 FAM b 22.26F1 FAM b 22.29E1 HEX b 26.05F1 HEX b 26.03A3 FAM c 40A4 FAM c 40A3 HEX c 24.84A4 HEX c 24.17A7 FAM s 19.52A8 FAM s 19.1A7 HEX s 23.92A8 HEX s 22.33
H11 FAM zp 40H12 FAM zp 40H11 HEX zp 24.88H12 HEX zp 26.04
wt Calibrator
Sample MC305
Sample AS103
Sample TH600
2-∆∆Ct Genotype∆∆Ct∆Ct
-3.77 0.00 1.0 wtwt Calibrator
-3.82 -0.05 1.0 hmSample AS103
-2.33 1.44 0.4 htSample TH600
15.50 19.26 0.0 nullSample MC305
05
101520253035
0 1 2
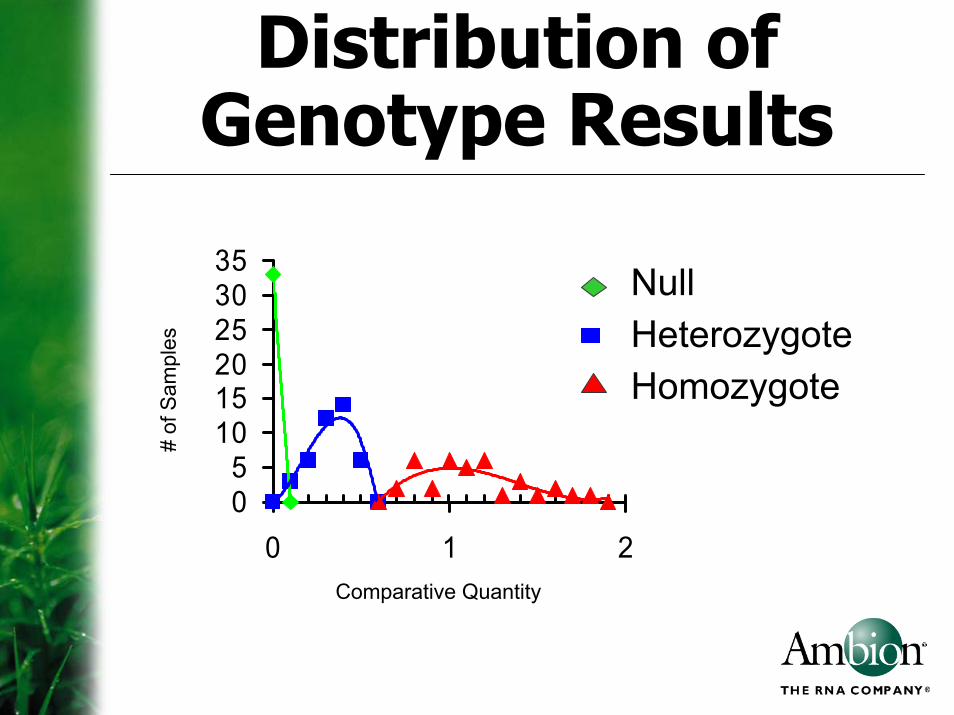
NullHeterozygoteHomozygote
Comparative Quantity
# of
Sam
ples
Distribution of Genotype Results
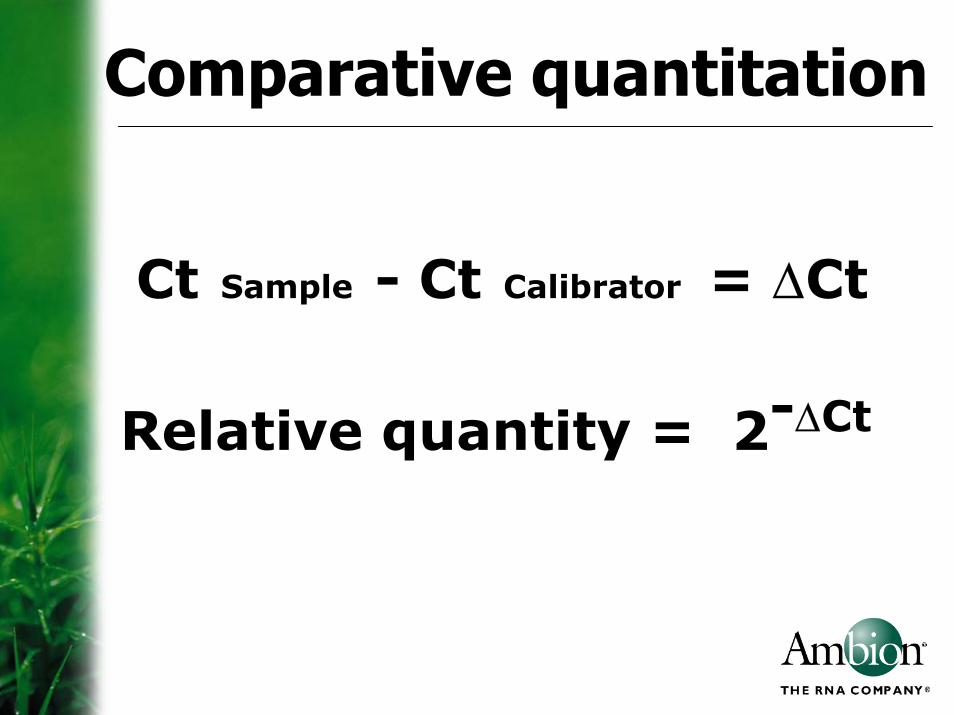
Comparative quantitation
Ct Sample - Ct Calibrator = ∆Ct
Relative quantity = 2-∆Ct
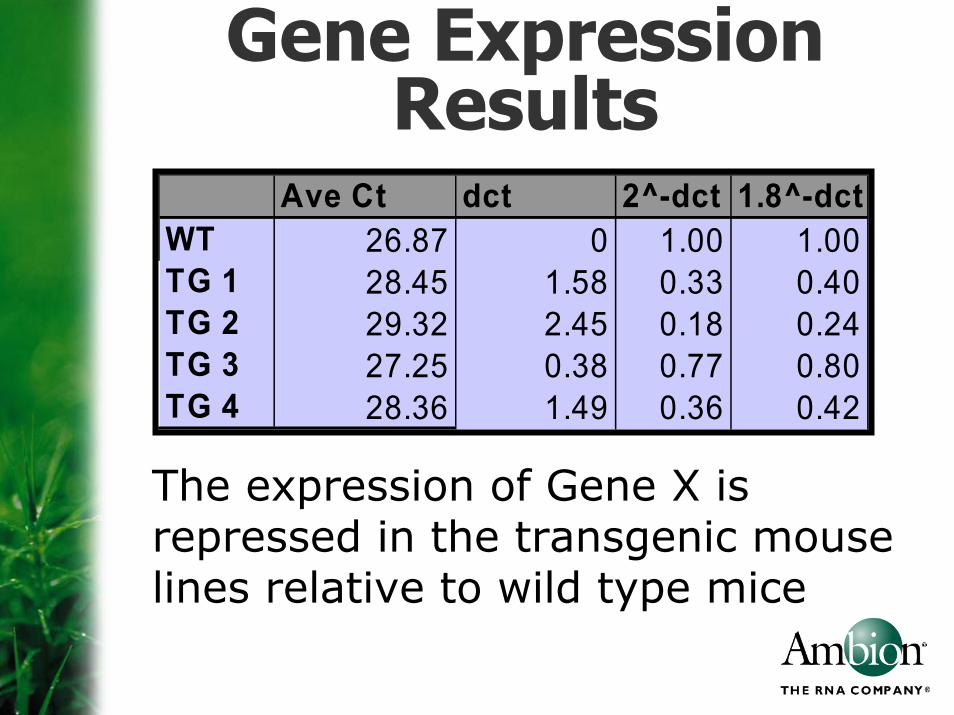
Gene Expression Results
Ave Ct dct 2^-dct 1.8^-dctWT 26.87 0 1.00 1.00TG 1 28.45 1.58 0.33 0.40TG 2 29.32 2.45 0.18 0.24TG 3 27.25 0.38 0.77 0.80TG 4 28.36 1.49 0.36 0.42
The expression of Gene X is repressed in the transgenic mouse lines relative to wild type mice

From:"Rudy Spangler" To:"Renee Horner" Subject: comparative measuresDate:Wed, 21 May 2003
Renee attached is a slide that i use to describe how i analyze data the example has only 4 samples so it will fit on a slide, 2 controlsand 2 experimentals the geometric Ct values are transformed to arithmetic emissions values by 1/2^CT this number for me is multiplied by 10^7 ... because then actin (Ct about 16) is equal to 100 then i transform the emission values to logs for logs, ratios are created by subtracting rather than division every value is transformed to a ratio with respect to the average of the 4 samples this removes the differences in the absolute emission from gene to gene the averages of the ratios for all the genes in each sample are determined and used as a "normalizer“alternatively, the averages of the ratios of selected genes can be used as a normalizerrudy
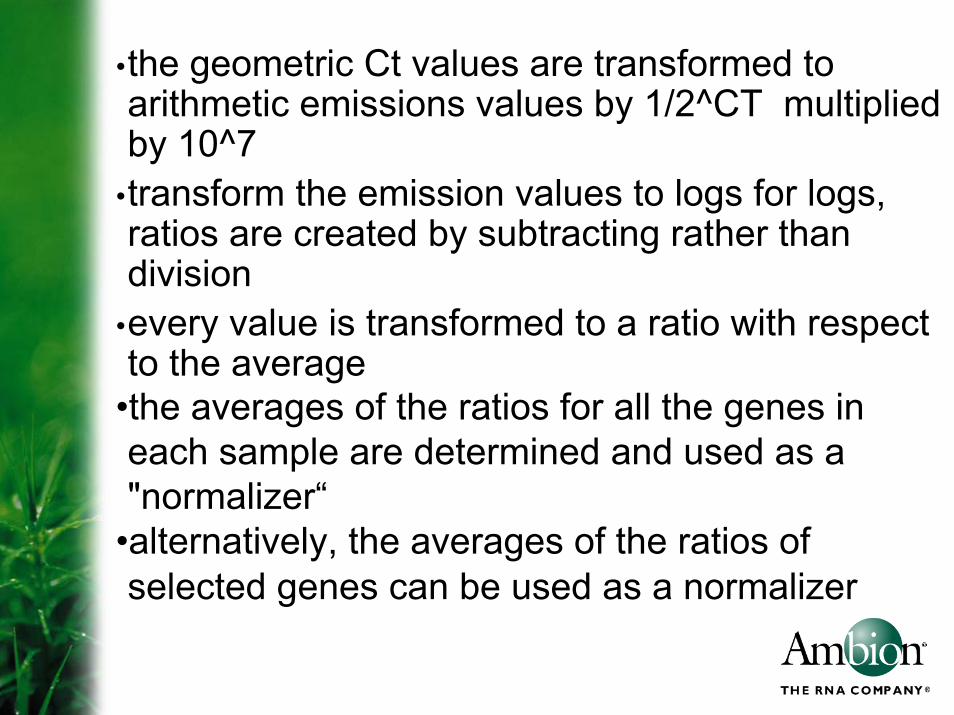
•the geometric Ct values are transformed to arithmetic emissions values by 1/2^CT multiplied by 10^7•transform the emission values to logs for logs, ratios are created by subtracting rather than division •every value is transformed to a ratio with respect to the average
•the averages of the ratios for all the genes in each sample are determined and used as a "normalizer“
•alternatively, the averages of the ratios of selected genes can be used as a normalizer

g01 g02 g03 g04 g05 g06C1C2S1S2
g01 g02 g03 g04 g05 g06C1C2S1S2
Avg g01 Avg g02 Avg g03 Avg g04 Avg g05 Avg g06
g01 g02 g03 g04 g05 g06C1 Avg C1C2 Avg C2S1 Avg S1S2 Avg S2
Grand Avgg01 g02 g03 g04 g05 g06
C1C2S1S2
Emission = 2^-Ct x 10^7
Log of Emission Value
Log of Emission Value - gene Avg
(Log of Emission Value - gene Avg) -
Sample Avg - Grand Avg

Conclusions•Absolute quantitation
•Standard curve•Standards must be accurately quantitated•Best used for viral load determination
•Relative quantitation•Standard curve•Standards are serial dilutions of a calibrator template•Best used for gene expression studies
•Comparative quantitation•Mathematical determination•Calibrator sample used as a 1x standard•Best used when particular ratios are expected or to verify trends

Acknowledgements
•Rudy Spangler, Rockefeller University
•Greg Shipley, University of Texas Medical School
•Beth Israel Deaconess Medical Center
•Transgenic/Gene Targeting Facility, Dana Farber
•Trish Hoener, Ambion Inc.
•qpcrlistserver Yahoo group