Embed Size (px)
Citation preview
Multiplex short tandem repeat (STR) analysis has emerged asthe dominant forensic DNA identification method because it iseasy to interpret, can use sub-nanogram amounts of DNA, has ahigh degree of discrimination and can yield results in a matter ofhours (1–3). In the United States, these advantages have led to thedevelopment of a national felon database employing 13 core STRloci (4–6). In May 2000, the PowerPlex® 16 System (Promega,Madison, WI) was introduced as the first multiplex system capableof simultaneously amplifying all 13 core STR, the sex determinantlocus, amelogenin, and two high discrimination low stutter pen-tanucleotide STR loci, Penta D and Penta E (7). This product was
subsequently validated by a group of forensic laboratories todemonstrate concordance in approximately 2000 samples with ex-isting STR typing systems (8,9). Previous studies have documentedthe allele frequencies (10) and physical mapping data (11,12) forthe 15 STR loci in the PowerPlex® 16 System.
In this study we present validation data from 24 laboratories anddevelopmental data from Promega Corporation demonstrating thatthe PowerPlex® 16 System provides reliable genotyping data undera wide variety of conditions. The results obtained demonstrate therobustness of this system and the ability to successfully use thePowerPlex® 16 System with casework samples in a large numberof forensic laboratories.
These studies have been performed to satisfy TWGDAM (13)and DAB guidelines in order to address concerns presented in to-day’s legal environment. As a result of these studies, the Power-Plex® 16 System has been approved for use in providing caseworkand reference sample genotypes for the CODIS/NDIS nationaldatabase system.
Participating Laboratories
Austin Police Department, Detroit Police Department, FederalBureau of Investigation, Idaho State Police Forensic Services,7 Illi-nois State Police8, Kansas Bureau of Investigation, Las Vegas
Copyright © 2002 by ASTM International, 100 Barr Harbor Drive, PO Box C700, West Conshohocken, PA 19428-2959.
Benjamin E. Krenke,1 M.S.; Allan Tereba,1 Ph.D; Stacey J. Anderson,2 B.S.; Eric Buel,3 Ph.D; Sherry Culhane,4 B.S.; Carla J. Finis,5 Ph.D; Christine S. Tomsey,6 M.S.; Jeffrey M. Zachetti,6 B.S.;Arni Masibay,1 Ph.D; Dawn R. Rabbach,1 A.A.S.; Elizabeth A. Amiott,1 B.S.; and Cynthia J. Sprecher,1 B.S.
Validation of a 16-Locus Fluorescent Multiplex System*
ABSTRACT: STR multiplexes have been indispensable for the efficient genotyping of forensic samples. The PowerPlex® 16 System contains thecore CODIS loci, D3S1358, D5S818, D7S820, D8S1179, D13S317, D16S539, D18S51, D21S11, CSF1PO, FGA, TH01, TPOX, vWA, the sex de-terminant locus, amelogenin, and two pentanucleotide STR loci, Penta D and Penta E. This multiplex satisfies the locus requirements for most na-tional databases and is the most efficient currently available system due to its single PCR amplification. To provide the groundwork for judicial ac-ceptance, including the publication of primer sequences, and to evaluate laboratory-to-laboratory variation, a developmental validation for caseworkon this commercially available system was performed in 24 laboratories and produced the following conclusions. Amplification was reliable on avariety of thermal cyclers and product could be analyzed on either an ABI PRISM® 310 Genetic Analyzer or an ABI PRISM® 377 DNA Sequencer.Genotyping using single source samples was consistent between 0.25 and 2 ng of input DNA template with a few laboratories obtaining completegenotypes at 0.0625 ng. However, heterozygote allele imbalance (�60% peak height balance) caused by stochastic effects was observed at a rate of13% with 0.125 ng DNA and 22% at 0.0625 ng DNA. Mixture analyses were done using a total of 1 ng of DNA template. Most alleles were de-tected in mixtures of 4 to 1 and some minor alleles were detected in mixtures of 19 to 1. Optimum amplification cycle number was dependent onthe sensitivity of the detection instrument used and could also be adjusted to accommodate larger amounts of DNA on solid supports such as FTA®
paper. Reaction conditions including volume, annealing temperature, and concentrations of primer, AmpliTaq Gold®, and magnesium were shownto be optimal yet robust enough to withstand moderate variations without affecting genotype analysis. Environmental, matrix and standard sourceanalyses revealed an ability to obtain complete genotypes in all sample types except those exposed to 80°C for 12–48 days. Finally, comparison ofgenotype results from the PowerPlex® 16 System with other commercially available systems on non-probative reference and forensic samplesshowed consistent results.
KEYWORDS: forensic science, DNA typing, short tandem repeat (STR), polymerase chain reaction (PCR), validation, PowerPlex, primers,CODIS, Penta E, Penta D
J Forensic Sci, July 2002, Vol. 47, No. 4Paper ID JFS2001121_474
Available online at: www.astm.org
1
1 Promega Corporation, Madison, WI.2 South Dakota State Forensic Laboratory, Pierre, SD.3 Vermont Forensic Laboratory, Waterbury, VT.4 Wisconsin State Crime Laboratory—Madison, Madison, WI.5 Idaho State Police Forensic Services, Meridian, ID.6 Pennsylvania State Police DNA Laboratory, Greensburg, PA.* Portions of this work were presented at the 2nd European Academy of
Forensic Science Meeting, 12–16 Sept. 2000, Cracow, Poland, the 11th Inter-national Symposium on Human Identification, 10–13 Oct. 2000, Biloxi, MS andthe American Academy of Forensic Sciences 53rd Annual Scientific Meeting,19–24 Feb. 2001, Seattle, WA.
Received 6 April 2001; and in revised form 14 Dec. 2001; accepted 19 Dec.2001; published 14 June 2002.

2 JOURNAL OF FORENSIC SCIENCES
Metro Police, Michigan State Police, Mississippi Crime Labora-tory,7 Missouri State Highway Patrol,8 Montana Department ofJustice, New York State Police, Oklahoma City PoliceDepartment,Oklahoma Bureau of Investigation, Orange County Sheriff’s Of-fice, Pennsylvania State Police,7 Promega Corporation, San DiegoSheriff’s Office, South Dakota Forensic Laboratory,7 WashoeCounty Sheriff’s Office, Vermont Forensic Laboratory,7 West Vir-ginia State Police,7 Wisconsin State Crime Laboratory-Madison,7
and Wisconsin State Crime Laboratory-Milwaukee were the labo-ratories that participated in this validation study.
Materials and Methods
For the manufacturer’s stressing studies, one component was al-tered as indicated while the other components remained constant.Unless noted otherwise, protocols in the PowerPlex® 16 Systemtechnical manual TMD012 (14) were followed.
Instrument Calibrations and Variability
All developmental work was performed with instruments andmicropipetters that were tested to ensure that they were withinmanufacturer-specified calibration settings. Using a large numberof laboratories in the validation process also allowed a statisticalapproach to examine the variations encountered within the forensiccommunity.
DNA for Developmental and Single Source Studies
Human DNA was isolated using phenol/chloroform extraction(15) from the non-cell lines B10, B15, B19, C2, and H9 (Promega).DNA from the cell lines 9947A and CCRF-SB were acquired fromPromega. These templates were quantitated by spectrophotometricanalysis using A260 detection (15). Standard samples for manufac-turer’s consistency and multiplex versus monoplex studies wereobtained from the National Institutes of Standards and Technology(NIST, Gaithersburg, MD). Genomic #1, Genomic #4, Genomic9947A, and Genomic 9948 from the NIST Standard Reference Ma-terials (SRM 2391a) were amplified as monoplexes and all tenDNA standards in this kit were genotyped with the PowerPlex® 16System. Non-human species samples were obtained from the PalmBeach County Sheriff’s Office Crime Laboratory (West PalmBeach, FL) and Clontech (Palo Alto, CA). Buccal swab, liquidblood, and dried blood on FTA® paper (Whatman, Clifton, NJ) forthe manufacturer’s standard samples study were extracted andquantitated using the DNA IQ™ System (Promega). Non-proba-tive casework studies used phenol /chloroform and Chelex (Bio-Rad, Hercules, CA) extraction protocols. Sexual assault samplesunderwent a differential lysis (16) as part of the DNA extraction.Liquid blood was spotted for matrix and environmental studies.Most forensic samples were concentrated using Microcon® devices(Millipore Corp., Bedford, MA) and quantitated using the Quan-tiblot™ system (Applied Biosystems, Foster City, CA) or ACES™system (Life Technologies, Rockville, MD).
DNA Amplification
PCR amplifications utilized the commercial release of Promega’sPowerPlex® 16 System and AmpliTaq Gold® DNA Polymerase(Applied Biosystems). Amplification reactions typically were per-
formed using a Perkin-Elmer GeneAmp™ PCR System 9600 Ther-mal Cycler (Foster City, CA) and the amplification cycling param-eters described in the PowerPlex® 16 System technical manual (14).However, the Perkin-Elmer GeneAmp® PCR System 2400, 9700and the Perkin-Elmer Thermal Cycler Model 480 were also exam-ined. Amplification reactions generally contained 0.5 to 1 ng DNAin 25 �L and used 10/20 or 10/22 cycling as described in the Pow-erPlex® 16 System technical manual (14). The sequences of the for-ward and reverse primers for each of the 16 loci are shown in Table1. In studies examining magnesium concentrations, MgCl2 solutionand Mg-free GoldST*R Buffer were provided by Promega.
Amplification Analysis
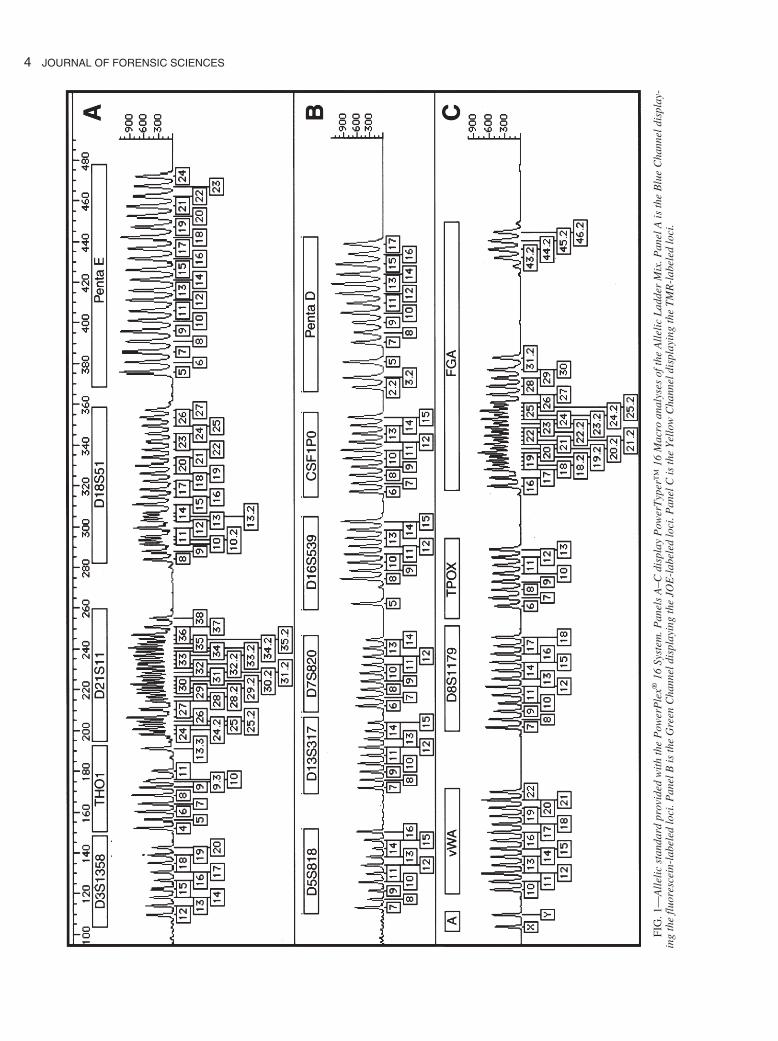
The PowerPlex® 16 System employs four fluorescent dyes (7).Spectral resolution was established by Promega’s GenePrint® Ma-trix FL-JOE-TMR-CXR allowing evaluation of each fluorescentdye employed in the kit (17). All analyses utilized the ILS 600 sizestandard and Allelic Ladder Mix (Fig. 1) provided with the Power-Plex® 16 System (14,18). Initial fragment sizing was performed bythe GeneScan® software (Applied Biosystems). Allele calling wasperformed by Promega’s PowerTyper™ 16 Macro (14) operatingwithin the Genotyper® software program (Applied Biosystems).Analysis of amplification products was performed primarily onABI PRISM® 310 Genetic Analyzers using 3 s or 5 s injectiontimes. Instruments used POP4 polymer and 47 cm capillaries fromApplied Biosystems. Generally, 1 �L of amplified sample and ILS600 were prepared in 24 �L deionized formamide. Samples weredenatured for 3 min at 95°C followed by quick cooling on ice.Some experiments, as noted, analyzed 1 �L or 2 �L of preparedsample on the ABI PRISM® 377 DNA Sequencer with LongRanger™ gels (BioWhittaker Molecular Applications, Rockland,ME). Sample preparations generally used 1 �L of amplified sam-ple, 0.5 �L ILS 600 and 1.5 �L Blue Dextran Loading Solution(Promega) and were denatured for 2 min at 95°C followed by quickcooling on ice.
Stutter Calculation
Sixty-two human templates were amplified using the 10/22 cy-cling protocol and were analyzed on the ABI PRISM® 310 GeneticAnalyzer. Stutter peaks (19–21) were determined as four basessmaller (n-4) than tetranucleotide repeats and five bases smaller (n-5) than pentanucleotide repeats (�0.5 bases). A high level of strin-gency was imposed to collect accurate stutter data. Stutter peakswere required to return to baseline (data with highly variable back-grounds were not used) and stutter peaks that fell in the repeat po-sition between sister alleles two repeat units apart were not used(additive effect of n � 4 and n - 4 was seen in some loci). The ac-tual peak heights did not exceed 5000RFU. Stutter was calculatedby dividing the peak height of the stutter peak by the peak height ofthe true allele.
Results and Discussion
The performance of PCR-based STR assays can be influencedby numerous factors including the differences in instrumentation,variability in the quality and quantity of the DNA being amplified,precision of sizing standard and variations in the reaction and anal-ysis conditions. Each of these factors was evaluated for its affect onthe completeness and correctness of genotypes provided with thePowerPlex® 16 System. Additionally, the average stutter for eachlocus and the cross reactivity with non-human species were evalu-ated for the PowerPlex® 16 System.
7 Data from these laboratories were evaluated for non-probative case studies.8 Indicates laboratories participating in the database validation (8,9) that sup-
plied single source study and/or mixture data only.
Variation of Cycle Number and Injection Time
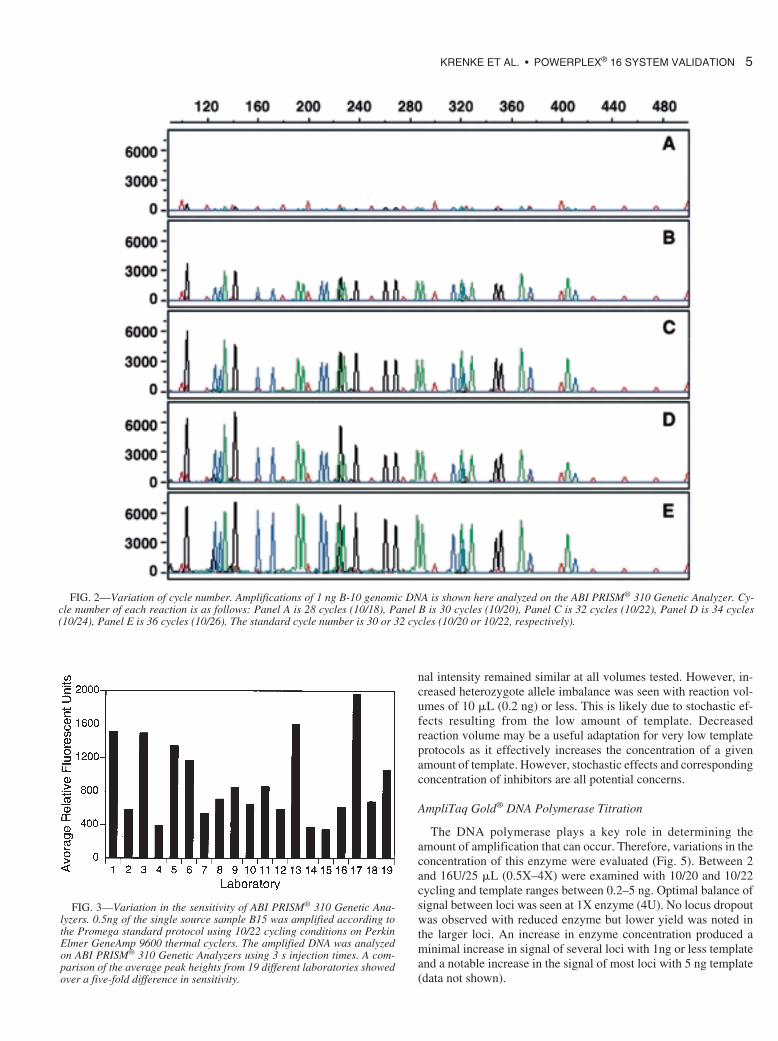
A level of flexibility can be provided in an STR typing systemby alteration of amplification cycle number. Higher cycle numbercan increase signal while decrease in cycle number can achieve abalanced signal when DNA template is in excess (>1 ng). As PCRcycling conditions have a major affect on the amount of productand the balance between loci, variations in the number of PCR cy-cles around the recommended 10/20 to 10/22 cycle protocols wereevaluated (Fig. 2). Cycle protocols between 10/18 and 10/26 (28and 36 cycles, respectively) were evaluated using a titration of tem-plates between 0.2 and 5 ng. As expected, a decrease in cycle num-ber produced decreased peak heights with yield of the smaller locibeing affected most. Locus dropout was observed with 0.5 ng tem-plate or less at 28 cycles. Five nanograms of template countered theeffect of 28 cycles. Consequently, amplifications that inherentlyuse excess templates, such as FTA punches, produce balanced peakheights across loci with decreased cycle number (personal commu-nication, Susanne Brenneke, Missouri State Highway Patrol). Agood balance was produced with 10/20 and 10/22 cycle protocolswith roughly a 40% difference in signal intensity between condi-tions. Increases in cycle number (34 and 36 cycles) produced onlya slight increase in yield for the largest loci while the smaller locidisplayed a substantial increase in signal leading to notable imbal-ance between loci. Although increased cycle number may be use-ful in low copy number situations, the stochastic effects inherent inthese amplifications increase the likelihood of heterozygote alleleimbalance (see below).
An examination of peak heights under various cycling and in-jection times was performed by 19 different laboratories to addressthe issue of differing sensitivities of ABI PRISM® 310 Genetic An-alyzers. Figure 3 demonstrates a five-fold variation in average peakheights using 0.5 ng of template, 10/22 cycling, and 3 s injections.This variation does not appear to be the result of differences inthermal cyclers as the variation is also reflected in the internal lanestandard, which is not amplified. To overcome this inherent varia-tion, each laboratory selected the best one of four conditions be-tween 10/20 and 10/22 cycling at either 3 or 5 s injections to obtainthe peak heights recommended in the PowerPlex® 16 System tech-nical manual. Most laboratories selected 10/20 cycling with 5 secinjection or 10/22 cycling with 3 s injection.
Variation of Reaction Volume
Reduction of reaction volume, which is often used as a cost-sav-ing measure, can alter the concentration of PCR reaction compo-nents. Varied reaction volumes were evaluated to determine the ef-fects on amplification (Fig. 4). Two approaches can be used inchanging volume, keeping the template concentration constant orkeeping the quantity of template constant. We elected to keep theconcentration constant to reduce the effects of using high templateconcentrations, such as high background and saturation of the CCDpixels that may lead to too much or incomplete spectral subtractionresulting in phenomena known as pull down or pull up. Reactionvolumes ranged from 5 �L to 50 �L (25 �L volume standard) withtemplate titrations between 0.2 and 5 ng/25 �L. As expected, sig-
KRENKE ET AL. • POWERPLEX® 16 SYSTEM VALIDATION 3
TABLE 1—PowerPlex® 16 System primer sequences.
Locus Orientation Oligonucleotide Sequences 5� end
FGA Forward GGCTGCAGGGCATAACATTA TMRReverse ATTCTATGACTTTGCGCTTCAGGA OH
TPOX Forward GCACAGAACAGGCACTTAGG OHReverse CGCTCAAACGTGAGGTTG TMR
D8S1179 Forward ATTGCAACTTATATGTATTTTTGTATTTCATG OHReverse ACCAAATTGTGTTCATGAGTATAGTTTC TMR
vWA Forward GCCCTAGTGGATGATAAGAATAATCAGTATGTG OHReverse GGACAGATGATAAATACATAGGATGGATGG TMR
Amelogenin Forward CCCTGGGCTCTGTAAAGAA TMRReverse ATCAGAGCTTAAACTGGGAAGCTG OH
Penta E Forward ATTACCAACATGAAAGGGTACCAATA OHReverse TGGGTTATTAATTGAGAAAACTCCTTACAATTT FL
D18S51 Forward TTCTTGAGCCCAGAAGGTTA FLReverse ATTCTACCAGCAACAACACAAATAAAC OH
D21S11 Forward ATATGTGAGTCAATTCCCCAAG OHReverse TGTATTAGTCAATGTTCTCCAGAGAC FL
TH01 Forward GTGATTCCCATTGGCCTGTTC FLReverse ATTCCTGTGGGCTGAAAAGCTC OH
D3S1358 Forward ACTGCAGTCCAATCTGGGT OHReverse ATGAAATCAACAGAGGCTTGC FL
Penta D Forward GAAGGTCGAAGCTGAAGTG JOEReverse ATTAGAATTCTTTAATCTGGACACAAG OH
CSF1PO Forward CCGGAGGTAAAGGTGTCTTAAAGT JOEReverse ATTTCCTGTGTCAGACCCTGTT OH
D16S539 Forward GGGGGTCTAAGAGCTTGTAAAAAG OHReverse GTTTGTGTGTGCATCTGTAAGCATGTATC JOE
D7S820 Forward ATGTTGGTCAGGCTGACTATG JOEReverse GATTCCACATTTATCCTCATTGAC OH
D13S317 Forward ATTACAGAAGTCTGGGATGTGGAGGA OHReverse GGCAGCCCAAAAAGACAGA JOE
D5S818 Forward GGTGATTTTCCTCTTTGGTATCC OHReverse AGCCACAGTTTACAACATTTGTATCT JOE
FL � fluorescein; JOE � 6-carboxy-4�,5�-dichloro-2�,7�-dimethoxyfluorescein; TMR � carboxy-tetramethylrhodamine.
4 JOURNAL OF FORENSIC SCIENCES
FIG
. 1—
All
elic
sta
ndar
d pr
ovid
ed w
ith
the
Pow
erP
lex®
16 S
yste
m. P
anel
s A
–C d
ispl
ay P
ower
Typ
er™
16 M
acro
ana
lyse
s of
the
All
elic
Lad
der
Mix
. Pan
el A
is th
e B
lue
Cha
nnel
dis
play
-in
g th
e fl
uore
scei
n-la
bele
d lo
ci. P
anel
B is
the
Gre
en C
hann
el d
ispl
ayin
g th
e JO
E-l
abel
ed lo
ci. P
anel
C is
the
Yel
low
Cha
nnel
dis
play
ing
the
TM
R-l
abel
ed lo
ci.
nal intensity remained similar at all volumes tested. However, in-creased heterozygote allele imbalance was seen with reaction vol-umes of 10 �L (0.2 ng) or less. This is likely due to stochastic ef-fects resulting from the low amount of template. Decreasedreaction volume may be a useful adaptation for very low templateprotocols as it effectively increases the concentration of a givenamount of template. However, stochastic effects and correspondingconcentration of inhibitors are all potential concerns.
AmpliTaq Gold® DNA Polymerase Titration
The DNA polymerase plays a key role in determining theamount of amplification that can occur. Therefore, variations in theconcentration of this enzyme were evaluated (Fig. 5). Between 2and 16U/25 �L (0.5X–4X) were examined with 10/20 and 10/22cycling and template ranges between 0.2–5 ng. Optimal balance ofsignal between loci was seen at 1X enzyme (4U). No locus dropoutwas observed with reduced enzyme but lower yield was noted inthe larger loci. An increase in enzyme concentration produced aminimal increase in signal of several loci with 1ng or less templateand a notable increase in the signal of most loci with 5 ng template(data not shown).
KRENKE ET AL. • POWERPLEX® 16 SYSTEM VALIDATION 5
FIG. 2—Variation of cycle number. Amplifications of 1 ng B-10 genomic DNA is shown here analyzed on the ABI PRISM® 310 Genetic Analyzer. Cy-cle number of each reaction is as follows: Panel A is 28 cycles (10/18), Panel B is 30 cycles (10/20), Panel C is 32 cycles (10/22), Panel D is 34 cycles(10/24), Panel E is 36 cycles (10/26). The standard cycle number is 30 or 32 cycles (10/20 or 10/22, respectively).
FIG. 3—Variation in the sensitivity of ABI PRISM® 310 Genetic Ana-lyzers. 0.5ng of the single source sample B15 was amplified according tothe Promega standard protocol using 10/22 cycling conditions on PerkinElmer GeneAmp 9600 thermal cyclers. The amplified DNA was analyzedon ABI PRISM® 310 Genetic Analyzers using 3 s injection times. A com-parison of the average peak heights from 19 different laboratories showedover a five-fold difference in sensitivity.

Primer Pair Titration
The concentrations of the 32 primers play a critical role in theamplification efficiency of each locus. This required the manufac-turer to adjust the primer concentrations to produce equivalent sig-nals for each locus. Primer concentrations between 0.5X and 2Xwere tested with 10/20 and 10/22 cycles and template between 0.2and 5ng to determine the effects on peak height and balance be-tween loci (Fig. 6). When primer concentration was increasedabove 1X, smaller loci (in bases) were preferentially amplified. Asprimer concentration was decreased below 1X, peak heights de-creased in small loci and increased in larger loci. Locus dropoutwas seen at 0.5X primer concentration and low template (0.2 ng)(data not shown). These data suggest that normal variability inpipetting precision will have minimal effect but intentionalchanges in primer concentration should not be made.
Titration of Magnesium
Magnesium plays an important role in polymerase activity andspecificity (22). Although magnesium is part of the reaction buffer,EDTA in the DNA sample can inadvertently alter effective con-
6 JOURNAL OF FORENSIC SCIENCES
FIG. 4—Variation of reaction volume. Amplifications (10/22 cycling) of 0.5ng/25�L B-10 genomic DNA is shown here analyzed on the ABI PRISM®
310 Genetic Analyzer. Volume of each reaction is as follows: Panel A is 5 �L, Panel B is 10 �L, Panel C is 12.5 �L, Panel D is 25 �L, Panel E is 50 �L.The standard reaction volume is 25 �L.
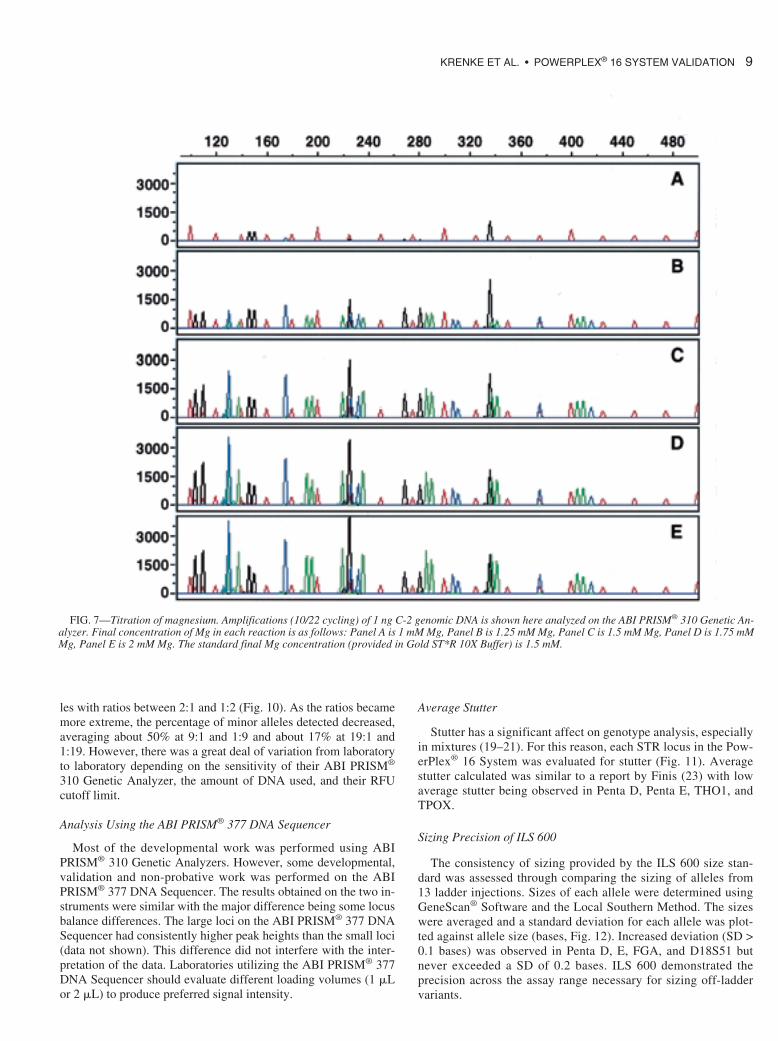
centrations of magnesium. To examine the effect of magnesiumvariations, concentrations between 1–2 mM (1.5 mM is standard)were examined using 10/20 and 10/22 cycles and 1 ng of template(Fig. 7). Optimal balance between loci was seen at 1.5 mM magne-sium. Increased magnesium concentration produced a slight in-crease in the yield of smaller loci. A magnesium concentration of1.25 mM resulted in locus-to-locus imbalance with 10/22 cyclingand actual dropout of D3S1358, D18S51, and D5S818 loci with10/20 cycling in some reactions (data not shown). Dropout of over12 loci was seen in reactions using 1 mM magnesium. These resultsindicate that small increases in the magnesium concentration hadlittle effect but a decrease in the magnesium concentration (i.e.,adding large amounts of EDTA with sample DNA) could adverselyaffect results by chelating magnesium. For this reason, the manu-facturer recommends storing samples in water or TE�4 (Tris, pH8.0, 0.1 mM EDTA).
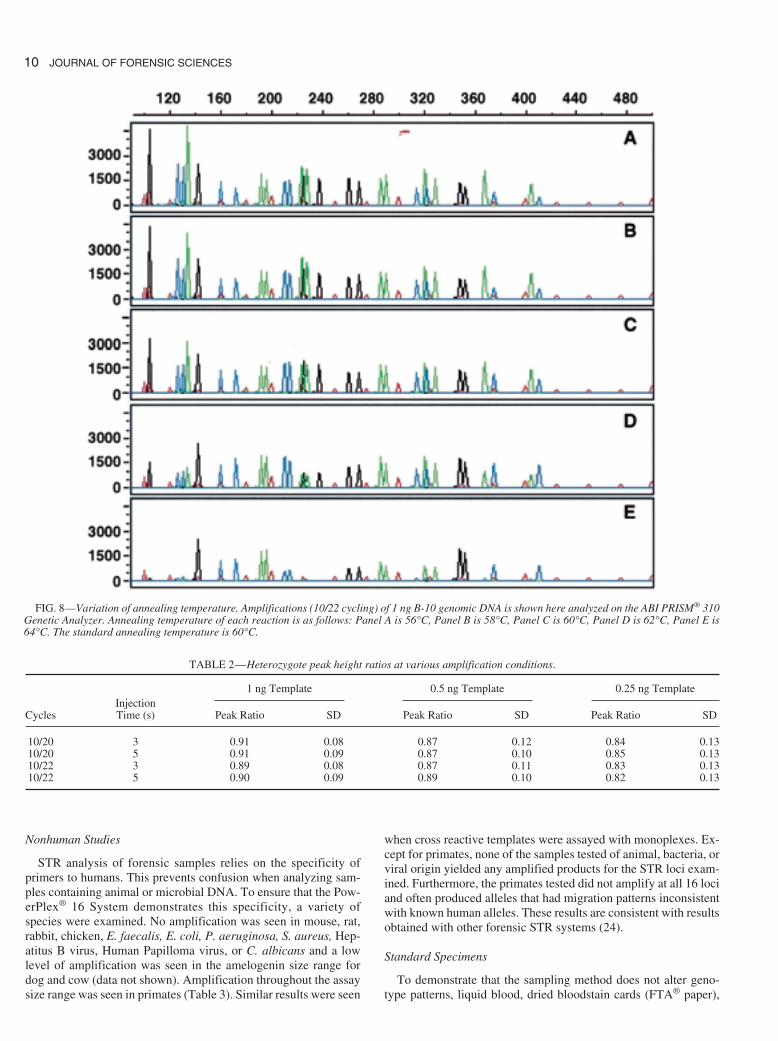
Variation of Annealing Temperature
Changes to the annealing temperature of the amplification reac-tion can affect the specificity and balance of the amplified loci. To

examine these effects, amplification reactions were performed us-ing annealing temperatures up to 4°C above and below the 60°Crecommended annealing temperature with both 10/20 and 10/22cycling conditions and DNA between 0.2 and 5 ng per reaction(Fig. 8). Locus dropout and additional artifacts were not observedwith lower annealing temperature but an increase in the yield ofsmaller loci causing locus to locus imbalance was noted. An in-crease to 62°C produced a decrease in yield of D3S1358, D5S818,D7S820 and amelogenin relative to other loci in 0.5–5ng reactions.At 64°C, dropout or near dropout of D3S1358, D18S51, D5S818,D7S820, Penta E, amelogenin, and D8S1179 was observed. Thesedata suggest that the chosen annealing temperature has a 2°C lee-way above and at least a 4°C range below.
Comparison of Thermal Cyclers
Different models of thermal cyclers have slightly different heat-ing and cooling properties. To see what affect these differenceshave on amplification using the PowerPlex® 16 System, four dif-ferent thermal cycler models—the Perkin-Elmer GeneAmp® PCRSystem 2400, 9600, 9700 and the Perkin-Elmer Thermal CyclerModel 480 using the 10/22 cycling protocols described in the tech-
KRENKE ET AL. • POWERPLEX® 16 SYSTEM VALIDATION 7
FIG. 5—Titration of AmpliTaq Gold® DNA Polymerase. Amplifications (10/22 cycling) of 0.5 ng B-10 genomic DNA is shown here analyzed on the ABIPRISM® 310 Genetic Analyzer. Panel A is 0.5X polymerase, Panel B is 1X polymerase, Panel C is 1.5X polymerase, Panel D is 2X polymerase, and PanelE is 4X polymerase.
nical manual were examined. No consistent performance differ-ences were observed (data not shown).
Genotype Consistency/Reproducibility
One key aspect of any amplification system is the ability to pro-vide reproducible results in a variety of laboratory settings. To testthis, 24 laboratories genotyped single source samples at 1.0, 0.5,and 0.25 ng of input DNA. After optimizing cycle number and in-jection times for their instruments, all laboratories were able to re-liably genotype samples containing 1.0 and 0.5 ng of DNA. Onlytwo laboratories had difficulty detecting two alleles using 0.25 ngof DNA due in part to low instrument sensitivity combined withsignal thresholds of 150 RFU. Thus, even with the variations inABI PRISM® 310 Genetic Analyzer sensitivities, correct genotyp-ing under a variety of input DNA concentrations was reliably ob-tained by a large group of laboratories (data not shown).
In addition to genotyping analyses between laboratories, mono-plex and multiplex amplification reactions were performed usingstandard samples from NIST. All monoplex and PowerPlex® 16System derived genotypes were consistent with the NIST deter-mined genotypes (data not shown).
8 JOURNAL OF FORENSIC SCIENCES
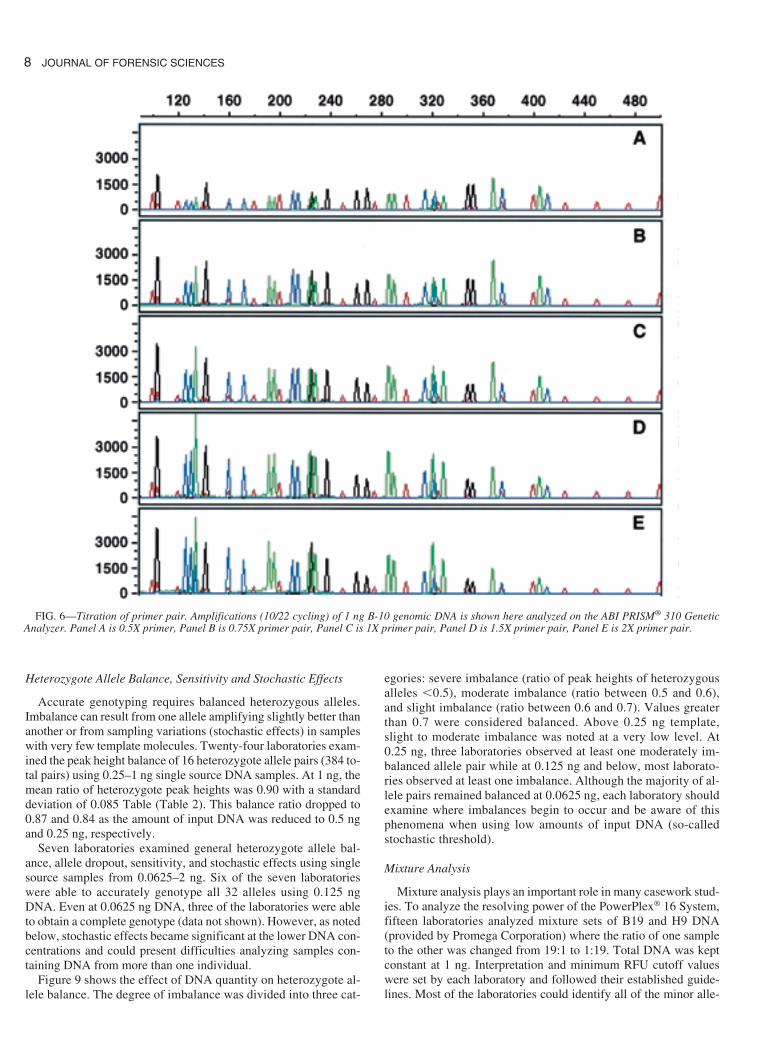
Heterozygote Allele Balance, Sensitivity and Stochastic Effects
Accurate genotyping requires balanced heterozygous alleles.Imbalance can result from one allele amplifying slightly better thananother or from sampling variations (stochastic effects) in sampleswith very few template molecules. Twenty-four laboratories exam-ined the peak height balance of 16 heterozygote allele pairs (384 to-tal pairs) using 0.25–1 ng single source DNA samples. At 1 ng, themean ratio of heterozygote peak heights was 0.90 with a standarddeviation of 0.085 Table (Table 2). This balance ratio dropped to0.87 and 0.84 as the amount of input DNA was reduced to 0.5 ngand 0.25 ng, respectively.
Seven laboratories examined general heterozygote allele bal-ance, allele dropout, sensitivity, and stochastic effects using singlesource samples from 0.0625–2 ng. Six of the seven laboratorieswere able to accurately genotype all 32 alleles using 0.125 ngDNA. Even at 0.0625 ng DNA, three of the laboratories were ableto obtain a complete genotype (data not shown). However, as notedbelow, stochastic effects became significant at the lower DNA con-centrations and could present difficulties analyzing samples con-taining DNA from more than one individual.
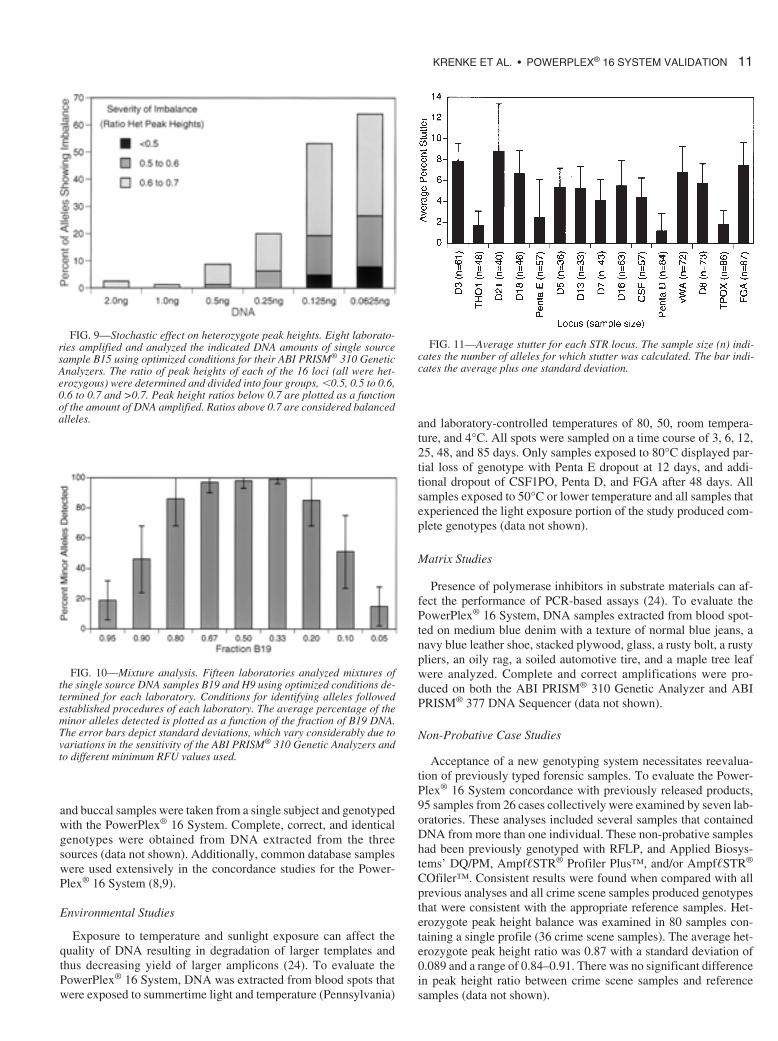
Figure 9 shows the effect of DNA quantity on heterozygote al-lele balance. The degree of imbalance was divided into three cat-
egories: severe imbalance (ratio of peak heights of heterozygousalleles �0.5), moderate imbalance (ratio between 0.5 and 0.6),and slight imbalance (ratio between 0.6 and 0.7). Values greaterthan 0.7 were considered balanced. Above 0.25 ng template,slight to moderate imbalance was noted at a very low level. At0.25 ng, three laboratories observed at least one moderately im-balanced allele pair while at 0.125 ng and below, most laborato-ries observed at least one imbalance. Although the majority of al-lele pairs remained balanced at 0.0625 ng, each laboratory shouldexamine where imbalances begin to occur and be aware of thisphenomena when using low amounts of input DNA (so-calledstochastic threshold).
Mixture Analysis
Mixture analysis plays an important role in many casework stud-ies. To analyze the resolving power of the PowerPlex® 16 System,fifteen laboratories analyzed mixture sets of B19 and H9 DNA(provided by Promega Corporation) where the ratio of one sampleto the other was changed from 19:1 to 1:19. Total DNA was keptconstant at 1 ng. Interpretation and minimum RFU cutoff valueswere set by each laboratory and followed their established guide-lines. Most of the laboratories could identify all of the minor alle-
FIG. 6—Titration of primer pair. Amplifications (10/22 cycling) of 1 ng B-10 genomic DNA is shown here analyzed on the ABI PRISM® 310 GeneticAnalyzer. Panel A is 0.5X primer, Panel B is 0.75X primer pair, Panel C is 1X primer pair, Panel D is 1.5X primer pair, Panel E is 2X primer pair.
les with ratios between 2:1 and 1:2 (Fig. 10). As the ratios becamemore extreme, the percentage of minor alleles detected decreased,averaging about 50% at 9:1 and 1:9 and about 17% at 19:1 and1:19. However, there was a great deal of variation from laboratoryto laboratory depending on the sensitivity of their ABI PRISM®
310 Genetic Analyzer, the amount of DNA used, and their RFUcutoff limit.
Analysis Using the ABI PRISM® 377 DNA Sequencer
Most of the developmental work was performed using ABIPRISM® 310 Genetic Analyzers. However, some developmental,validation and non-probative work was performed on the ABIPRISM® 377 DNA Sequencer. The results obtained on the two in-struments were similar with the major difference being some locusbalance differences. The large loci on the ABI PRISM® 377 DNASequencer had consistently higher peak heights than the small loci(data not shown). This difference did not interfere with the inter-pretation of the data. Laboratories utilizing the ABI PRISM® 377DNA Sequencer should evaluate different loading volumes (1 �Lor 2 �L) to produce preferred signal intensity.
Average Stutter
Stutter has a significant affect on genotype analysis, especiallyin mixtures (19–21). For this reason, each STR locus in the Pow-erPlex® 16 System was evaluated for stutter (Fig. 11). Averagestutter calculated was similar to a report by Finis (23) with lowaverage stutter being observed in Penta D, Penta E, THO1, andTPOX.
Sizing Precision of ILS 600
The consistency of sizing provided by the ILS 600 size stan-dard was assessed through comparing the sizing of alleles from13 ladder injections. Sizes of each allele were determined usingGeneScan® Software and the Local Southern Method. The sizeswere averaged and a standard deviation for each allele was plot-ted against allele size (bases, Fig. 12). Increased deviation (SD >0.1 bases) was observed in Penta D, E, FGA, and D18S51 butnever exceeded a SD of 0.2 bases. ILS 600 demonstrated the precision across the assay range necessary for sizing off-laddervariants.
KRENKE ET AL. • POWERPLEX® 16 SYSTEM VALIDATION 9
FIG. 7—Titration of magnesium. Amplifications (10/22 cycling) of 1 ng C-2 genomic DNA is shown here analyzed on the ABI PRISM® 310 Genetic An-alyzer. Final concentration of Mg in each reaction is as follows: Panel A is 1 mM Mg, Panel B is 1.25 mM Mg, Panel C is 1.5 mM Mg, Panel D is 1.75 mMMg, Panel E is 2 mM Mg. The standard final Mg concentration (provided in Gold ST*R 10X Buffer) is 1.5 mM.
10 JOURNAL OF FORENSIC SCIENCES
FIG. 8—Variation of annealing temperature. Amplifications (10/22 cycling) of 1 ng B-10 genomic DNA is shown here analyzed on the ABI PRISM® 310Genetic Analyzer. Annealing temperature of each reaction is as follows: Panel A is 56°C, Panel B is 58°C, Panel C is 60°C, Panel D is 62°C, Panel E is64°C. The standard annealing temperature is 60°C.
TABLE 2—Heterozygote peak height ratios at various amplification conditions.
Injection1 ng Template 0.5 ng Template 0.25 ng Template
Cycles Time (s) Peak Ratio SD Peak Ratio SD Peak Ratio SD
10/20 3 0.91 0.08 0.87 0.12 0.84 0.1310/20 5 0.91 0.09 0.87 0.10 0.85 0.1310/22 3 0.89 0.08 0.87 0.11 0.83 0.1310/22 5 0.90 0.09 0.89 0.10 0.82 0.13
Nonhuman Studies
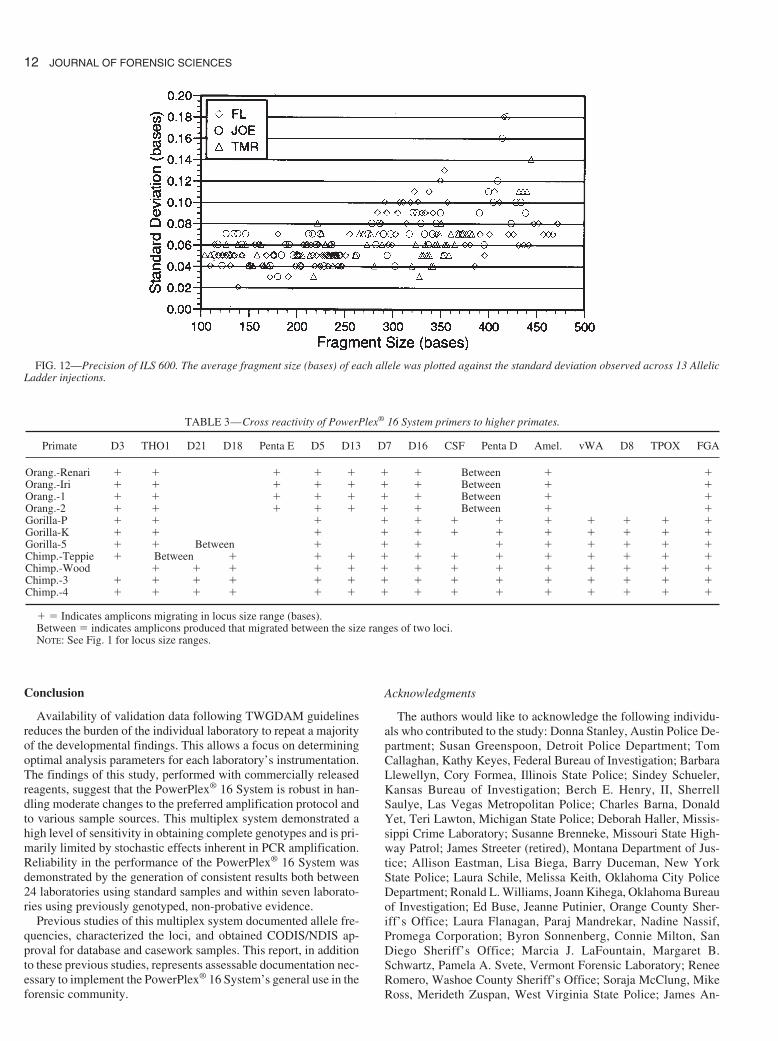
STR analysis of forensic samples relies on the specificity ofprimers to humans. This prevents confusion when analyzing sam-ples containing animal or microbial DNA. To ensure that the Pow-erPlex® 16 System demonstrates this specificity, a variety ofspecies were examined. No amplification was seen in mouse, rat,rabbit, chicken, E. faecalis, E. coli, P. aeruginosa, S. aureus, Hep-atitus B virus, Human Papilloma virus, or C. albicans and a lowlevel of amplification was seen in the amelogenin size range fordog and cow (data not shown). Amplification throughout the assaysize range was seen in primates (Table 3). Similar results were seen
when cross reactive templates were assayed with monoplexes. Ex-cept for primates, none of the samples tested of animal, bacteria, orviral origin yielded any amplified products for the STR loci exam-ined. Furthermore, the primates tested did not amplify at all 16 lociand often produced alleles that had migration patterns inconsistentwith known human alleles. These results are consistent with resultsobtained with other forensic STR systems (24).
Standard Specimens
To demonstrate that the sampling method does not alter geno-type patterns, liquid blood, dried bloodstain cards (FTA® paper),
and buccal samples were taken from a single subject and genotypedwith the PowerPlex® 16 System. Complete, correct, and identicalgenotypes were obtained from DNA extracted from the threesources (data not shown). Additionally, common database sampleswere used extensively in the concordance studies for the Power-Plex® 16 System (8,9).
Environmental Studies
Exposure to temperature and sunlight exposure can affect thequality of DNA resulting in degradation of larger templates andthus decreasing yield of larger amplicons (24). To evaluate thePowerPlex® 16 System, DNA was extracted from blood spots thatwere exposed to summertime light and temperature (Pennsylvania)
and laboratory-controlled temperatures of 80, 50, room tempera-ture, and 4°C. All spots were sampled on a time course of 3, 6, 12,25, 48, and 85 days. Only samples exposed to 80°C displayed par-tial loss of genotype with Penta E dropout at 12 days, and addi-tional dropout of CSF1PO, Penta D, and FGA after 48 days. Allsamples exposed to 50°C or lower temperature and all samples thatexperienced the light exposure portion of the study produced com-plete genotypes (data not shown).
Matrix Studies
Presence of polymerase inhibitors in substrate materials can af-fect the performance of PCR-based assays (24). To evaluate thePowerPlex® 16 System, DNA samples extracted from blood spot-ted on medium blue denim with a texture of normal blue jeans, anavy blue leather shoe, stacked plywood, glass, a rusty bolt, a rustypliers, an oily rag, a soiled automotive tire, and a maple tree leafwere analyzed. Complete and correct amplifications were pro-duced on both the ABI PRISM® 310 Genetic Analyzer and ABIPRISM® 377 DNA Sequencer (data not shown).
Non-Probative Case Studies
Acceptance of a new genotyping system necessitates reevalua-tion of previously typed forensic samples. To evaluate the Power-Plex® 16 System concordance with previously released products,95 samples from 26 cases collectively were examined by seven lab-oratories. These analyses included several samples that containedDNA from more than one individual. These non-probative sampleshad been previously genotyped with RFLP, and Applied Biosys-tems’ DQ/PM, Ampf�STR® Profiler Plus™, and/or Ampf�STR®
COfiler™. Consistent results were found when compared with allprevious analyses and all crime scene samples produced genotypesthat were consistent with the appropriate reference samples. Het-erozygote peak height balance was examined in 80 samples con-taining a single profile (36 crime scene samples). The average het-erozygote peak height ratio was 0.87 with a standard deviation of0.089 and a range of 0.84–0.91. There was no significant differencein peak height ratio between crime scene samples and referencesamples (data not shown).
KRENKE ET AL. • POWERPLEX® 16 SYSTEM VALIDATION 11
FIG. 9—Stochastic effect on heterozygote peak heights. Eight laborato-ries amplified and analyzed the indicated DNA amounts of single sourcesample B15 using optimized conditions for their ABI PRISM® 310 GeneticAnalyzers. The ratio of peak heights of each of the 16 loci (all were het-erozygous) were determined and divided into four groups, �0.5, 0.5 to 0.6,0.6 to 0.7 and >0.7. Peak height ratios below 0.7 are plotted as a functionof the amount of DNA amplified. Ratios above 0.7 are considered balancedalleles.
FIG. 10—Mixture analysis. Fifteen laboratories analyzed mixtures ofthe single source DNA samples B19 and H9 using optimized conditions de-termined for each laboratory. Conditions for identifying alleles followedestablished procedures of each laboratory. The average percentage of theminor alleles detected is plotted as a function of the fraction of B19 DNA.The error bars depict standard deviations, which vary considerably due tovariations in the sensitivity of the ABI PRISM® 310 Genetic Analyzers andto different minimum RFU values used.
FIG. 11—Average stutter for each STR locus. The sample size (n) indi-cates the number of alleles for which stutter was calculated. The bar indi-cates the average plus one standard deviation.
12 JOURNAL OF FORENSIC SCIENCES
Conclusion
Availability of validation data following TWGDAM guidelinesreduces the burden of the individual laboratory to repeat a majorityof the developmental findings. This allows a focus on determiningoptimal analysis parameters for each laboratory’s instrumentation.The findings of this study, performed with commercially releasedreagents, suggest that the PowerPlex® 16 System is robust in han-dling moderate changes to the preferred amplification protocol andto various sample sources. This multiplex system demonstrated ahigh level of sensitivity in obtaining complete genotypes and is pri-marily limited by stochastic effects inherent in PCR amplification.Reliability in the performance of the PowerPlex® 16 System wasdemonstrated by the generation of consistent results both between24 laboratories using standard samples and within seven laborato-ries using previously genotyped, non-probative evidence.
Previous studies of this multiplex system documented allele fre-quencies, characterized the loci, and obtained CODIS/NDIS ap-proval for database and casework samples. This report, in additionto these previous studies, represents assessable documentation nec-essary to implement the PowerPlex® 16 System’s general use in theforensic community.
Acknowledgments
The authors would like to acknowledge the following individu-als who contributed to the study: Donna Stanley, Austin Police De-partment; Susan Greenspoon, Detroit Police Department; TomCallaghan, Kathy Keyes, Federal Bureau of Investigation; BarbaraLlewellyn, Cory Formea, Illinois State Police; Sindey Schueler,Kansas Bureau of Investigation; Berch E. Henry, II, SherrellSaulye, Las Vegas Metropolitan Police; Charles Barna, DonaldYet, Teri Lawton, Michigan State Police; Deborah Haller, Missis-sippi Crime Laboratory; Susanne Brenneke, Missouri State High-way Patrol; James Streeter (retired), Montana Department of Jus-tice; Allison Eastman, Lisa Biega, Barry Duceman, New YorkState Police; Laura Schile, Melissa Keith, Oklahoma City PoliceDepartment; Ronald L. Williams, Joann Kihega, Oklahoma Bureauof Investigation; Ed Buse, Jeanne Putinier, Orange County Sher-iff’s Office; Laura Flanagan, Paraj Mandrekar, Nadine Nassif,Promega Corporation; Byron Sonnenberg, Connie Milton, SanDiego Sheriff’s Office; Marcia J. LaFountain, Margaret B.Schwartz, Pamela A. Svete, Vermont Forensic Laboratory; ReneeRomero, Washoe County Sheriff’s Office; Soraja McClung, MikeRoss, Merideth Zuspan, West Virginia State Police; James An-
TABLE 3—Cross reactivity of PowerPlex® 16 System primers to higher primates.
Primate D3 THO1 D21 D18 Penta E D5 D13 D7 D16 CSF Penta D Amel. vWA D8 TPOX FGA
Orang.-Renari � � � � � � � Between � �Orang.-Iri � � � � � � � Between � �Orang.-1 � � � � � � � Between � �Orang.-2 � � � � � � � Between � �Gorilla-P � � � � � � � � � � � �Gorilla-K � � � � � � � � � � � �Gorilla-5 � � Between � � � � � � � � �Chimp.-Teppie � Between � � � � � � � � � � � �Chimp.-Wood � � � � � � � � � � � � � �Chimp.-3 � � � � � � � � � � � � � � �Chimp.-4 � � � � � � � � � � � � � � �
� � Indicates amplicons migrating in locus size range (bases).Between � indicates amplicons produced that migrated between the size ranges of two loci.NOTE: See Fig. 1 for locus size ranges.
FIG. 12—Precision of ILS 600. The average fragment size (bases) of each allele was plotted against the standard deviation observed across 13 AllelicLadder injections.
dreas, Wisconsin State Crime Laboratory—Madison; GretchenDeGroot, Daniel Hasse, Dirk Janssen, Wisconsin State Crime Lab-oratory—Milwaukee.
References
1. Edwards A, Civitello A, Hammond HA, Caskey CT. DNA typing andgenetic mapping with trimeric and tetrameric tandem repeats. Am J HumGenet 1991;49:746–56.
2. Edwards A, Hammond HA, Jin L, Caskey CT, Chakraborty R. Geneticvariation at five trimeric and tetrameric tandem repeat loci in four humanpopulation groups. Genomics 1992;12:241–53.
3. Hammond HA, Jin L, Zhoung Y, Caskey CT, Chakraborty R. Evolutionof 13 short tandem repeat loci for use in personal identification applica-tions. Am J Hum Genet 1994;55:175–89.
4. Budowle B. Studies for selecting core STR loci for CODIS. Presented atDNA Forensics: Science, Evidence and Future Prospects; 17–18 Nov.1997; McLean, VA.
5. Moretti T. The CODIS STR Project: evaluation of fluorescent multiplexSTR systems. Presented at the American Academy of Forensic SciencesAnnual Meeting; 9–14 Feb. 1998; San Francisco, CA.
6. Budowle B. Examples of STR population databases for CODIS and forcasework. Presented at the 9th International Symposium on HumanIdentification; 7–10 Oct. 1998; Orlando, FL.
7. Sprecher C, Krenke B, Amiott B, Rabbach D, Grooms K. The Power-Plex™ 16 System. Profiles in DNA 2000;4(1):3–6.
8. Budowle B, Sprecher C. Concordance study on population databasesamples using the PowerPlex® 16 and AmpflSTR® Profiler Plus™ andAmpflSTR® COfiler™ Kit. J Forensic Sci 2001;46(3):637–41.
9. Budowle B, Masibay A, Anderson SJ, Barna C, Brenneke S, Brown BL,et al. STR primer concordance data. Forensic Sci Int 2001;124(1)47–54.
10. Levedakou E, Freeman DA, Budzynski MJ, Early BE, McElfresh KC,Schumm JW, et al. Allele frequencies for fourteen STR loci of the Pow-erPlex® 1.1 and 2.1 Multiplex Systems and Penta D locus in Caucasians,African-Americans, Hispanics and other populations of the United Statesof America and Brazil. J Forensic Sci 2001;46(3):736–61.
11. Bacher J, Schumm JW. Development of highly polymorphic pentanu-cleotide tandem repeat loci with low stutter. Profiles in DNA 1998;2(2):3–6.
12. Bacher JW, Helms C, Donis-Keller H, Hennes L, Nassif N, Schumm JW.Chromosome localization of CODIS loci and new pentanucleotide re-peat loci. Proceedings of the 18th International ISFH Congress 1999;33–36.
13. Technical Working Group on DNA Analysis Methods and CaliforniaAssociation of Criminalists Ad Hoc Committee on DNA Quality Assur-ance. Guidelines for a quality assurance program for DNA analysis.Crime Laboratory Digest 1995;22:21–50.
14. Promega Corporation. GenePrint® PowerPlex™ 16 System TechnicalManual, Part # TMD012 (4/00). Madison, WI 2000, www.promega.com/tbs/TMD012/TMD012.html.
15. Sambrook J, Fritsch EF, Maniatis T. Molecular cloning: a laboratorymanual. Cold Spring Laboratories Press, Cold Spring Harbor 1989.
16. Gill P, Sparkes R, Fereday L, Werrett DJ. Forensic application of DNA“fingerprints.” Nature 1985;318:577–9.
17. Promega Corporation. GenePrint® Matrix FL-JOE-TMR-CXR Techni-cal Bulletin, Part # TBD015 (4/00). Madison, WI 2000. Promega Cor-poration.
18. Internal Lane Standard 600 (ILS 600), Part # DG2611. Madison, WI.19. Levinson G, Gutman GA. Slipped-strand mispairing: a major mecha-
nism for DNA sequence evolution. Mol Biol Evol 1987;4:203–21.20. Schlotterer C, Tautz D. Slippage synthesis of simple sequence DNA.
Nucl Acid Res 1992;20:211.21. Walsh PS, Fildes NJ, Reynold R. Sequence analysis and characterization
of stutter products at the tetranucleotide repeat locus vWA. Nucl AcidRes 1996;24:2807–12.
22. Eckert KA, Kunkel TA. DNA polymerase fidelity and the polymerasechain reaction. PCR Methods Appl 1991;1(1):17–24.
23. Finis C. Megaplex STR analysis from a single amplification: validationof the PowerPlex® 16 System. Profiles in DNA 2001;4(2):3–6.
24. Micka K, Amiott EA, Hockenberry TL, Sprecher CJ, Lins AM, RabbachDR, et al. TWGDAM validation of a nine-locus and a four-locus fluo-rescent STR multiplex system. J Forensic Sci 1999;44(6):1–15.
Additional information and reprint requests:Cindy SprecherSenior ScientistResearch and Development, Genetic IdentityPromega Corporation2800 Woods Hollow RoadMadison, WI 53711-5399
KRENKE ET AL. • POWERPLEX® 16 SYSTEM VALIDATION 13