Embed Size (px)
Citation preview

Vagabond Venture Oil Group
SEARCH FOR FOSSILSEARCH FOR FOSSIL
FUELSFUELS
Winter Term 2012
1

Geology in the news
Future Class?
Drilling Results - Economics
TODAY’S PLAN
2
Drilling Results - Geologic

GEOLOGY IN THE NEWSAustin American Statesman: February 25, 2012
Texas Supreme Court determination 08-0964: “Subsurface fresh water belongs to land owner and should be treated like oil and gas deposits which are owned by land owner of subsurface minerals”

Two land ownerships in TexasSurface land ownership: farms, ranches, homes, etc.
Subsurface land ownership: Oil and gas deposits

Rain water
Salt water
Hot salt water
Fresh Ground waterFresh water Soil
Brackish Ground water Fresh Ground water

Massive Edwards limestone Village Center
Berry Creek pond
Edwards limestoneWalnut layers
Glen Rose limestone
Trinity Sandstone
Rocks at Sun CityGeorgetown limestoneWilliams Dr. Front Gate
Georgetown limestone SR 195
Edwards limestoneComanche Peak layer
Edwards limestonePorus reef layers

Austin American Statesman: March 3, 2012
GEOLOGY IN THE NEWS
Fracking & horizontal drilling of new wells costing $1.5 million predicted to increase oil production by 2 million bbls/day
Problems: lack of water for fracking and local endangered lizard species

Gas and Oil Shale Plays: USA and Western CanadaWest Texas Oil Shale Play: Bone Springs Oil Shale

DISCLAIMERThe material you are about to see was
developed for the learning and enjoyment of the class participants.
The diagrams and numbers have been gathered from various sources to reflect the geologic and economic scenerios of the two locations, but neither is a real prospect and neither represents an
actual investment opportunity. 9

- Drilling resultsDrilling results- Return on investmentsReturn on investments
VAGABOND GROUPVAGABOND GROUP
2 OPPORTUNITIES2 OPPORTUNITIESOn-shore PennsylvaniaOn-shore PennsylvaniaOff-shore Gulf of MexicoOff-shore Gulf of Mexico

VAGABOND GROUPVAGABOND GROUP
2 OPPORTUNITIES2 OPPORTUNITIESOn-shore PennsylvaniaOn-shore PennsylvaniaOff-shore Gulf of MexicoOff-shore Gulf of Mexico
- Drilling resultsDrilling results- Return on investmentsReturn on investments
On-shore PennsylvaniaOn-shore Pennsylvania
On-shore: PennsylvaniaOn-shore: Pennsylvania

- TD @ 5,060’ in salt
- reached Marcellus shale @ 4,935’
- found 52’ Marcellus shale
On-shore: PennsylvaniaOn-shore: Pennsylvania
Is there
gas?Let’s look at the seismic & well
logs . . . .

On-shore: PennsylvaniaOn-shore: Pennsylvania
`MARCELLUSMARCELLUS
S N
4’ shaleno gas
56’ shale46’ gas
DISCOVERY
thickness ? gas ?
our prospect
52’ shaleno gas!
Why?
DRY HOLE!
DRY HOLE

On-shore: PennsylvaniaOn-shore: Pennsylvania
`
DISCOVERY
MARCELLUSMARCELLUS
S N
our prospect
1) no organic-rich deposits in our area of Marcellus
organic richnot organic rich
2) gas leaked out of Marcellus shale along fault
DRY HOLE

On-shore: PennsylvaniaOn-shore: Pennsylvania
`MARCELLUSMARCELLUS
S N
1) no organic-rich deposits in our area of Marcellus 2) gas leaked out of Marcellus shale along fault
our prospect
fault leaks
DRY HOLE!
DISCOVERYDRY HOLE
One million $ investor is broke!
Maxum Oil
CEO
On-shore: PennsylvaniaOn-shore: PennsylvaniaS N
our prospect
DRY HOLE!
One million $ investor is broke!
It’s not too late!
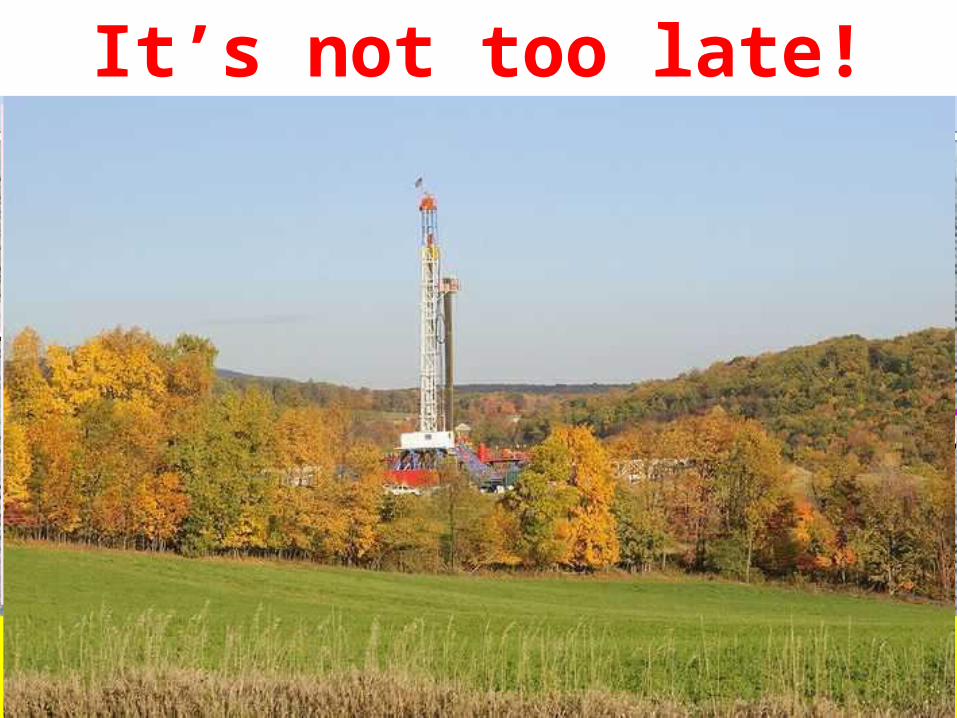
Upper Devonian Ohio Gas Shale

Rocks of Northeastern USA


extent of Ohio and related gas shales


Ladoga
Probable Extension of Ohio Gas Shale Play into IllinoisIn Illinois the Ohio Shale is Called the New Albany Shale
Your next investment?

VAGABOND GROUPVAGABOND GROUP
2 OPPORTUNITIES2 OPPORTUNITIESOn-shore PennsylvaniaOn-shore PennsylvaniaOff-shore Gulf of MexicoOff-shore Gulf of Mexico
- Drilling resultsDrilling results
Off-shore Gulf of MexicoOff-shore Gulf of Mexico
Off-shore: Gulf of MexicoOff-shore: Gulf of Mexico

- TD @ 16,624’ in salt
- reached Wilcox sand @ 12,500’
- found 2,166’ sand
Looking at the seismic data. . . .
Off-shore: Gulf of MexicoOff-shore: Gulf of Mexico
- discovered 520’ oil sands Let’
see!

saltWilcoxWilcox sandstones
sandstones
Off-shore: Gulf of MexicoOff-shore: Gulf of Mexico
water ~6000’BE
ST
Wilcox Sandstone Reservoirs?our prospect

Off-shore: Gulf of MexicoOff-shore: Gulf of Mexico
saltWilcoxWilcox sandstones
sandstones
water ~6000’
our prospect

Off-shore: Gulf of MexicoOff-shore: Gulf of Mexico
11,500’ - top sand
16,000’ - base sand
12,500’12,500’
14,666’ - base sand14,666’ - base sand- & sand- & sand- fault- fault

Off-shore: Gulf of MexicoOff-shore: Gulf of Mexico
16,000’ - base sand
12,500’12,500’
14,666’ - base sand14,666’ - base sand- & sand- & sand- fault- fault
16,604’ – top salt16,604’ – top salt

Off-shore: Gulf of MexicoOff-shore: Gulf of Mexico
12,500’12,500’
14,666’ - base sand14,666’ - base sand- & sand- & sand- fault- fault
16,604’ – top salt16,604’ – top saltthickness of Wilcox sandthickness of Wilcox sand = 2,166’= 2,166’
12,500’ – top sand12,500’ – top sand
14,666’ - base sand14,666’ - base sand
Let’s look at the well log . . . .
where’s
the oil!

Off-shore: Gulf of MexicoOff-shore: Gulf of Mexico
Presence of oil/gas
Reservoir Rocks(sandstones)
top sand: 12,500’ top sand: 12,500’
base sand: 14,666’ base sand: 14,666’
100’
520’
520 feet of ‘pay’
520 feet of ‘pay’
near base of sand!
near base of sand!

Off-shore: Gulf of MexicoOff-shore: Gulf of Mexico
??
520’ PAY520’ PAYnear base sandnear base sand
Lateral wellLateral well
Perhaps more pay?Perhaps more pay?
??

- Drilling resultsDrilling results- Return on investmentsReturn on investments
VAGABOND GROUPVAGABOND GROUP
2 OPPORTUNITIES2 OPPORTUNITIESOn-shore PennsylvaniaOn-shore PennsylvaniaOff-shore Gulf of MexicoOff-shore Gulf of Mexico

REMEMBER THE OFFSHORE BORDER DISPUTE?REMEMBER THE OFFSHORE BORDER DISPUTE?
33

OFFSHORE DEVELOPMENT OPTIONSOFFSHORE DEVELOPMENT OPTIONS
34
FPSOFPSO=FFloating, PProduction, SStorage, OOffloading (5840ft)

REMEMBER FPSO’S?REMEMBER FPSO’S?
35
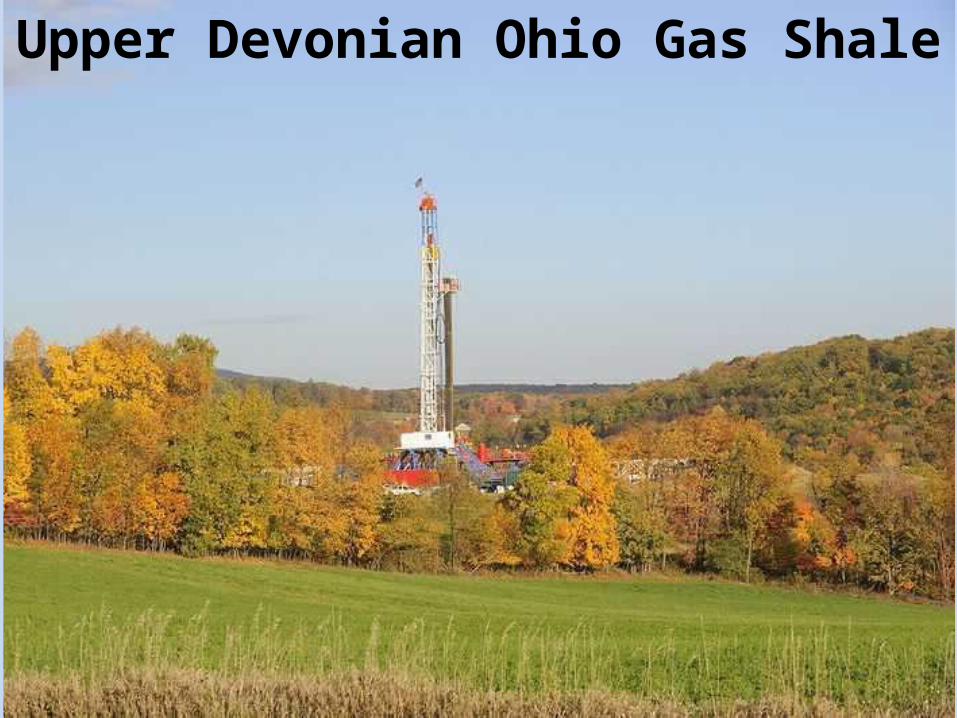
PETROLEUM ENGINEERPETROLEUM ENGINEER
36
Primary Jobs:
Reservoir Characterization
Production & Enhancements
Well Design & Drilling
36
EconomicAnalysis
Cove
red i
n CLA
SS N
o. 5
Cove
red i
n CLA
SS N
o. 5
Cove
red
in C
LASS
No.
6
Cove
red
in C
LASS
No.
6
37
Economic Analysis

OIL &GAS ECONOMICSOIL &GAS ECONOMICS
Oil PriceOil PriceOil PriceOil Price
Operating Operating &&
Investment Investment Cost Cost
Operating Operating &&
Investment Investment Cost Cost
Production Production RateRate
Production Production RateRate
38
RecoverabRecoverablele
ReservesReserves
RecoverabRecoverablele
ReservesReserves
Royalties Royalties &&
Working Working InterestInterest
Royalties Royalties &&
Working Working InterestInterest
O&G TaxO&G TaxAccountingAccountingO&G TaxO&G Tax
AccountingAccounting6 KEY FACTORS
IN O&G ECONOMIC ANALYSIS

OIL &GAS ECONOMICSOIL &GAS ECONOMICS
Technical• Worldwide
Reserves status
• Worldwide Production Capacity
• Refining Capacity
Political• OPEC’s Mood• Producing
country’s stability
• Balance of Power
Financial• Transaction
costs
Factors Affecting OIL PRICE
39
Economic• Worldwide
Supply & Demand
• Cost of Alternatives

OIL &GAS ECONOMICSOIL &GAS ECONOMICS
Selection• Quality of
seismic • Geologic &
Geophysical selection accuracy
Modeling• Recovery
Factor• Reservoir
modeling accuracy
Drive• Reservoir
drive mechanism
Factors AffectingRECOVERABLE
RESERVES
40
Physical Rock Properties
• Reservoir aerial extent
• Porosity• Permeabilit
y

OIL &GAS ECONOMICSOIL &GAS ECONOMICS
Downhole• Quality of
completions
Regulations• State
mandated allowables
ProductionFaciliities
• Capacity of Facilities
Factors AffectingPRODUCTION RATES
41
Reservoir• Rate of
Depletion• Byproducts
produced

OIL &GAS ECONOMICSOIL &GAS ECONOMICS
Royalties• Amount
paid to property owners
• Over-ride agreements
Factors AffectingROYALTIES &
WORKING INTEREST
42
Working Interest
• Major player or not

OIL &GAS ECONOMICSOIL &GAS ECONOMICS
Well Cost• Depth of
well• Amt of
logging• Byproducts
produced• Drilling
costs• Enhanced
recovery needed
Financial• Proximity to
market• Insurance
Costs
Operating• Disposal
Needed• Fuel costs• Personnel costs
& benefits
Factors AffectingOPERATING &
INVESTMENT COSTS
43
Production Facilities
• Design Efficiency
• Volume capacity

OIL &GAS ECONOMICSOIL &GAS ECONOMICS
Tax code is written specifically for O&G investing, is complex and must be handled by specialist
Factors AffectingO&G TAX
ACCOUNTING
44

OIL & GAS ECONOMICSOIL & GAS ECONOMICS
45
All of these factors result in an economic calculation to
determine the profitability of the project
The economic calculation is a called a
Net Present Value (NPV) calculation
NPV = ∑ (Income – Expense)*(1+DR)^t
The following examples will make this understandable…

OFFSHORE GOM, BAHA #2OFFSHORE GOM, BAHA #2
46

FUTURE PRODUCTION OFFSHOREFUTURE PRODUCTION OFFSHORE
47

SIMPLE NET PRESENT VALUESIMPLE NET PRESENT VALUE
48
OFFSHORE, GULF OF MEXICO, BAHA FIELD PRODUCING 100,000 BOPD INITIALLY
DECLINING EXPONENTIALLY OVER 10 YEARS
INFLATION DATA IS FROM
APRIL 1999 TO APRIL 2000

OTHER INVESTMENT RETURNSOTHER INVESTMENT RETURNS
52
STOCK DATA IS FROM APRIL 1999 TO APRIL
2000
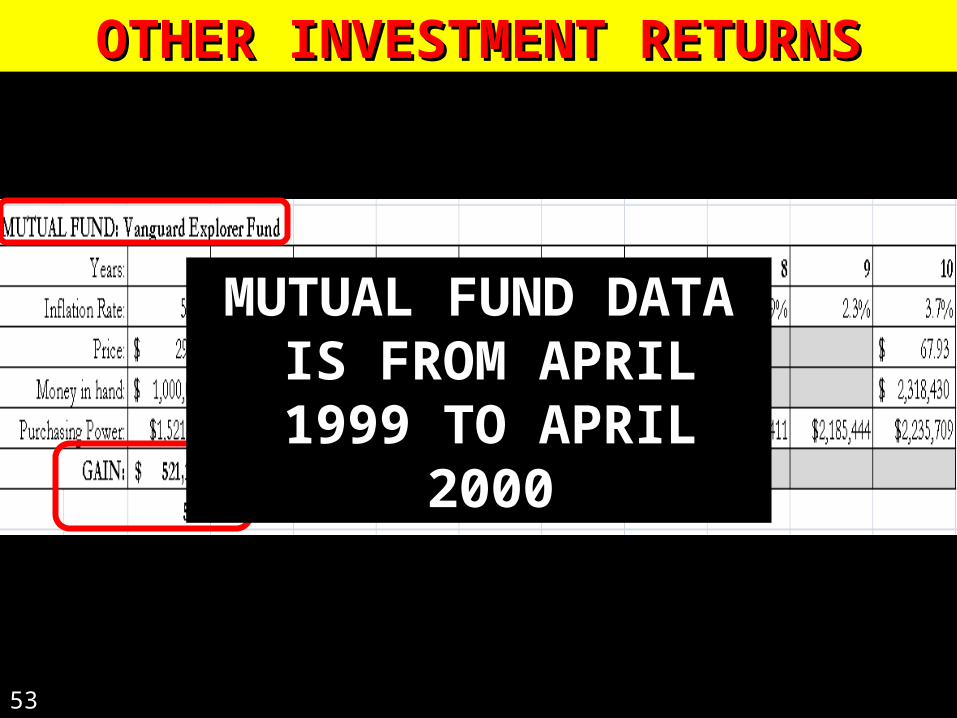
OTHER INVESTMENT RETURNSOTHER INVESTMENT RETURNS
53
MUTUAL FUND DATA IS FROM APRIL 1999 TO
APRIL 2000

OTHER INVESTMENT RETURNSOTHER INVESTMENT RETURNS
54
INFLATION DATA IS FROM
APRIL 1999 TO APRIL 2000
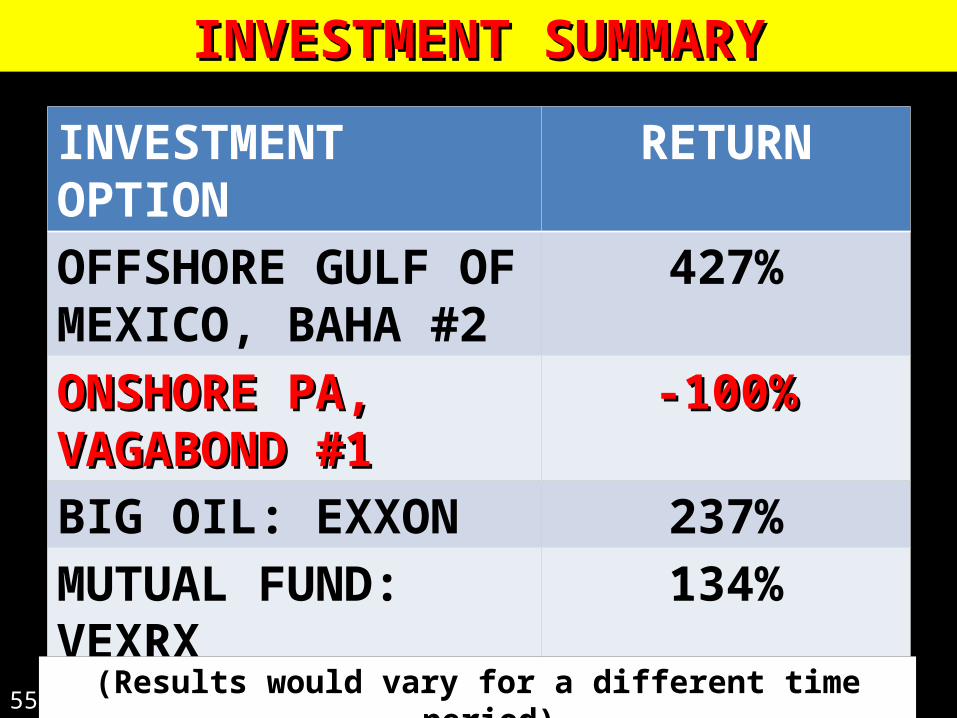
INVESTMENT SUMMARYINVESTMENT SUMMARY
55
INVESTMENT OPTION RETURNOFFSHORE GULF OF MEXICO, BAHA #2
427%
ONSHORE PA, ONSHORE PA, VAGABOND #1VAGABOND #1
-100%-100%
BIG OIL: EXXON 237%MUTUAL FUND: VEXRX 134%UNDER MATTRESSUNDER MATTRESS -11.4%-11.4%
(Results would vary for a different time period)

3 people made more than $5,000,000!$5,000,000!
‘Slim’ ‘Belle’s well’ Phyllis Dolich
PARTICIPANT RESULTSPARTICIPANT RESULTS% of Class% of Class Range of Range of ReturnsReturns
4%4% greater than greater than 5X5X the investmentthe investment
67%67% between between 2X to 5X 2X to 5X the investmentthe investment28%28% between between 1X to 2X1X to 2X the investment the investment1%1% ………………………………Lost it ALL!………………….Lost it ALL!………………….

VAGABOND OIL GROUPVAGABOND OIL GROUP
57
CONGRATSCONGRATSTo all theTo all the
Black Gold Black Gold Millionaires!Millionaires!

NEXT FALL?NEXT FALL?
Vagabonds Vagabonds TrampingTramping
the East African Riftthe East African Rift
EgyptEgypt

NEXT FALL?NEXT FALL?
Nile RiverNile River
Lake TanganyikaLake Tanganyika
The SerengetiThe Serengeti
Victoria FallsVictoria Falls
Zambezi RiverZambezi River
Mt KilimanjaroMt Kilimanjaro
Great Rift ValleyGreat Rift Valley
KenyaKenya
TanzaniaTanzania
ZimbabweZimbabwe
Hope to se
e you in September!
Hope to se
e you in September! EgyptEgypt

Thanks for the help . Thanks for the help . . .. .
Lynn LidelLynn LidelMargaret RaperMargaret Raper
THE ENDTHE ENDVAGABOND OIL GROUPVAGABOND OIL GROUP

61http://www.youtube.com/watch?v=Q9gGqNUxQ5Q
BOOKS/ARTICLES• Petroleum Geology, Exploration, Drilling, and Petroleum Geology, Exploration, Drilling, and
Production Production by Norman J. Hyne PhDby Norman J. Hyne PhD
• Money in the Ground Money in the Ground by John Orban, IIIby John Orban, III
• Let’s Talk Oil Deal Let’s Talk Oil Deal by John Orban, IIIby John Orban, III
• Economic Evaluation and Investment Decision Economic Evaluation and Investment Decision Methods Methods by Franklin J & John M. Stermoleby Franklin J & John M. Stermole
• Financial Accounting for Upstream Oil & Gas Financial Accounting for Upstream Oil & Gas ActivitiesActivities, Professional Development Institute, , Professional Development Institute, University of North TexasUniversity of North Texas
• Choosing a Perforation StrategyChoosing a Perforation Strategy, Schlumberger, Schlumberger
PERSONAL CONTACTS• Mike BeaumontMike Beaumont, Petroleum Engineer & , Petroleum Engineer &
Independent O&G Consultant, EuropeIndependent O&G Consultant, Europe
• David KarrsDavid Karrs, Petroleum Engineer, Chevron, , Petroleum Engineer, Chevron, USAUSA
• Bob GowerBob Gower, Finance & Accounting, Chevron, , Finance & Accounting, Chevron, Houston, TexasHouston, Texas
• Keith SeanardKeith Seanard, PE & Exploitation Mgr., Swift , PE & Exploitation Mgr., Swift Energy, Houston, TexasEnergy, Houston, Texas
• Frank KellyFrank Kelly, Petroleum Engineer, , Petroleum Engineer, Schlumberger, DubaiSchlumberger, Dubai
• Tako KoningTako Koning, Geologist & Independent O&G , Geologist & Independent O&G Consultant, West AfricaConsultant, West Africa
• Robin WrigleyRobin Wrigley, Independent O&G Consultant, , Independent O&G Consultant, UKUK
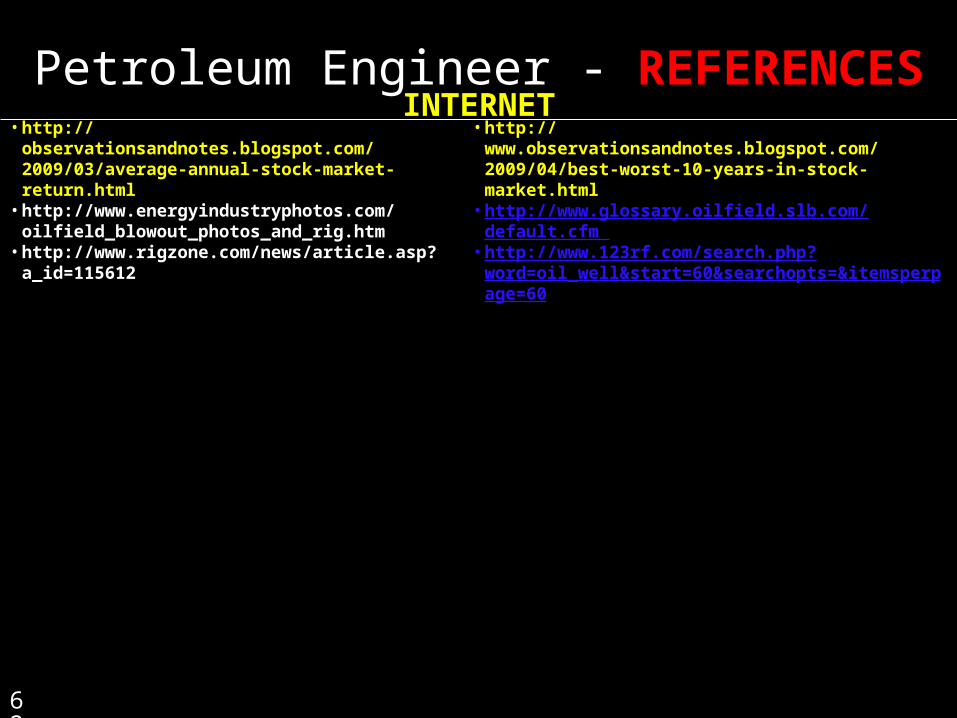
Petroleum Engineer - REFERENCESREFERENCES• http://www.observationsandnotes.blogspot.com/2009/04/http://www.observationsandnotes.blogspot.com/2009/04/
best-worst-10-years-in-stock-market.html best-worst-10-years-in-stock-market.html • http://www.glossary.oilfield.slb.com/default.cfm • http://www.123rf.com/search.php?
word=oil_well&start=60&searchopts=&itemsperpage=60
INTERNET
62
• http://observationsandnotes.blogspot.com/2009/03/http://observationsandnotes.blogspot.com/2009/03/average-annual-stock-market-return.html average-annual-stock-market-return.html • http://www.energyindustryphotos.com/
oilfield_blowout_photos_and_rig.htm • http://www.rigzone.com/news/article.asp?a_id=115612
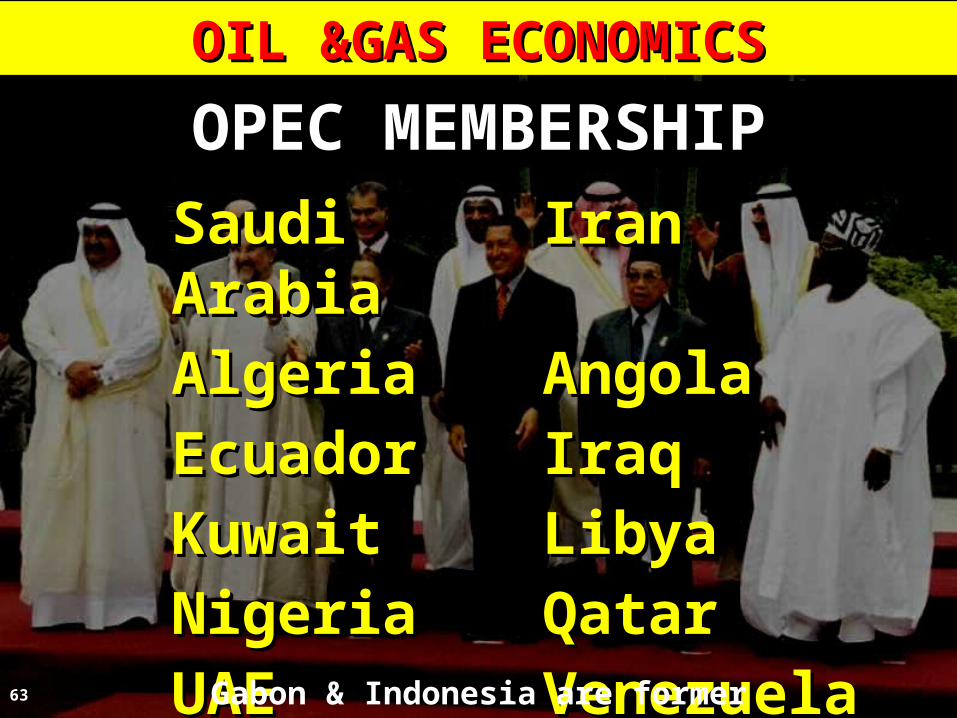
OIL &GAS ECONOMICSOIL &GAS ECONOMICS
OPEC MEMBERSHIP
63
Saudi ArabiaSaudi Arabia IranIranAlgeriaAlgeria AngolaAngolaEcuadorEcuador IraqIraqKuwaitKuwait LibyaLibyaNigeriaNigeria QatarQatarUAEUAE VenezuelaVenezuela
Gabon & Indonesia are former members

WIND ENERGYWIND ENERGY
64

WIND ENERGYWIND ENERGY
65
1 natural gas well produces: 2,400,000 cu ft per day
Or 100,000 cu ft/hour
Natural gas has approx. 1,000 BTU per cu ft
Therefore 1 well produces: 100,000,000 BTU per hour
1 standard wind turbine produces: 6,824,284 BTU/hr(2.0 MW wind turbine)
Therefore, 1 well is equivalent to 14.7 wind turbines (in the amount of energy produced)

WIND ENERGYWIND ENERGY
66
6400 ft
8300 ft
15 turbines15 turbinesneedneed
1,220 acres1,220 acres
15 turbines15 turbinesneedneed
1,220 acres1,220 acres
• 1 well takes 5 acres5 acres to drill; 15 wind turbines need 1,220 acres
• Therefore, wind turbines need 244X as much space and 4X as many roads
• 1 well cost = $2.1 million; 15 wind turbines = $52.5 million
• Therefore, wind turbines are 25X more expensive for the same amount of energy
67
Select investment time period
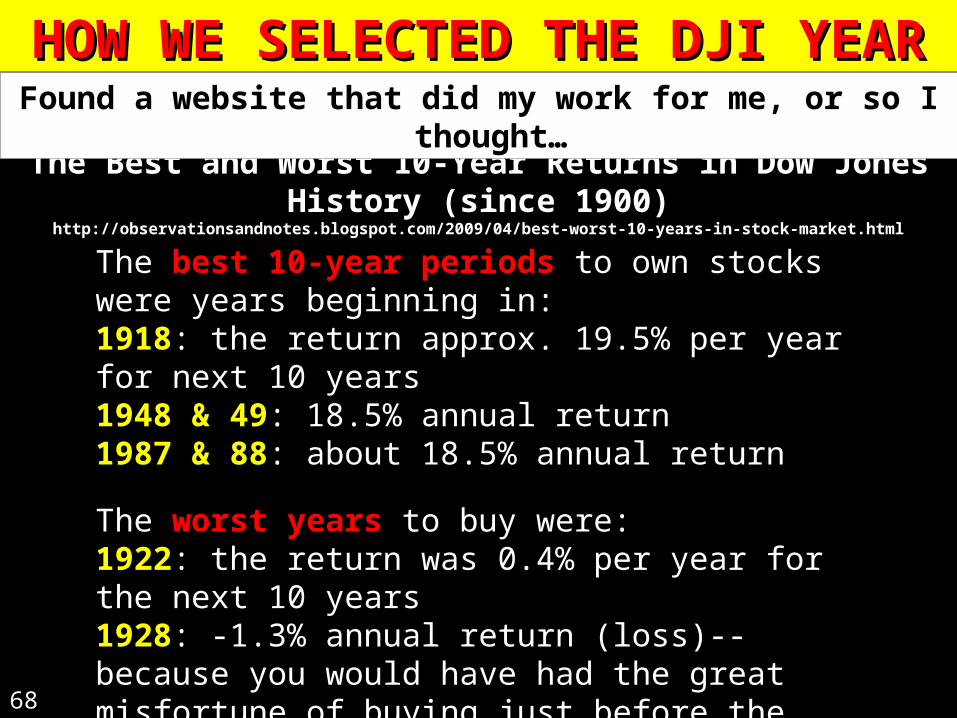
HOW WE SELECTED THE DJI YEARHOW WE SELECTED THE DJI YEAR
68
The best 10-year periods to own stocks were years beginning in:1918: the return approx. 19.5% per year for next 10 years 1948 & 49: 18.5% annual return 1987 & 88: about 18.5% annual return
The worst years to buy were:1922: the return was 0.4% per year for the next 10 years 1928: -1.3% annual return (loss)-- because you would have had the great misfortune of buying just before the 1929-1932 stock market crash. 1964: annual return of 0.3%
The Best and Worst 10-Year Returns in Dow Jones History (since 1900)http://observationsandnotes.blogspot.com/2009/04/best-worst-10-years-in-stock-market.html
Found a website that did my work for me, or so I thought…

HOW WE SELECTED THE DJI YEARHOW WE SELECTED THE DJI YEAR
69
Then used their chart to select years with average returns

HOW WE SELECTED THE DJI YEARHOW WE SELECTED THE DJI YEAR
70
But Exxon’s chart only goes back to 1970;Since most of Best/Worst years were before 1970, I
had to start over

DOW JONES INDUSTRIAL INDEX (‘70-’12)DOW JONES INDUSTRIAL INDEX (‘70-’12)
71http://finance.yahoo.com/charts#chart8:symbol=%5Edji;range=19700127,20120128;indicator=volume;charttype=line;crosshair=on;ohlcvalues=0;logscale=off
So, used the DJI chart from 1970 to present and selected 10 periods that gave a “normal”
distribution of possible returns

HOW WE SELECTED THE DJI YEARHOW WE SELECTED THE DJI YEAR
72 > > 12.512.5
%%
>4.0%< >4.0%< 12.5%12.5%
< < 4.0%4.0%

HOW WE SELECTED THE DJI YEARHOW WE SELECTED THE DJI YEAR
73
SORTED BY Order Picked out of Hat
Selection Start End Begin End 10 YR % Compd
Order Date Date Years Dow Dow Diff Return Annually
1 Jan-94 Jan-04 10.0 3636 10357 6721 184.8% 11.03%
2 Jan-99 Jan-09 10.0 9786 8447 -1339 -13.7% -1.46%
3 Jul-97 Jul-07 10.0 7945 13896 5951 74.9% 5.75%
4 Jan-85 Jan-95 10.0 1267 4158 2891 228.2% 12.61%
5 Jan-95 Jan-05 10.0 4157 10504 6347 152.7% 9.71%
6 Oct-89 Oct-99 10.0 2753 11497 8744 317.6% 15.36%
7 Apr-90 Apr-00 10.0 2881 10447 7566 262.6% 13.74%
8 Jan-02 Jan-12 10.0 10404 12980 2576 24.8% 2.24%
9 Jan-73 Jan-83 10.0 951 1130 179 18.8% 1.74%
10 Jan-87 Jan-97 10.0 2305 6583 4278 185.6% 11.06%
Don was asked to select a number from 1 to Don was asked to select a number from 1 to 10; he chose 7 10; he chose 7

74
O&G Economic Overview

75
Balancing RisksBalancing Risks
• 3000 Oil & Gas Companies in the USA3000 Oil & Gas Companies in the USA• 2 Key Attributes: 2 Key Attributes: Finding O&GFinding O&G & & Managing RiskManaging Risk
• What What riskrisk you say??.... you say??....
Company ACompany A StrengthStrength WeaknessWeakness
Company BCompany B WeaknessWeakness Strength Strength
Company CCompany C StrengthStrength StrengthStrength

76
Risk MitigationRisk Mitigation
Include table from Money in the Ground, page 212, figure
“To what extent can O&G Investments risks be avoided,
controlled or minimized?
From “Money in the Ground” by Orban
If you do:
• DUE DILIGENCE• PLANNING &• THOUGHTFUL
PREPARATIONYou can avoid:• 100% stupid mistakes• 80% of excessive drlg costs• 70% of excessive prod costs• Etc.

SIX PRINCIPLE ECONOMIC FACTORSSIX PRINCIPLE ECONOMIC FACTORS
77
(and attributes that cause (and attributes that cause riskrisk of that factor)of that factor)
• Price of oil (POO) Price of oil (POO) (OPEC’s “mood”, worldwide supply/demand, (OPEC’s “mood”, worldwide supply/demand, weather, market speculation, standby production capacity, political weather, market speculation, standby production capacity, political instabilities, refining capacity, etc.)instabilities, refining capacity, etc.)
• Recoverable Reserves (RR) Recoverable Reserves (RR) (reservoir aerial extent, thickness, (reservoir aerial extent, thickness, porosity, permeability, reservoir drive mechanism, etc.)porosity, permeability, reservoir drive mechanism, etc.)
• Production Rate (PR) Production Rate (PR) (State mandated Allowables, depletion (State mandated Allowables, depletion curve, byproducts produced, etc.)curve, byproducts produced, etc.)
• Operating & Investment Cost (OIC) Operating & Investment Cost (OIC) (depth of well, (depth of well, byproducts produced, proximity to market, steel supply/demand, type byproducts produced, proximity to market, steel supply/demand, type drilling contract, amount of logging done, volume capacity of producing drilling contract, amount of logging done, volume capacity of producing facilities, disposal issues, water and fuel source, insurance cost, etc.)facilities, disposal issues, water and fuel source, insurance cost, etc.)

SIX PRINCIPLE ECONOMIC FACTORSSIX PRINCIPLE ECONOMIC FACTORS
78
• Ownership: Working Interest, Royalties & Ownership: Working Interest, Royalties & Overrides (WI, ROY, OR) Overrides (WI, ROY, OR) (ownership subject to priority (ownership subject to priority overrides, calculating working interest in O&G properties is not overrides, calculating working interest in O&G properties is not straightforward as you might think)straightforward as you might think)
• Oil & Gas Accounting (TAX) Oil & Gas Accounting (TAX) (tax code is written specifically (tax code is written specifically for O&G investing, is complex and must be handled by specialist; for O&G investing, is complex and must be handled by specialist; accounting methods of successful efforts or full cost; handling of accounting methods of successful efforts or full cost; handling of depletion allowance, etc.)depletion allowance, etc.)
(and attributes that cause (and attributes that cause riskrisk to that factor)to that factor)

Distribution of USA Wells by ProductionDistribution of USA Wells by Production
77.4% of all USA Producing wells
produce less than
10 BOPD
35% of all USA Producing wells
produce between
0 & 1 BOPD
98.5% of all USA Producing wells produce
less than 100 BOPD
79
80
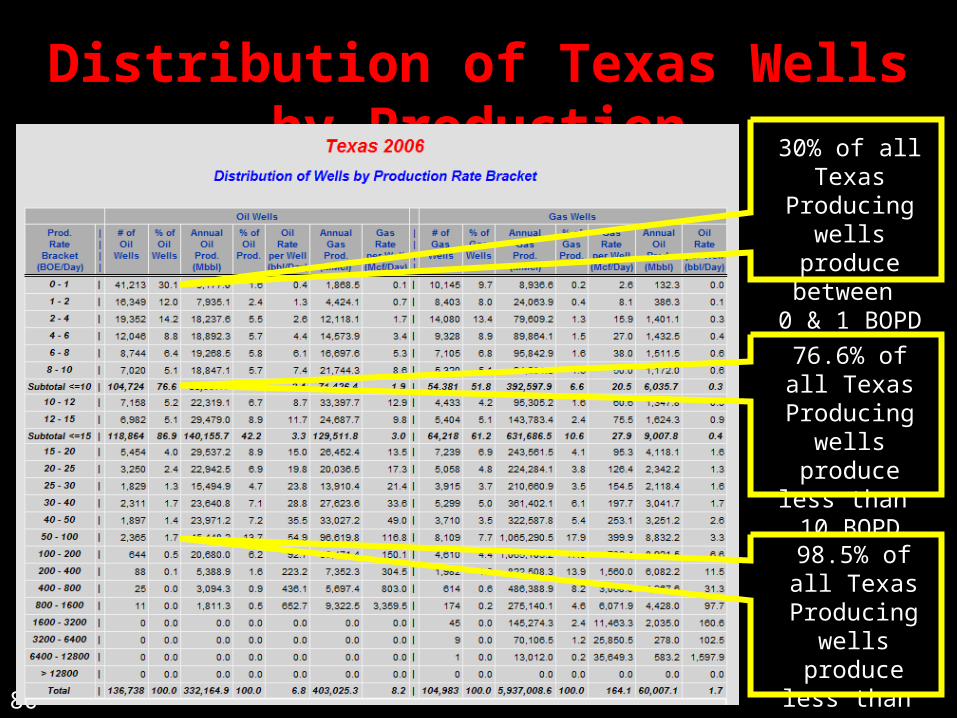
Distribution of Texas Wells by ProductionDistribution of Texas Wells by Production
76.6% of all Texas Producing
wells produce less than 10 BOPD
30% of all Texas Producing wells
produce between
0 & 1 BOPD
98.5% of all Texas
Producing wells produce less
than 100 BOPD

81
Operating Costs – Onshore, Oil WellOperating Costs – Onshore, Oil Well
82
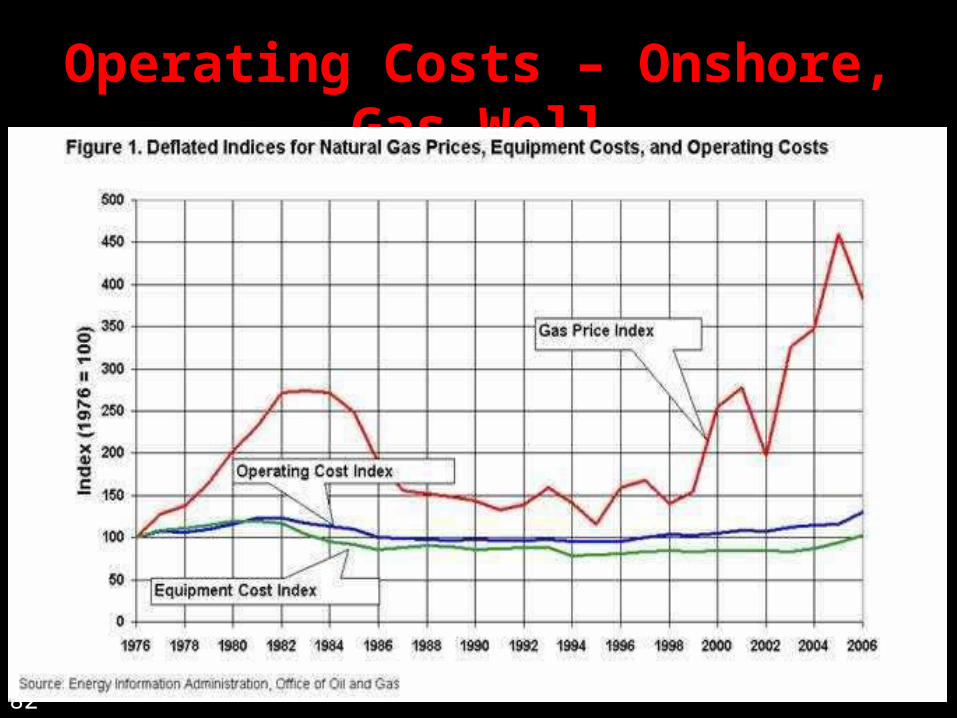
Operating Costs – Onshore, Gas WellOperating Costs – Onshore, Gas Well

ECONOMIC ANALYSISECONOMIC ANALYSIS
83
• The bottomline in any financial investment The bottomline in any financial investment decision is what is the NPV (decision is what is the NPV (net present value of net present value of the cash flow streamthe cash flow stream) generated by this ) generated by this investmentinvestment
• NPV is therefore a combination of the six NPV is therefore a combination of the six principle factors in these generalized equations:principle factors in these generalized equations:
• RevenueRevenue = PR x POO x (WI+ROY-OR) = PR x POO x (WI+ROY-OR)
• CostsCosts = OIC x TAX adjusts = OIC x TAX adjusts
• NPVNPV = (Revenue – Costs) per period = (Revenue – Costs) per period discounted at some discount ratediscounted at some discount rate

ECONOMIC ANALYSISECONOMIC ANALYSIS
84
• In conjunction with NPV, modern risk analysis uses In conjunction with NPV, modern risk analysis uses Expected Value Theory for investing in a “pool” of Expected Value Theory for investing in a “pool” of propertiesproperties
• Example:Example:
(all costs in(all costs in
$1000’s)$1000’s)
• The cost of the “deal” should be no more than $150The cost of the “deal” should be no more than $150
Possible Outcomes
NPV Value
Probability of Outcome
Probability Weighted
Value
Successful WellSuccessful Well $1,000$1,000 10%10% $100$100
Successful WellSuccessful Well $250$250 20%20% $50$50
Dry HoleDry Hole $ 0$ 0 70%70% $ 0$ 0
Expected Expected Value Value $150$150
Very
O&G BUSINESS CYCLEO&G BUSINESS CYCLE
85 From “Money in the Ground” by Orban
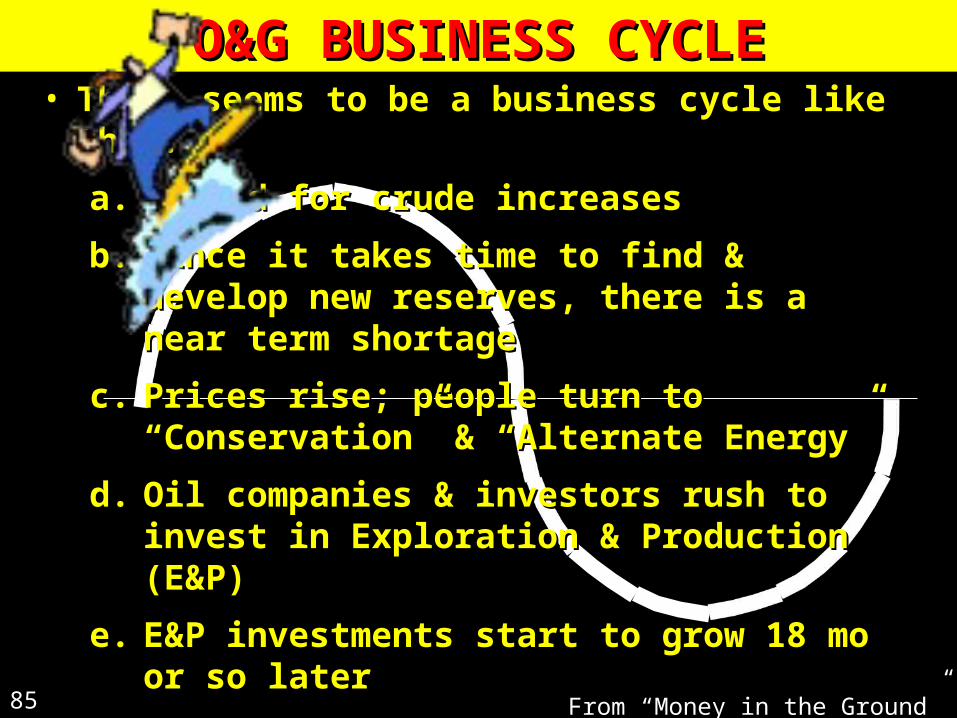
• There seems to be a business cycle like this:There seems to be a business cycle like this:
a.a. Demand for crude increasesDemand for crude increases
b.b. Since it takes time to find & develop new reserves, Since it takes time to find & develop new reserves, there is a near term shortagethere is a near term shortage
c.c. Prices rise; people turn to “Conservation” & Prices rise; people turn to “Conservation” & “Alternate Energy”“Alternate Energy”
d.d. Oil companies & investors rush to invest in Oil companies & investors rush to invest in Exploration & Production (E&P)Exploration & Production (E&P)
e.e. E&P investments start to grow 18 mo or so laterE&P investments start to grow 18 mo or so later
f.f. Supply floods the market, prices recede; people Supply floods the market, prices recede; people “forget” about conservation“forget” about conservation
g.g. Eventually, demand starts rising againEventually, demand starts rising again

ECONOMIC ANALYSISECONOMIC ANALYSIS
86
• In summary:In summary:• Oil & Gas investing is a risky businessOil & Gas investing is a risky business
• Understand the components of riskUnderstand the components of risk
• Invest with experienced, reputable companies with a Invest with experienced, reputable companies with a very good track record of both finding hydrocarbons and very good track record of both finding hydrocarbons and minimizing risksminimizing risks
• Use investment specialists as requiredUse investment specialists as required
• Catch the O&G business cycle at the right timeCatch the O&G business cycle at the right time

WHERE DID WEIRD IDEA COME FROM?WHERE DID WEIRD IDEA COME FROM?
88
Spotted the concept of an oil platform attacked on the web, of course. Built the idea
from there.