Embed Size (px)
Citation preview

UWB Emission Measurements
Jun-ichi TAKADATokyo Institute of Technology
University of Oulu, September 23, 2005

Outline
1. Background2. Impact to existing systems and regulatory issues3. Spectral emission mask4. UWB parameters5. Frequency domain vs time domain
measurements6. Measurement conditions7. Frequency domain measurements8. Time domain measurements

Outline
1. Background2. Impact to existing systems and regulatory issues3. Spectral emission mask4. UWB parameters5. Frequency domain vs time domain
measurements6. Measurement conditions7. Frequency domain measurements8. Time domain measurements

Focus
● UWB devices may cause the interference to other existing systems.
● The emissions from UWB devices shall be regulated.

ITU
● International Telecommunication Union● Established in 1932 as a merger of International
Telegraph Union (1865) and International Radio Consultative Committee (CCIR, 1906)
● Oldest UN organization● Coordination of the international rules and
standards for telecommunications● Headquarter in Geneva, Switzerland

ITU
● Three sectors– Telecommunications(ITU-T)– Radiocommunications(ITU-R)– Development(ITU-D)

ITUーR● Radiocommunication sector● Radio Regulations (RR)
– fundamental law of ITU-R– World Radio Conference (WRC)
● Every 3 years for RR revision● Two consequent WRCs
one to approve as a topic, another to approve the revision.
Standardization activity in ITU-R
● SG (study group) 1Spectrum administration
● TG (task group) 1/8Compatibility between ultra-wideband devices (UWB) and radiocommunication services

Current status of UWB in ITU-R
Cumbersome system in regulation● UWB does not belong to any
radiocommunication services.● No frequency is assigned for UWB.
● Impact study to existing radiocommunication services in TG 1/8

1) January 21-24, 2003 in Geneva2) October 27-31, 2003 in Geneva3) June 9-18, 2004 in Boston4) November 3-12, 2004 in Geneva5) May 18-27, 2005 in San Diego6) October 12-20, 2005 in Geneva (final)
This lecture is based on the results of 5th meeting.
ITU-R TG 1/8 meeting

Structure of ITU-R TG 1/8
Four working groups (WGs)● WG1: UWB characteristics● WG2: impact to existing services● WG3: frequency management framework● WG4: measurement techniques
– Each WG drafts the new recommendation.
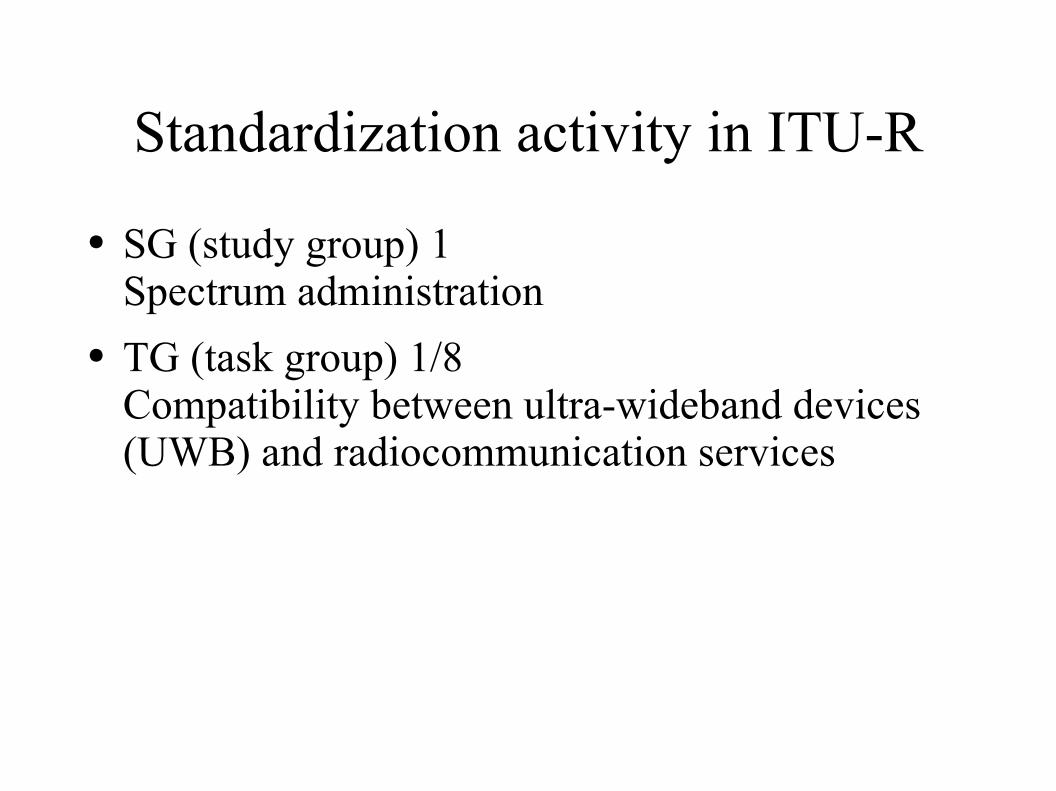
Flow of the approval of new recommendation
● TG 1/8– PDNR (preliminary draft new recommendation)
● SG1– DNR (draft new recommendation)
● Vote of member countries by post– NR (new recommendation)

Outline
1. Background2. Impact to existing systems and regulatory issues3. Spectral emission mask4. UWB parameters5. Frequency domain vs time domain
measurements6. Measurement conditions7. Frequency domain measurements8. Time domain measurements

Impact of UWB on radiocommunication services
● Originally called “Compatibility”– UWB does not belong to any radiocommunication
services.Not necessary to be compatible
● Study of the impact to every service within the frequency that UWB systems use.
● WG 2 in charge

Services under study (1)
● Mobile service (SG 8)– Land mobile services except IMT-2000– Maritime mobile service– Aeronautical service (ANRS)– IMT-2000 and systems beyond IMT-2000– Wireless access systems including RLANs– Amateur and amateur-satellite service– Meteorological radar
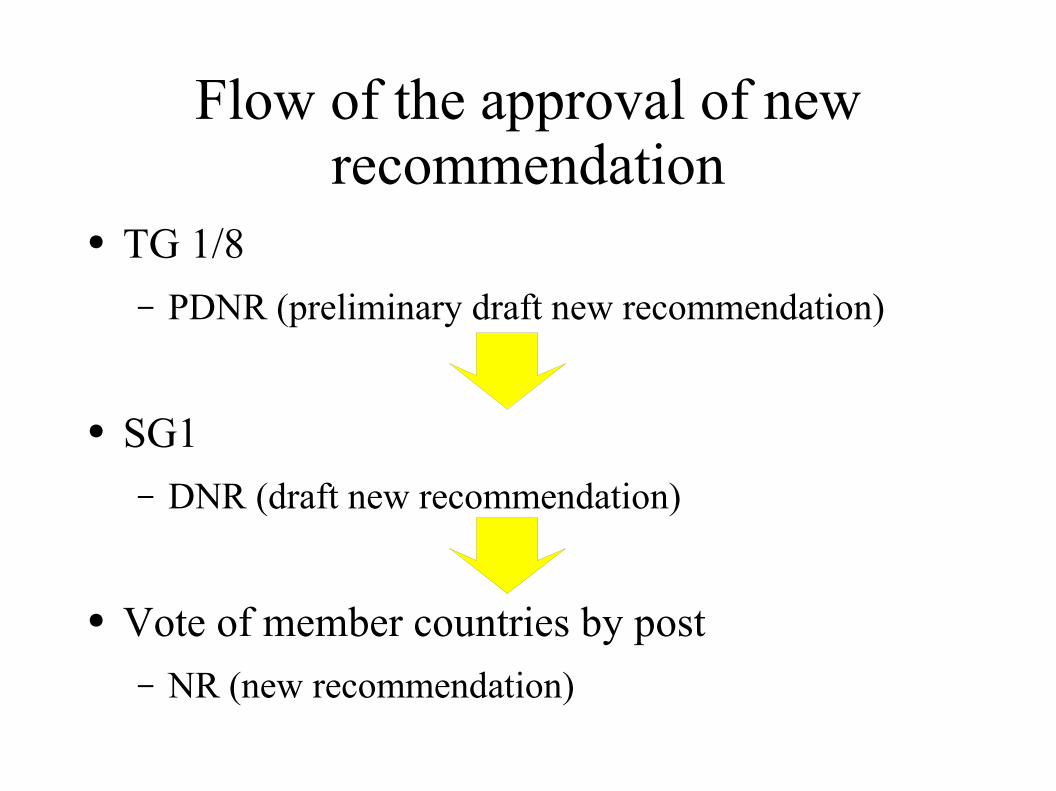
Services under study (2)
● Fixed service (SG 9)● Fixed-satellite service (SG 4)● Mobile-satellite services and the radionavigation
satellite service (SG8) – Mobile-satellite service (MSS)– Radionavigation satellite service (RNSS)

Services under study (3)
● Broadcasting service (SG 6)– Terrestrial broadcasting– Satellite broadcasting
● Science services (SG 7)– Earth exploration-satellite service (EESS)– Radio astronomy service (RAS)<passive services; most difficult to protect>

Two methodologies for impact study
● Impact of a single UWB device– Applicable to mobile terminals etc.
● Impact of an aggregation of UWB devices– Applicable to satellite uplink etc.

Impact of a single UWB device
● EIRPMAX
= IMAX
− BWCF − GR(θ) + L
P + L
R
EIRPMAX
= maximum permitted e.i.r.p. of interfering device, in dBm/MHz
IMAX
= maximum permissible interference level at receiver input, normalised in dBm/MHz
BWCF = bandwidth correction factor to correct for power of UWB signal in victim receiver IF bandwidth
GR(θ) = victim receiver’s antenna gain, in dBi
LP = propagation loss between Tx and Rx antennas, in dB
LR = loss between the receiver antenna and receiver input, in dB
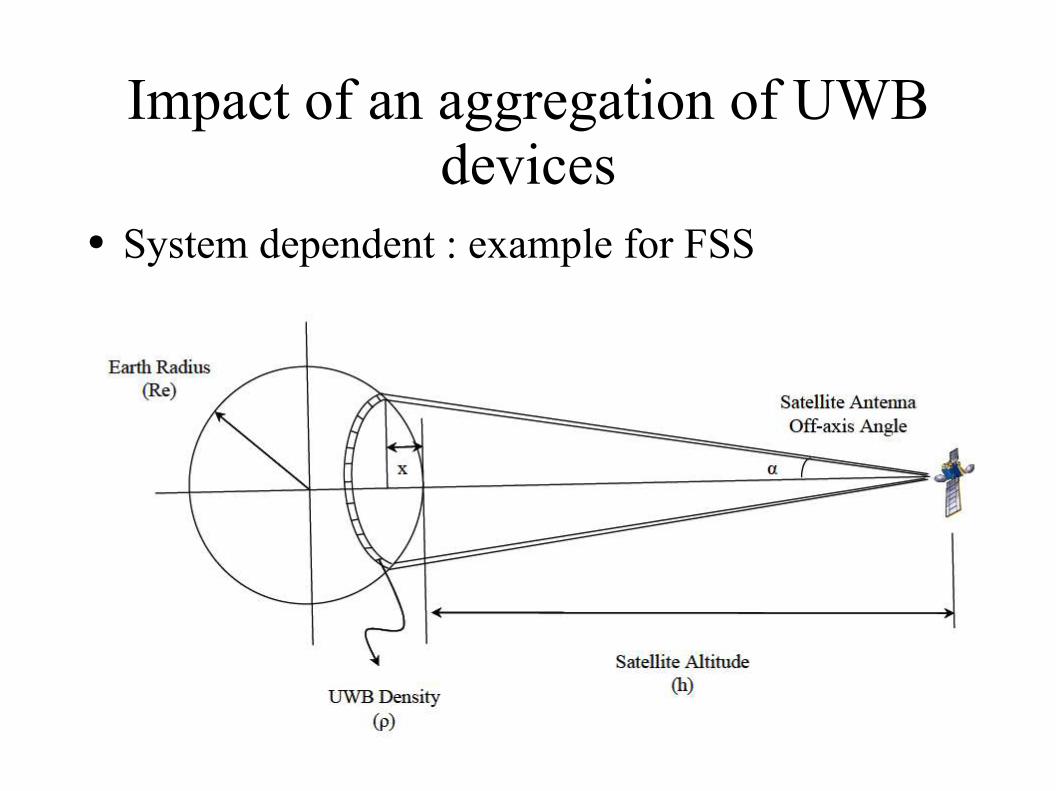
Impact of an aggregation of UWB devices
● System dependent : example for FSS
Maximum permissible interference level at receiver
● I/N = −20 dB : definition of RR<legacy of analog systems>
● Some services use more realistic value.<As victim people evaluate the value, it tends to
be pessimistic to UWB.>

Summary of impact study
Summary by Ministry of Internal Affairs, Japan
−20
−40
−60
−80
−100
1000−120
2000 3000 4000 5000 6000 7000 8000 9000 10000MHz
11000
dBm
/MH
z
FCC indoor
TG 1/8 WG2

Outline
1. Background2. Impact to existing systems and regulatory issues3. Spectral emission mask4. UWB parameters5. Frequency domain vs time domain
measurements6. Measurement conditions7. Frequency domain measurements8. Time domain measurements

Spectral mask
● EMC-like approach– Same treatment as unintended radiation– Necessary bandwidth, occupied bandwidth, unwanted
emissions, out-of-band domain and spurious domain do not apply to UWB.
● Upper-limit of effective isotropic radiated power spectral density
● WG1 originally in charge; now under WG 3
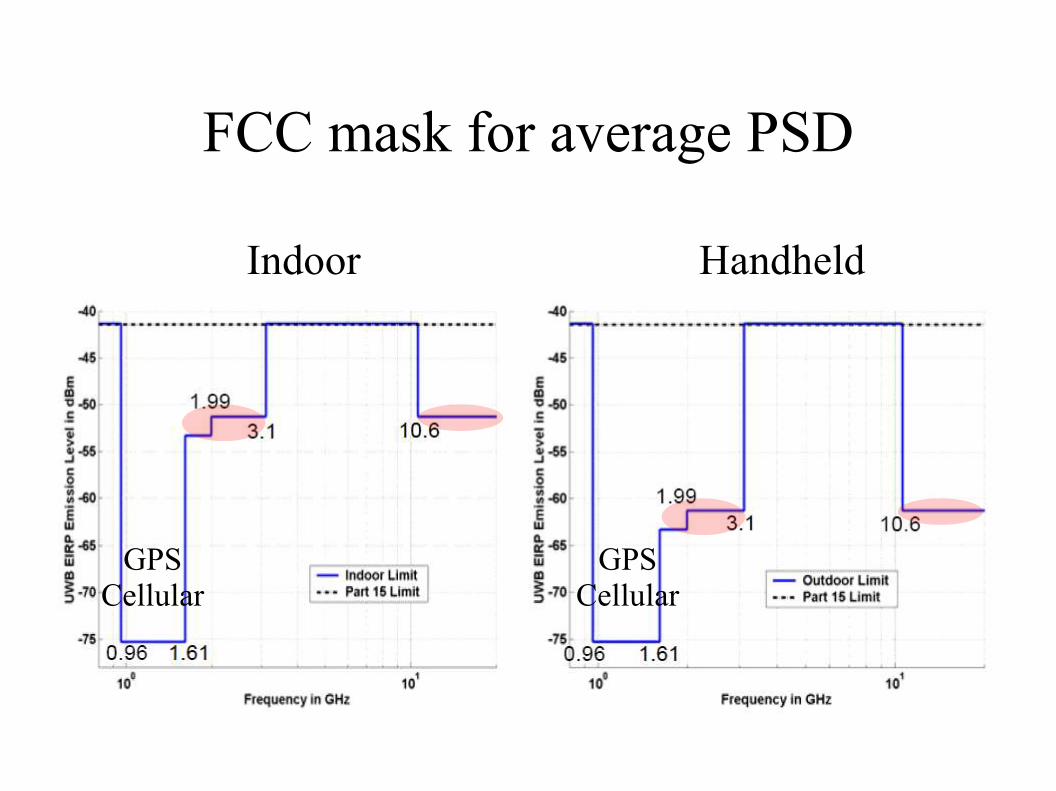
FCC mask for average PSD
Indoor Handheld
GPSCellular
GPSCellular
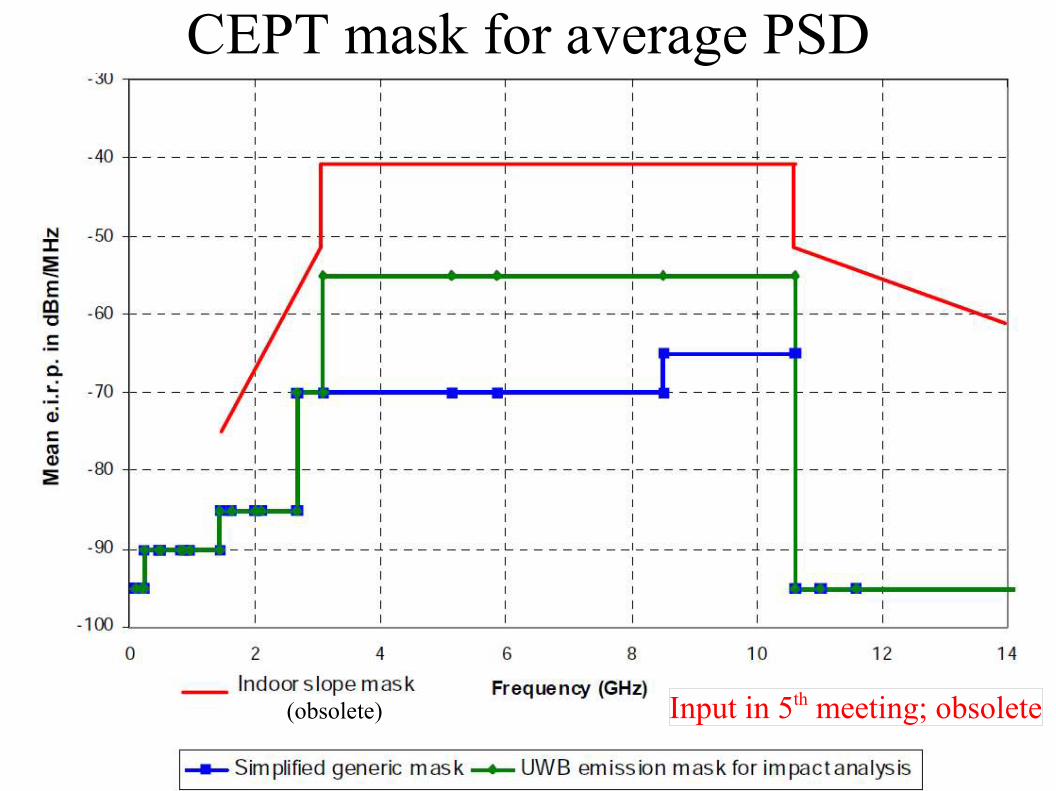
CEPT mask for average PSD
(obsolete) Input in 5th meeting; obsolete

Japanese mask for average PSD
To be input to next TG 1/8 meeting
-70 dBm/MHz; -41.3 dBm/MHz if with detection and
avoid (DAA) technique
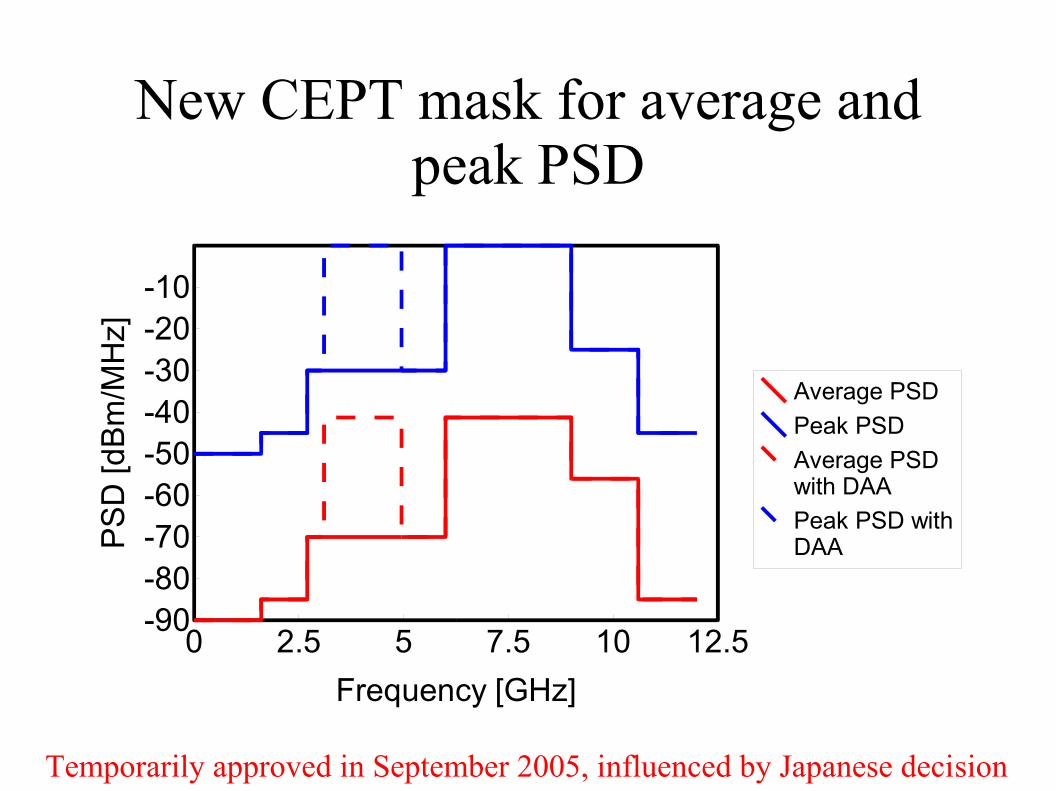
New CEPT mask for average and peak PSD
0 2.5 5 7.5 10 12.5-90-80-70-60-50-40-30-20-10
Average PSDPeak PSDAverage PSD with DAAPeak PSD with DAA
Frequency [GHz]
PS
D [d
Bm
/MH
z]
Temporarily approved in September 2005, influenced by Japanese decision

Outline
1. Background2. Impact to existing systems and regulatory issues3. Spectral emission mask4. UWB parameters5. Frequency domain vs time domain
measurements6. Measurement conditions7. Frequency domain measurements8. Time domain measurements

Measurement technique
● Effective isotropic radiated power (EIRP)– Emission measurement
● Power spectral density, not total power– Victim systems are band-limited.– Victim receivers have BPF in RF frontend.
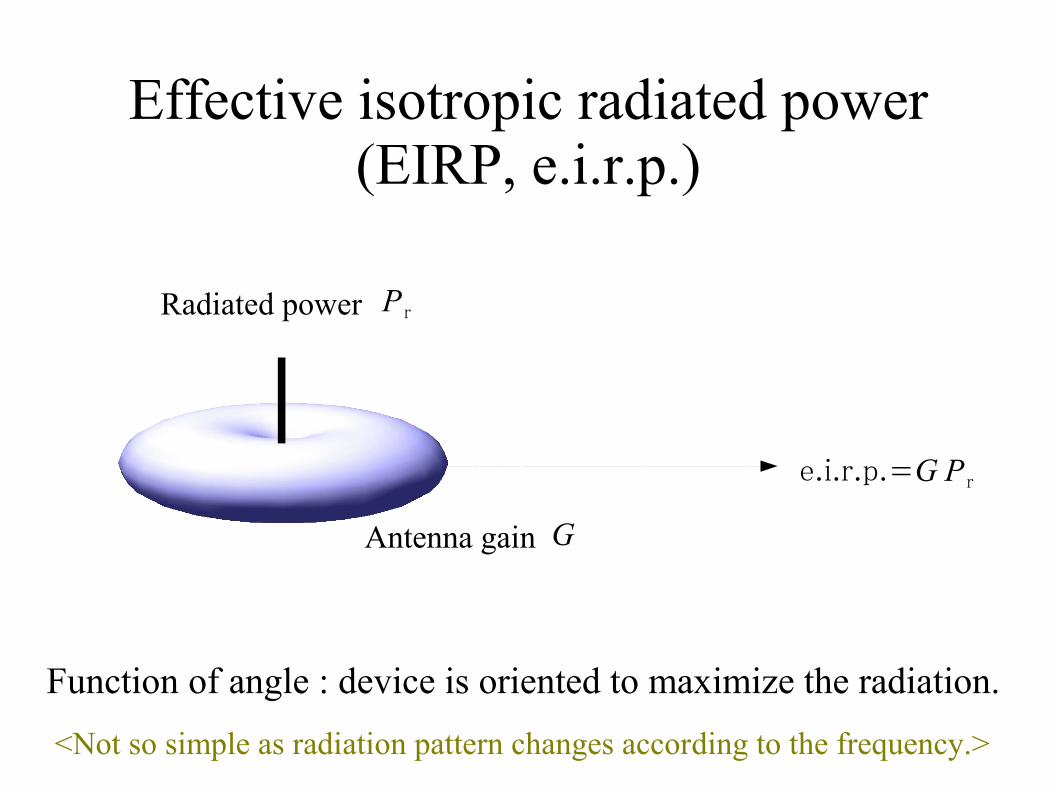
Effective isotropic radiated power (EIRP, e.i.r.p.)
Radiated power
Antenna gain
Function of angle : device is oriented to maximize the radiation.
P r
G
e.i.r.p.=G P r
<Not so simple as radiation pattern changes according to the frequency.>

Different detectors for EIRP (1)
Below 1 GHz● CISPR quasi-peak detector
– Compatibility with EMC measurements– Designed for compatibility with analog systems

Different detectors for EIRP (2)
Above 1 GHz : two detectors for different criteria● Average
– Limit of C/I for existing systems● Peak
– Saturation of LNA in existing receivers

Definition of UWB (1)
Defined by using UWB −10 dB bandwidth ● at least 500 MHz, or● fractional bandwidth greater than 0.2

Definition of UWB (2)
Definition of UWB −10 dB bandwidth B−10
fM
Peak
EIR
PSD P
max
Pmax
−10
FrequencyfH
fL
fL
fH

Outline
1. Background2. Impact to existing systems and regulatory issues3. Spectral emission mask4. UWB parameters5. Frequency domain vs time domain
measurements6. Measurement conditions7. Frequency domain measurements8. Time domain measurements

Two alternative approaches for measurement
● Frequency domain measurement– Spectrum analyzer– Standard approach
● Time domain measurement– Oscilloscope– Full band measurement suitable for peak– Useful for device evaluation but not suitable for
regulatory measurements

Outline
1. Background2. Impact to existing systems and regulatory issues3. Spectral emission mask4. UWB parameters5. Frequency domain vs time domain
measurements6. Measurement conditions7. Frequency domain measurements8. Time domain measurements

Test site
● Radiation measurement● 3 m separation
– Anechoic chamber– Semi-anechoic chamber (below 1,000 MHz only) – Open area test site <not so quiet in reality>
● Detection of peak radiation by rotating DUT<Peak direction is frequency dependent.>

Radiation measurement
Measurementreceiver
Measurementantenna
turntable
DUT
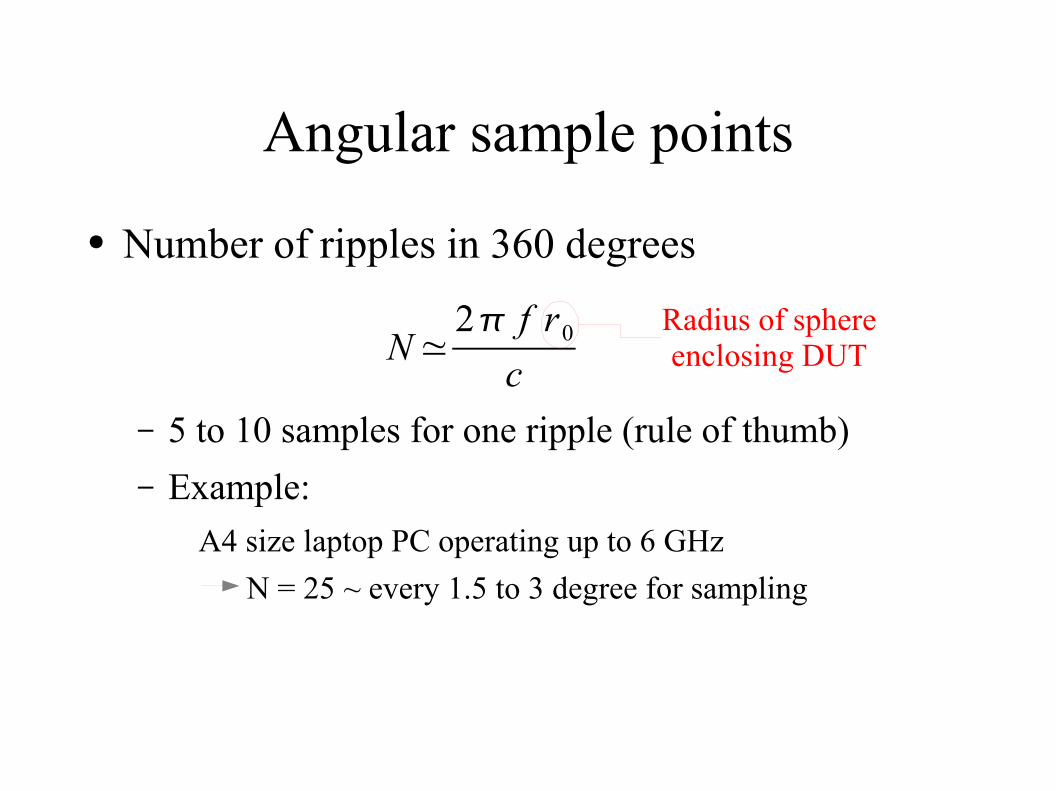
Angular sample points
● Number of ripples in 360 degrees
– 5 to 10 samples for one ripple (rule of thumb)– Example:
A4 size laptop PC operating up to 6 GHz N = 25 ~ every 1.5 to 3 degree for sampling
N≃2 f r0
cRadius of sphereenclosing DUT

Outline
1. Background2. Impact to existing systems and regulatory issues3. Spectral emission mask4. UWB parameters5. Frequency domain vs time domain
measurements6. Measurement conditions7. Frequency domain measurements8. Time domain measurements

Spectrum analyzer
Agilent application note 150
Resolutionbandwidth

Spectrum analyzer characteristics
● Super heterodyne architecture● Sweep frequency local oscillator (LO)
– Sample timing for each frequency bin is different.● Results influenced by
– Sweep time– Measurement time window– Duty ratio– Pulse repetition frequency
● Low sensitivity – high NF

State-of-art digital-IF spectrum analyzer
Agilent application note 150
Sampling rate of ADC is about 30 Msps independent of RBW.

Quasi-peak (QP) measurement
● Below 1,000 MHz● CISPR-16 QP detector <for EMC>
– Time constant of detector is 550 ms <time consuming>
● Peak detector for preliminary test– peak PSD > QP PSD

Average measurement
● 1MHz resolution bandwidth (RBW) Gaussian filter with 3 dB bandwidth
● RMS average value ● Averaging time below 1 ms
Longeraverage
time
HigherpulsepowerLower
pulserepetitionfrequency

Average measurement: example
Time
SA o
utpu
t (sa
mpl
e)
Averaging window: 1 ms
Average PSD value

Peak measurement (1)
● Peak power is defined for 50 MHz bandwidth.
● Frequency with maximum radiation fM
is used. <only for critical frequency>
BPF LNA
Received signal is not directly input to LNA but to BPF.BW of BPF is 50 MHz at maximum.
Rx frontend

Peak measurement (2)
● 1 MHz 」 RBW 」 50 MHz for measurement
For wider RBW:● Non-Gaussian● Phase distortion
Optimistic result

Peak measurement: example
Time
SA o
utpu
t (sa
mpl
e)
Peak PSD value

Peak measurement (3)
● 20log(RBW/50) [dB] <voltage sum law> is added for scaling.
RBW1 MHz
RBW3 MHz
Impulsive signal
Noise-like signal
1:3 in amplitude
1:3 in power
Appropriate for impulse; conservative for noise-like signal.

Choice of video filter
VBWウ 3 エ RBW or just bypass

Measurement in reverberation chamber
Randomization of internal EM field– Same mechanism as
multipath fading
Substitution method– Comparison with standard
source.
Used to find fM
and rough spectrum

Noise EIRP of spectrum analyzer (1)
● Noise power of the receiver N [dB/Hz] = 10 log
10 kTB + F
k = 1.38 × 10⁻²³ J/K : Boltzmann’s constantT K : temperature of receiver <290 K>B Hz : receiver noise bandwidthF dB : noise figure

Noise EIRP of spectrum analyzer (2)
● Noise power of Rx for 1 MHz bandwidth N [dBm/MHz] = −114 + F
– F = 18–24 dB for SA

Noise EIRP of spectrum analyzer (3)
● Friis' transmission formula– Relation between EIRP P
te and Rx power P
r
Pr = P
te + 20 log
10 λ − 20 log
10(4πd) + G
r
λ m: wavelength <2.5 – 10 cm>d m: distance between DUT and Rx antenna <3 m>G
r dB: Rx antenna gain <2−4 dBi>
● Equivalent noise EIRP– −50 to −60 dBm/MHz

Low level emission measurement
● It is impossible to measure EIRP at 3 m from DUT due to noise.– Minimum measurement range is −40 to −50
dBm/MHz EIRP with 10 dB SNR.● Scaling law of 20dB/decade is used assuming far
field condition.– Usually conservative in near field region.
● LNA shall be used.

Radiometric measurement for very low level emission
Absorptive wall 290 K
EUT 2.1*106K
Low Noise Amplifier 1-2 GHz
Noise Figure 1 dB Gain 40 dB
Spectrum Analyser Noise Figure 26 dB
Resolution Bandwidth 1 MHz
Coaxial Cable 10 m
Loss 2.5 dB
Radiometer Double Ridged Guided Horn Antenna
ON/OFF
Radiometry●Measurement of background + DUT emission●Subtraction of background noise●Same approach as radio astronomy

Conducted measurement (1)
Direct connection between SA and antenna port
Measurementreceiver
DUT withantenna terminal
DUT withexternal antenna
TRP
EIRP=TRP + antenna gain
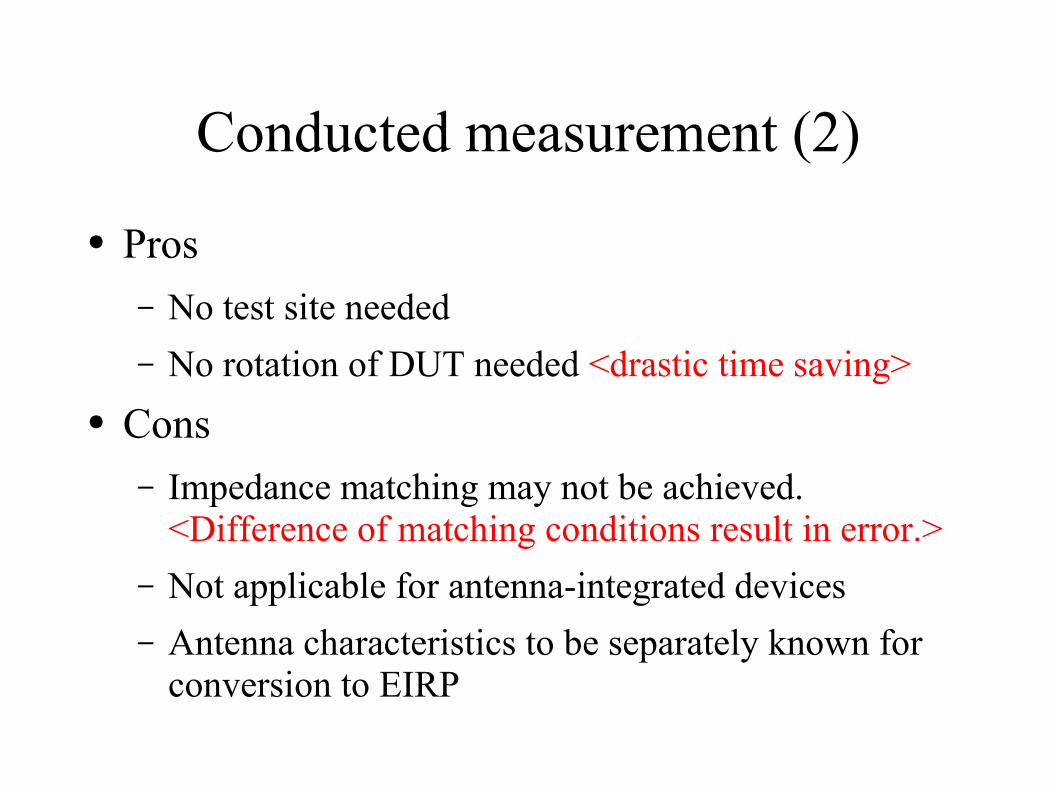
Conducted measurement (2)
● Pros– No test site needed – No rotation of DUT needed <drastic time saving>
● Cons– Impedance matching may not be achieved.
<Difference of matching conditions result in error.>– Not applicable for antenna-integrated devices– Antenna characteristics to be separately known for
conversion to EIRP

Outline
1. Background2. Impact to existing systems and regulatory issues3. Spectral emission mask4. UWB parameters5. Frequency domain vs time domain
measurements6. Measurement conditions7. Frequency domain measurements8. Time domain measurements
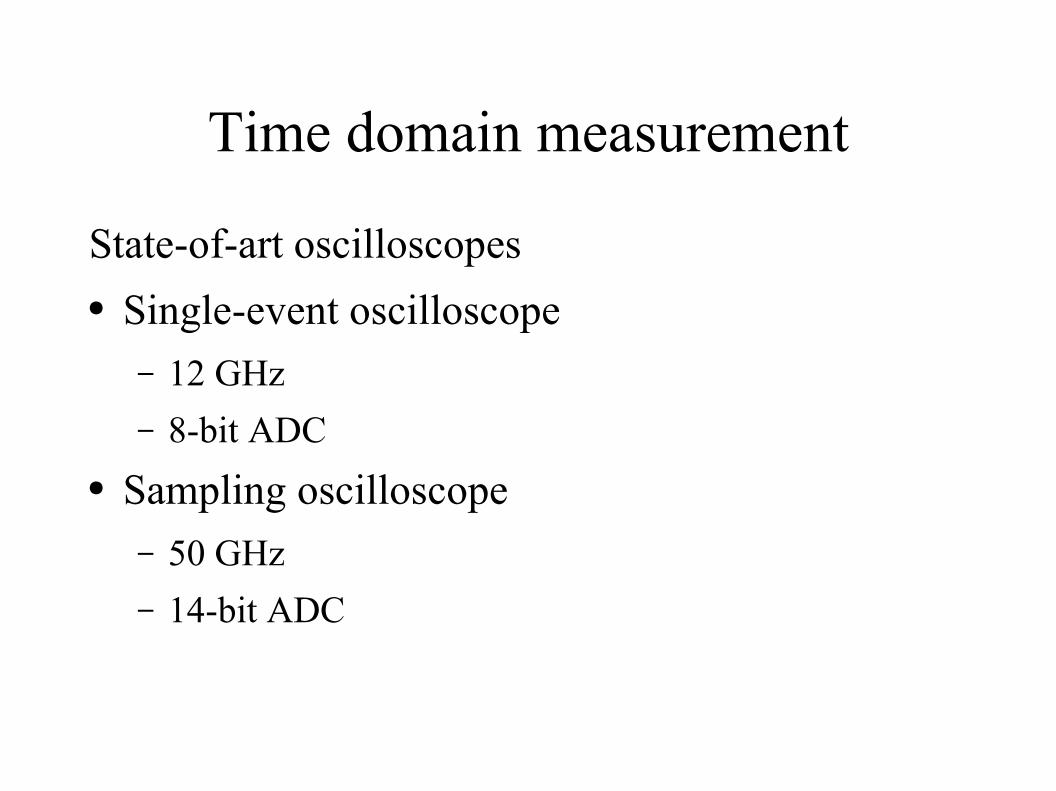
Time domain measurement
State-of-art oscilloscopes● Single-event oscilloscope
– 12 GHz– 8-bit ADC
● Sampling oscilloscope– 50 GHz– 14-bit ADC

Dynamic range of time domain measurement
● Dynamic range D dB for n bit ADC D = 20 log
10 2n
– ExampleTo measure an UWB signal with D = 60 dB,
at least 10 bits quantization is required .● Noise floor of analog front end

Jitter in sampling oscilloscope
● Sampling jitter– PDF: h(τ)
● Measured waveform
h(τ) behaves like impulse response of LPF<optimistic results>
s ' t =∫−∞
∞s t−hd

Time domain measurement
● Pros– Arbitrary processing, i.e. wideband filtering, peak
detection, CCDF, etc., is possible offline.● Cons
– Limited dynamic range<not suitable for low level mask>
good
no good

Peak power measurement in time domain (1)
Measurement system
Complex antenna factor (CAF): Conversion from antenna output voltage to incident electric field

Peak power measurement in time domain (2)
Flow of signal processing
Antennaoutput
waveform
oscilloscopeIncident
fieldwaveformCAF
50 MHzpeakPSDGauss
filter
Offline processing

Time domain measurement : example
System

Antennaoutputvoltage
Incidentelectric
field
CAF

Incidentelectric
field
Peak power for 50 MHz bandwidth is correctly obtained.
50 MHzGaussianfiltering
Filteredoutput
Peak electric field Peak e.i.r.p.

Summary
● Standard techniques of the emission measurements of the UWB devices discussed in ITU-R TG 1/8.– Draft new recommendation will be finalized in the
last meeting in Oct. 2005.● Challenges
– Measurement at very low power level– Efficient peak detection in angle, frequency, and time
domains

Status of ITU-R TG 1/8
● WG1: UWB characteristics– Still discussing about the top level definition of terms;
incompatibility with ITU-R terminology● WG2: impact to existing services
– Standoff between proponents and opponents– Large amount of data; not well organized yet
● WG3: frequency management framework– Almost completed
● WG4: measurement techniques– Almost completed
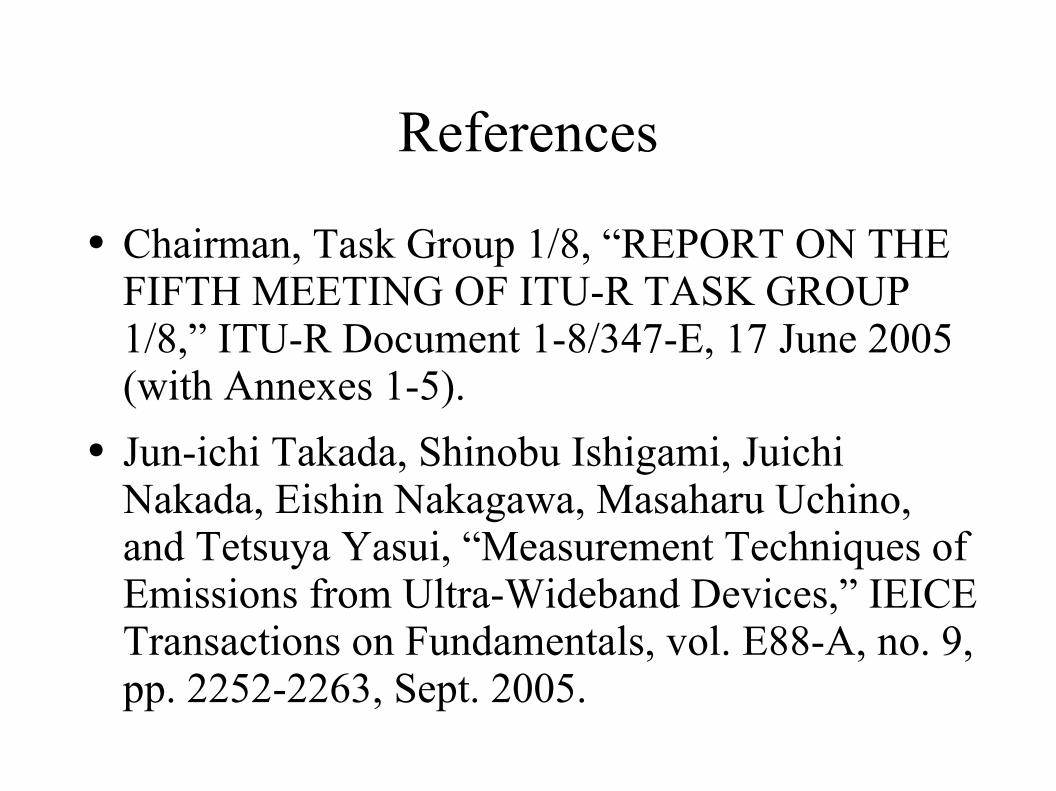
References
● Chairman, Task Group 1/8, “REPORT ON THE FIFTH MEETING OF ITU-R TASK GROUP 1/8,” ITU-R Document 1-8/347-E, 17 June 2005 (with Annexes 1-5).
● Jun-ichi Takada, Shinobu Ishigami, Juichi Nakada, Eishin Nakagawa, Masaharu Uchino, and Tetsuya Yasui, “Measurement Techniques of Emissions from Ultra-Wideband Devices,” IEICE Transactions on Fundamentals, vol. E88-A, no. 9, pp. 2252-2263, Sept. 2005.


![· arXiv:2005.05969v1 [cond-mat.stat-mech] 12 May 2020 Enskogkinetic theoryof rheology fora moderately dense inertial suspension Satoshi Takada∗ Institute of Engineering, Tokyo](https://img.dokumen.tips/doc/110x75/5f0626eb7e708231d4168d66/arxiv200505969v1-cond-matstat-mech-12-may-2020-enskogkinetic-theoryof-rheology.jpg)