Embed Size (px)
Citation preview

Ⅲ-1Accelerators and Instruments

Accelerators and Instruments
Ⅲ-1

31
Ⅲ -1. Accelerators and Instruments
Ⅲ-1
101BL7B 成影典之.docx
BL7B
Seven Years' Developments and Evaluations of Optical Components for CLASP Sounding Rocket Project at UVSOR BL7B
N. Narukage1, M. Kubo1, R. Ishikawa1, Y. Katsukawa1, S. Ishikawa1, T. Kobiki1, G. Giono1, R. Kano1, T. Bando1 and S. Tsuneta2
1National Astronomical Observatory of Japan, Mitaka 181-8588, Japan 2Institute of Space and Astronautical Science, Japan Aerospace Exploration Agency, Sagamihara 252-5210,
JAPAN
Our team consisting of Japan, US, Spain, France, and Norway developed a Chromospheric Lyman- Alpha SpectroPolarimeter (CLASP). CLASP is aimed at exploring the magnetic fields in the solar atmosphere (the upper chromosphere and transition region) via the Hanle effect in the Lyman-alpha (Lyα) line (121.6 nm) for the first time [1, 2]. This experiment requires precise spectropolarimetric observations with a polarimetric sensitivity of 3σ ~ 0.1% and a wavelength resolution of 0.01 nm.
In order to achieve the polarimetric sensitivity of 3σ ~ 0.1%, we designed a new type VUV spectropolarimeter [3] and developed its optical components (e.g., waveplate [4], polarizer, etc.) and some types of high reflectivity coatings using UVSOR BL7B. These developments and evaluations spent seven years [5].
On September 3rd 2015, CLASP was launched with a NASA sounding rocket at the White Sands Missile Range in New Mexico, United States. During five minutes observation, CLASP successfully observed linear polarizations (Stokes I, Q, U) in the solar Lyα line with a polarization accuracy of 0.1% for the first time [6, 7]. We also took 2D Lyαimages with 0.6 sec cadence.
This data is very beautiful and its quality is perfect. Now, we are analyzing the data in detail [6, 7]. This full success of the CALSP project is significantly due to the Lyαbeam of UVSOR BL7B, since its beam (that is very intense, strongly linearly polarized, very pure in wavelength, and very stable) is ideal for the evaluation of the CLASP optical components. We really acknowledge the staff of UVSOR, especially, M. Hasumoto and K. Tanaka, S. Kimura at Osaka University, and K. Fukui at Fukui University for their support of our experiment at UVSOR.
[1] R. Kano et al., SPIE 8443 (2012) 84434F. [2] K. Kobayashi et al., Proc. Fifth Hinode Science Meeting, Astronomical Society of the Pacific Conference Series 456 (2012) 233. [3] N. Narukage et al., Applied Optics 54 (2015) 2080. [4] R. Ishikawa et al., Applied Optics 52 (2013) 8205. [5] UVSOR Activity Reports from 2009 to 2014 [6] NAOJ news, 270 (2016), Issue in January 2016 http://www.nao.ac.jp/contents/naoj-news/data/nao_news_0270.pdf [7] CLASP web pages:
http://hinode.nao.ac.jp/news/CLASP_Launch/ http://hinode.nao.ac.jp/KakenS/CLASP.shtml
Fig. 1. Photo of CLASP and Japanese members of the CLASP project.
Fig. 2. Photo of the CLASP launch.
Ⅲ -1. Accelerators and Instruments
s of Optical Components for

32
Ⅲ-1
Ⅲ -1. Accelerators and Instruments011Others 中村光廣.docx
Others
Development of Large Grain Size Nuclear Emulsion A. Nishio1, M. Moto1, Y. Manabe1, K. Kuwabara1, K. Morishima1,2 and M. Nakamura1,3
1Graduate School of Science, Nagoya University, Nagoya 464-8602, Japan 2Institute for Advanced Research, Nagoya University, Nagoya 464-8601, Japan
3Ecotopia Science Institute, Nagoya Universuty, Nagoya 464-8601, Japan
Nuclear emulsion is a kind of photographic film and has sensitivity for ionizing radiation. The film record tracks of charged particle with angular accuracy under several mrad.
Nuclear emulsion is made by coating emulsion gel on plastic base. In Nagoya University, started a emulsion gel production machine in 2010. It was enable us to develop new-type emulsion gel by ourself. Emulsion gel is mainly consisted by silver bromide crystal and gelatin. We report about properties of large grain size nuclear emulsion developed in Nagoya University.
We made emulsion gels which have silver bromide crystal with diameter about 200, 300, 600 nm. The traditional crystal size (incl. OPERA FILM [1]) is 200 nm. Figure 1 shows electron microscopic view of silver bromide crystals (left below : OPERA FILM ~200 nm, center : Large grain size nuclear emulsion ~600 nm ). Emulsion gel of each crystal size ware chemically sensitized in an optimal way [2]. Nuclear emulsion films ware prepared using these gel. Emulsion films ware exposed electron beam at UVSOR which has equivalent energy with minimum ionizing particle. We did chemical development in Nagoya University after exposure.
After development, electron tracks were visible with a light microscope (Fig. 2). We measured Grain Density, counts of silver grains per 100 μm. And we defined Crystal Sensitivity as ratio of Grain Density divided by Number of penetrated crystals. We show a table of them in each crystal size (Fig. 3).
Figure 2 shows the larger the diameter of the silver bromide crystal, it also increases the size of the developed silver grains. And Fig. 3 shows the larger the diameter of the silver bromide crystal, the crystal sensitivity was high. Crystal sensitivity was 44% at ~600 nm crystal nuclear emulsion.
Large grain size nuclear emulsion opens up a new vision of wide-field automatic nuclear emulsion scanning by low magnification optical systems. And it has possibilities to improve latent image fading. Also this result of latent image formation in large crystals is efficient performance suggest its potential.
Fig. 1. Electron microscopic view of silver bromide crystal (left below : OPERA FILM ~200nm, center : Large grain size nuclear emulsion ~600nm ).
Fig. 2. Light microscopic view of electron tracks.
Fig. 3. Basic properties of nuclear emulsion in each crystal size. [1] T. Nakamura et al., Nucl. Instrum. Meth. A556 (2006) 80. [2] M. Moto et al., 2nd Fall meeting of Federation of Imaging Societies. (2015) 29.

33
Ⅲ-1
Ⅲ -1. Accelerators and Instruments021Accelerators,BL1U 全炳俊.docx
Accelerators, BL1U
Transmission Nuclear Resonance Fluorescence Measurement of 208Pb in Natural Lead Target with Laser-Compton-Scattering Gamma-Ray at BL1U
H. Zen1, Y. Taira2, J. Yamazaki3, T. Hayakawa4, T. Shizuma4, T. Kii1, H. Toyokawa2, M. Katoh3,5 and H. Ohgaki1
1Intitute of Advanced Energy, Kyoto University, Uji 611-0011, Japan 2National Institute of Advanced Industrial Science and Technology (AIST), Tsukuba 305-8568, Japan
3UVSOR Facility, Institute for Molecular Science, Okazaki 444-8585, Japan 4Japan Atomic Energy Agency, Tokai-mura 319-1184, Japan
5School of Physical Sciences, The Graduate University for Advanced Studies (SOKENDAI), Okazaki 444-8585, Japan
High intensity and quasi-monochromatic gamma- rays has been generated by laser Compton scattering between the high energy electron beams and intense laser beams at BL1U in UVSOR-III. Gamma-ray beam with the maximum energy of 5.4 MeV and the total flux of 1×10⁷ photons/sec can be generated by use of 1.94-μm 5-W fiber laser and 300-mA 746-MeV electron beams. In this fiscal year, we tested the transmission Nuclear Resonance Fluorescence (NRF) measurement [1] of 208Pb in a natural lead target.
The schematic diagram of the transmission NRF measurement and the energy spectra of incident gamma-ray beams, transmitted gamma-ray beams, and NRF from the witness foil (a natural lead) are shown in Fig. 1. The gamma-ray with energy of a NRF level of 5.291 MeV resonantly absorbed by 208Pb in the first target (a natural lead) and transmitted gamma-ray spectrum will be the notch spectrum as shown Fig. 1. The transmitted gamma-rays will hit the second target, called as the witness foil, which emits NRF gamma-rays. Therefore we can measure the nuclear resonance absorption in the first target as the reduction rate of the NRF peak by using a High Purity Germanium (HPGe) detector.
In this experiment we measured the NRF yield from the witness foil as the function of thickness of the first target. Since the NRF gamma-ray yield from witness foil depends both on the amount of the resonant (nuclear) absorption and on the atomic absorption of the first target, we need to measure the atomic absorption of the first target and corrected the NRF yield. Figure 2 shows the measured result. The NRF yield clearly shows linearity to the thickness of the first target as we have expected for thin target measurements. The required integration time of NRF events in case of a 6-mm target was around 2 hours in this experiment.
[1] B. J. Quiter, B. A. Ludewigt, V. V. Mozin and S. J. Tobin, 50th Annual Meeting of the Institute of Nuclear Materials Management 1 (2009) 786.
Fig. 1. Schematic diagram of NRF transmission measurement and energy spectrums of incident gamma-ray beam, transmitted gamma-ray beam through the target and NRF from the witness foil.
Fig. 2. Measured dependence of the NRF yield from the witness foil on the thickness of the first target.

34
Ⅲ-1
Ⅲ -1. Accelerators and Instruments031BL1B 木村真一.docx
BL1B
Improvement of Accuracy of Reflectivity Spectrum in the THz Region S. Kimura
Graduate School of Frontier Biosciences, Osaka University, Suita 657-0871, Japan
Strongly correlated electron systems have a characteristic electronic structure near the Fermi level (EF) owing to the strong electron correlation, and the electronic structure is the origins of unusual physical properties such as unconventional superconductors, heavy fermions and so on. To observe the electronic structure is important to clarify the effect of the electron correlation.
On of the methods to detect the electronic structure very near EF is reflectivity (optical conductivity) measurement in the terahertz (THz) region [1]. The method is bulk sensitive compared with photoemission spectroscopies that are widely used recently. Since results of a THz spectroscopy can be regarded as from bulk properties, they can be directly compared with thermodynamic physical properties. However, since reflectivity of such metallic materials in the THz region is almost unity, so a tiny change, typically less than 1%, and the absolute value of the reflectivity must be measured [2]. To perform such accurate measurement of reflectivity spectra, we need intense and stable THz light such as synchrotron radiation. Then we are developing high accurate THz reflectivity measurement system at BL1B of UVSOR-III. The block diagram of the measurement is shown in Fig. 1.
At UVSOR-III, a top-up operation at one-minute intervals is now adopted, but the beam current is reduced slightly during the interval. To eliminate the effect of the beam current reduction, we introduced a digital divider (made by Equipment Development Center of IMS) in which the output signal from a detector (a Si bolometer) is instantly normalized by the beam current of SR. In addition, to eliminate the signal during the top-up injection, we get the top-up signal from the accelerator by an personal computer (PC) and put a TTL signal to the data accumulator. During the top-up injection (the TTL signal is on), the data accumulator rejects the signal from the detector. Finally, the data accumulator gives an interferogram (detector intensity vs mirror position of the moving mirror in the FTIR) to the PC.
The effect of the top-up rejection as a 100% line, which is the first spectrum divided by the second one with a same condition, is shown in Fig. 2. Both lines are used the digital divider. Without the top-up rejection, the 100% line is 0.9950.003, but it becomes 1.0000.002 with the top-up rejection in the wavenumber region of 20–100 cm-1. Therefore, the top-up rejection is effective to determine the accuracy of reflectivity spectra in the THz region.
The PC also operates a temperature controller of
samples. For the measurement of temperature- dependent reflectivity spectra, we introduced a specially designed feedback positioning system [3] to maintain the overall uncertainty level less than 0.5% at sample temperatures in the range of 4–300 K at BL1B. By the preparation, highly accurate reflectivity measurements in the THz region can be performed.
Fig. 1. Block diagram of the measurement system with the rejection during top-up injections and the normalization by the beam current.
Fig. 2. 100% lines with and without top-up rejection. [1] S. Kimura and H. Okamura, J. Phys. Soc. Jpn. 82 (2013) 021004. [2] S. Kimura, J. Sichelschmidt, J. Ferstl, C. Krellner, C. Geibel and F. Steglich, Phys. Rev. B 74 (2006) 132408. [3] S. Kimura, JASCO Report 50 (2008) 6. [in Japanese]
35
Ⅲ-1
Ⅲ -1. Accelerators and Instruments041BL2B 解良聡.docx
BL2B
Reconstruction of the Beamline BL2B for Photoelectron Spectroscopy of Organic Materials
K. R. Koswattage1, T. Ueba2, Y. Nakayama3, K. K. Okudaira4 H. Ishii1,4 and S. Kera2,4 1 Center for Frontier Science, Chiba University, Chiba 263–8522, Japan
2 Institute for Molecular Science, Okazaki 444–8585, Japan 3 Department of Pure and Applied Chemistry, Faculty of Science and Technology, Tokyo University of
Science, Noda 278–8510, Japan 4Graduate School of Advanced Integration Science, Chiba University, Chiba 263–8522, Japan
The reconstructed beamline 2B is dedicated to
photoelectron emission experiments to investigate electronic structures of surfaces and interfaces of wide range of molecular materials. Here we summarize the three-year program of the beamline reconstruction.
The beamline is equipped with a spherical grating dragon type monochromator. The monochromator covers the photon energy range from 23 to 205 eV with resolving power of 2000 – 8000 range [1-2].
In the reconstruction process, we have solved a malfunction in the monochromator, introduced a UHV chamber (monitoring and filtering the photons) downstream of the M4 mirror chamber, built a new interlock system, and placed a new end-station where a load-lock and two sample preparation chambers are connected. At the deposition chamber, samples can be heated by a radiation heating. By the load-lock and sample transfer systems, samples can be introduced to the preparation chamber without breaking UHV. Three evaporators can be equipped from the downstream. Another chamber so called cleaning chamber is equipped with surface preparation apparatus such as IR heater, sputter gun, and LEED system. At the measurement chamber, VG-Scienta R3000 angle-resolved photoemission spectrometer is installed. The sample is mounted in the sample holder on cryogenic manipulator with manually operated 5-axis motion in this chamber and the sample can be cooled down to around 15 K. The sample temperature is controlled by a combination of liquid He cooling and a resistive heater.
After the alignment, beam spot size is roughly estimated to be about 1.5 mm × 0.8 mm (vertical × horizontal) after the final refocusing mirror for exist slit of 300 μm. Also, the photon flux for an exit slit width of 300 μm are estimated to be 1× 10¹⁰ – 3× 10¹⁰, 4× 10¹⁰ – 2× 10¹¹, and 1× 10¹⁰ – 2× 10¹⁰ photons/s for G1 (80 – 150 eV), G2 (50– 120 eV) and G3 (25 – 55 eV) gratings, respectively using a silicon photodiode and Au mesh in the monitoring chamber.
A filter (Al20nm/Mg300nm/Al20nm-Ni70nm mesh, LUXEL) in the monitoring chamber is equipped in order to reduce second order light. It is estimated that the second order light contribution can be reduced to 2.4% from 10% at photon energy 28 eV by inserting the filter. Also, the photon energy accuracy can be checked by using the first and second
order light and it is estimated to be a difference of -0.04 eV at photon energy 28 eV.
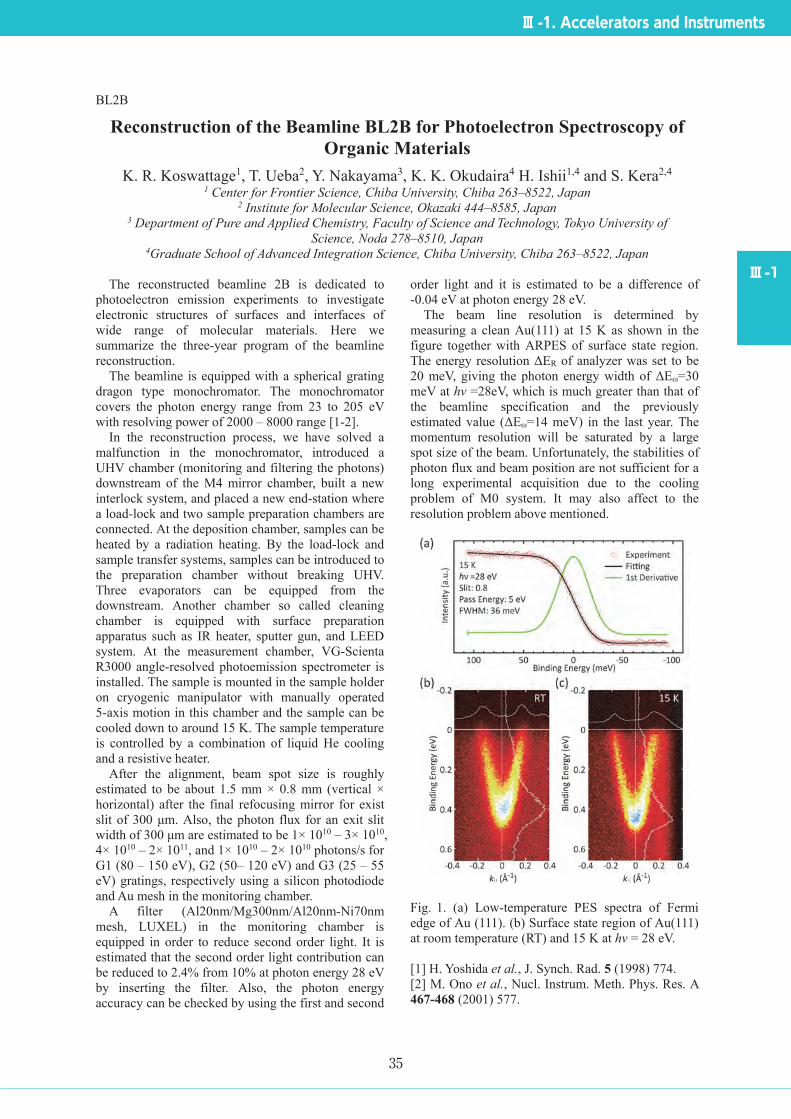
The beam line resolution is determined by measuring a clean Au(111) at 15 K as shown in the figure together with ARPES of surface state region. The energy resolution ΔER of analyzer was set to be 20 meV, giving the photon energy width of ΔEω=30 meV at hv =28eV, which is much greater than that of the beamline specification and the previously estimated value (ΔEω=14 meV) in the last year. The momentum resolution will be saturated by a large spot size of the beam. Unfortunately, the stabilities of photon flux and beam position are not sufficient for a long experimental acquisition due to the cooling problem of M0 system. It may also affect to the resolution problem above mentioned.
Fig. 1. (a) Low-temperature PES spectra of Fermi edge of Au (111). (b) Surface state region of Au(111) at room temperature (RT) and 15 K at hν = 28 eV. [1] H. Yoshida et al., J. Synch. Rad. 5 (1998) 774. [2] M. Ono et al., Nucl. Instrum. Meth. Phys. Res. A 467-468 (2001) 577.

36
Ⅲ-1
Ⅲ -1. Accelerators and Instruments051BL5B 豊田光紀.docx
BL5B
EUV Multilayer Mirrors for Focusing Isolated Attosecond Pulse in 40 nm Wavelength Region
M. Toyoda1, Y. Tamaru2,3, S. Mori1, K. Sawada2,4, Y. Fu2, E. J. Takahashi2, A. Suda3, F. Kannari4, K. Midorikawa2 and M. Yanagihara1
1Center for Advanced Microscopy and Spectroscopy, IMRAM, Tohoku Univ., Sendai 980-8577, Japan 2RIKEN Center for Advanced Photonics, 2-1 Hirosawa, Wako 351-0198, Japan
3Tokyo University of Science, Noda 278-8510, Japan 4Keio University, Yokohama 233-8522, Japan.
In the past decade, coherent light sources based on higher-order harmonics generation in extreme ultraviolet (EUV) region have been investigated. Recently, Takahashi et al. has reported isolated attosecond pulse (IAP) generation in a 40 nm wavelength region, where an isolated intense pulse with pulse energy of a few μJ was demonstrated by applying the novel two-color excitation technique [1]. When such the intense EUV pulse is focused with diffraction limited objective so as to produce a small focal spot with size of a few handled nanometers, we can generate extremely intense light fields with the maximum intensity of over 1016 W/cm2, which enables us to access the new frontier of nonlinear optics in EUV region.
For the diffraction-limited focusing of the IAP, we are developing the Schwarzschild objective made of two-curved multilayer mirrors [2]. The objective has two practical advantages, i.e., high spatial resolution resulting from large-numerical aperture optical design, and spectral selectivity based on the Bragg reflection on multilayer mirrors. To realize the intense light fields with the objective, firstly, we need multilayer mirrors with practical high reflectivity. In this report, we describe design, fabrication, and test of multilayer mirrors that is suitable for the focusing application in the 40 nm wavelength region.
Design of the multilayer mirrors are summarized in Table 1. After applying the selection rule for high reflectivity, which has been given by Yamamoto, [3] three material pairs, i.e., SiC/Mg, Cr/Mg, and Sc/Si, were chosen. The multilayer coating was consisted of 20 bi-layers. The period, ddesign, and thickness ratio, Γ, were numerically optimized with the multilayer modeling software, IMD, [4] to give the maximum reflectivity at a wavelength of 40 nm. Then, the three multilayer coatings were deposited on a Si wafer by using the magnetron sputtering apparatus (SPL-500, Canon Anelva Corp.). We also experimentally confirmed a period of the multilayer coating with small-angle X-ray diffraction (RGXR, Rigaku Corp.). As shown in Table 1, the actual period of the sample, dactual, was preciously controlled within 1% of the design value.
At-wavelength reflectivity was examined with the EUV reflectometer equipped on beamline BL5B of UVSOR. A 300-nm thick Mg filter placed upstream
of the reflectometer removes higher-order lights from the monochrometer. Figure 1 shows the measured reflectivity, as a function of a wavelength. The peak reflectivity, Rpeak, and band width, ΔλHWHM, are also tabulated on Tab. 1. We observed relativity high reflectivity between 30 to 40% on the Mg-based multilayer mirrors. Especially in SiC/Mg multilayer mirror, practical high reflectivity and wide band width were confirmed simultaneously, where we can expect the maximum intensity of over 1016 W/cm2 with pulse duration below 800 attosecond on the focus of the two-mirror objective.
[1] E. J. Takahashi et al., Nat. Commun. 4 (2013) 2691. [2] M. Toyoda et al., Appl. Phys. Exp. 5 (2012) 112501. [3] M. Yamamoto and T. Namioka, Appl. Opt. 31 (1992) 1622. [4] D. L. Windt, Computers in Physics, 12 (1998) 360.
Table 1. Design parameters for the multilayer mirrors. SiC/Mg Cr/Mg Sc/Si ddesign (nm) 21.2 21.2 21.0 Γ 0.25 0.23 0.33 dactual (nm) 21.0 21.4 20.9 Rpeak (%) 38.3 28.7 23.3 ΔλHWHM (nm) 2.8 3.0 4.9
Fig. 1. EUV reflectivity spectra of the mirrors. Data were measured with an incident angle of 11 deg.

37
Ⅲ-1
Ⅲ -1. Accelerators and Instruments061BL5B 吉川一朗.docx
BL5B
Reflectance Measurement of Mo/Si Multilayer Coated Mirror by Using Pure-Calibrated EUV Beam
M. Kuwabara1, F. Suzuki2, R. Hikida2 and I. Yoshikawa1 1Department of Complexity Science and Engineering, Graduate School of Frontier Sciences, The University of
Tokyo, Chiba 277-8561, Japan 2Department of Earth and Planetary Science, Graduate School of Science, The University of Tokyo, Tokyo
113-0033, Japan
We are developing space-based imagers for plasma emissions from the plasmasphere. The main target of our instruments is He ion in the plasmasphere. He ion resonantly scatters solar He II (30.4 nm) radiation. He column densities along the field of view of instruments can be obtained because intensities of emissions are proportional to them under the assumption that observational regions are optically thin. Therefore, the accuracies of the efficiencies of the optics systems of instruments are critical for estimation of the densities and to achieve the scientific goals of our missions.
In space and planetary science, a number of imaging and spectroscopic observations in the spectral range of extreme ultraviolet have been and will be performed. High-reflectivity multilayer coatings for the He II radiation have been required and developed for some of these applications. A multilayer coated mirror of Mo/Si has been usually and conventionally used in the He II emission line, because it is highly stable [1].
In this experiment, we measure the reflectance of Mo/Si multilayer mirror at the wavelength of 30.4 nm. We install an Al/Mg/Al filter and an Sn filter at the entrance of the SOR beam in order to achieve the pure 30.4 nm light [2-4].
With the pure 30.4 nm line, we measure the reflectance of the multilayer coated mirror at various incident angles by using the photo diode.
The result is shown in Fig. 1 and the reflectances of Mo/Si multilayer mirror are 13, 9, 6, 4, and 3% at incident angles of 10, 15, 20, 25, and 30 degrees, respectively. Note that the statistical error bars of reflectivity measurement are over-plotted, but they are so small (approximately 1%) that you might not identify them.
For the next step, in addition to the 30.4 nm line, we plan to measure the reflectance at 83.4 nm line. O ions have emission line at 83.4 nm and are known as one of the main components in the plasmasphere.
Fig. 1. Reflectance of the Mo/Si multilayer coated mirror at the wavelength of 30.4 nm. [1] Yoshikawa et al., Earth Planets Space 60 (2008) 407. [2] Ogawa et al., UVSOR Activity Report 36 (2008) 127. [3] Murakami et al., UVSOR Activity Report 37 (2009) 47. [4] Sakai et al., UVSOR Activity Report 38 (2010) 45.

38
Ⅲ-1
Ⅲ -1. Accelerators and Instruments071BL6B 手島史綱.docx
BL6B
An Investigation into the Cause of Instability at BL6B T. Iizuka1, F. Teshima2, E. Nakamura2, H. Zen3 and K. Tanaka2, 4
1Toyota Technological Institute, Nagoya 468-8511, Japan 2UVSOR Facility, Institute for Molecular Science, Okazaki 444-8585, Japan
3Institute of Advanced Energy, Kyoto University, Uji 611-0011, Japan 4School of Physical Sciences, The Graduate University for Advanced Studies (SOKENDAI), Okazaki 444-8585,
Japan
Beamline 6B (BL6B) is an Infrared-THz beamline which has confocal type micro-spectroscope station, reflection/transmission station and IR microscope imaging station. This beamline can provide measurement-techniques which are not available in conventional IR sources, utilizing the characteristics of synchrotron radiation (SR) such as high brilliance, polarization, or broad spectrum.
Spectroscopy in THz-IR region is performed with FT/IR: Michelson-type Interferometer which requires stable right source. However, the top-up operation of UVSOR induces two type of instability: short term blinking coincides with electron beam injection on every minutes, and long term attenuation of power.
The former causes spike noise on interferogram, and it can be solved by excluding those scan data during the beam injection, by synchronizing data collection of FT/IR. The latter one might originate from the drifting of the focal point of M0 mirror, first mirror of BL6B. And a qualitative observation was required to eradicate the drifting instability which influence on S/N ratio.
Because the drift continues for about 10 hours after the first injection, the most suspected origin is temperature change caused by heat from synchrotron radiation. Addition to this, M0 mirror of BL6B and vacuum chamber has no cooling system to avoid vibration comes from coolant flow. Therefore, thermal expansion of M0 mirror holder or vacuum chamber might cause the drift of the focal point. It can be simply estimated by observing a He-Ne visible laser spot reflected from M0 mirror. In this study, we monitored the position of the laser spot to clarify the origin of the instability at BL6B.
The change of spot position was observed by interval photographing by a web camera. Each laser spot positions were then estimated by handmade LabVIEW program by following procedure. First, color pictures were converted to grayscale, and region of interests (ROI) was segmented around the laser spot, to get two-dimensional distribution. After substituting the background data, i.e. picture without laser spot, one-dimensional profile were obtained to estimate the center of laser spot in X and Y directions. After that, base line was subtracted and peak position were estimated with following formula,
xfxfxCenter , where f(x) is the light intensity at pixel position of x.
It is applicable not only to laser spot but also the focal point of M0 mirror which is not circular shape.
Figure 1 shows the change of laser spot position from M0 mirror during a week. It can be seen the oscillation of mirror angle which moves one direction during top-up operation and saturate, then moves to the other direction during shutdown. The displacement of laser light saturated about 9 hours later after the start of top-up operation, and it is consistent with previously observed long term drift of SR power at the end station. The comparison of the changes of mirror direction (laser spot) and SR focal spot is shown in Fig. 2. Two results show pretty close correlation, and one can thus conclude that the spot drift originate from mirror direction. From another point of view, it is available to stabilize the SR focal spot position by a feedback control with M0 mirror direction which can be obtained from laser spot position, and is able to perform simultaneously with user experiments at the end station.
Fig 1. One week observation result of laser spot position reflected from M0 mirror. X, Y is horizontal, perpendicular change to the ground, respectively. Green areas indicate the operation time of UVSOR.
Fig. 2. Comparison of reflected laser spot (gray) and focal point of SR light (color).

39
081BL7B 木村真一.docx
BL7B
Performance Evaluation of Spectrometer for High-Resolution Vacuum Ultraviolet Inverse Photoemission Spectroscopy
Y. Ohta1, A. Yoshizumi1, Y. Ohtsubo1,2 and S. Kimura1,2 1 Graduate School of Science, Osaka University, Suita 565-0043, Japan
2 Graduate School of Frontier Biosciences, Osaka University, Toyonaka 565-0871, Japan
Photoemission spectroscopy (PES), which is a
photon-in/electron-out process, is one of experimental tools to detect electronic structure of materials. Since the energy resolution of PES has become better than several meV nominally, the method is usually used for the determination of precise electronic structure as well as orbital-selective interactions. Even though PES is widely used at present, it has a serious shortcoming to be unable to detect unoccupied electronic structure. In contrast to PES, inverse photoemission spectroscopy (IPES), which is an electron-in/photon-out process, is a method to determine unoccupied electronic structure [1]. Accordingly, although the method has been used for a long time, the energy resolution is not good compared to that of PES. The best energy resolution of IPES as far as we know is 190 meV [2]. The combination of IPES to PES provides the perfect information of electronic structure of materials. However, spectra of IPES cannot be directly compared with those of PES because of poor energy resolution of IPES.
To perform IPES experiment with good energy resolution, for instance better than 100 meV, both the electron source and the photon detector should be improved. Since the quantum efficiency of the IPES process is about five orders of magnitude smaller than that of the PES process [3], the throughput of the IPES system should be improved. Then, we are now developing a new IPES system using a high brilliant photo-cathode electron source based on a strained GaAs-GaAsP superlattice [4] and a VUV spectrometer using a Seya-Namioka-type monochromator (focal length: 20 cm, grating: laminar-type, 2400 L/mm) combined with an X-ray CCD detector (1024x256 pixels). Here, we report the energy resolution and throughput of the VUV spectrometer.
To check the performance of the VUV spectrometer, we set the spectrometer at the end of the sample chamber of BL7B. The entrance slit of the monochromator is located at the off-focus position of the beamline to reduce the intensity of SR. The center wavelength of spectrometer was set at eleven wavelengths of 40 120 nm and monochromarized lights from the beamline with the wavelengths of 30 120 nm were introduced to the spectrometer. The intensity images on the CCD detector were accumulated. The CCD images content the correspondence between wavelengths and CCD pixel numbers and the efficiency, which is the intensity normalized by incident photons, and wavelength
resolutions at a center wavelength of the spectrometer. As a result, we obtained a linear relation between
wavelength and pixel number of the CCD detector at all center wavelengths. The obtained wavelength resolutions and efficiency (intensity normalized by incident photon flux) as functions of incident wavelength and center wavelength of the spectrometer are shown in Fig. 1. From this data, we could know that the area of the incident wavelength of 40 70 nm and the center wavelength of 50 60 nm has both good efficiency and good resolution.
From the data and considered the monochromator and spectrometer slit size, the best resolution of the spectrometer can be evaluated as 0.1 nm at 50 nm wavelength (hν ~ 25 eV). This wavelength resolution corresponds to the energy resolution of about 50 meV. Since our electron source is expected to have the energy resolution of about 50 meV [5], the total energy resolution of the IPES system is expected as 71 meV ideally. This value is better than our target energy resolution of the IPES system.
Fig. 1. Obtained wavelength resolution (a) and efficiency (b) as functions of incident and spectrometer wavelengths of the newly developed VUV spectrometer for the IPES system. [1] P. D. Johnson and S. L. Hulbert, Rev. Sci. Instrum.
61 (1990) 2277. [2] M. Budke and V. Renken, Rev. Sci. Instrum. 78
(2007) 083903. [3] J. B. Pendry, Phys. Rev. Lett. 45 (1980) 1356. [4] N. Yamamoto et al., J. Appl. Phys. 102 (2007)
024904 . [5] S. Pastuszka, M. Hoppe, D. Kratzmann, D.
Schwalm and A. Wolf., J. Appl. Phys. 11 (2000) 88.
Ⅲ-1
Ⅲ -1. Accelerators and Instruments

40
Ⅲ-1
Ⅲ -1. Accelerators and Instruments091BL7B 成影典之.docx
BL7B
Development of Reflective and Transimissive Polarizers in 280 nm R. Ishikawa1, N. Narukage1, N. Yoshida2, S. Ishikawa3 and M. Kubo1
1National Astronomical Observatory of Japan, Mitaka 181-8588, Japan 2School of Physical Sciences, The Graduate University for Advanced Studies (SOKENDAI), Mitaka 181-8588,
Japan 3Institute of Space and Astronautical Science, Japan Aerospace Exploration Agency, Sagamihara 252-5210,
Japan
Spectro-polarimetry in the ultra violet (UV) range is a new astrophysical diagnostic tool to explore the magnetic field of the hot plasma of >104 K. Following the success of CLASP [1], a team of researchers from Japan, the USA, and Europa plans to propose the second flight of CLASP (CLASP2: Chromospheric LAyer Spectro-Polarimeter 2) to perform the spectro-polarimetry in the MgII lines around 280 nm at the high polarization sensitivity of <0.1%. In order to meet this stringent requirement on the polarization sensitivity, the high throughput of >50% and the high extinction ratio of >100 around 280 nm are required for new polarization analyzers.
For this purpose, we have fabricated and tested the two different types of polarizers. The first one is the reflective type; applied multi-layer coating of MgF2 and Al2O3 over BK7 substrates. This is the high-efficiency reflective polarizer based on the same design concept as what was used for the CLASP1 instrument although the materials are different [2]. Another one is the transmissive type; wire-grid type linear polarizers that were printed using atomic layer deposition technology on 1 mm thick fused silica (SiO2) substrates [3]. In order to evaluate the performance of the polarizers, 100% linearly polarized beam is required. Thus, we placed the beam cleaner, which is the SiO2 substrate mounted at the Brewster’s angle to eliminate the p-polarized beam, at the upstream of our measurement system.
Two panels in Fig. 1 are the measured reflectivity of 2 samples of the reflective polarizer for s- and p-polarized beams (Rs & Rp) as a function of angle of incidence (AOI) at 280 nm. It is found that the reflective type has the performance of Rs= 65% and Rp=0.27% at the Brewster’s angle of 68 degree, resulting in the extinction ratio of Rs/Rp = 240. The extinction ratio T1/T2 of the transmissive polarizer was measured to be >300 around 280 nm, where T1 is the transmissivity parallel to the grid and T2 is the one perpendicular to the grid. Note that the fluctuation over the wavelength is caused by the dark current fluctuations indicating the detection limit. The transmissivity T1 was measured to be ~70%.
Based on these measurements, we conclude that we have successfully developed the high performance reflective and transmissive polarizers. According to the final decision on the optical design of CLASP2 instrument, one of these polarizers will be applied as
the flight polarization analyzer.
Fig. 1. Measured reflectivity of two reflective polarizer samples for s- and p- polarization.
278.0 278.5 279.0 279.5 280.0 280.5 281.0 281.5wavelength [nm]
100
200
300
400
500
extin
ctio
n ra
tio
Fig. 2. Measured extinction ratio of two transmissive polarizer samples (red and blue). [1] R. Kano et al., in preparation. [2] N. Narukage et al., UVSOR Activity Report 40 (2012) 47. [3] T. Berger et al., Proc. of SPIE, 8486 (2012) 8486G-1.

41
Ⅲ-1
Ⅲ -1. Accelerators and Instruments111BL7B 福井一俊.docx
BL7B
Stokes Parameters Measurements for BL7B Beamline M. Miyashita1, Y. Kubo1, Y. Nasu1, Y. Fujii1, K. Fukui1,
K. Yamamoto2, T. Saito3 and T. Horigome4 1Department of Electrical and Electronics Engineering, University of Fukui, Fukui 910-8507, Japan
2Far-infrared region Development Research Center, University of Fukui, Fukui 910-8507, Japan 3Department of Environment and Energy, Tohoku Institute of Technology, Sendai 982-8577, Japan
4UVSOR Facility, Institute for Molecular Science, Okazaki 444-8585, Japan
Ellipsometers are known as powerful tools to
determine optical constants of materials. However, due to the fact that all the solid materials cannot have transparency in the vacuum ultraviolet (VUV) region, an ellipsometer in VUV region must consist of both reflection type polarizer and analyzer in vacuum. Since these requirements make it difficult to construct the VUV ellipsometer, there is only one beamline (at BESSY) equipped with VUV spectroscopic ellipsometer (SE) [1] in the world to our knowledge. The other idea for VUV SE was proposed by Saito et al. which used both Synchrotron radiation (SR) and oblique incidence detector [2]. Compared with standard ellipsometers, this type SE has an advantage of obtaining not only optical constants of the sample, but also Stokes parameters (S1/S0, S2/S0, S3/ S0) of the incident beam. In this report, we show Stokes parameters of the monochromatized output radiation of BL7B beamline (3 m McPherson type normal incidence monochromator beamline).
Our VUV SE is an improved SE which was designed and constructed by an AIST group [2], and is optimized for the use at BL7B. Figure 1 shows schematic drawing of VUV SE. A sample chamber and an oblique incident photodiode are rotated independently along the incident light axis (α and β rotations) instead of the rotation of a polarizer and an analyzer, respectively. This system is mounted on the
computer controlled parallel link mechanism base [3]. Measurements are carried out by rotating α with fixed β at characteristic angles (0, 45 and 90). Since the α dependence of the photodiode intensity S0’ at each three β angles is simply expressed by using M(Ψ, Δ), Ma(Ψa,Δ a) and S(S0, S1, S2, S3) where M and Ma are Mueller matrixes of a sample and a photodiode, and S is a Stokes vector of the incident light, seven parameters Ψ, Δ, Ψa, S1/S0, S2/S0, S3/S0 are obtained analyticaly. An Au mirror is used as the sample.
Figures 2 shows Stokes parameters of BL7B monochromatized output radiation as a function of photon energy. BL7B has three gratings G1, G2 (Au coatings) and G3 (Al coating), and lower energy pass filters (quartz and Pyrex glass) are used in the G3 region. As expected, while both S2/S0 and S3/S0 maintain small values S1/S0 have large values over almost the entire energy region surveyed. The S1/S0 values around the G3 region are in good agreement with the results using a polarization plate (purple line).
Fig. 1. Schematic drawing of VUV ellipsometer.
Fig. 2. Stokes parameters of the BL7B
[1] T. Saito, M. Yuri and H. Onuki, Rev. Sci. Instrum. 66 (1995) 1570. [2] W. Budde and R. Dittmann, PTB-Mitt. 83 (1973) 1. [3] Y. Kubo, K. Fukui, K. Yamamoto, T. Saito and T. Horigome, UVSOR Activity Reports 41 (2014) 43.

2


![arXiv:1905.13173v2 [q-bio.NC] 2 Aug 2019 · National Institute of Information and Communications Technology (NICT), Suita, Osaka 565-0871, Japan 4School of Psychological Sciences](https://img.dokumen.tips/doc/110x75/5f91aacf9e0ea06b960009c7/arxiv190513173v2-q-bionc-2-aug-2019-national-institute-of-information-and-communications.jpg)